Grad-CAM
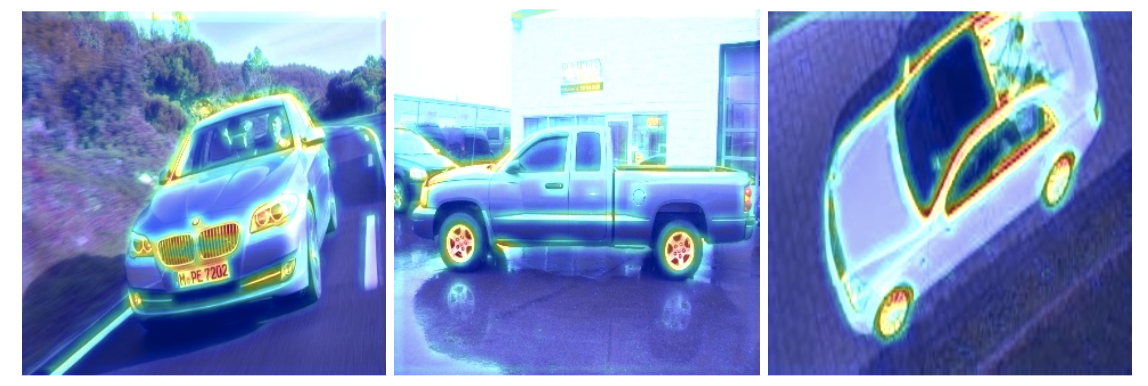
Grad-CAM (Gradient-weighted Class Activation Mapping) is a technique that helps interpret the predictions of a convolutional neural network (CNN) by visualizing the regions of the input image that most influenced the model’s decision. This is achieved by:- Computing gradients of the target output with respect to the feature maps of the last convolutional layer.
- Weighting the feature maps by the importance of these gradients.
- Generating a heatmap that highlights the areas of interest.
- Classification Models: Highlights areas contributing to the predicted class.
- Visual Regression Models: Highlights areas contributing to the numerical regression output.
Google Colab
To test the functionality without setting up locally, use this Google Colab. It comes pre-configured to run in a browser with no local setup required.What does this code do?
-
Dataset export:
- Exports the test dataset from an Edge Impulse project.
- Automatically retries until the dataset is ready for download.
-
Model download:
- Retrieves the trained model (
.h5format) for your Edge Impulse project. - Ensures compatibility with models containing 2D convolutional layers.
- Retrieves the trained model (
-
Grad-CAM visualization:
- Applies the Grad-CAM technique to visualize the regions of the input image that contributed most to the model’s predictions.
- Works for:
- Classification models: Highlights regions associated with the predicted class.
- Regression models: Highlights regions contributing to the predicted regression value.
-
Output generation:
- Saves Grad-CAM heatmaps overlaid on the original images.
- Separates correctly predicted and incorrectly predicted samples into separate directories for easy analysis.
Custom deployment block
Clone this repository: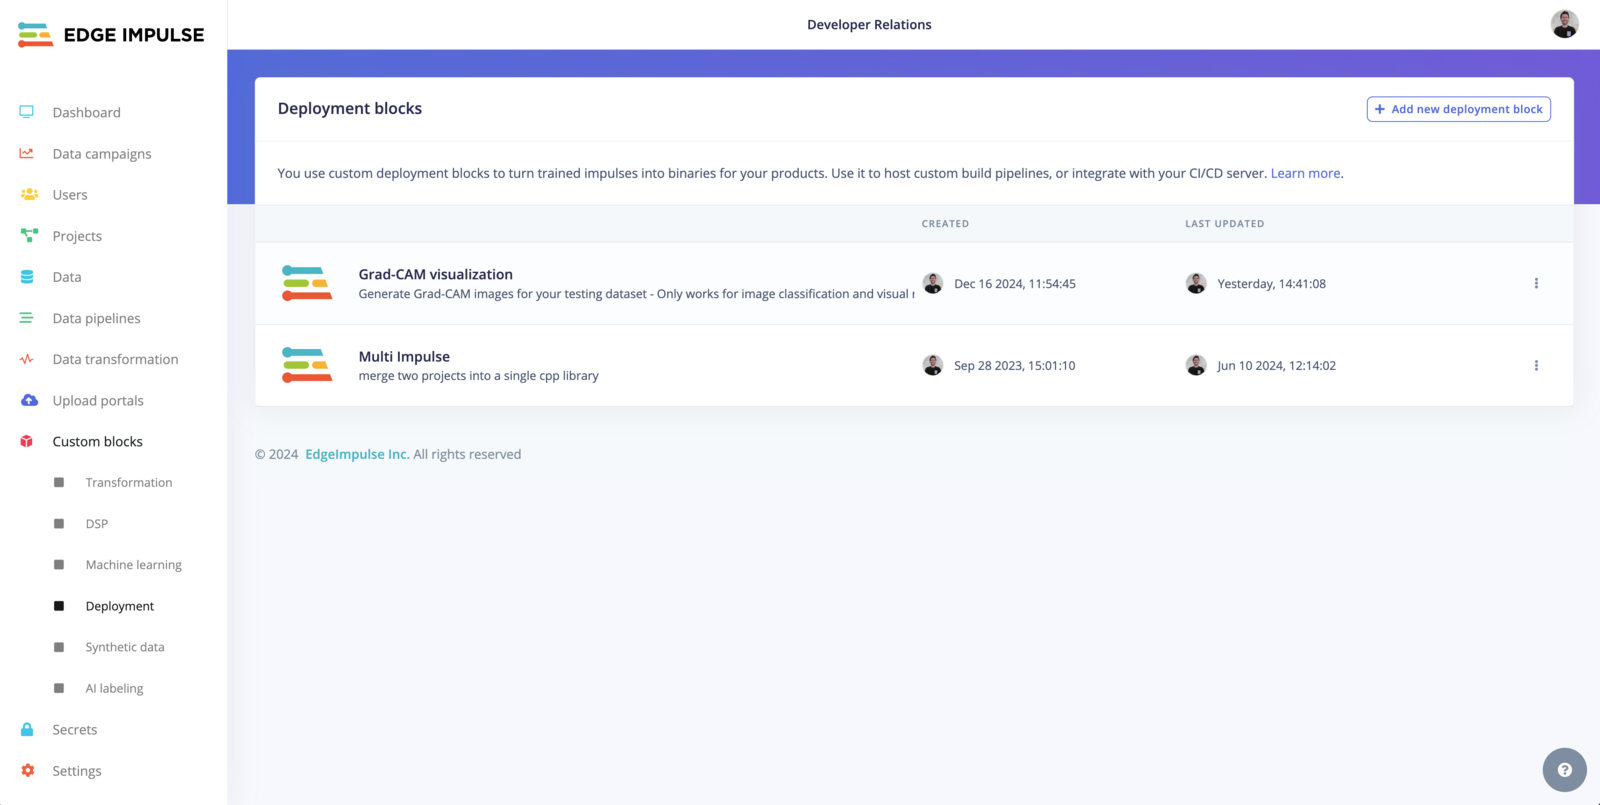
.h5 model
To use your custom block within your project, head to the Deployment page and select the Grad-CAM visualization option, the output will be a .zip file containing your test dataset with the Grad-Cam overlay.
Testing locally with Docker
Build:Fine-tuning the visualization
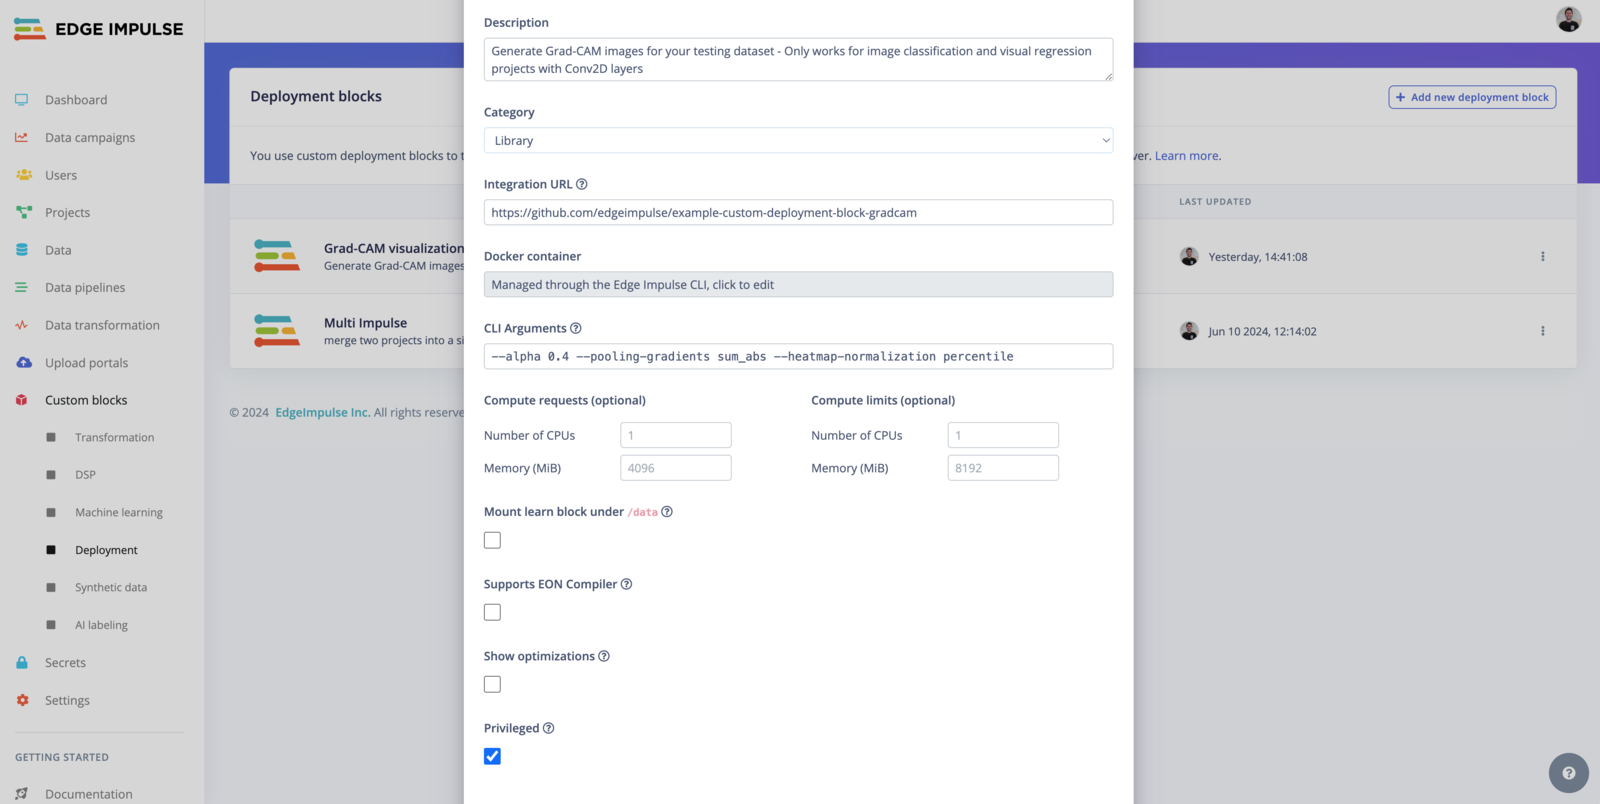
You can adjust three parameters to fine-tune the visualization:alpha, pooling-gradients, and heatmap-normalization.
1. Alpha (--alpha)
The alpha parameter controls the transparency of the Grad-CAM overlay when it is superimposed on the original image.
Default Value: 0.4
Range:
- A value between
0and1.0: Fully transparent (only the original image is visible).1: Fully opaque (only the Grad-CAM overlay is visible).
- Recommended Default (
0.4): Provides a balance between showing the original image and highlighting the Grad-CAM heatmap. - Higher Alpha (
> 0.5): Use this if you want the Grad-CAM heatmap to dominate the visualization. - Lower Alpha (
< 0.4): Use this if you want the original image to be more prominent.
2. Pooling Gradients (--pooling-gradients)
The pooling-gradients parameter determines how gradients (importance signals) are combined across the spatial dimensions of the last convolutional layer to generate the heatmap.
Options:
mean(default):- Averages the gradients across the spatial dimensions.
- Smooth out the heatmap, providing a general overview of important regions.
sum_abs:- Takes the sum of the absolute values of the gradients.
- Highlights areas with strong activations, which can sometimes create sharper heatmaps.
- Classification Models:
- Use
meanfor a smoother and more generalized heatmap. - Use
sum_absif you want to emphasize the most critical regions (e.g., sharp object boundaries).
- Use
- Regression Models:
sum_absis often more useful for regression tasks, as it highlights features contributing to extreme values.
- Experiment: Try both options to see which one provides more meaningful visualizations for your model and dataset.
3. Heatmap Normalization (--heatmap-normalization)
The heatmap-normalization parameter determines how the heatmap values are scaled for visualization.
Options:
percentile(default):- Ensures the heatmap values are scaled between
0and1based on their maximum value. - Best for emphasizing high-activation areas while normalizing the output globally.
- Ensures the heatmap values are scaled between
simple:- Normalizes the heatmap by dividing by the global maximum.
- A simpler approach that may work well for datasets where most activations are relevant.
- Default (
percentile):- Works well in most cases, especially if you expect only certain areas of the image to be significant.
- Use
simple:- Suitable for models where the activations are uniformly spread, and all areas are equally important.
Limitations
- This script assumes the presence of at least one 2D convolutional layer in the model architecture.
- It is designed for image classification and visual regression tasks.
- For regression models, the script uses a threshold to determine correctness; adjust this threshold (
threshold = 0.1) as needed for your use case.