Tutorial
Want to see the Anomaly Detection (K-means) block in action? Check out our Continuous Motion Recognition tutorial.Features importance (optional)
In most of our DSP blocks, you have the option to calculate the feature importance. Edge Impulse Studio will then output a Feature Importance list that will help you determine which axes generated from your DSP block are most significant to analyze when you want to do anomaly detection. See Processing blocks > Feature importanceSetting up the Anomaly Detection (K-Means) learning block
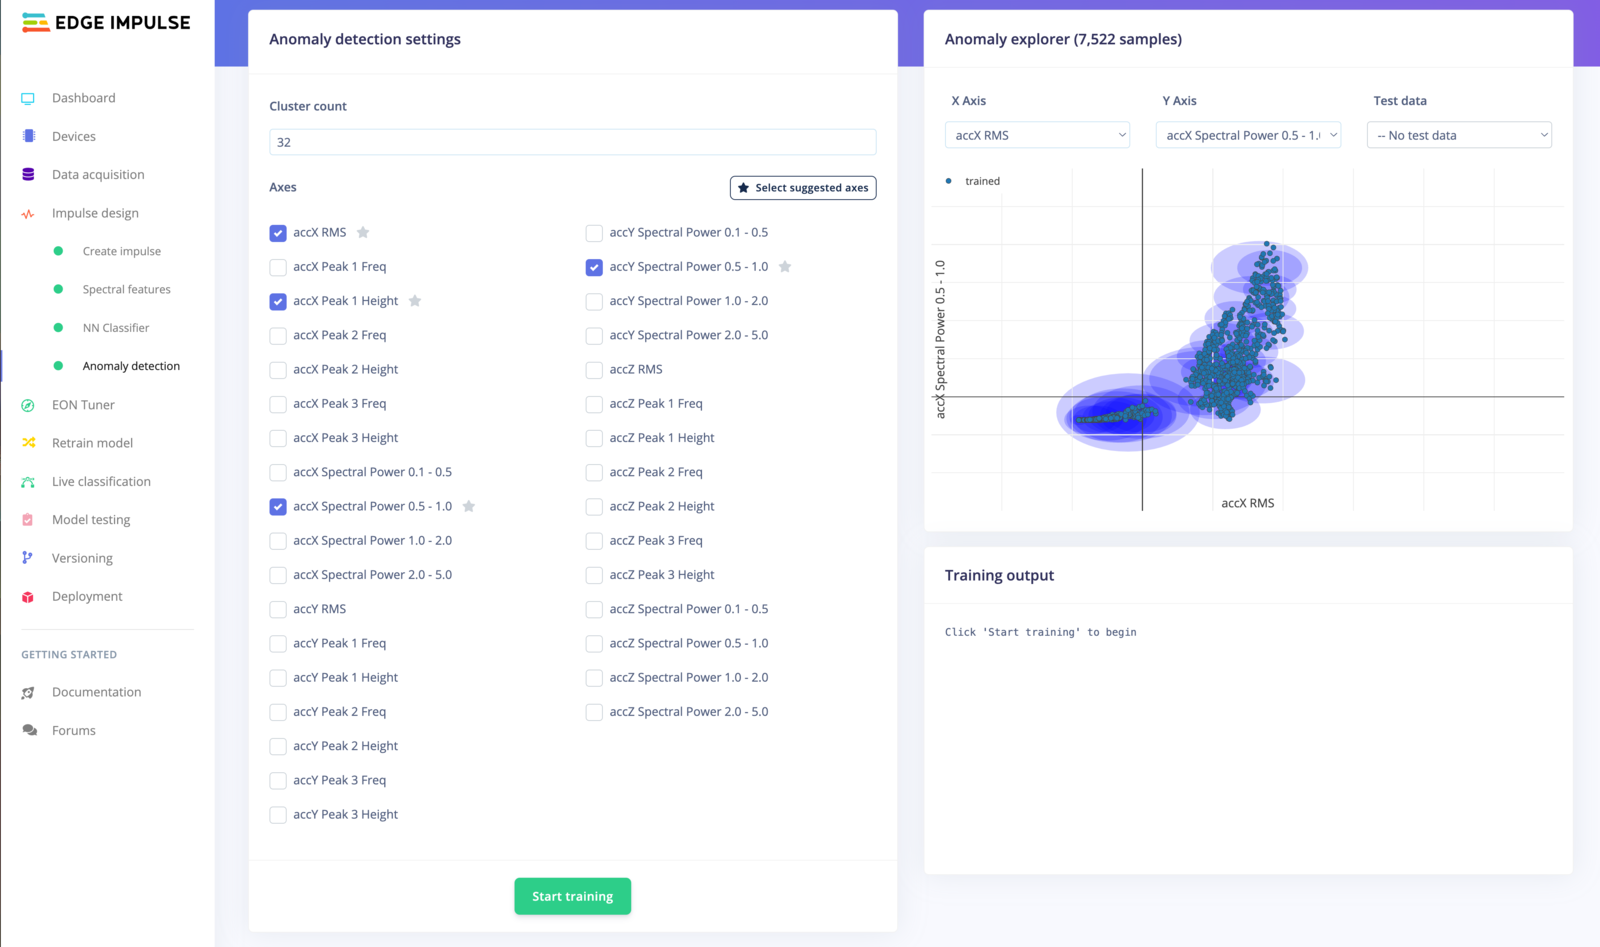
The K-Means anomaly detection learning block has two adjustable parameters: the Cluster count and The axes-
Cluster count: the
Kclusters. - Axes: The different axes correspond to the generated features from the pre-processing block. The chosen axes will use the features as the input data for the training.
Click on the Select suggested axes button to harness the results of the feature importance output.
How does it work?
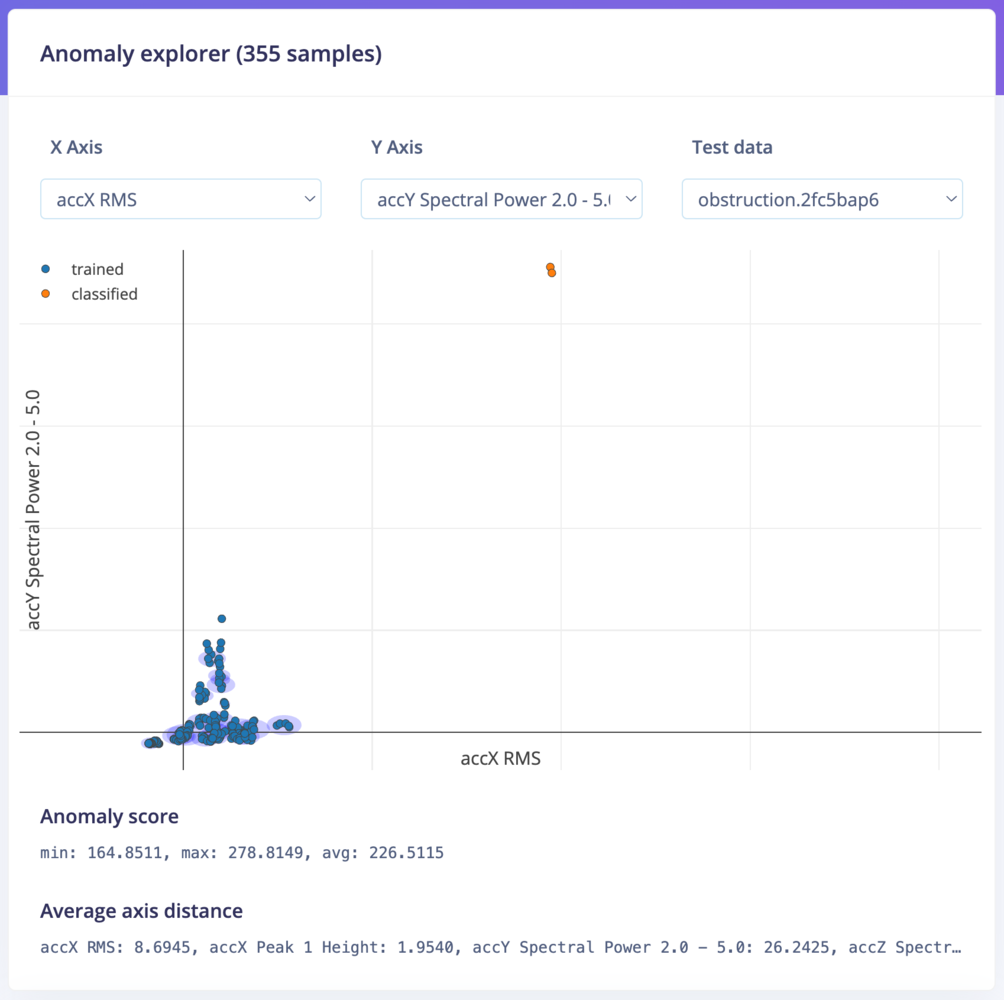
Here is the process in the background:- Create X number of clusters and group all the data.
- For each of these clusters, we store the center and the size of the cluster.
- During the inference, we calculate the closest cluster for a new data point and show the distance from the edge of the cluster. If it’s within a cluster (no anomaly) you thus get a value below 0.
Additional resources
- Tutorial: Continuous Motion Recognition
- Blog post: Advanced Anomaly Detection with Feature Importance