Live classification lets you validate your model with data captured directly from any supported device or development board. This gives you a picture on how your model will perform with real world data. To achieve this, go to Live classification and connect the device or development board you want to capture data from.
All of your connected devices and sensors will appear under Devices as shown below. The devices can be connected through the Edge Impulse CLI or WebUSB:
To perform live classification using your phone, go to Devices and click Connect a new device then select “Use your mobile phone”. Scan the QR code using your phone then click Switch to classification mode and start sampling.
QR code for live classification using your mobile phone
To perform live classification using your computer, go to Devices and click Connect a new device then select “Use your computer”. Give permissions on your computer then click Switch to classification mode and start sampling.
Object detection models identify and locate objects within an image, providing class, quantity, position, and size information. Edge Impulse supports various object detection model architectures, each optimized for specific hardware targets and use cases. The following sections detail the key features and performance metrics of the supported object detection models.
SSD MobileNet V2
FOMO
Employs a Single Shot MultiBox Detector (SSD) with a MobileNet V2 backbone for object detection. This model is optimized for running on MCUs and CPUs.
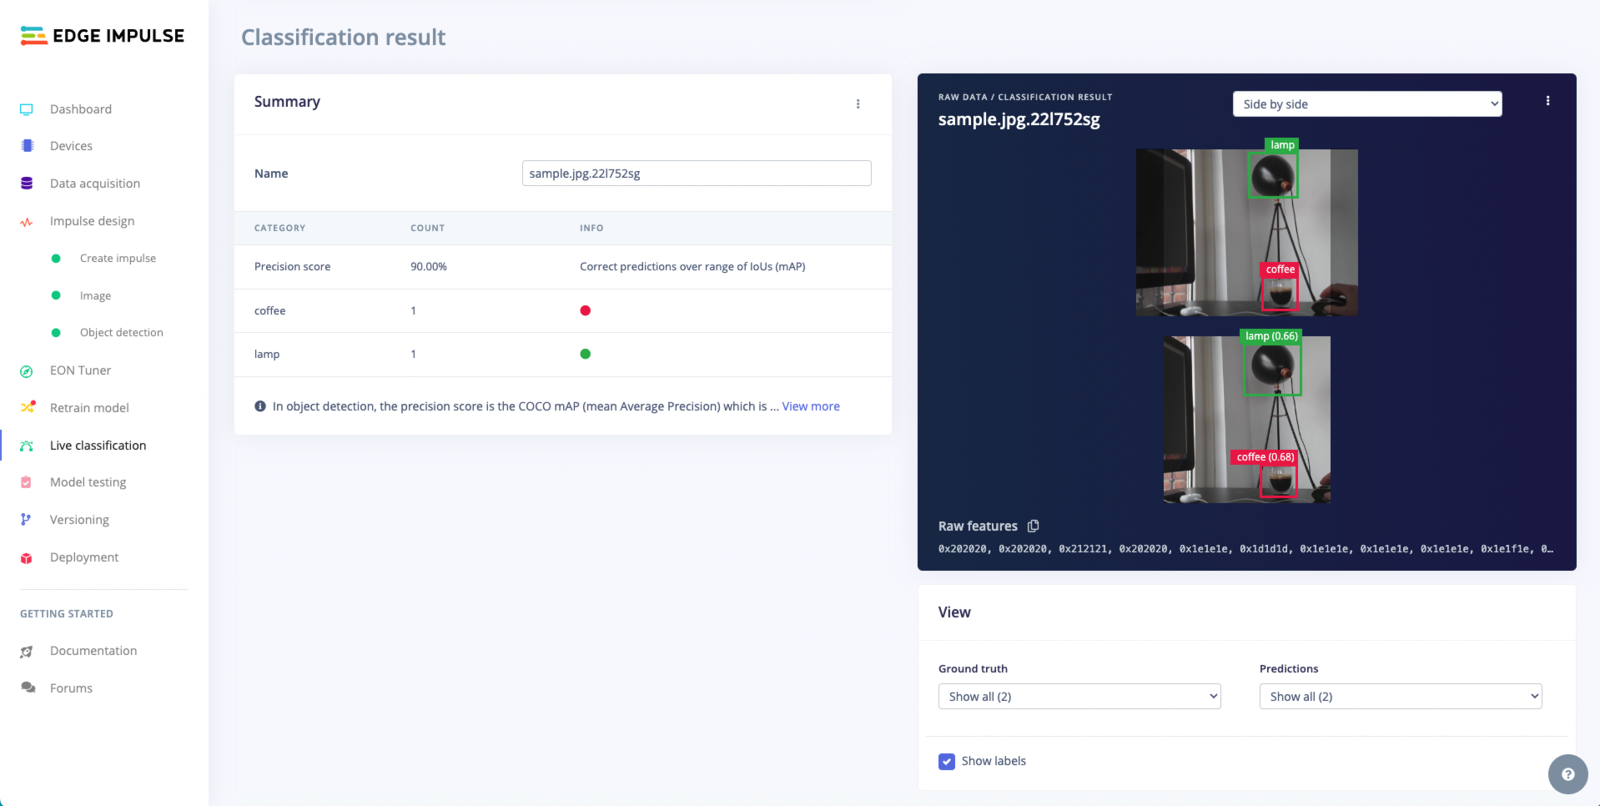
Live Classification Result
Live classification helps you determine how well your model works, showing the objects detected and the confidence score side by side.
This view is particularly useful for a direct comparison between the raw image and the model’s interpretation.
Each object detected in the image is highlighted with a bounding box. Alongside these boxes, you’ll find labels and confidence scores, indicating what the model thinks each object is and how sure it is about its prediction.
This mode is ideal for understanding the model’s performance in terms of object localization and classification accuracy.
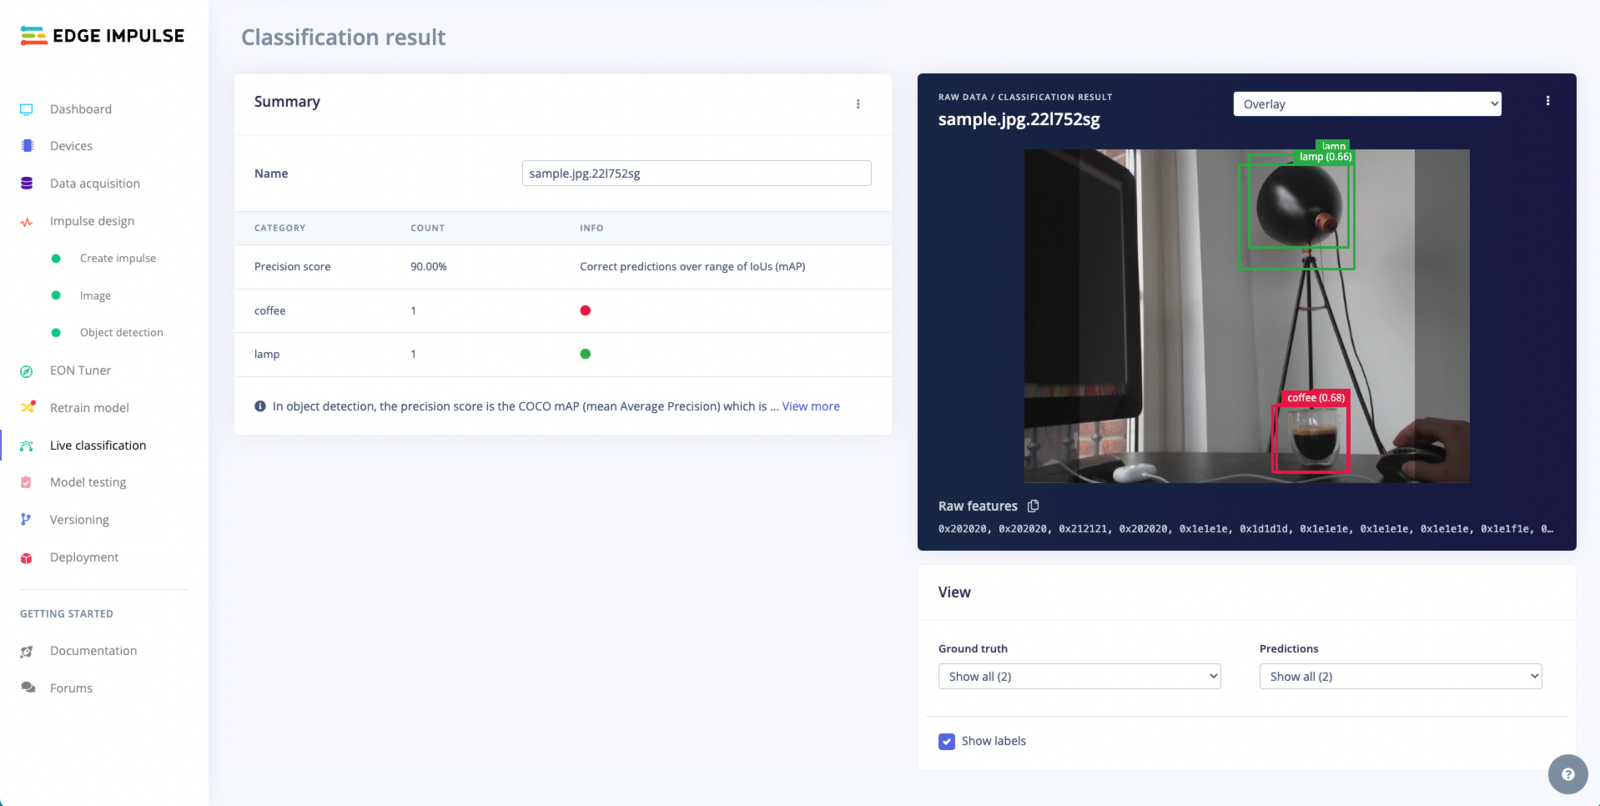
Overlay Mode for the Live Classification Result
Changing to overlay mode provides a more integrated view by superimposing the model's detections directly onto the original image
In this view, bounding boxes are drawn around the detected objects, with labels and confidence scores displayed within the image context.
This approach offers a clearer view of how the bounding boxes align with the objects in the image, making it easier to assess the precision of object localization.
The overlay view is particularly useful for examining the model’s ability to accurately detect and outline objects within a complex visual scene.
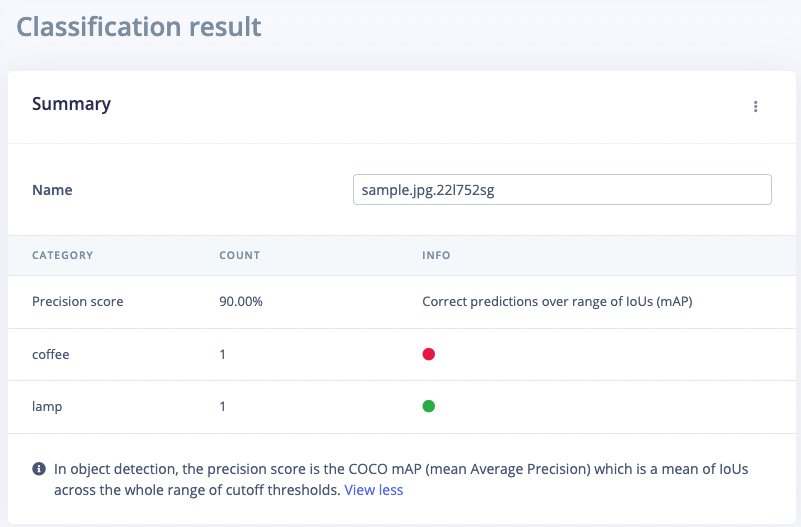
Summary Table
This table provides a concise summary of the performance metrics for an object detection model, using a specific sample file. The layout and contents are as follows.
Name: This field displays the name of the sample file analyzed by the model. For instance, ‘sample.jpg.22l74u4f’ is the file name in this case.CATEGORY: Lists the types of objects that the model has been trained to detect. In this example, two categories are shown: ‘coffee’ and ‘lamp’.COUNT: Indicates the number of times each category was detected in the sample file. In this case, both ‘coffee’ and ‘lamp’ have a count of 1, meaning each object was detected once in the sample.INFO: This column provides additional information about the model’s performance. It displays the ‘Precision score’, which, in this example, is 95.00%. The precision score represents the model’s accuracy in making correct predictions over a range of Intersection over Union (IoU) values, known as the mean Average Precision (mAP).
Employs centroids for detecting object locations. Runs on high-end MCUs as well as CPUs and GPUs.
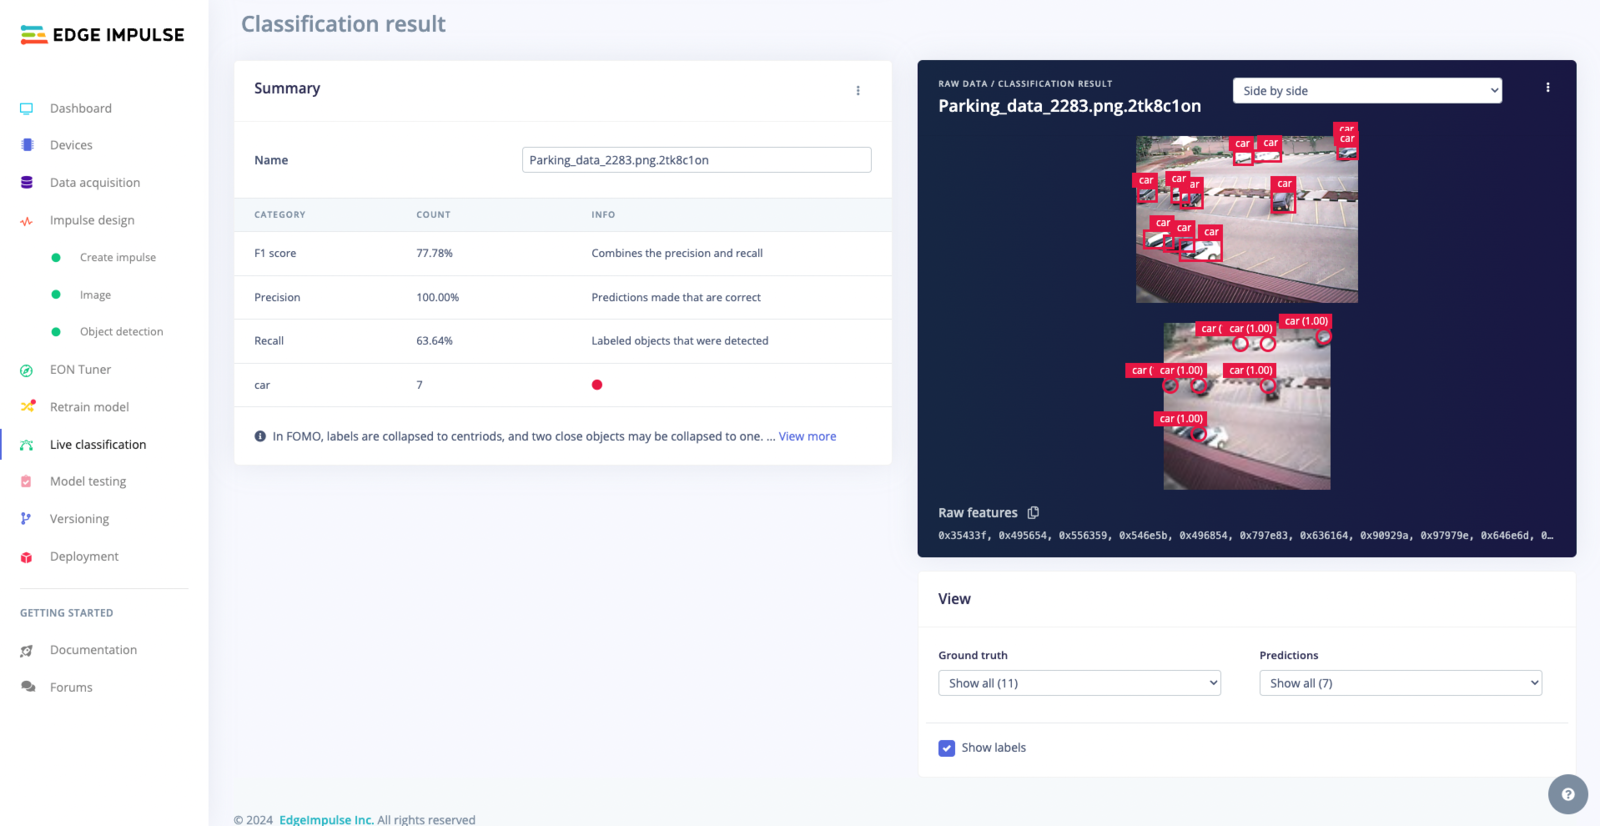
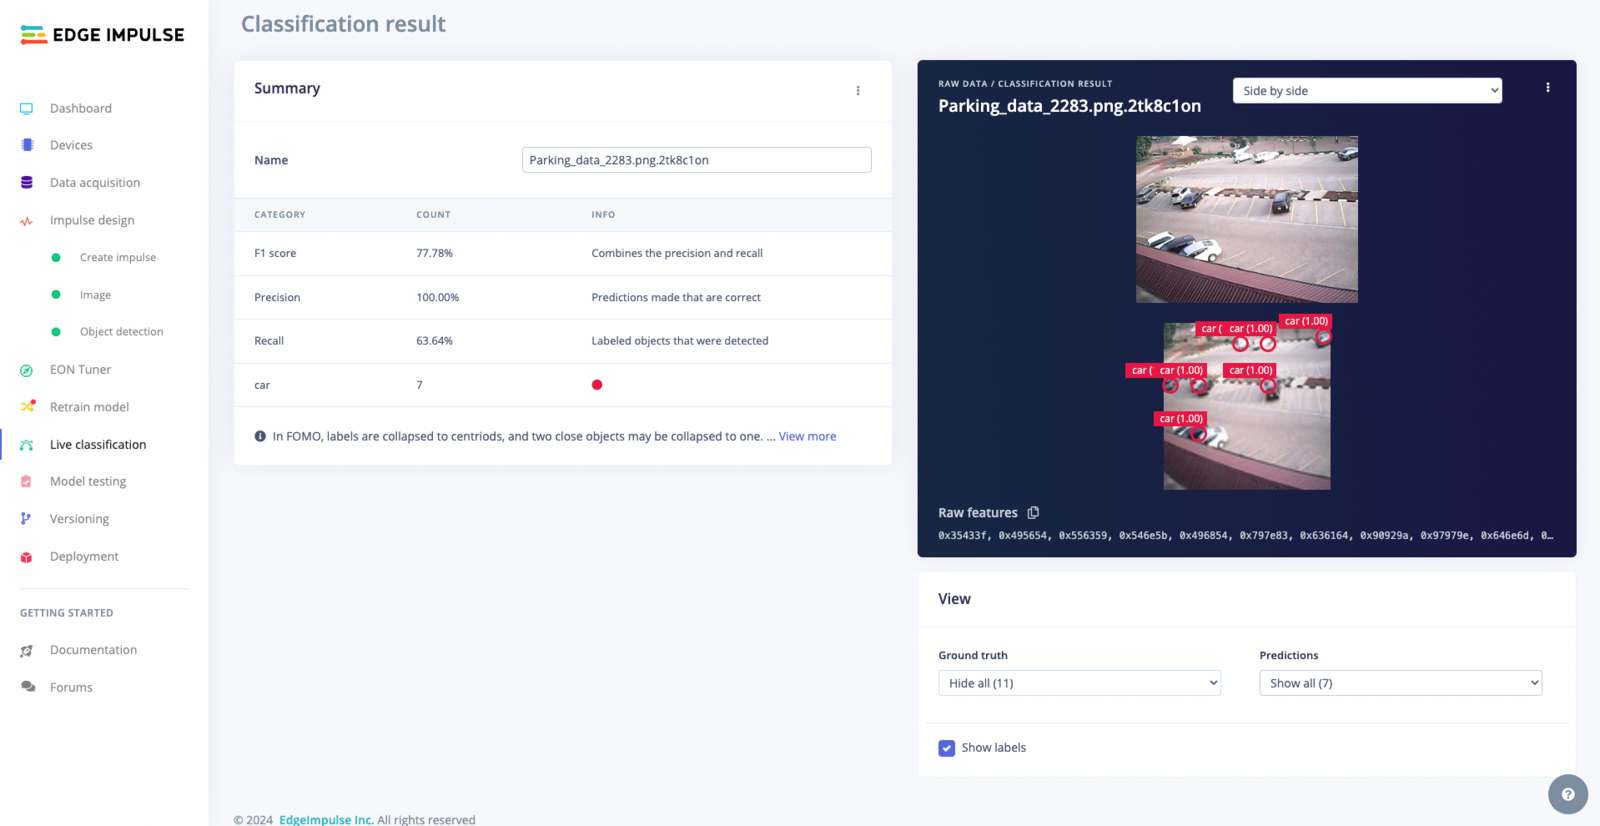
Live Classification Result
Live Classification - Side by Side
From the test image above, our model was able to detect 16 cars out of the actual possible 18 which is a good performance. This can be seen in side by side by default, but you can also switch to overlay mode to see the model’s predictions against the actual image content.
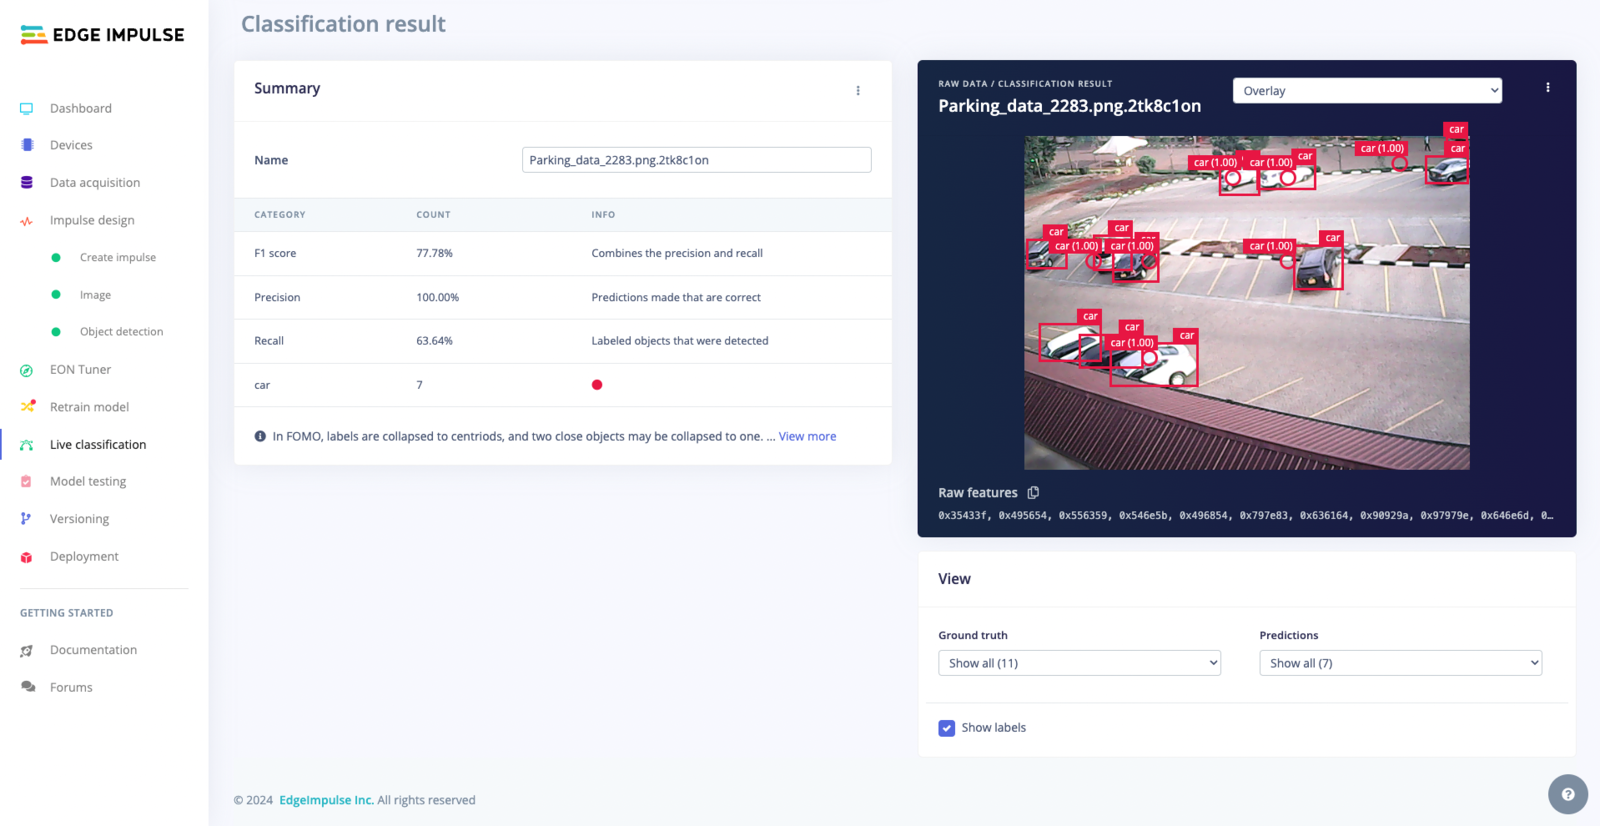
Overlay Mode for the Live Classification Result
Live Classification - Overlay
A display option where the original image and the model’s detections overlap, providing a clear juxtaposition of the model’s predictions against the actual image content.
Summary Table
Summary Table
The summary table for a FOMO classification result provides a concise overview of the model’s performance on a specific sample file, such as ‘Parking_data_2283.png.2tk8c1on’. This table is organized as follows:CATEGORY: Metric, Object category, or class label, e.g., car.
COUNT: Shows detection accuracy, frequency, e.g., car detected 7 times.INFO: Provides performance metrics definitions, including F1 Score, Precision, and Recall, which offer insights into the model’s accuracy and efficacy in detection:Table MetricsF1 Score: (77.78%): Balances precision and recall.
Precision: (100.00%): Accuracy of correct predictions.
Recall: (63.64%): Proportion of actual objects detected.
Viewing Options
Bottom-right controls adjust the visibility of ground truth labels and model predictions, enhancing the analysis of the model’s performance:Prediction Controls: Customize the display of model predictions, including:
Show All: Show all detections and confidence scores.
Show Correct Only: Focus on accurate model predictions.
Show incorrect only: Pinpoint undetected objects in the ground truth.
Ground Truth Controls: Toggle the visibility of original labels for direct comparison with model predictions.
Show All: Display all ground truth labels.
Hide All: Conceal all ground truth labels.
Show detected only: Highlight ground truth labels detected by the model.
Show undetected only: Identify ground truth labels missed by the model.