Prerequisites
Make sure to have data samples on your test set, you can add data samples from the Data Acquisition page or the Live Classification page.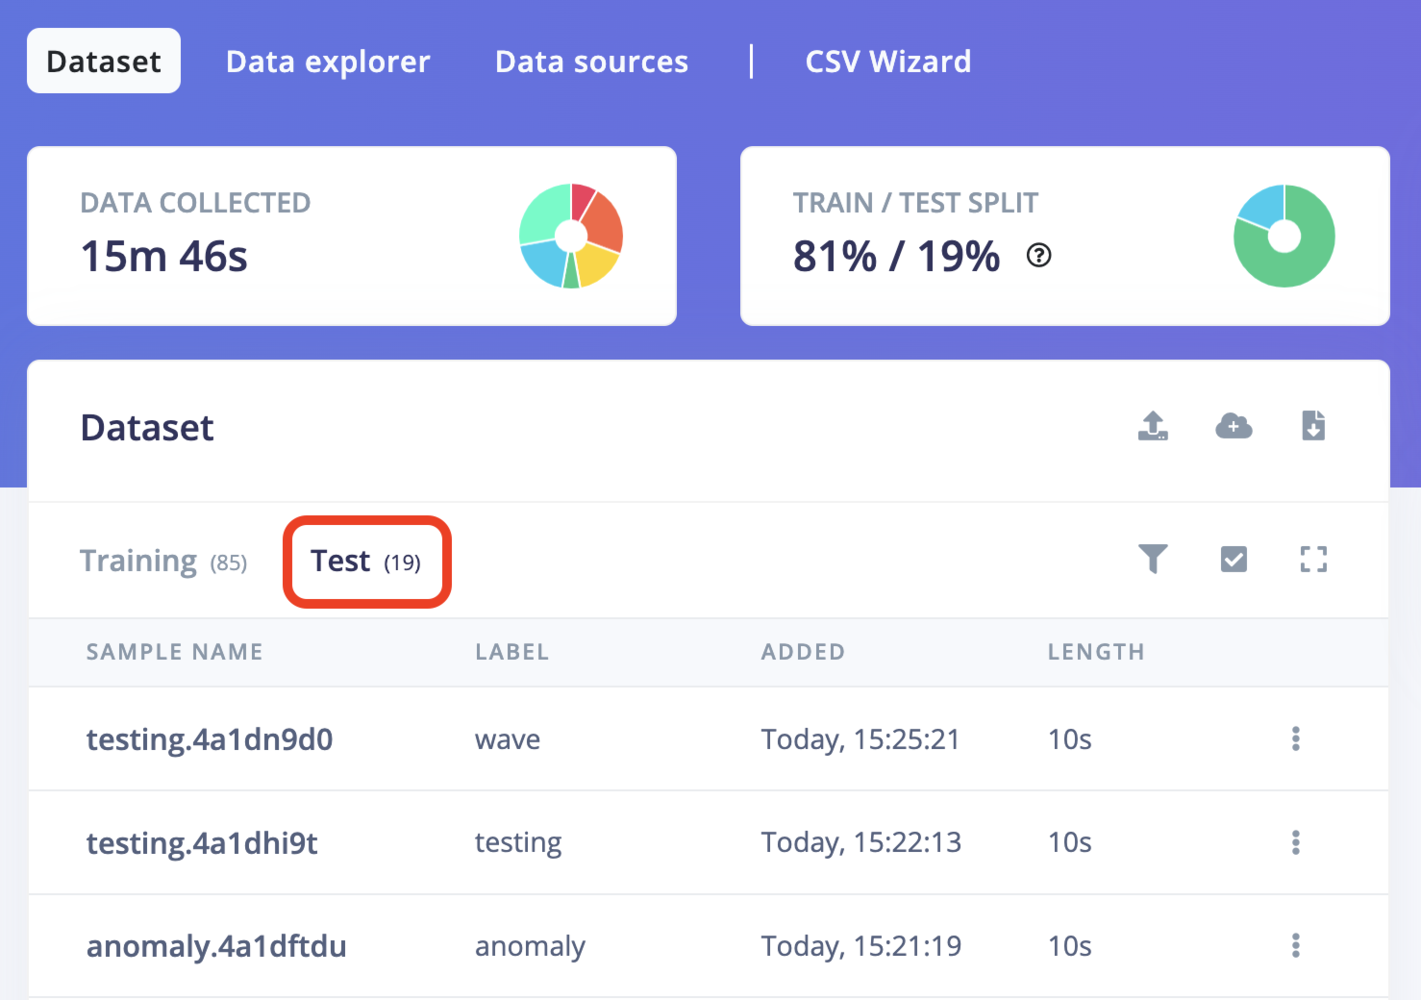
Test dataset
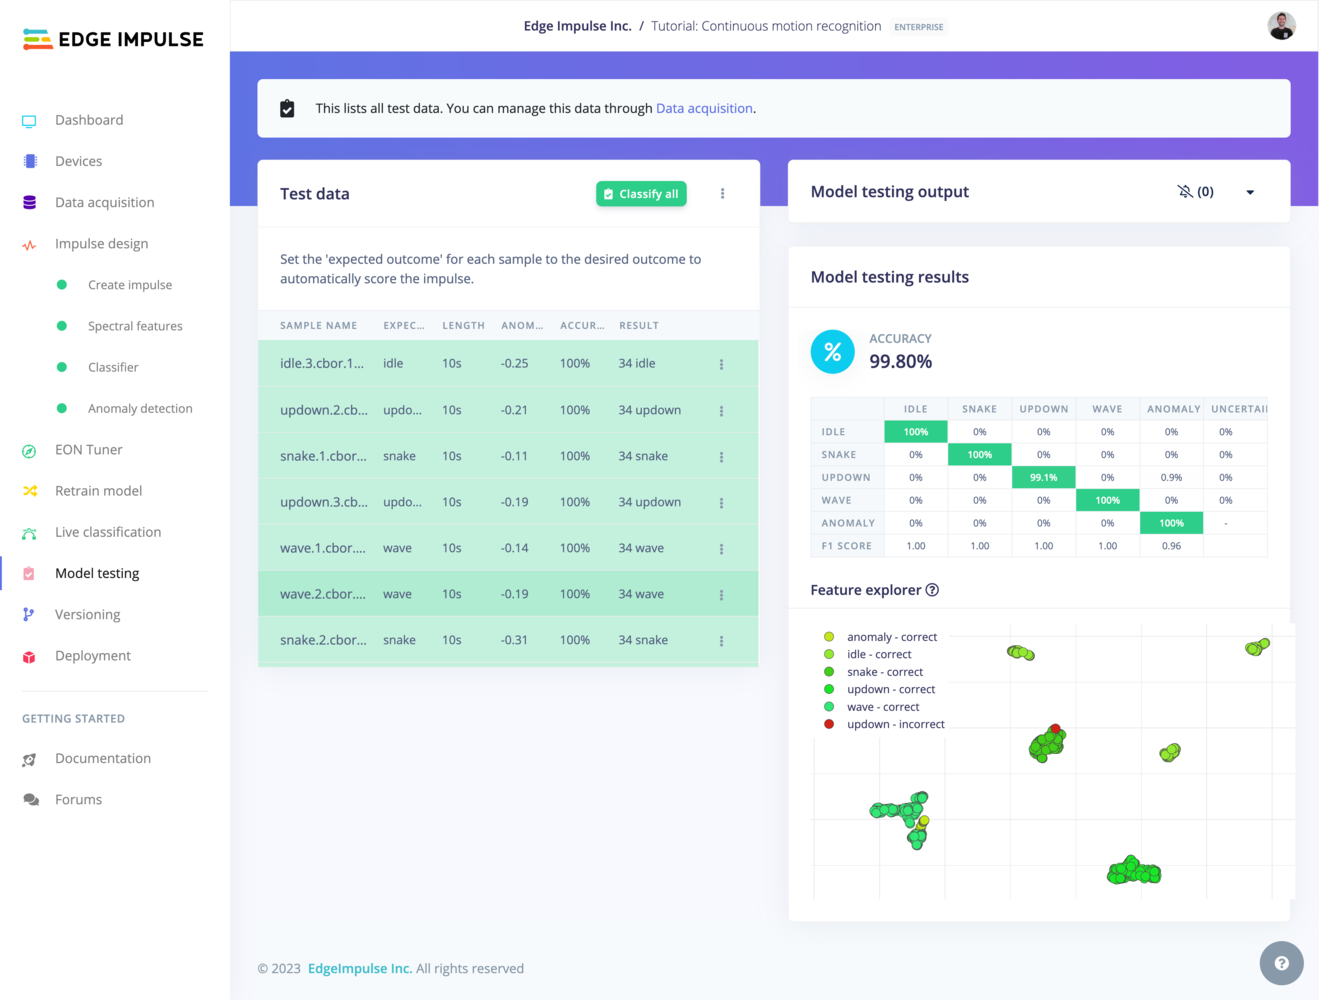
Model testing
To test your model, go to Model testing, select the desired model version from the dropdown (either Unoptimized (float32) or Quantized (int8)), and click Test all. The model will classify all of the test set samples and give you an overall accuracy of how your model performed.Quantized (int8) model is not enabled by default and the fist step of enabling is in the settings menu beside the Classify all button
Float32 vs int8 models
You can choose to test your model using either the float32 or int8 quantized version. The float32 version offers higher precision but may use more resources, while the int8 quantized version is optimized for memory and computational efficiency, making it suitable for edge devices with limited resources. To select the model format:- In the Model Testing page, open the Model version dropdown.
- Choose between Unoptimized (float32) or Quantized (int8) models.
- Click Test all to evaluate your model with the selected format.
classify all test images
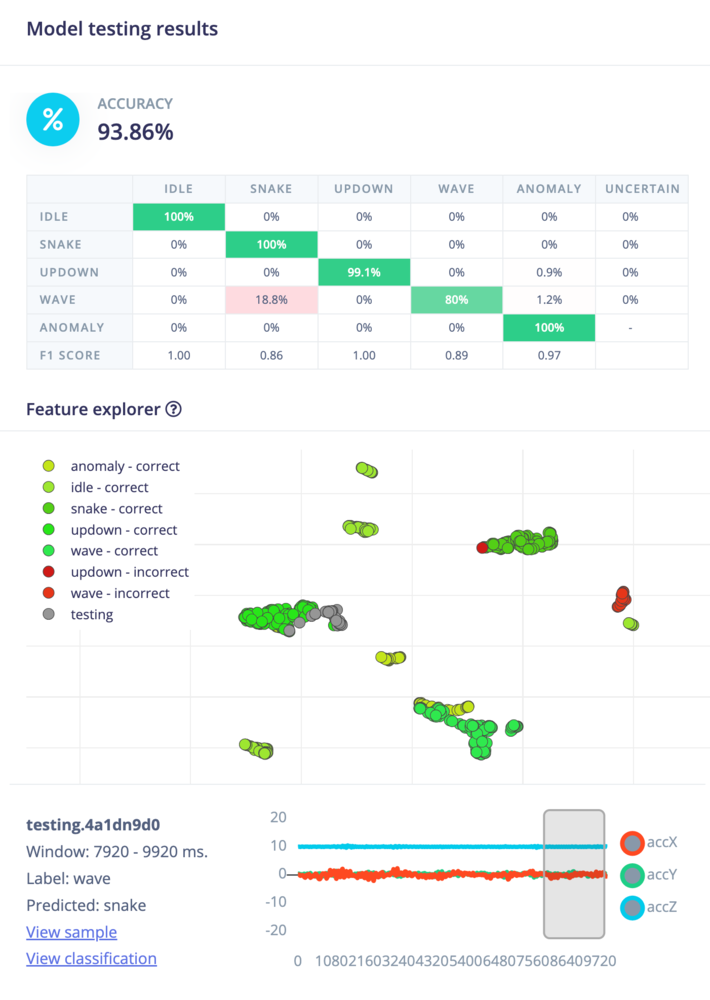
Model testing confusion matrix
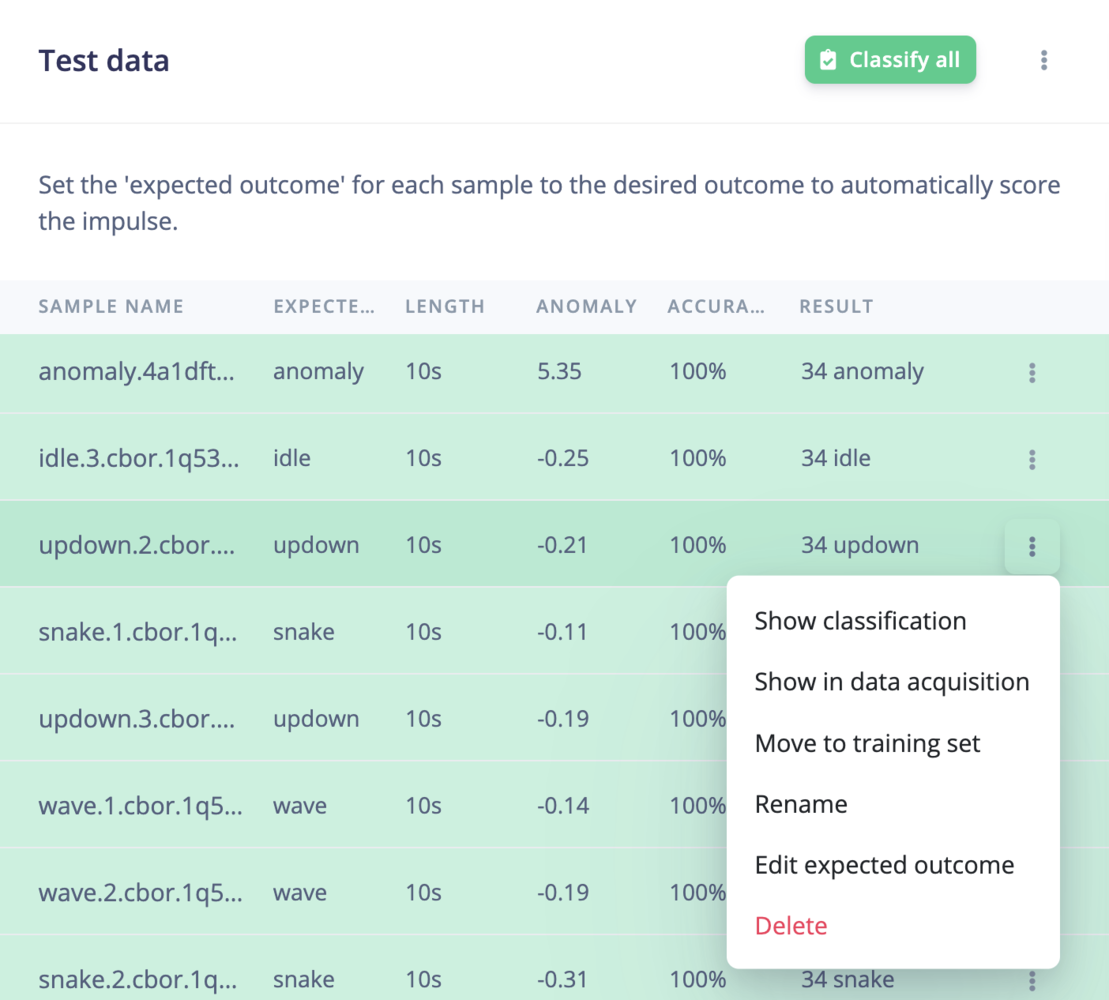
Model testing data table
anomaly for anomaly detection learning blocks are ignored from the accuracy or the F1 score calculation:
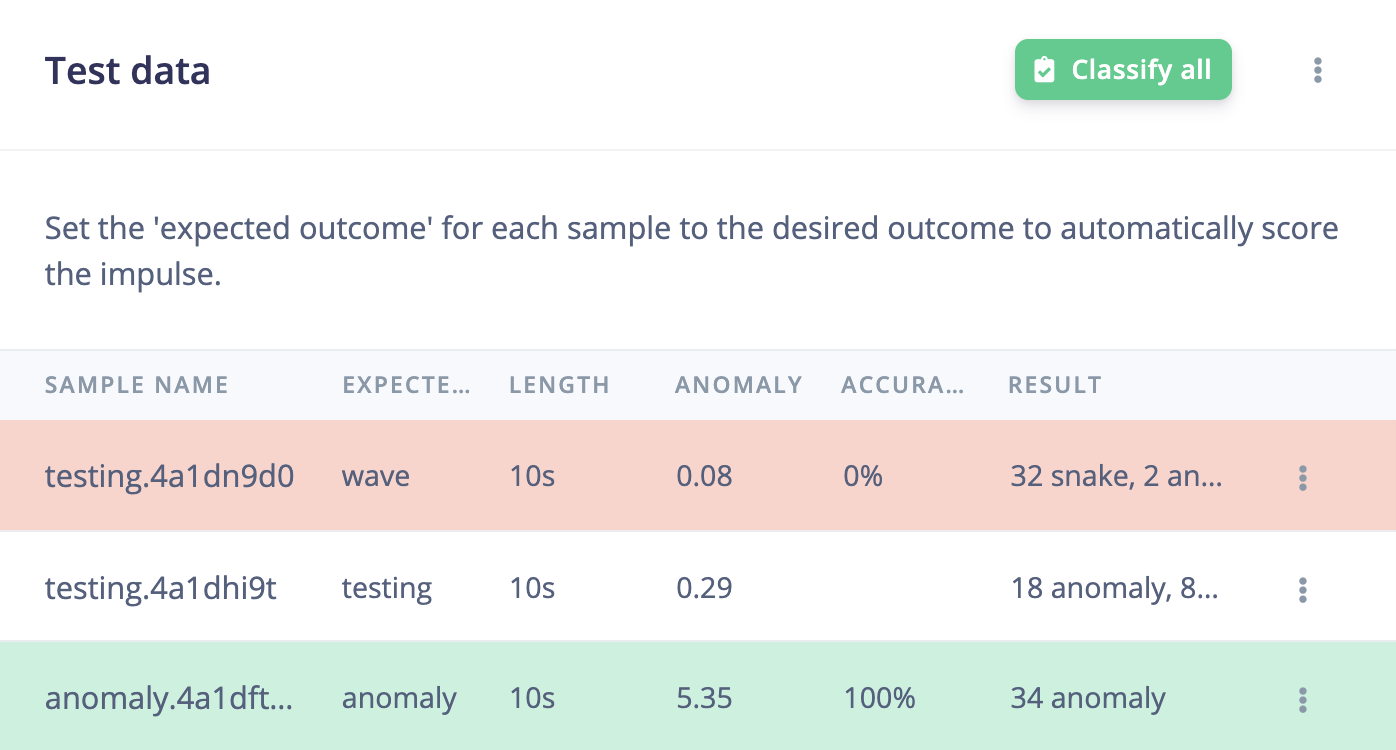
Ignored samples
Setting confidence threshold
Every learning block has a threshold. This can be the minimum confidence that a neural network needs to have, or the maximum anomaly score before a sample is tagged as an anomaly. You can configure these thresholds to tweak the sensitivity of these learning blocks. This affects both live classification and model testing.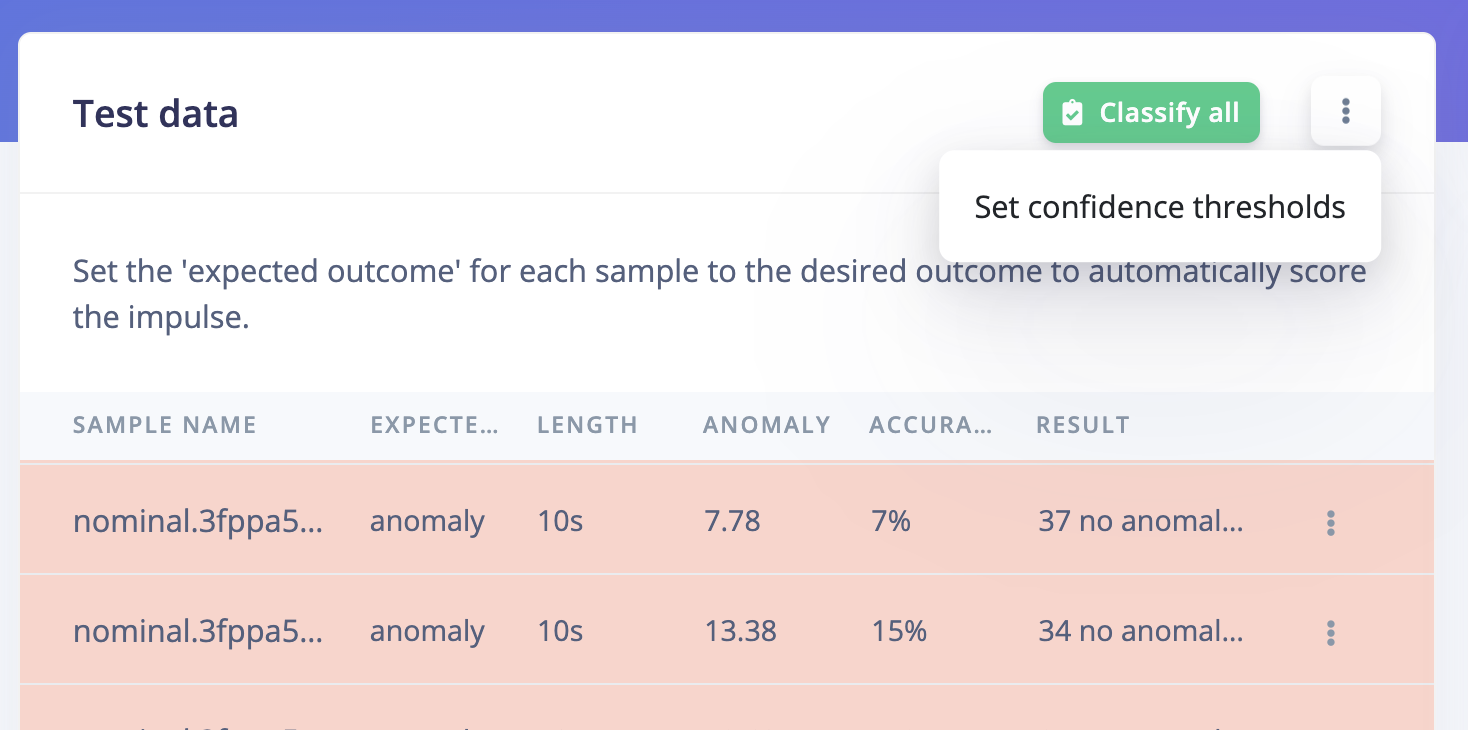
Setting confidence threshold
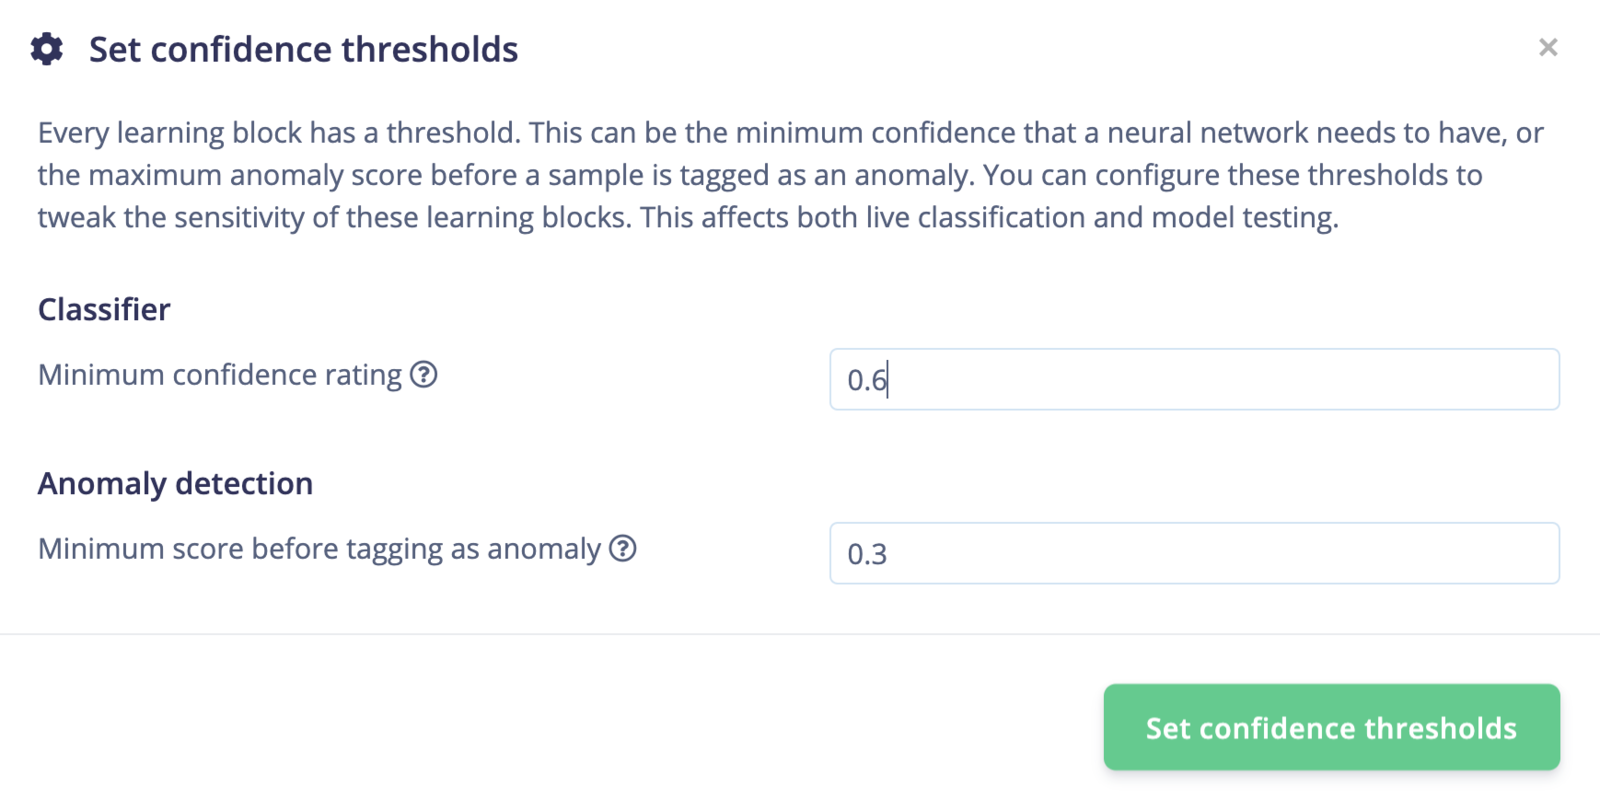
Setting confidence threshold values
Evaluating individual samples
To see a classification in detail, go to the individual sample you are want to evaluate and click the three dots next to it, then just select show classification. This will open a new window that will display the expected outcome, and the predicted output of your model with its accuracy. This detailed view can also give you a hint on why an item has been misclassified.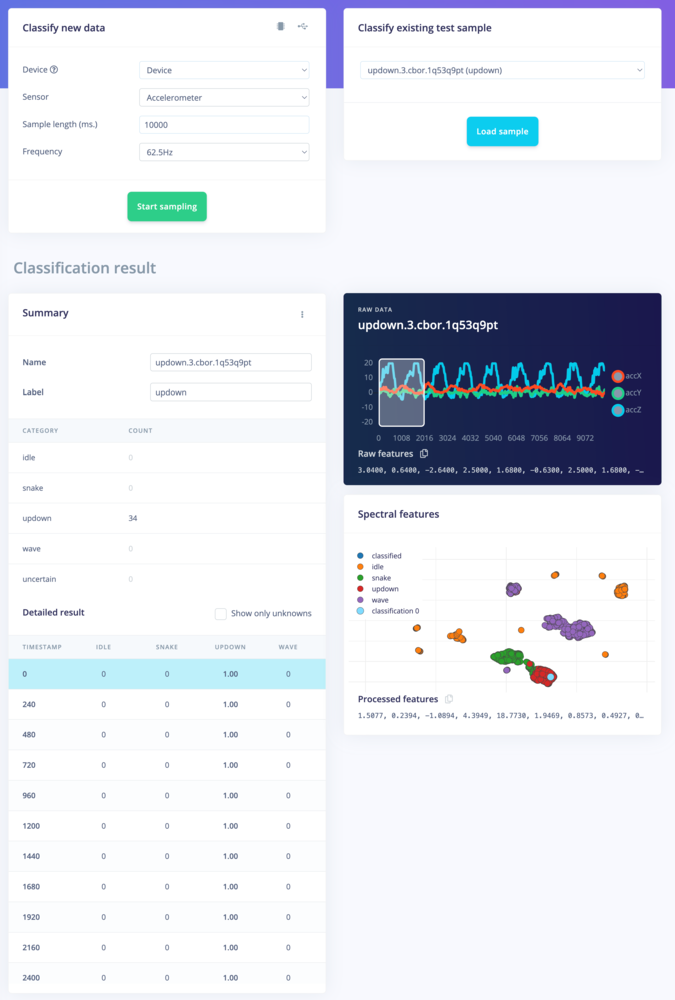
Classification result. Showing the conclusions, the raw data and processed features in one overview.