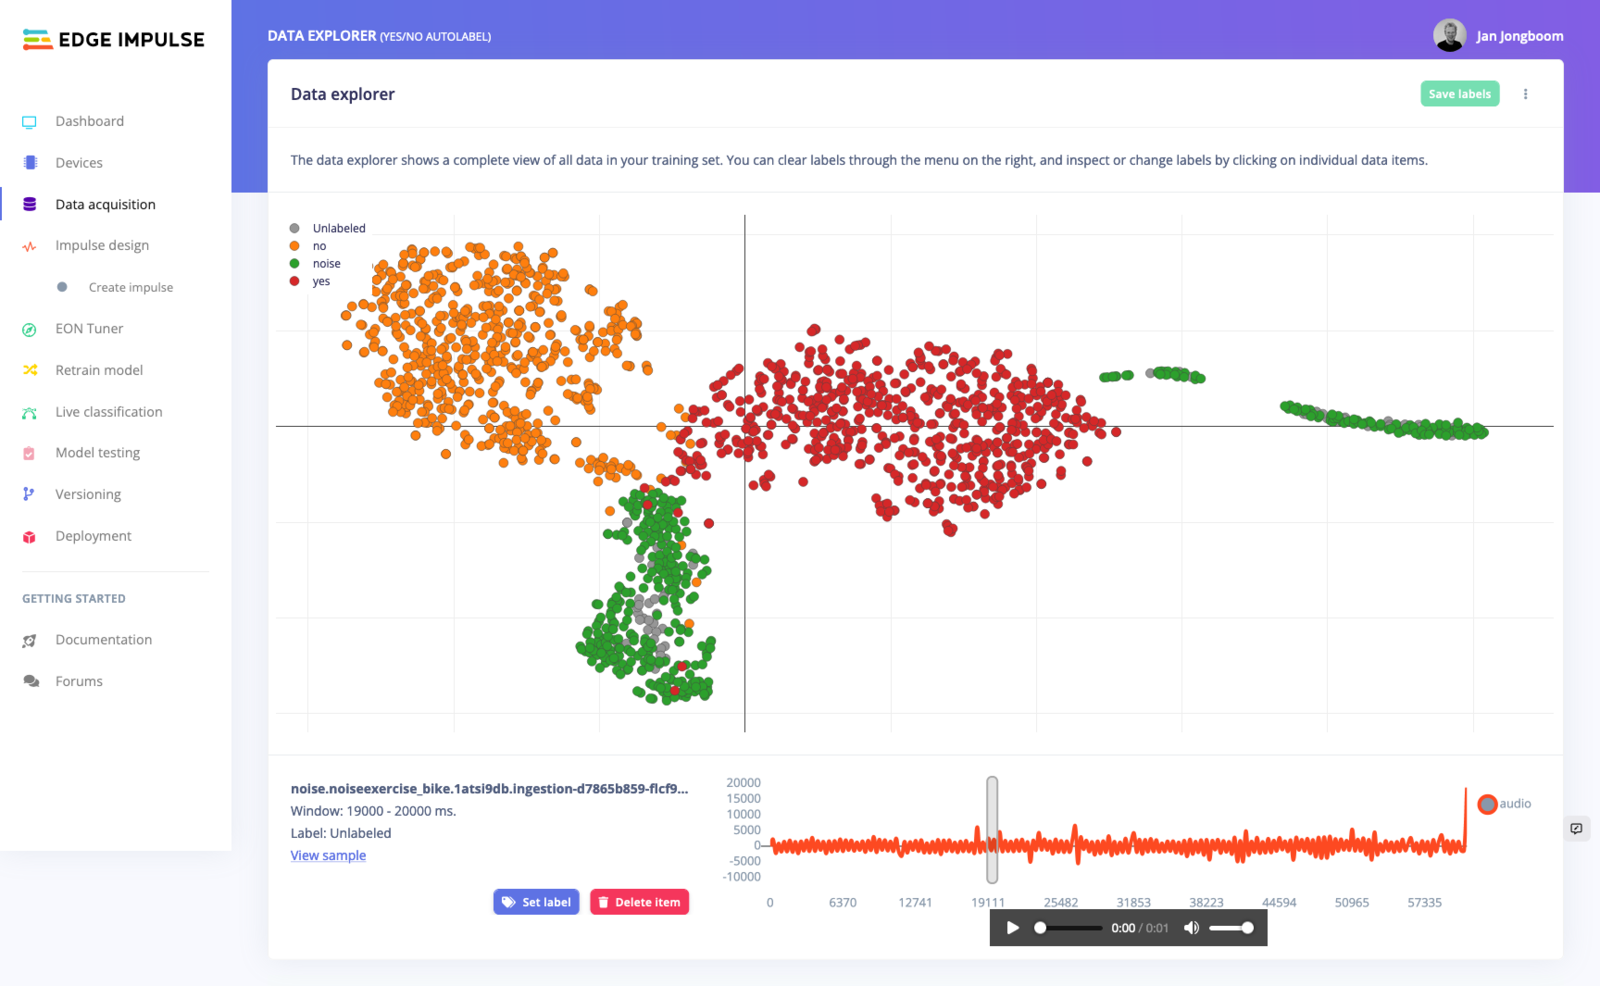
Showing a keywords dataset, unlabeled data marked in gray.
The Data explorer tab is available for audio classification, image classification and regression projects only.
Using the data explorer
To access the data explorer head to Data acquisition, click Data explorer, then select a way to generate the data explorer. Depending on you data you’ll see three options:- Using a pre-trained model - here we use a large neural network trained on a varied dataset to generate the embeddings. This works very well if you don’t have any labeled data yet, or want to look at new clusters of data. This option is available for keywords and for images.
- Using your trained impulse - here we use the neural network block in your impulse to generate the embeddings. This typically creates even better visualizations, but will fail if you have completely new clusters of data as the neural network hasn’t learned anything about them. This option is only available if you have a trained impulse.
- Using the preprocessing blocks in your impulse - here we skip the embeddings, and just use your selected signal processing blocks to create the data explorer. This creates a similar visualization as the feature explorer but in a 2D space and with extra labeling tools. This is particularly helpful when working with unlabeled data, or when you have new clusters of data that your neural network hasn’t learned yet.
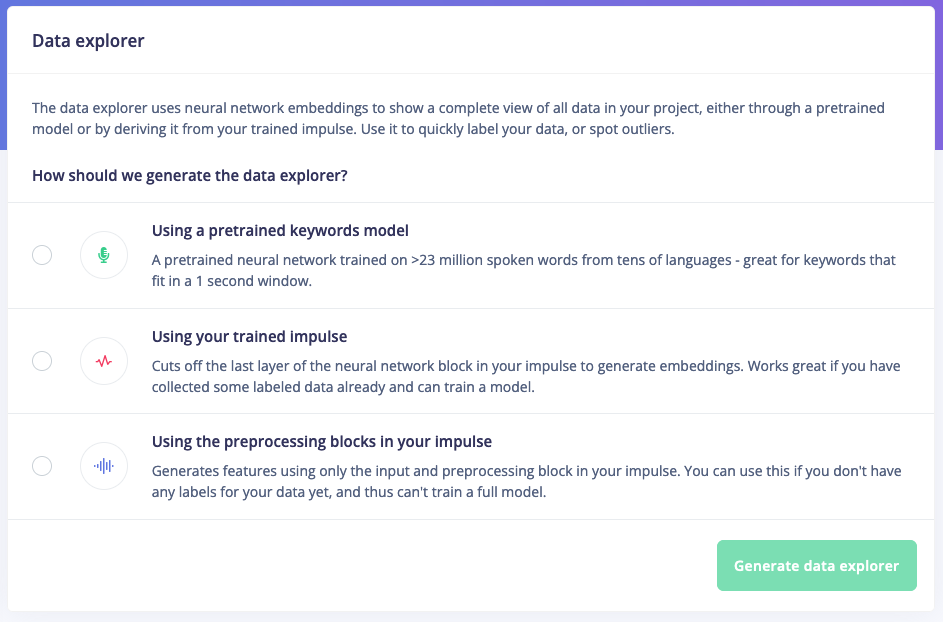
Selecting a way to generate the data explorer
Want to see examples of the same dataset visualized in different ways? Scroll down!
Viewing and modifying data
To view an item in your dataset just click on any of the dots (some basic information appears on hover). Information about the sample, and a preview of the data item appears at the bottom of the data explorer. You can click Set label (or l on your keyboard) to set a new label for the data item, or press Delete item (or d on your keyboard) to remove the data item. These changes are queued until you click Save labels (at the top of the data explorer).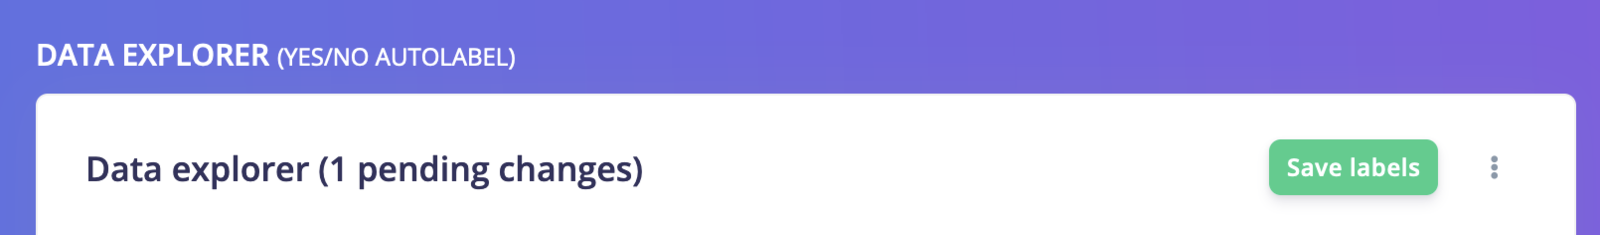
Changes are queued until you click 'Save labels'.
Assisted labeling
The data explorer marks unlabeled data in gray (with an ‘Unlabeled’ label). To label this data you click on any gray dot. To then set a label by clicking the Set label button (or by pressingl on your keyboard) and enter a label. Other unlabeled data in the vicinity of this item will automatically be labeled as well. This way you can quickly label clustered data.
To upload unlabeled data you can either:
- Use the upload UI and select the ‘Leave data unlabeled’ option.
- Select the items in your dataset under Data acquisition, select all relevant items, click Edit labels and set the label to an empty string.
- When uploading data through the Ingestion API, set the
x-no-labelheader to 1, and thex-labelto an empty string.
Clear all labels.
Wait, how does this work?
The data explorer uses a three-stage process:- It runs your data through an input and a DSP block - like any impulse.
- It passes the result of 1) through part of a neural network. This forces the neural network to compress the DSP output even further, but to features that are highly specialized to distinguish the exact type of data in your dataset (called ‘embeddings’).
- The embeddings are passed through t-SNE, a dimensionality reduction algorithm.
- 33 input features (from the signal processing step)
- A layer with 20 neurons
- A layer with 10 neurons
- A layer with 4 neurons (the number of different classes)
Examples of different embeddings
Here’s an example of using the data explorer to visualize a very complex computer vision dataset (distinguishing between the four cats of one of our infrastructure engineers).No embeddings (just running t-SNE over the images)
Visualizing a complex dataset of cats without embeddings
With embeddings from a pre-trained MobileNetV2 model
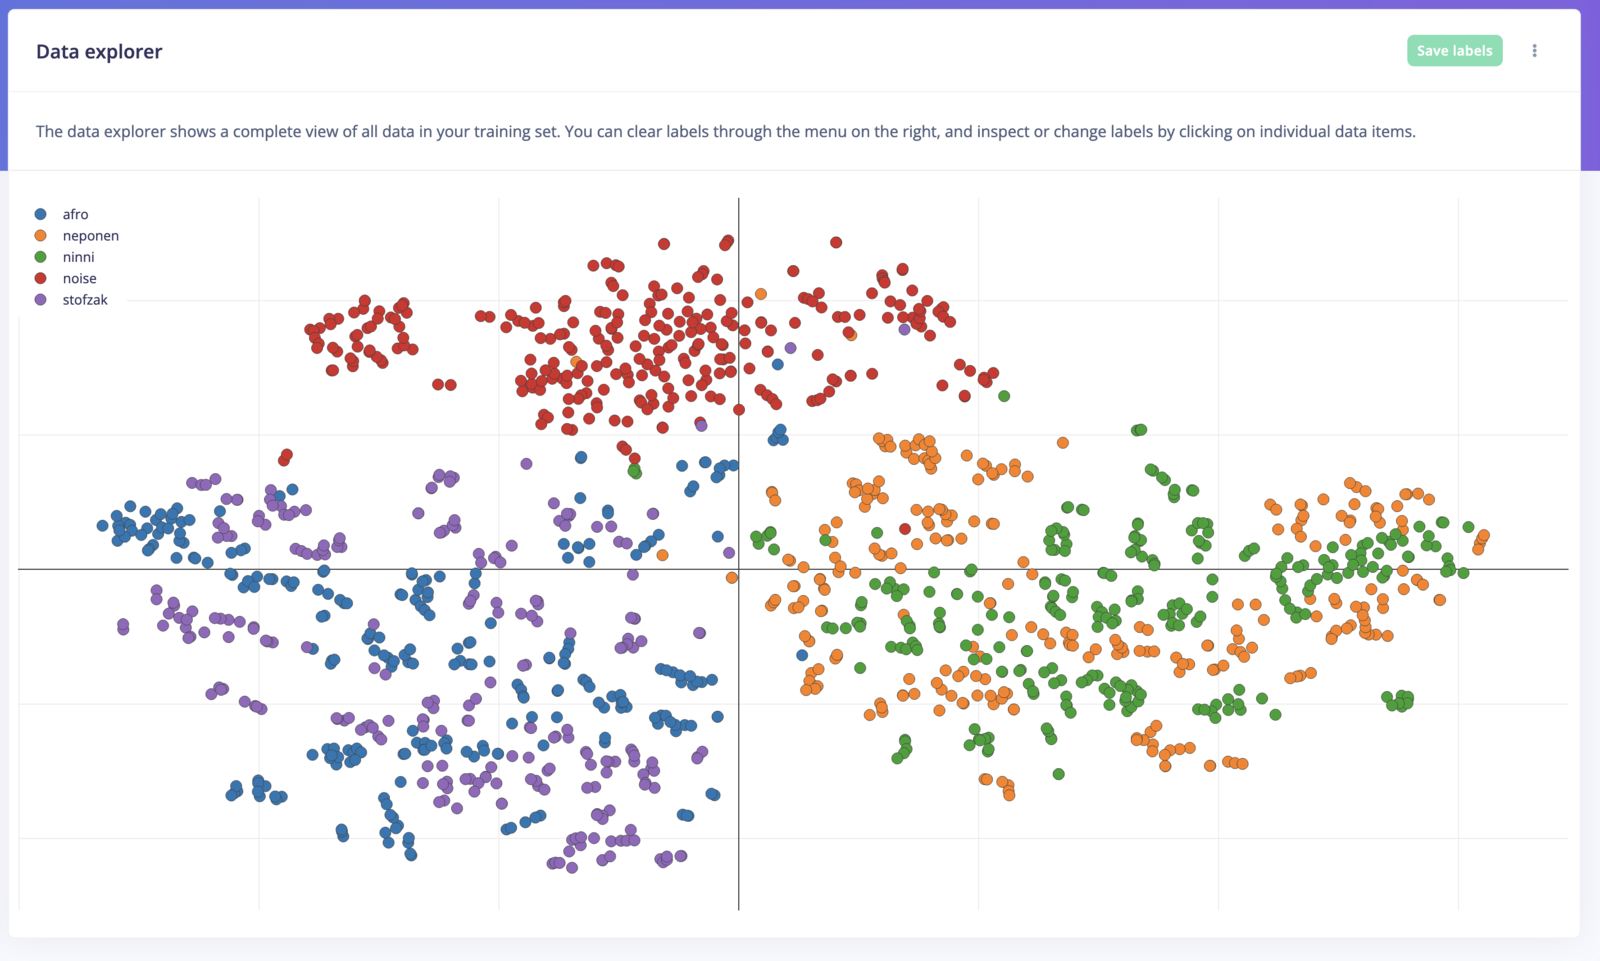
Visualizing a complex dataset of cats with embeddings from a pre-trained MobileNetV2 model
With embeddings from a custom ML model
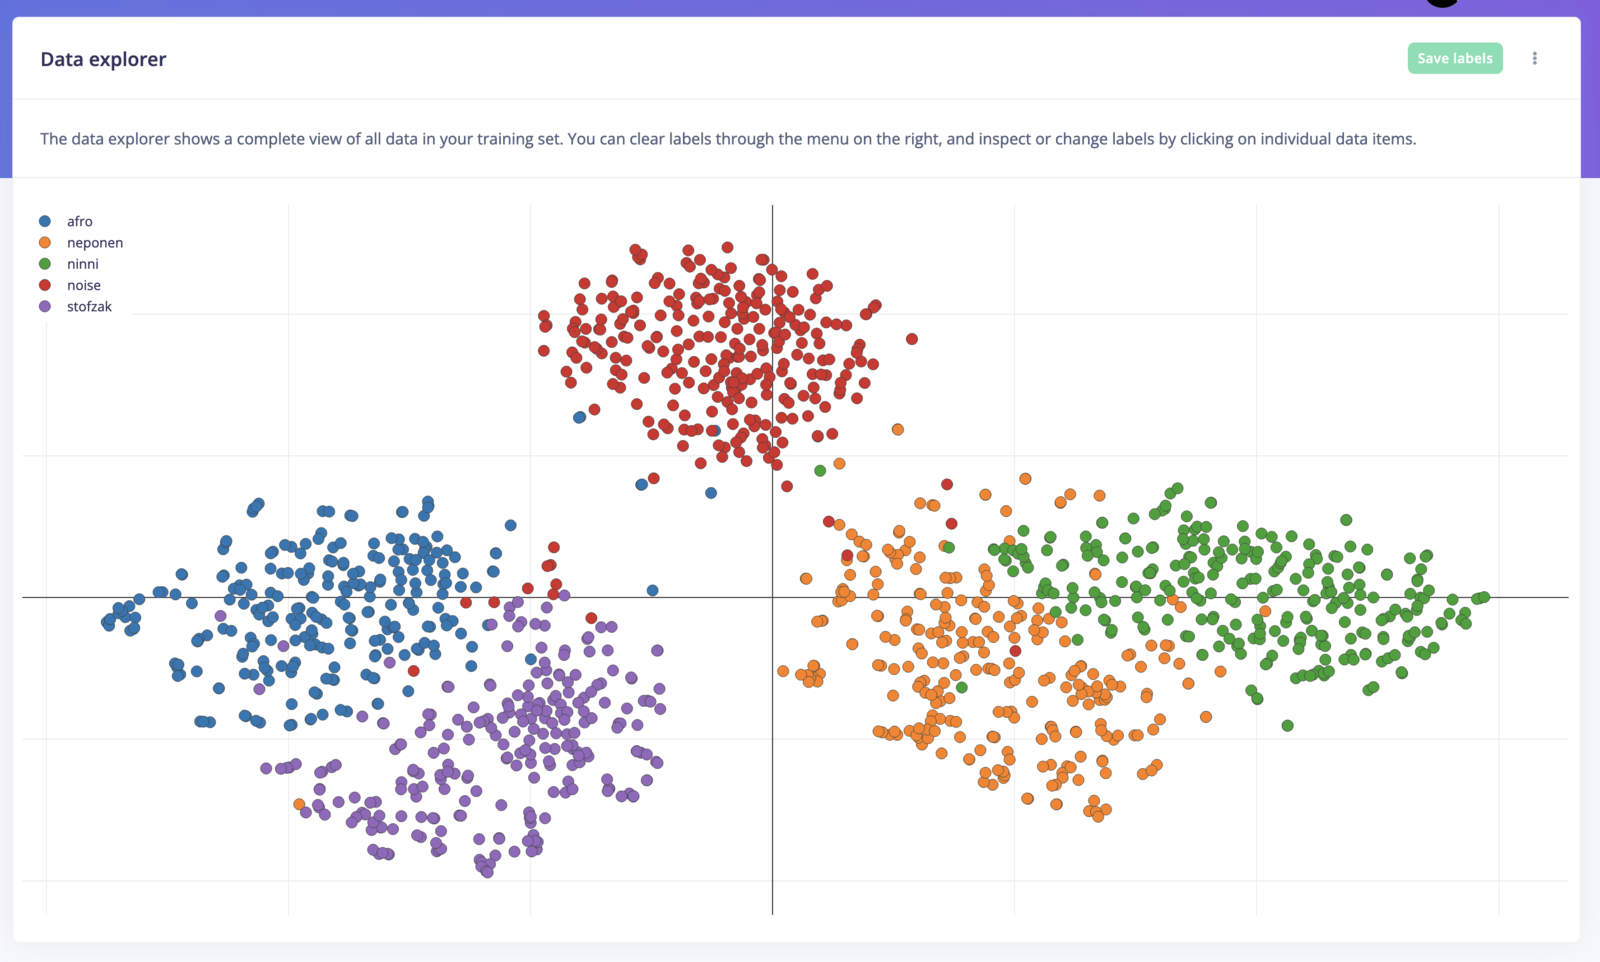
Visualizing a complex dataset of cats with embeddings from a custom ML model