Flatten parameters
Normalize features To enable data normalization, you can use the Normalize features option in the processing blocks generate features tab. This will learn the mean and standard deviation of each output column during the feature generation step, and apply a normalization step during training and inference.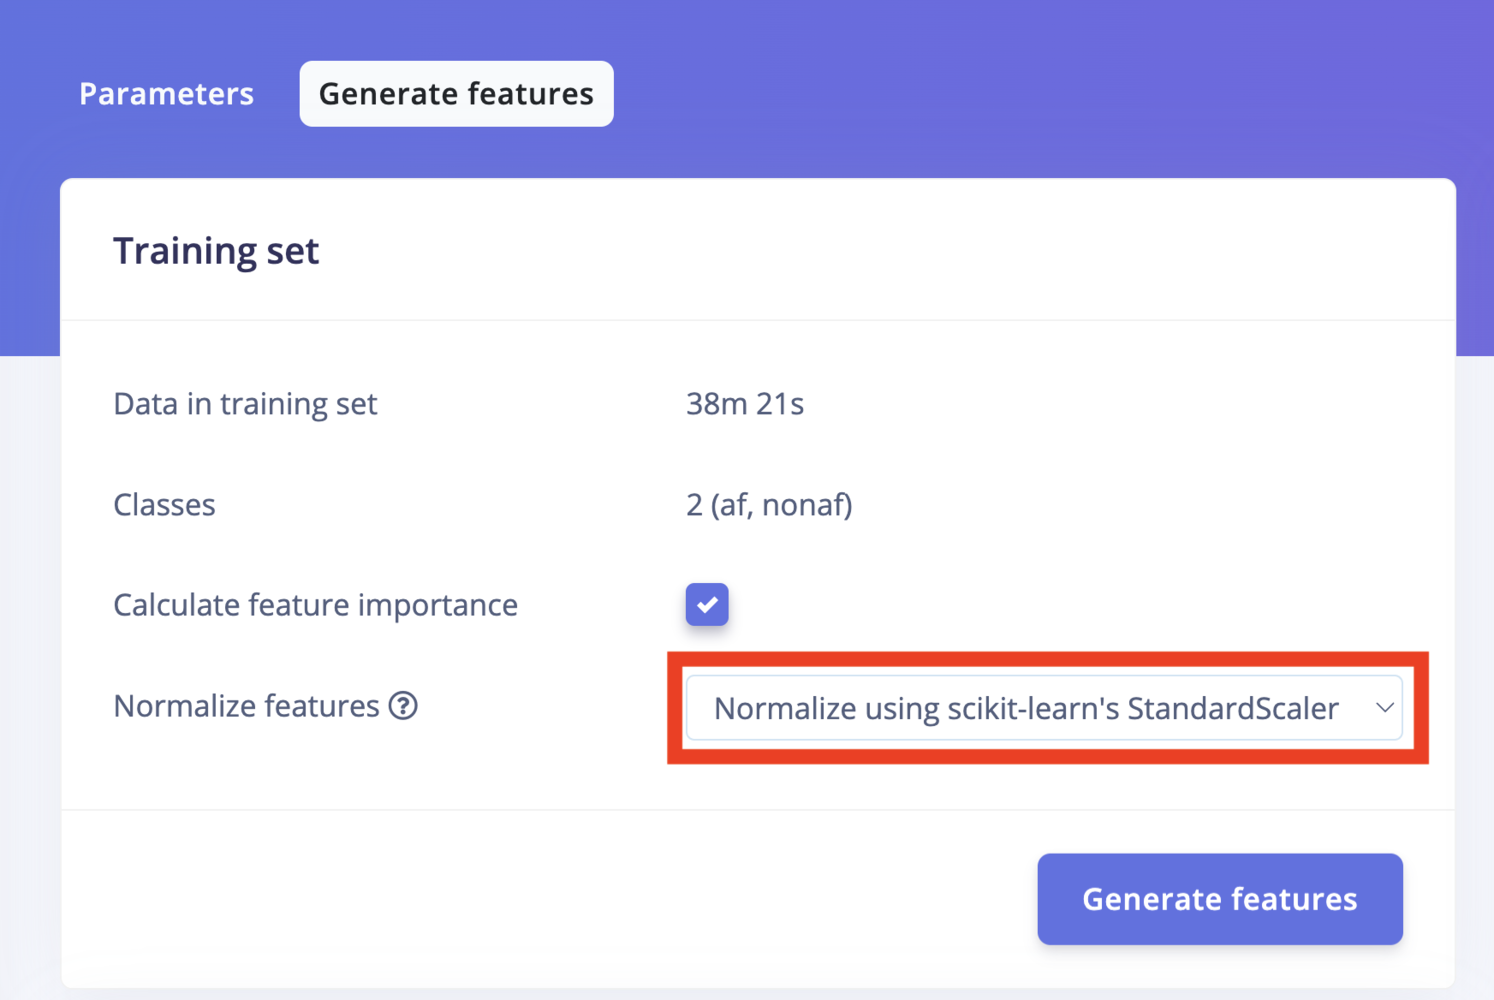
Normalize features
- Scale axes: Multiplies axes by this number
- Average: Calculates the average value for the window
- Minimum: Calculates the minimum value in the window
- Maximum: Calculates the maximum value in the window
- Root-mean square: Calculates the RMS value of the window
- Standard deviation: Calculates the standard deviation of the window
- Skewness: Calculates the skewness of the window
- Kurtosis: Calculates the kurtosis of the window
- Moving Average Number of Windows: Calculates the moving average by maintaining a rolling average of the last N windows. Note, there is no zero padding, the block will accumulate averages up to N windows. (Ex. for the first window in a sample, the moving average will equal the average). The moving average resets for each sample during training, and during inference, when run_classifier_init() is called. Note if you enable this, you probably don’t want overlapping windows for training.
How does the flatten block work?
Flatten concept