Only available on the Enterprise planThis feature is only available on the Enterprise plan. Review our plans and pricing or sign up for our free expert-led trial today.
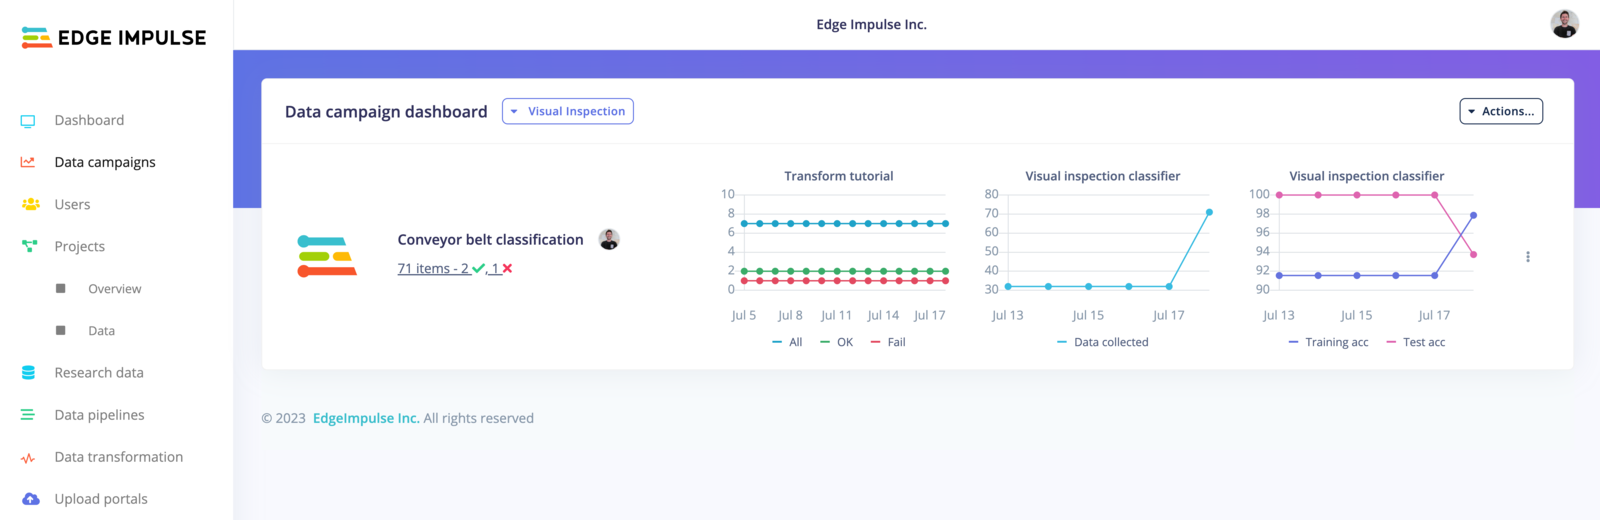
Data campaigns overview
Setting up your dashboard
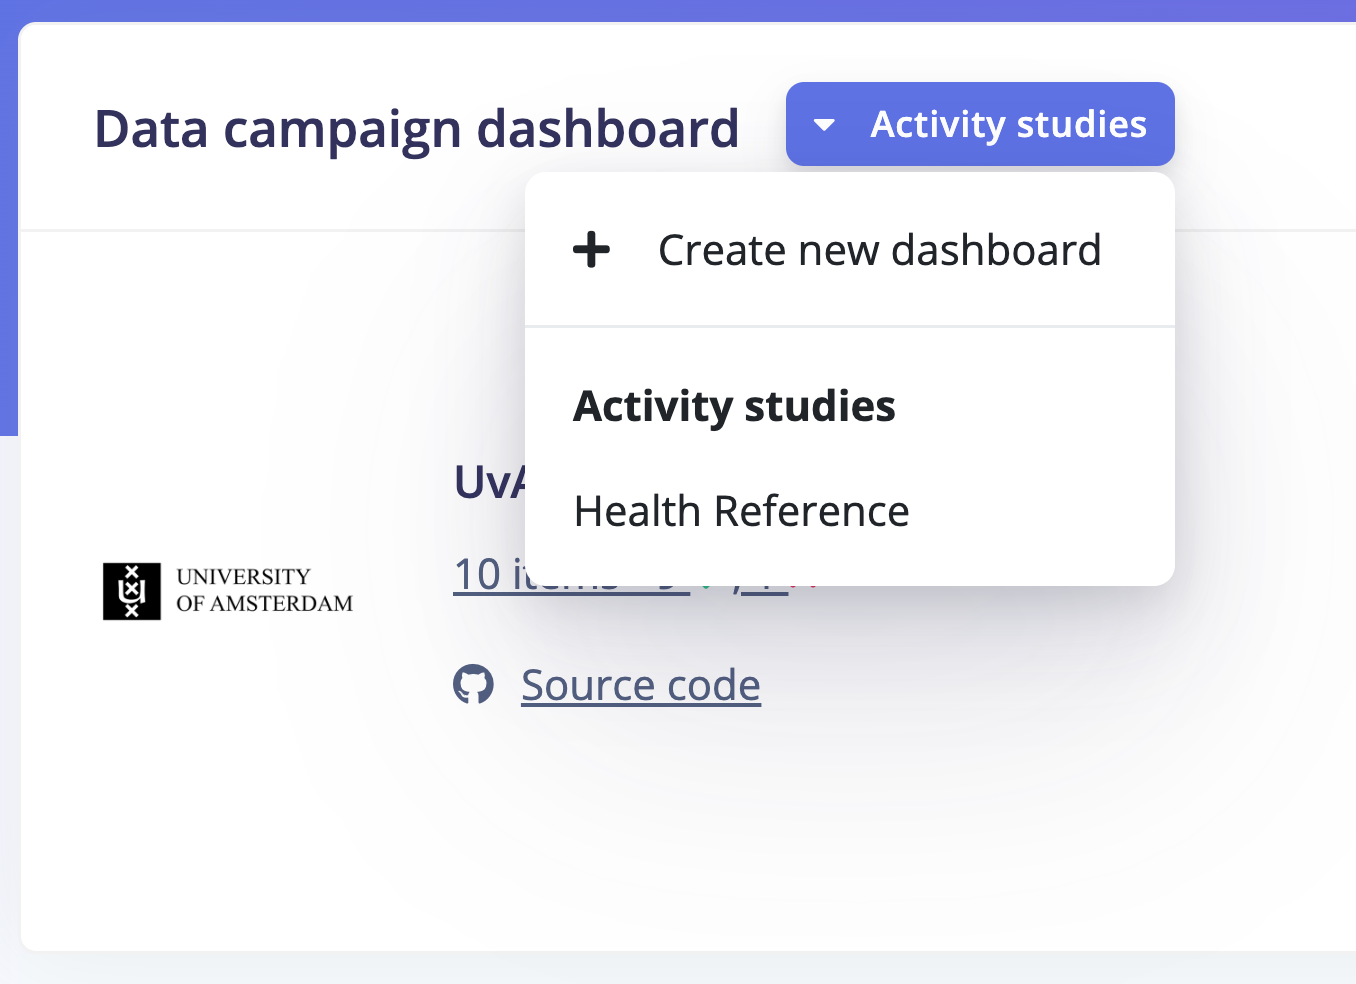
To get started, navigate to the Data campaigns tab in your organization:Data campaigns
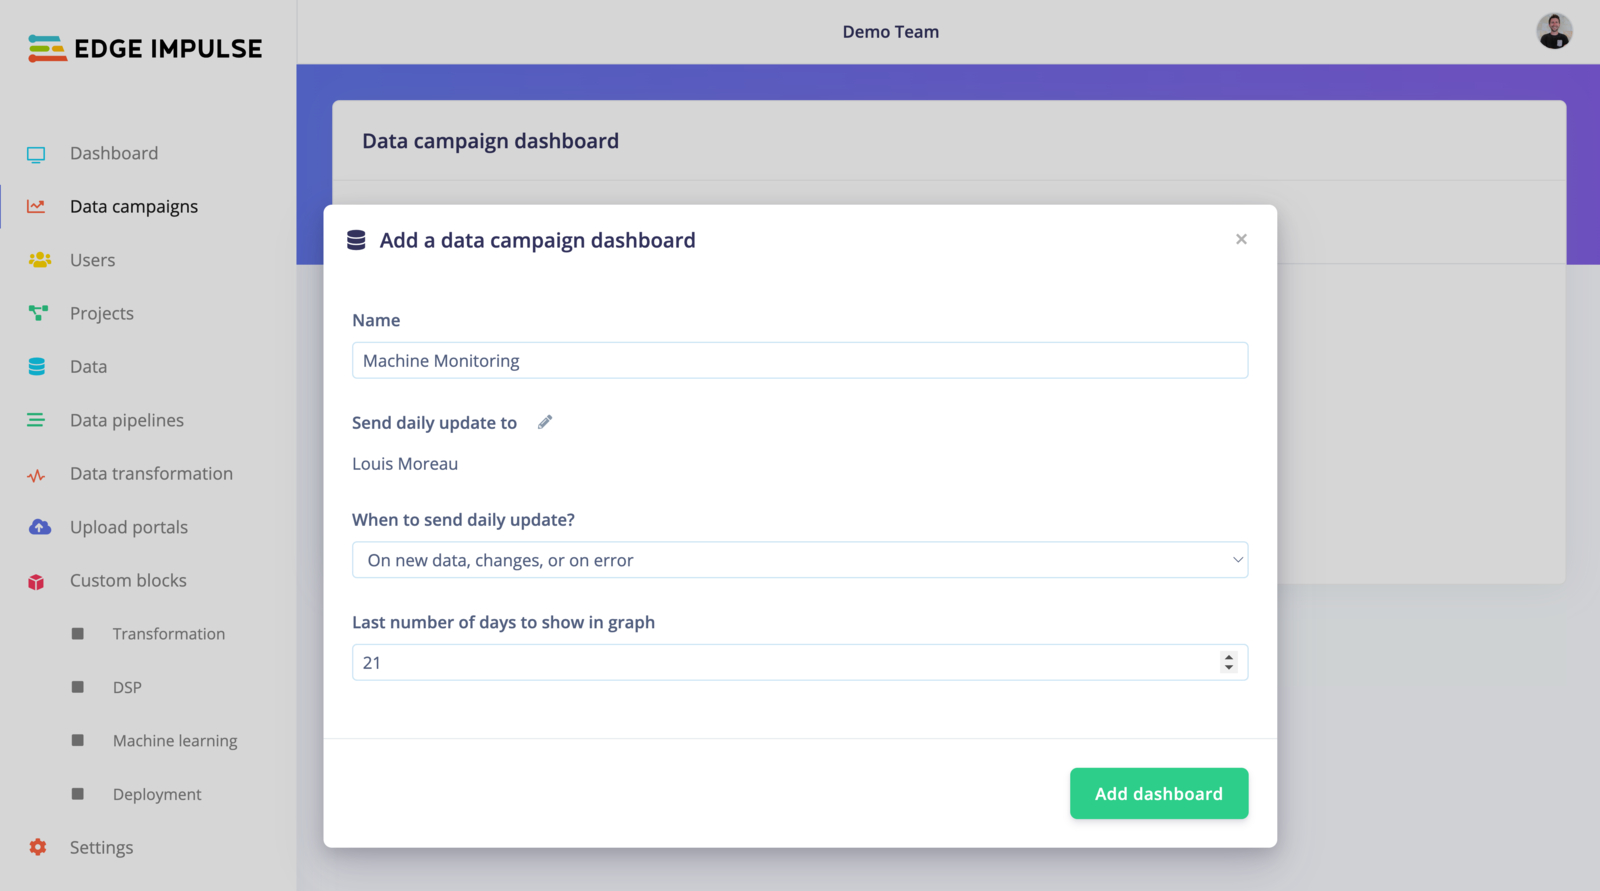
Add data campaign dashboard
Setting up your campaign
Once your dashboard is created, you can add your custom campaigns. It’s where you will specify which metrics are important to you and your use case. Click on Actions… -> Add campaign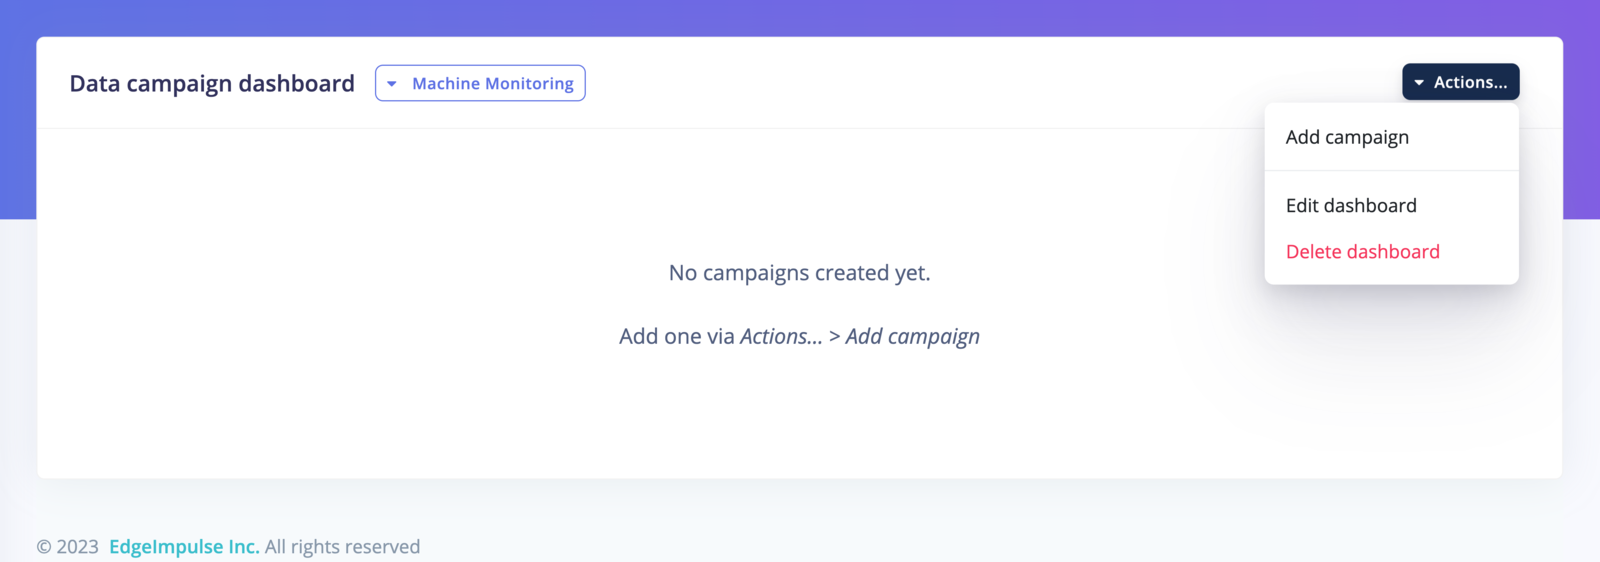
Add data campaign
metadata->age >= 18` will return the data samples from adult patients.
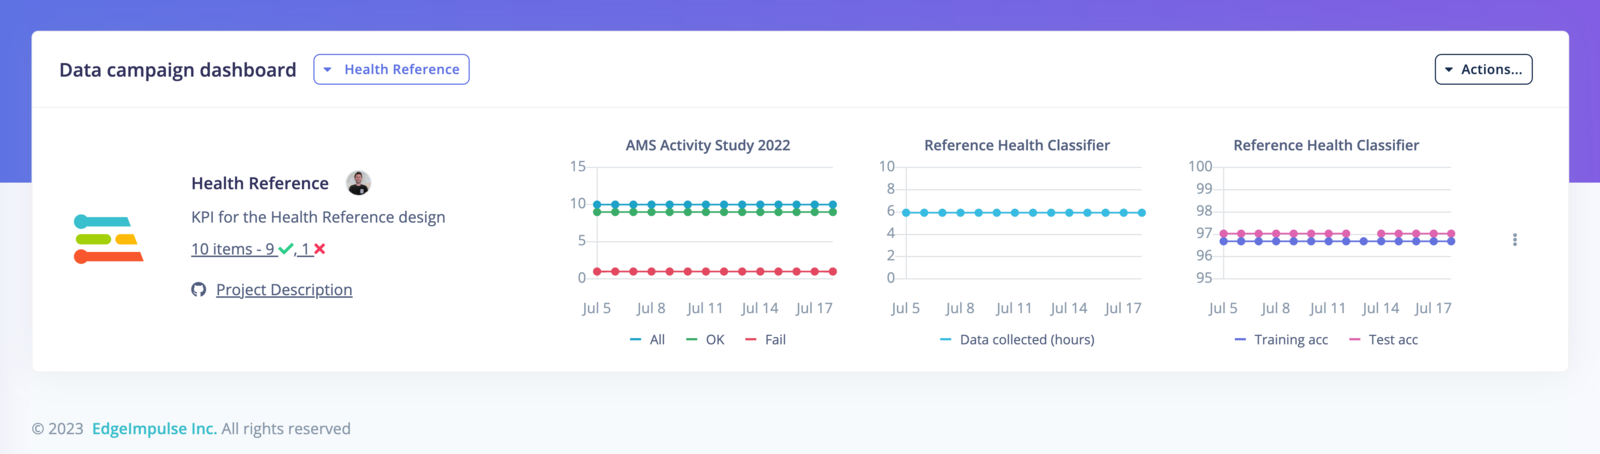
You can then save your data campaign and it will be added to your dashboard:
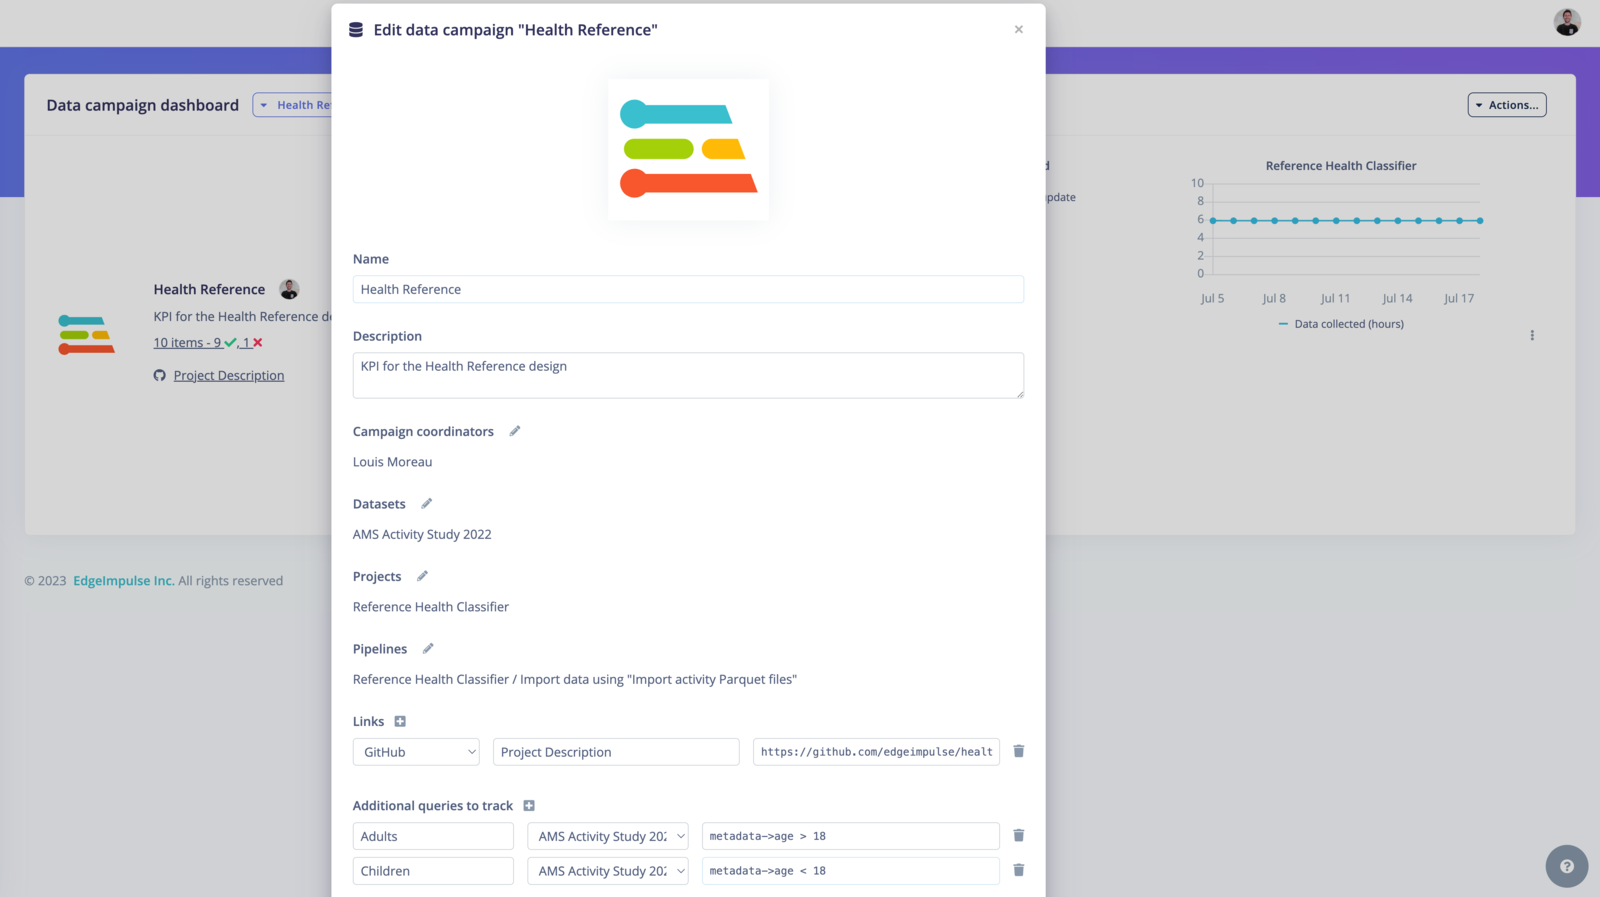
Create or edit data campaign
Create or edit data campaign
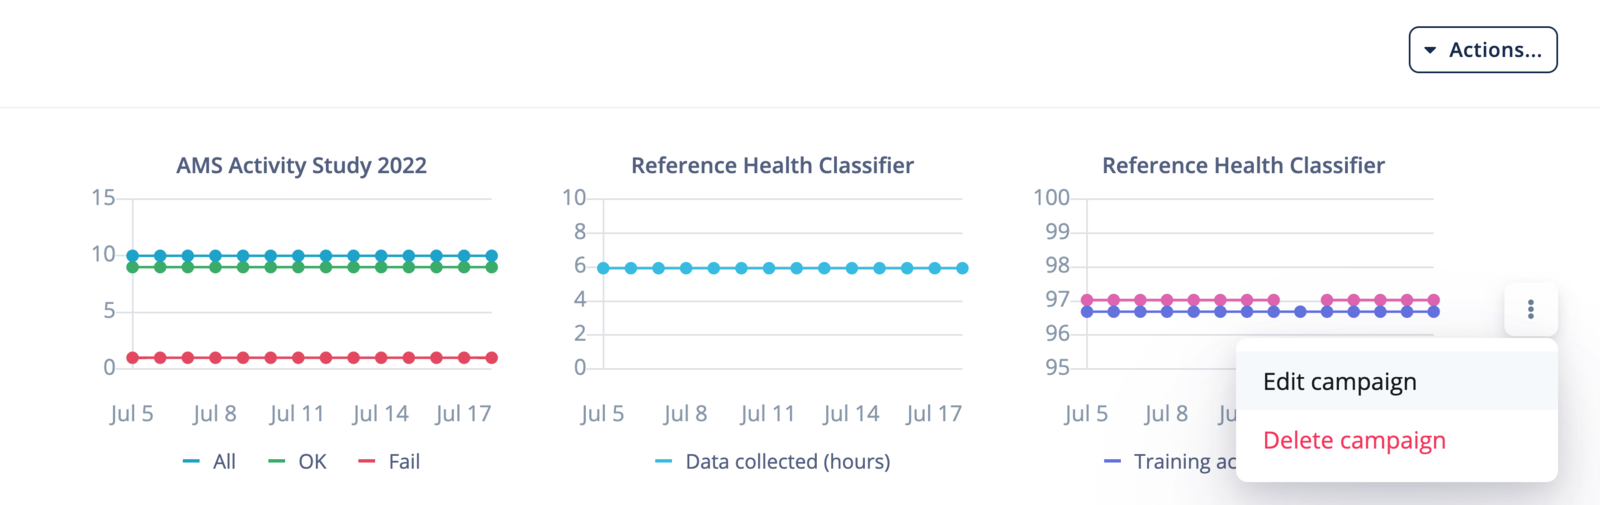
Edit campaign