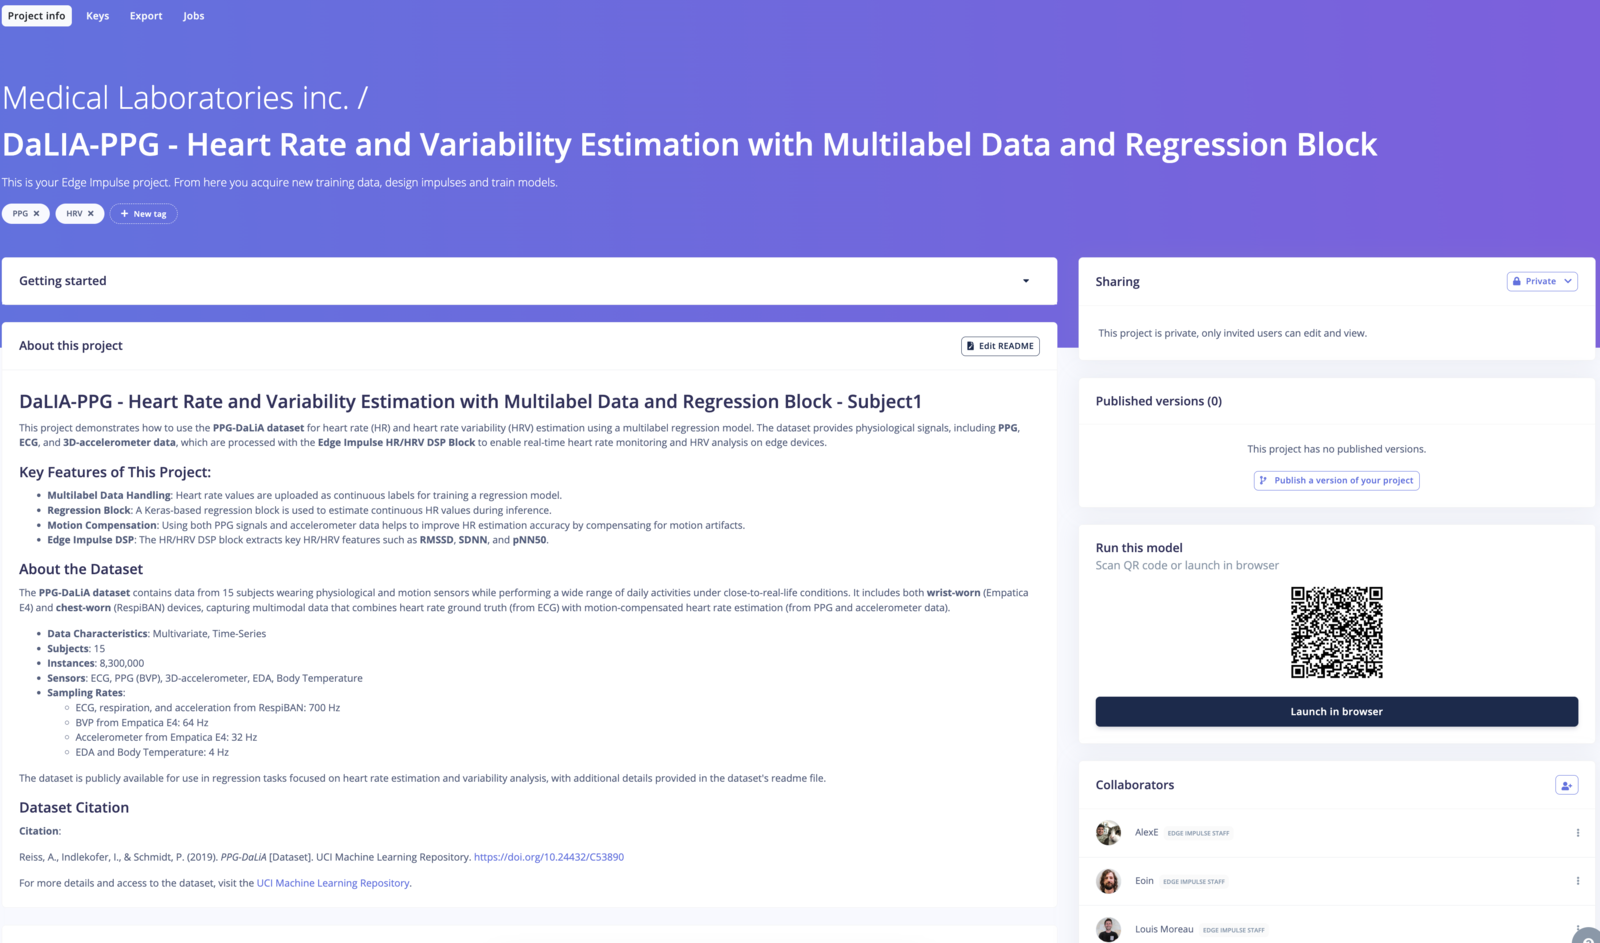
In this tutorial, you’ll learn how to set up the HR/HRV Features block within Edge Impulse Studio to process your physiological data and extract meaningful heart rate (HR) and heart rate variability (HRV) features. These features can be leveraged in various downstream machine learning tasks, such as activity classification, stress detection, and health monitoring. We will extend this section over time with more examples. For this guide, we will be using a subset of the publicly available PPG-DaLiA dataset, which contains data collected from 15 subjects during daily activities. This dataset includes physiological signals such as photoplethysmography (PPG), accelerometer data, and heart rate ground truth, allowing us to explore how the HR/HRV Features block can be applied to real-world data. You can download the DaLIA-PPG dataset or clone the project S1_E4 from the links below:Documentation Index
Fetch the complete documentation index at: https://docs.edgeimpulse.com/llms.txt
Use this file to discover all available pages before exploring further.
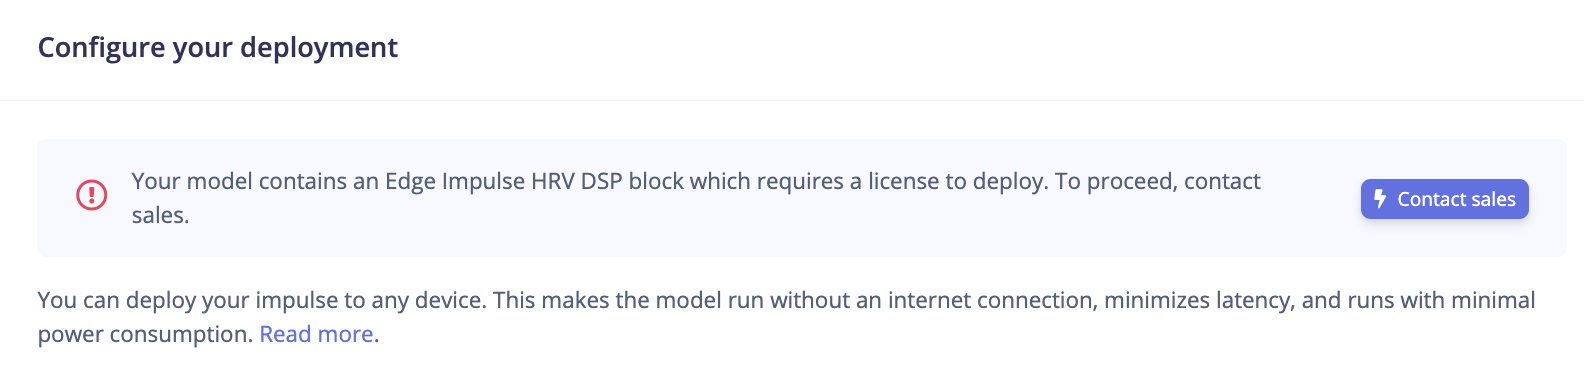
Evaluation available for everyone, deployment only available to Enterprise planAll users (developer and enterprise) can extract HR/HRV features using this processing block for testing purposes. However, the deployment option is only available for Enterprise users. Contact your Solution Engineer to enable it.
Understanding HR and HRV
Heart Rate (HR)
Heart Rate refers to the number of times your heart beats per minute (BPM). It’s a straightforward metric that indicates your cardiac activity and is influenced by factors like physical activity, stress, and overall health.Heart Rate Variability (HRV)
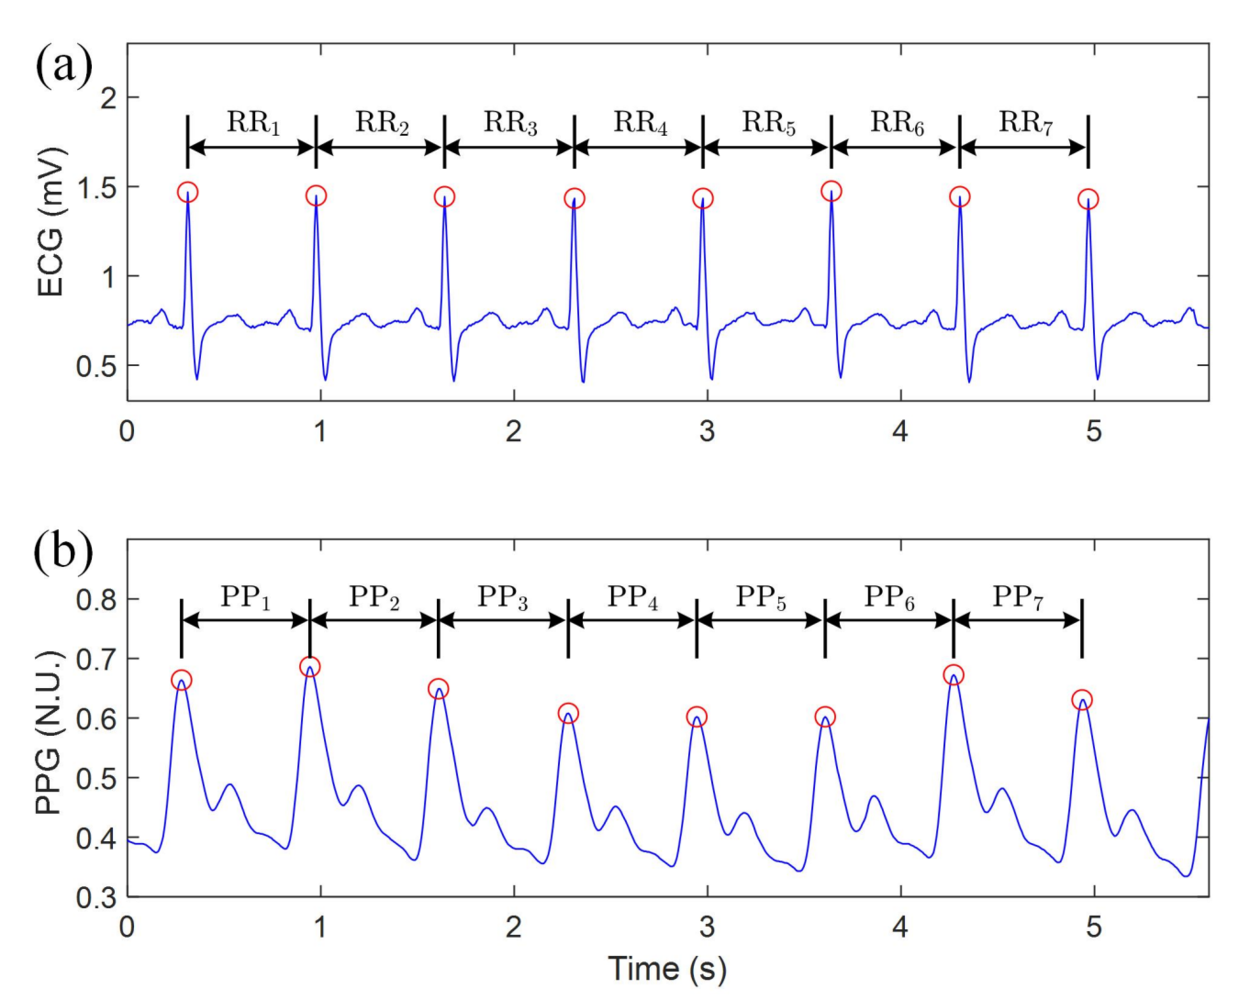
- RMSSD (Root Mean Square of Successive Differences): Reflects short-term HRV and parasympathetic activity.
- SDNN (Standard Deviation of NN intervals): Indicates overall HRV.
- pNN50: Percentage of intervals differing by more than 50 ms, another measure of parasympathetic activity.
Prerequisites
- Physiological Data: You can download a subset of PPG-DaLIA the DaLIA-PPG dataset S1_E4:
Step-by-Step Guide
Step 1: Prepare or Collect Your Time-Series Data
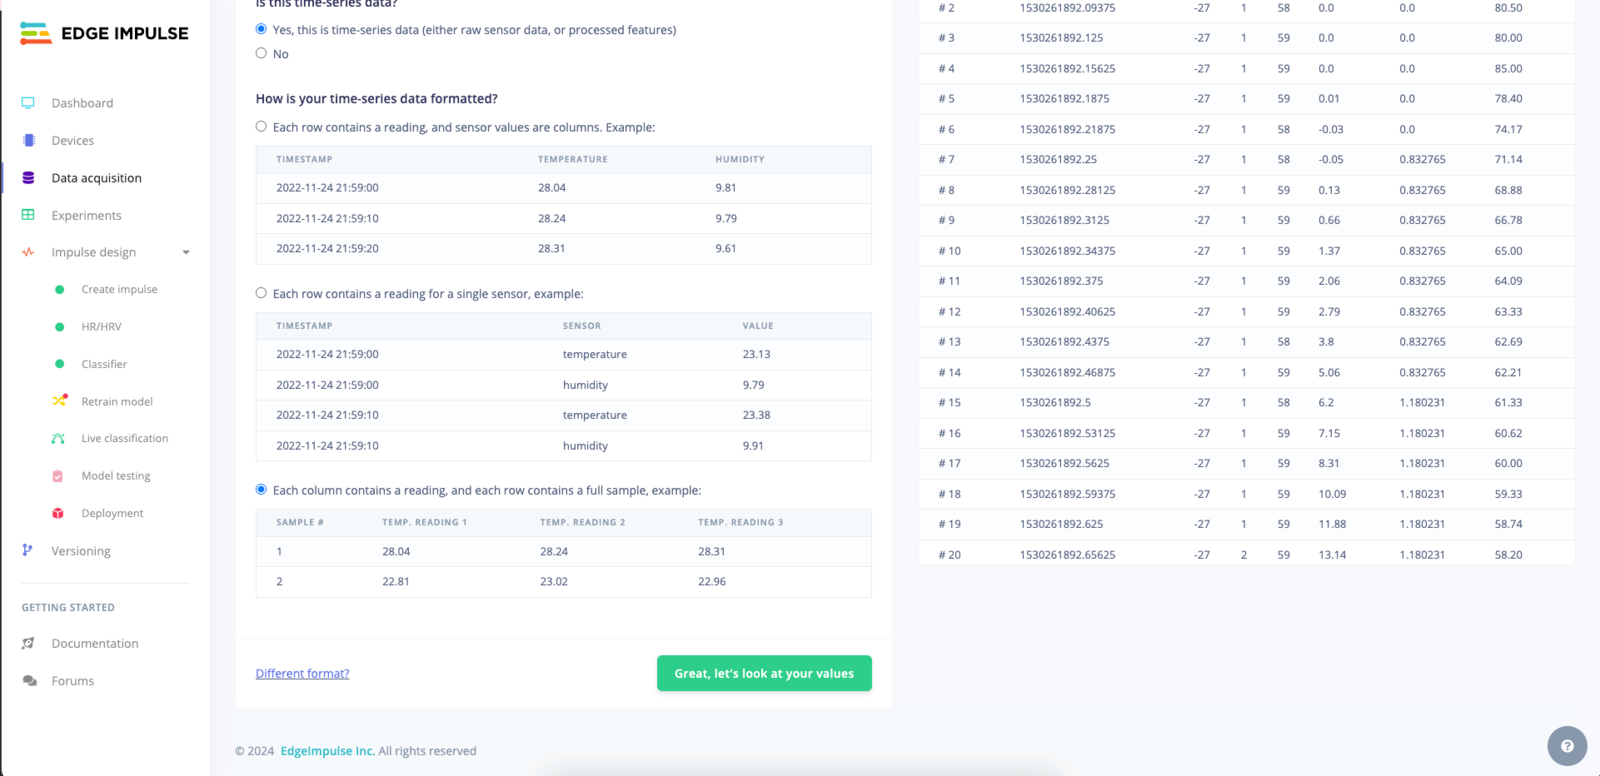
Ensure your CSV file is structured with the following columns:- Time: The timestamp for each data point.
- X, Y, Z: Accelerometer data for motion artifact compensation (optional).
- ECG/PPG: The PPG or ECG signal for heart rate estimation.
- HR: Heart rate value, if available (should be uploaded as a multi-label sample for regression).
- Label: The activity label (optional but useful for classification tasks).
HR Calculation:
Avoid uploading data in short snippets. HR calculation relies on history and feedback to accumulate a continuous stream for better calculation and smoothing. Upload long, contiguous data for the most accurate results.Developer plan users need to use single label and should keep the length to 2 seconds for the best accuracy.
Click to view a sample CSV file structure for HR/HRV data
Click to view a sample CSV file structure for HR/HRV data
Step 2: Upload Data to Edge Impulse
- Log into your Edge Impulse Studio.
- Navigate to Data Acquisition in the left-hand panel.
- Click Upload Data and select your CSV file for each subject.
- Ensure that the data is correctly parsed, and assign appropriate labels for heartrate applicable (e.g., 100, 90, etc.).
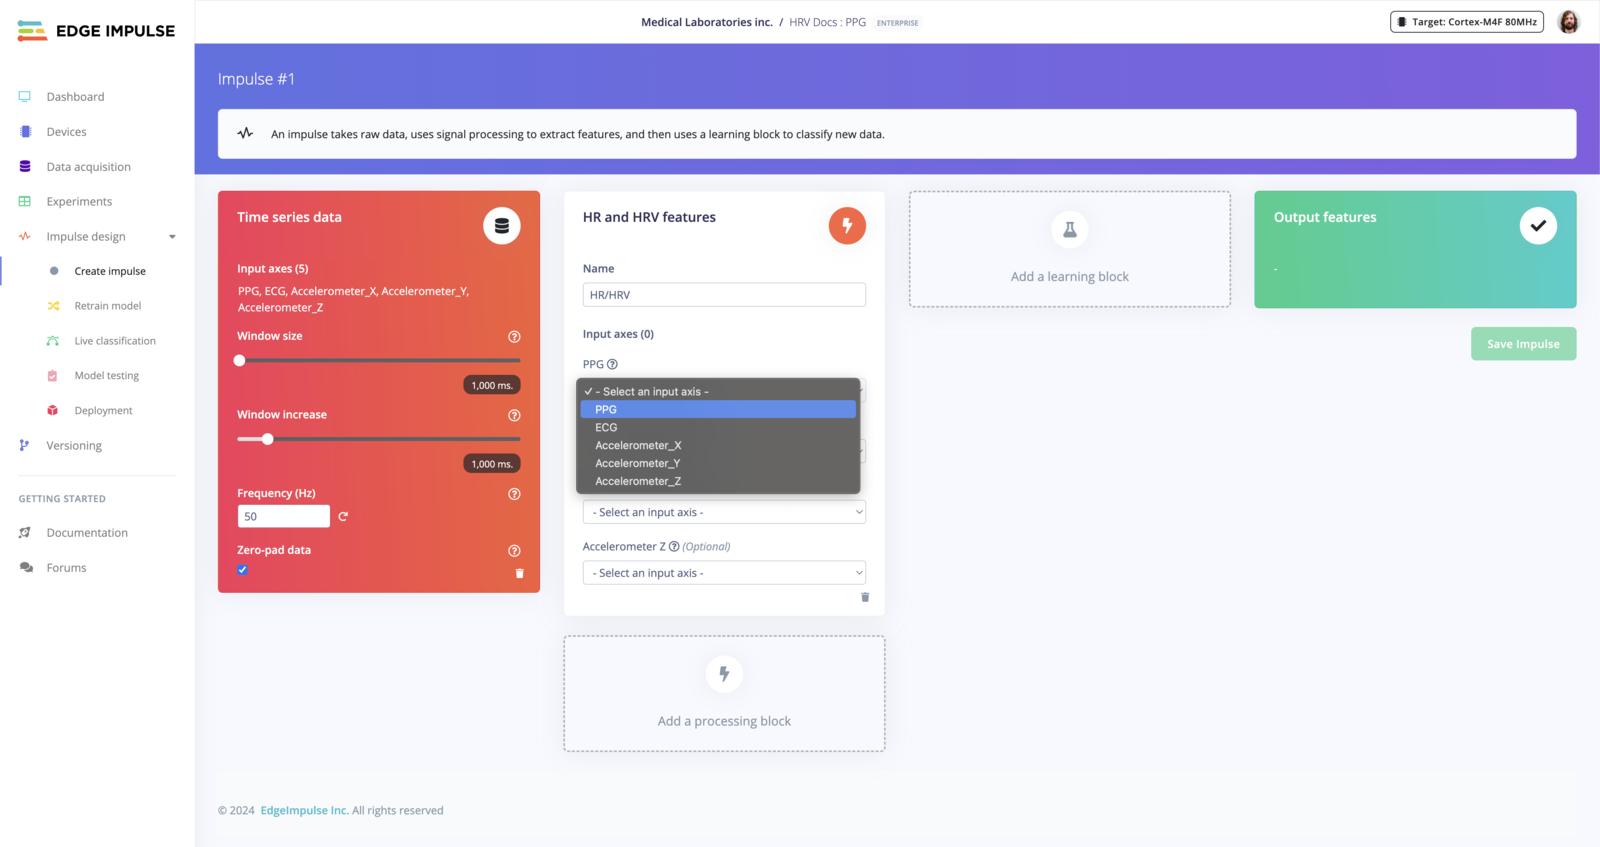
Step 3: Create an Impulse for HR/HRV Processing
- Go to Impulse Design > Create Impulse.
- Add a HR and HRV Features block:
- Input Axes: Select accX, accY, accZ, PPG (if using accelerometer data for motion artifact correction).
- Set Window Size to 2000 ms.
- Set Frequency (Hz) to 25 Hz (tolerance +/- 1 Hz) or 50 Hz (tolerance +/- 3 Hz).
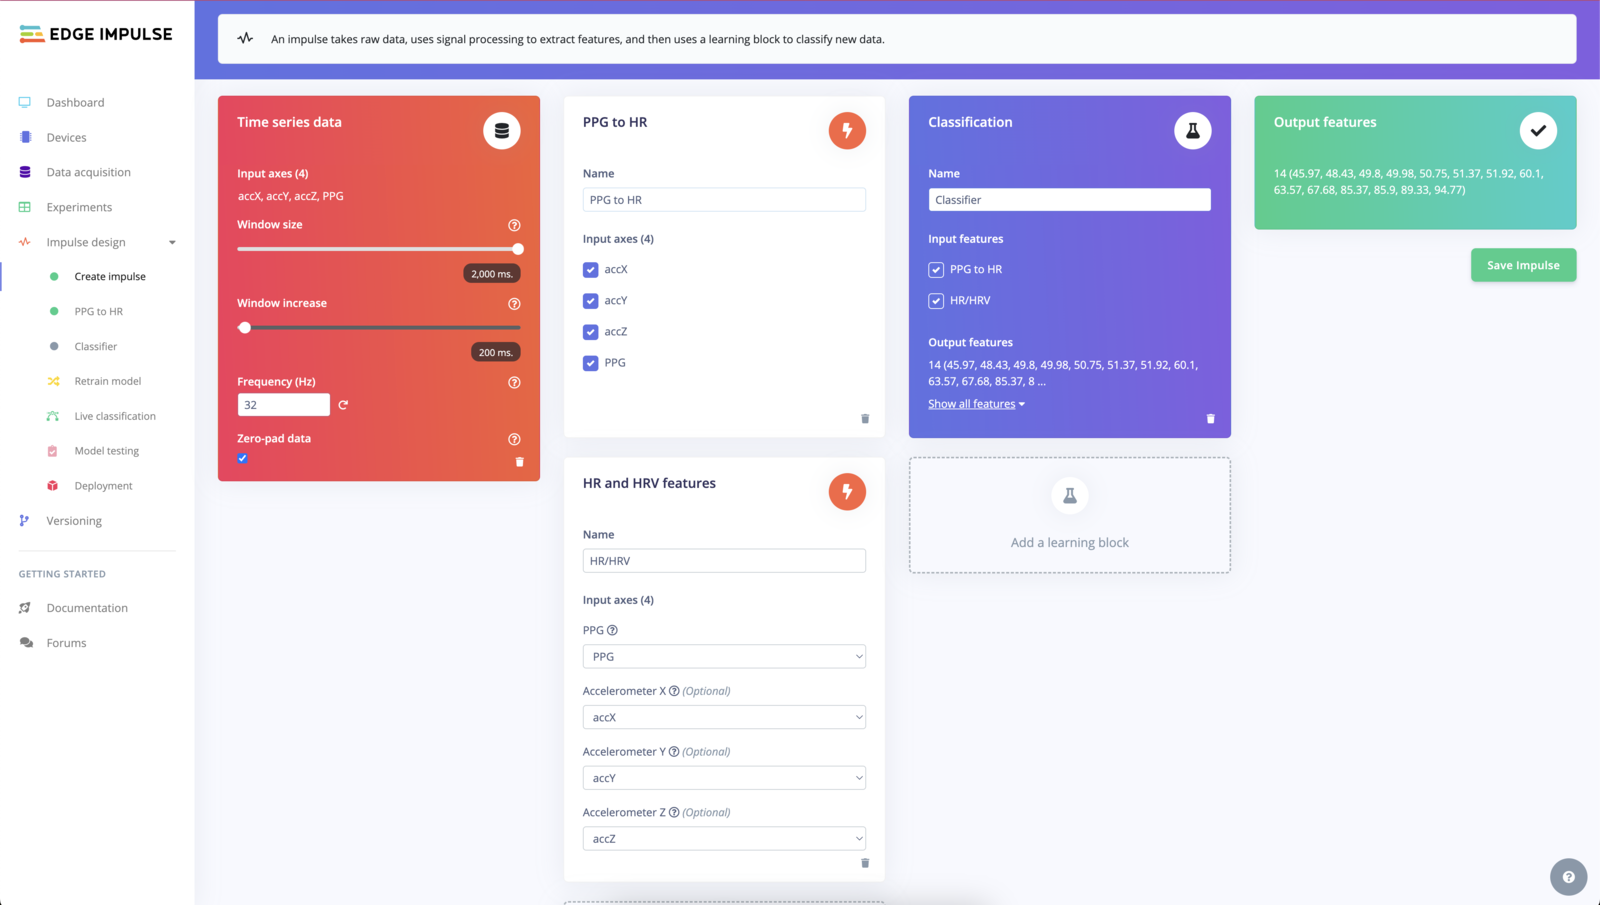
Step 4: Add the HR/HRV Block
- Under Impulse Design, add the HR/HRV Features block.
- PPG Configuration
- ECG Configuration
- PPG + Accelerometer Configuration
- Input Axes: Select your PPG signal for HR estimation.
- HR Window Size: Set the window size for heart rate computation (e.g., 9 seconds, and no shorter than 2 seconds).
- HRV Settings: Enable all HRV features to see RMSSD and other params.

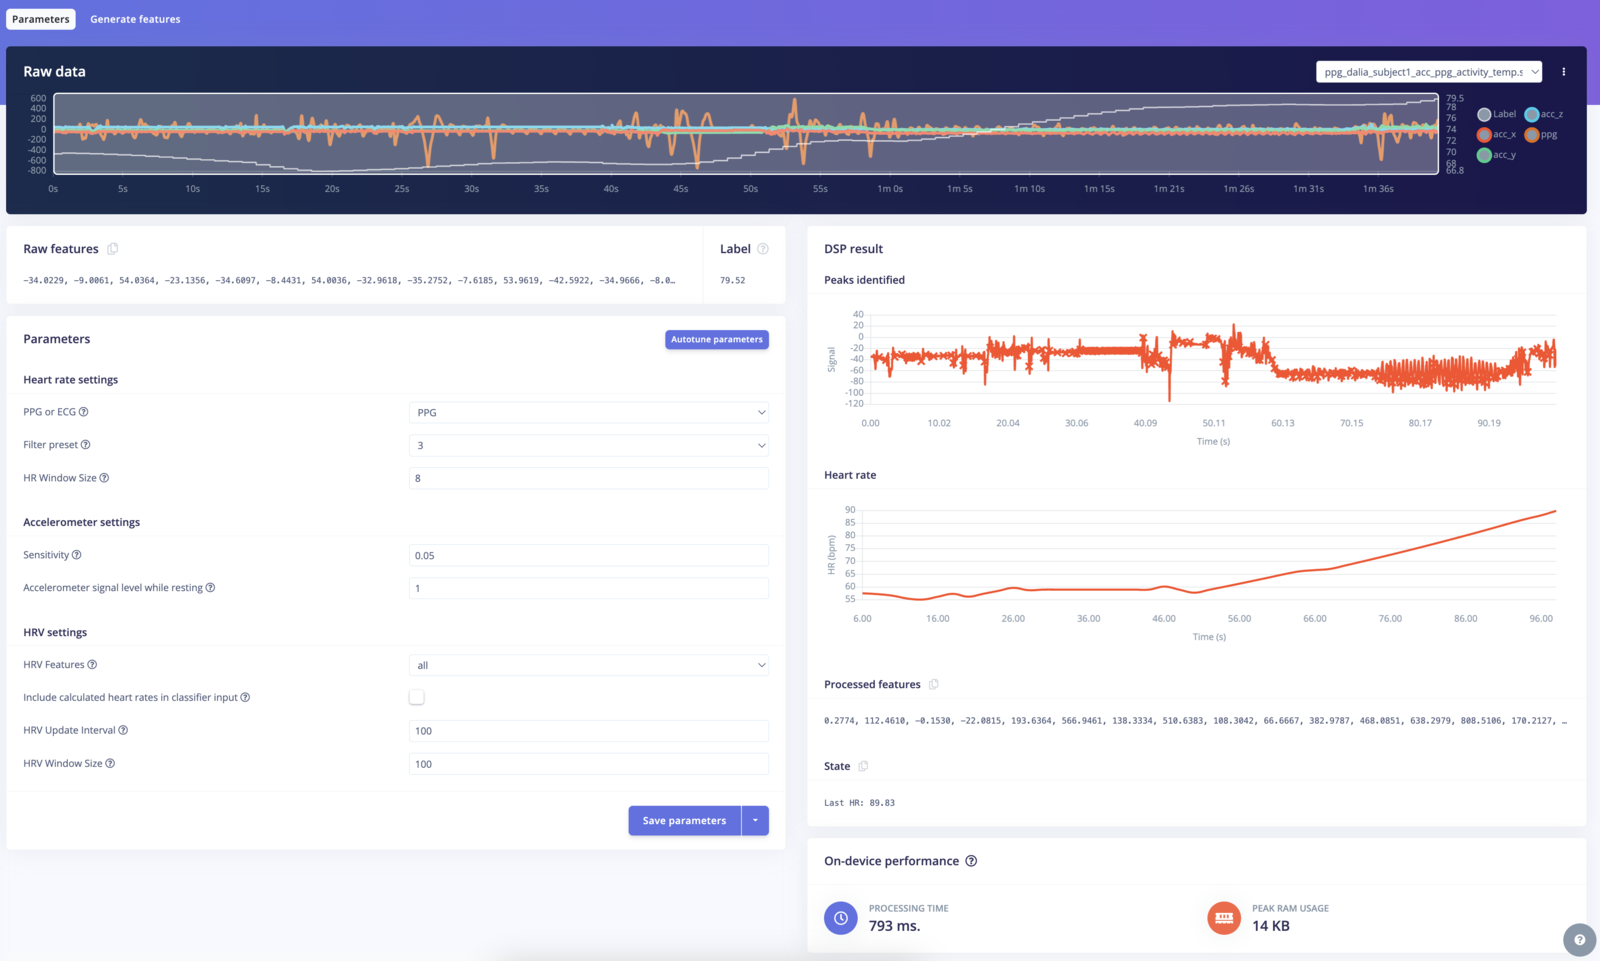
Step 5: Generate Features
- Click on Generate Features from the top menu.
- Review the feature generation output to ensure that the raw signals are correctly processed.
- Edge Impulse will generate the features for both heart rate and HRV over the specified window size.
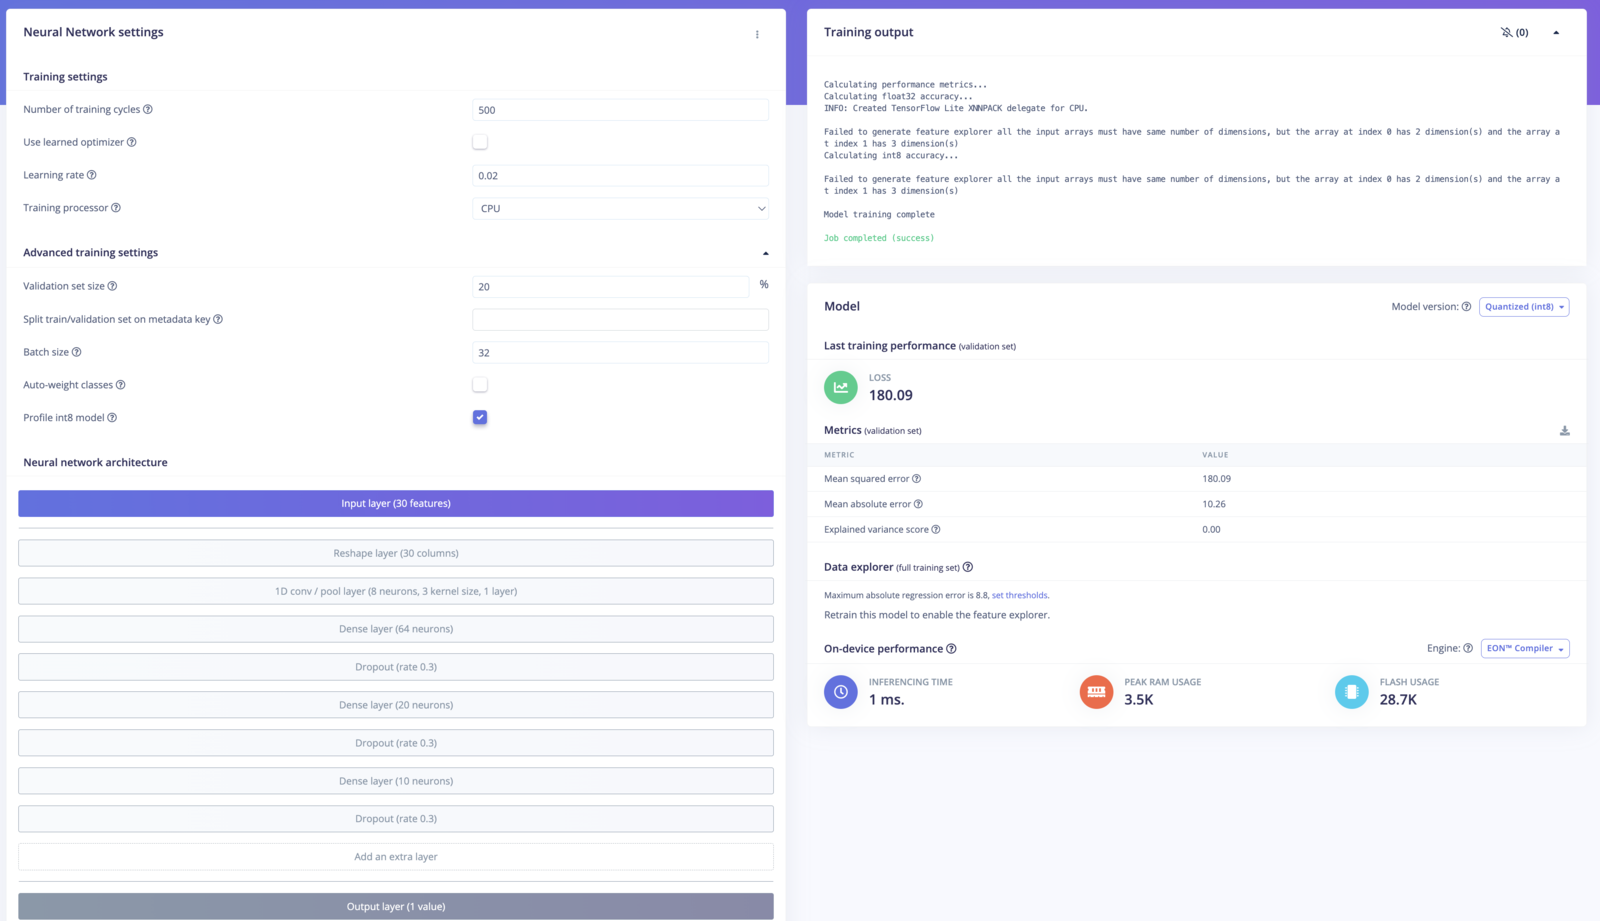
Step 6: Configure the Regression Block
- Add a Learning Block such as a Regression if you wish to estimate HR
- Ensure that HR/HRV is selected as the input feature.
- Train the model using your labeled data to predict different heart rate.
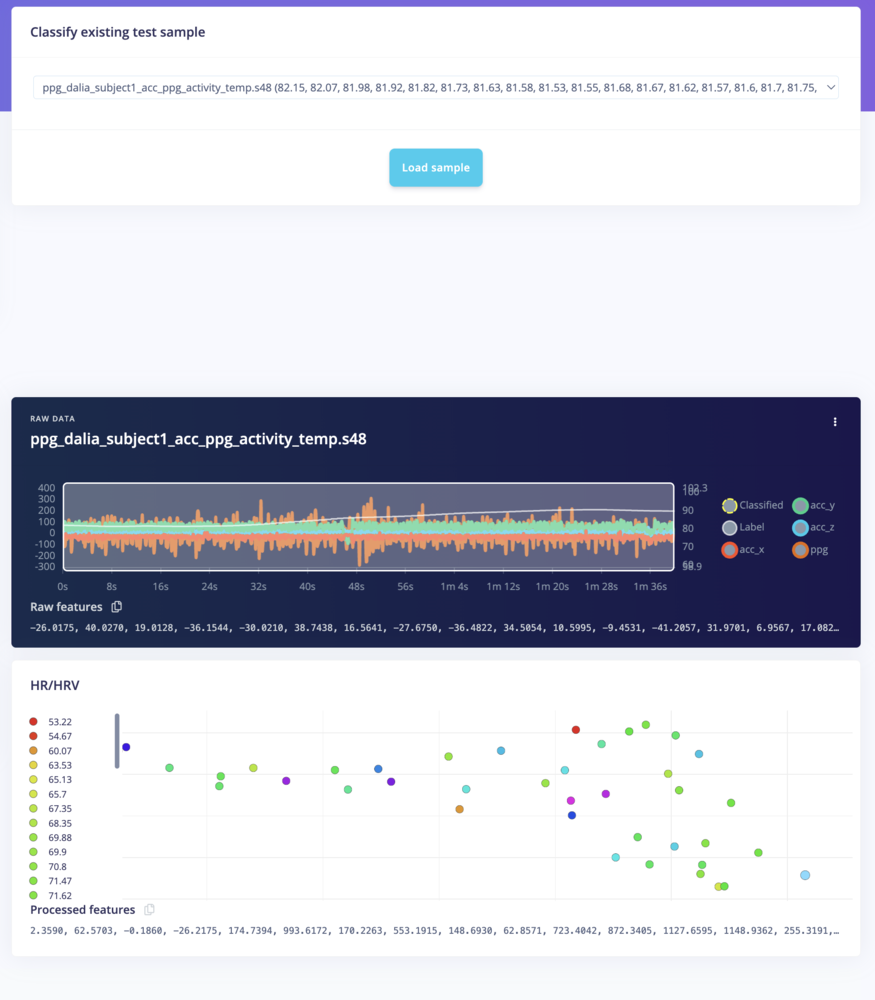
Step 7: Test and Validate the Model
- After training, use Model Testing to evaluate the performance of your HR/HRV feature extraction and heart rate prediction model.
- Upload test data to ensure that the heart rate is correctly estimated and any HRV features are extracted as expected.
Step 8: Deploy the Model (Enterprise Only)
For enterprise users, you can deploy the model to your target device and start collecting real-time heart rate and HRV data. When the model is trained and validated, you can deploy it to your target device or C++ binary for real-time heart rate and HRV monitoring. Deployment will look as follows: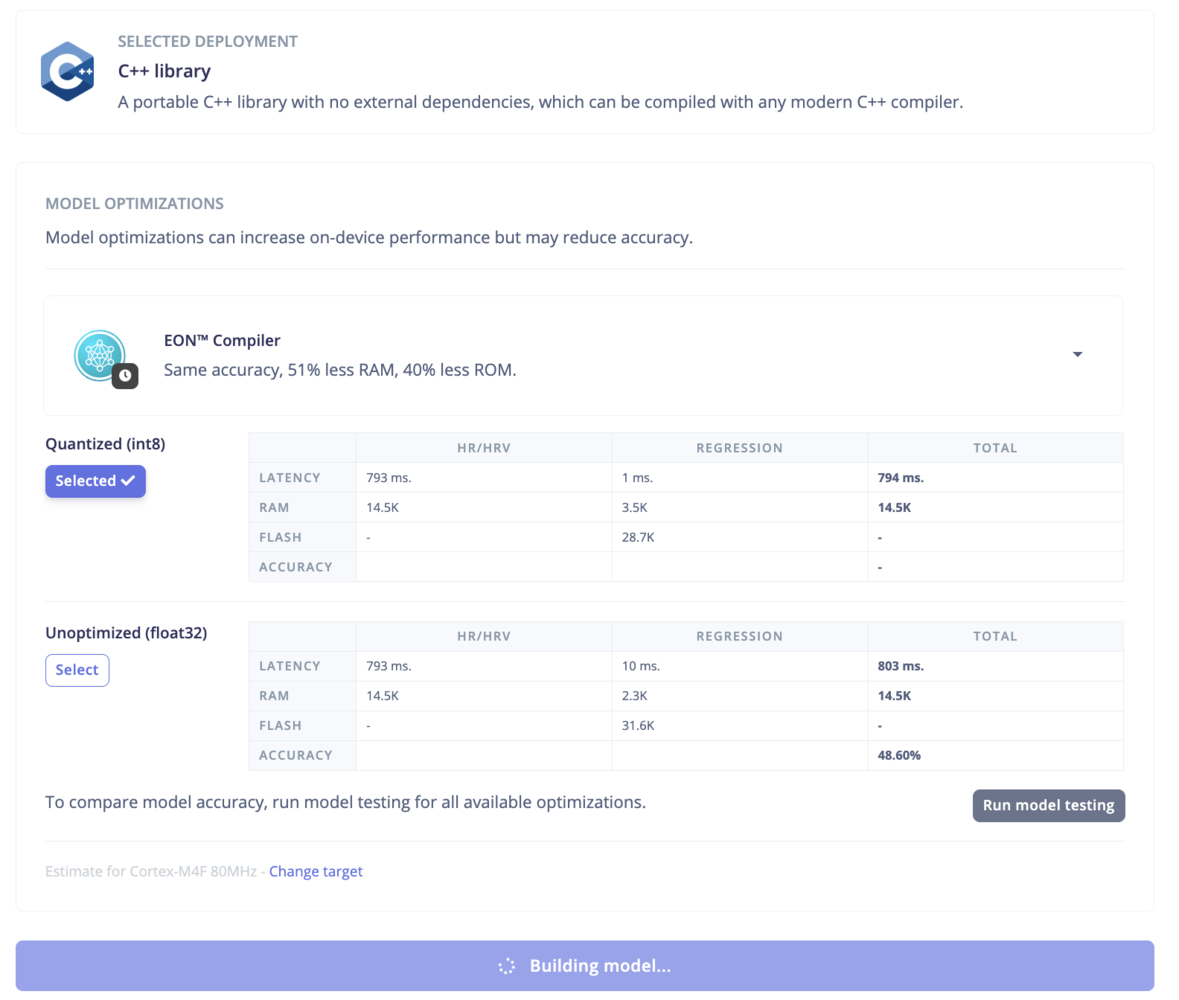
Conclusion
By following this tutorial, you’ve successfully set up the HR/HRV Features block in Edge Impulse Studio, extracted meaningful cardiovascular features, and optionally trained a machine learning model. This foundation enables you to build robust, real-time heart rate and HRV monitoring solutions for applications like health monitoring, stress detection, and fitness tracking.Additional Resources
- Edge Impulse Documentation: HR/HRV Features