Introduction
Inspired by how Benjamin Cabé’s amazing artificial nose can recognize different scents, I thought it would be interesting to find out if it was possible to simulate the tastebuds of a human tongue to detect different types of - more or less - drinkable liquids. This tutorial shows how low-cost water quality sensors, together with WIO Terminal, were used to successfully detect five different liquids with help of TinyML (Tiny Machine Learning).
Use-case Explanation
This project belongs mainly to basic research and thus I don’t have a real problem to solve. However, many ideas have popped up for how the learnings from this project could be taken further for real use:- Use in olfactory (smell and taste) training for patients suffering from loss of smell and taste (see *below)
- Use in wine tasting, for this an additional pH sensor is probably needed
- Use in water quality verification, e.g. for waste water treatment
Sensors Used in this Project
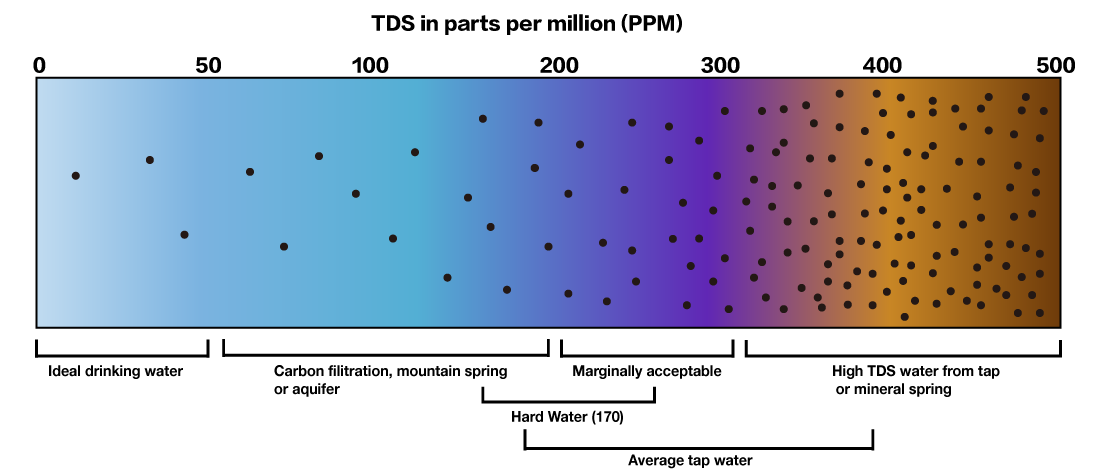
The two sensors that are used in this project are (see next chapter for further links):- Grove TDS Sensor
- Grove Turbidity Sensor
Components and Hardware Configuration
Components
Required
- Wio Terminal, SKU 102991299
- Grove - TDS Sensor/Meter For Water Quality, SKU 101020753
- Grove - Turbidity Sensor, SKU 101020752
Optional but Recommended
- Wio Terminal Chassis - Battery (650mAh), SKU 103990564
- 3D-printer to print tongue and case
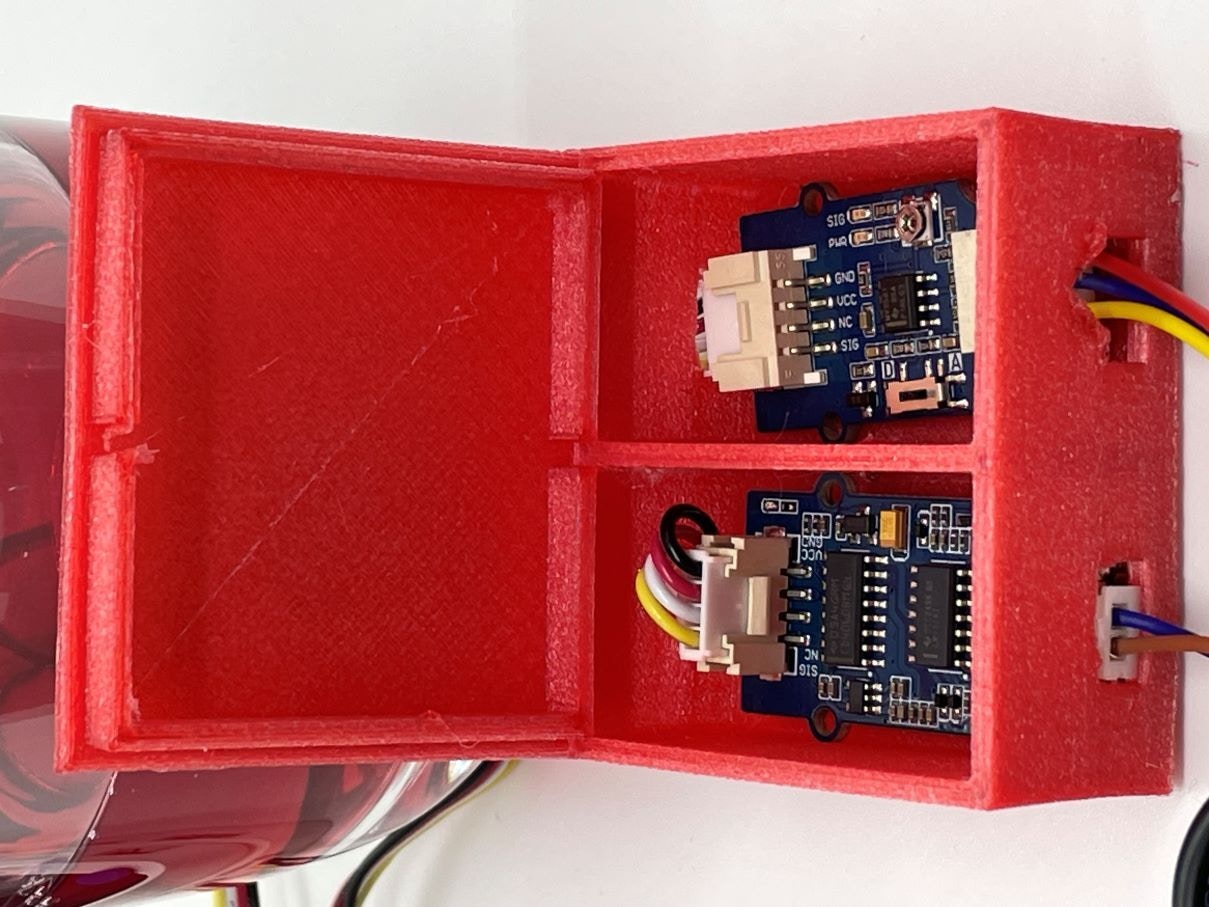
- While PETG- or PLA-filaments also work, TPU-filament is recommended due to its softness and flexibility. For example, the case and the lid for the PCB boards fits perfectly together as they can be squeezed a bit when attaching to each other.
- If you don’t want to 3D-print a case for the PCB boards, at least put them in separate match boxes or similar to minimize the risk of liquids dropping on them. Electronics and liquids don’t play well together…
- The Turbidity sensor has holes on the top, so it’s not water tight = do not immerse it completely in liquids. By a 3D-printed tongue, or by your own sensor case design, the sensors can be held at proper depth and thus minimizing the risk that the turbidity sensor breaks due to liquids inside it. Make it almost fool-proof by also putting hot glue or adhesive putty (Blu tack) on the holes.
Hardware Configuration
- Put the PCB boards into the 3D-printed case first
- Connect the cable for the TDS-sensor to Grove port A2, and the cable for the Turbidity sensor to Grove port A4 on the battery chassis
- you can of course use any other analog port as long as you change the relevant defines in the code (
#define TDS_Pin A2and#define turbidity_Pin A4). If not using Grove ports or the battery chassis, you can use the 40-Pin GPIO Header at the back.
- you can of course use any other analog port as long as you change the relevant defines in the code (
- Double-check the connections
3D-printing the Tongue and the PCB Case
- The different STL-files are found at the GitHub repository
- I used TPU-filament (from CCTree) for the first time and was surprised that it worked without issues on my budget Bowden-tube equipped 3D-printer. I did not dare to go full speed (100 mm/s), instead I used a moderate 50 mm/s, and a temperature of 220 °C. Print with high quality, I chose the max quality of 100 microns (0.1 mm), which made the printer work for hours with each part.
- No support is needed, a brim or raft is recommended though. TPU-filament sticks better to the print bed than PLA, so a heated bed is probably not necessary, my printer does not have one.
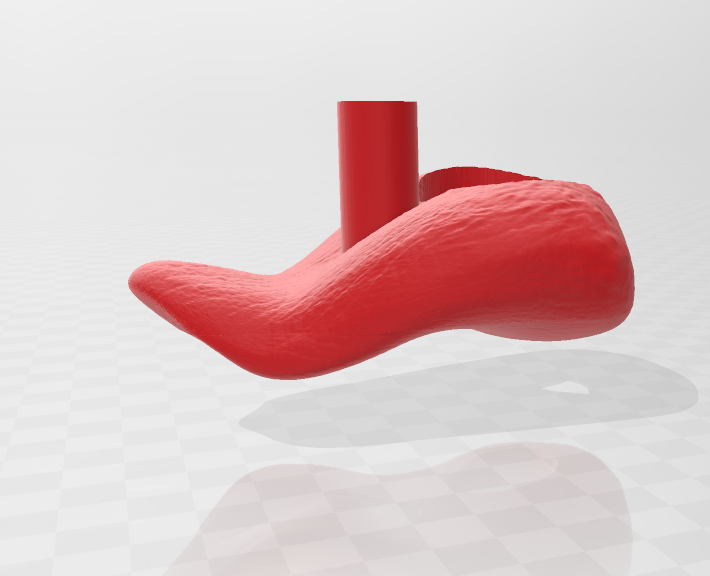
- The “tongue” is split in two parts, the bottom part is not strictly needed, but provides some protection when the equipment is not in use, and makes it look more like a real tongue! If you are printing with very flexible TPU-material, you might want to make the bottom part a tad thicker than in the design files.
Installing Software
To be able to gather data, and later to test the setup in practice, you need to prepare the WIO Terminal:- Follow the steps in this tutorial
- Add following libraries through the Arduino IDE via
Sketch > Include Library > Add .ZIP library:- ei-tongue-arduino-1.0.2.zip
- If using the battery chassis, and you want to see the battery status: SparkFun BQ27441-G1A LiPo Fuel Gauge Arduino Library
- Visit Seeed_Arduino_Linechart and download the entire repo to your local drive. Then add the .ZIP-file as above
Data Collection Process
To collect data using Edge Impulse, there’s only a few steps to take: Preparations- Find at least two liquids, e.g. tap water and sea water. Do not use any liquids that might damage the sensors like oil, acids, or very corrosive liquids.
- After you have immersed the sensors in a liquid, rinse them carefully with water and wipe them dry.
- Compile and upload the main program Tongue.ino to your WIO Terminal
- This program is used both for collecting data, and later for inferencing. The program writes sensor data to the terminal which will be collected by the data forwarder in next step.
- Use the Edge Impulse data forwarder, force the frequency to be 5 Hz by
edge-impulse-data-forwarder --frequency 5- When you see this message
2 sensor axes detected (example values: [3,1.79]). What do you want to call them? Separate the names with ',':, typeTDS, Turbidityas these are the sensor labels used in the program. - More info about how the data forwarder works can be found here.
- When you see this message
- Head over to Edge Impulse, create a project if not already done so, and go to
Data acquisition
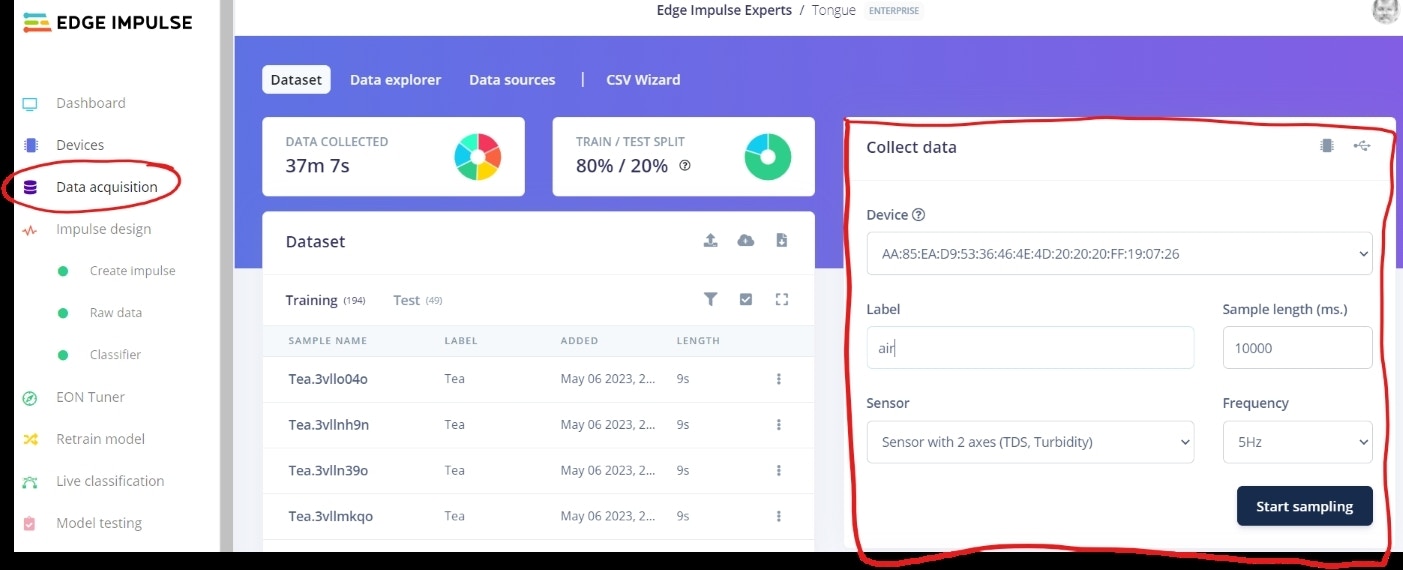
- Your device should now be visible on the right side.
- Use a sample length of 10000 ms (= 10 seconds), the frequency is automatically 5 Hz as you forced it to be in the preparation steps.
- The first label you should record data for is
airthat is, do not immerse the sensors in any liquid, just keep them in the air.- It is often necessary to have a label that serves as other or background. In this case the label
airis even “hard coded” in the program, but the program will technically work fine even if you don’t useairas the label.
- It is often necessary to have a label that serves as other or background. In this case the label
- Click on
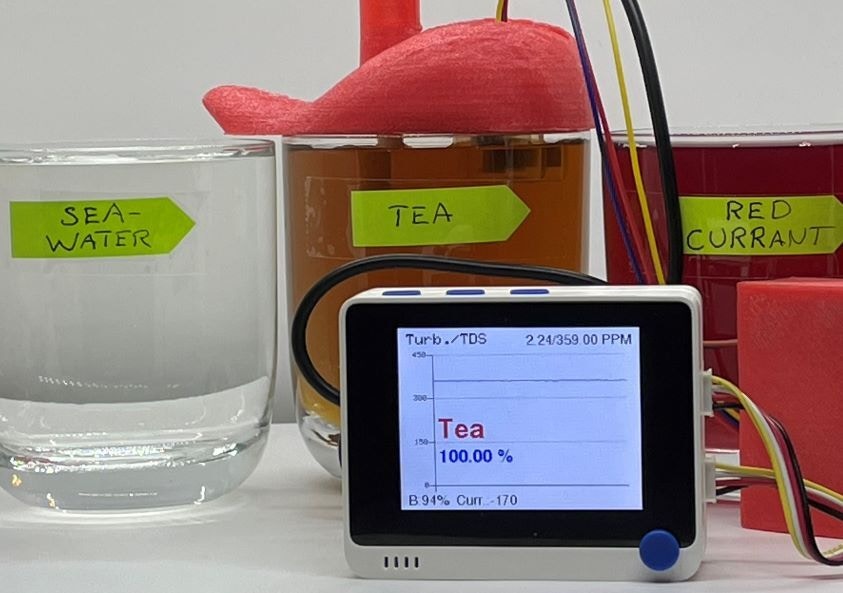
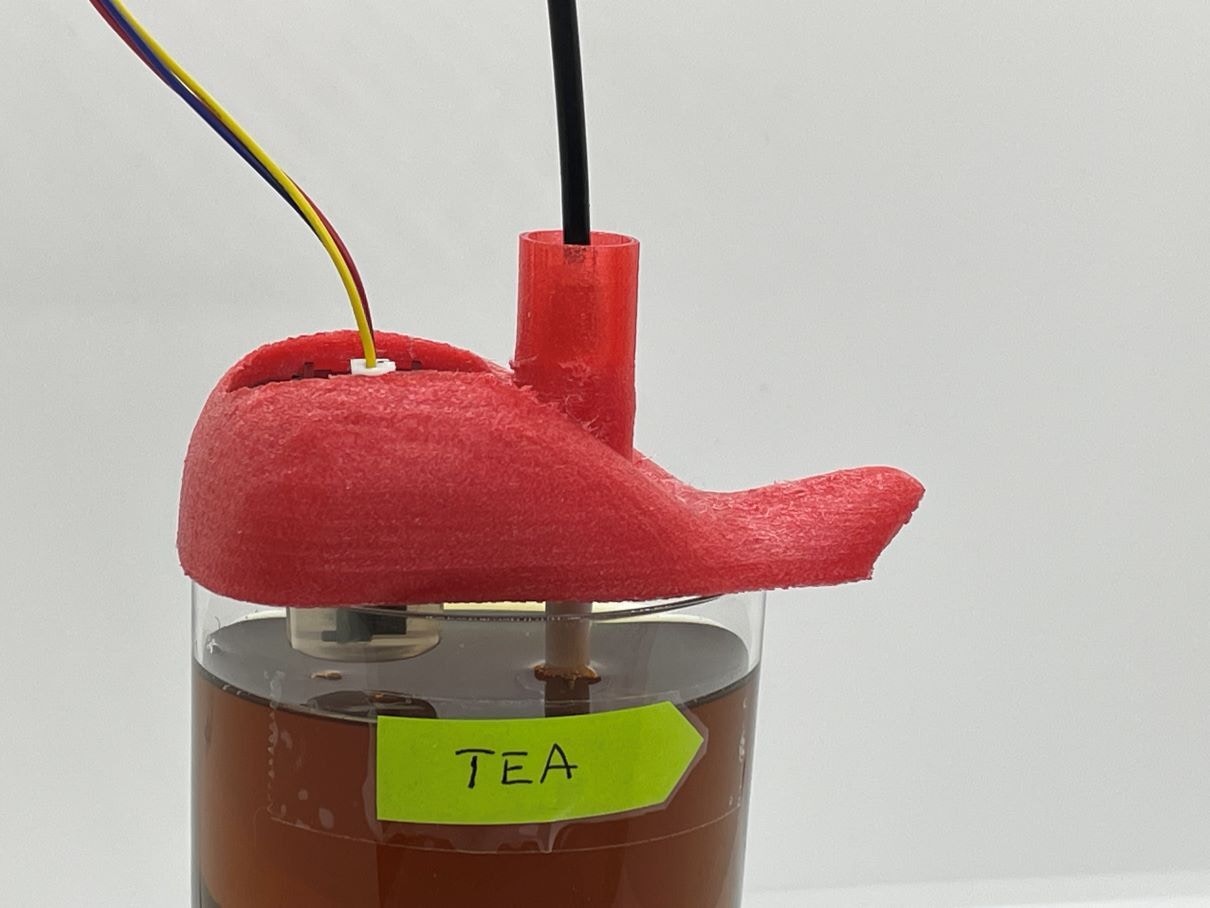
Start samplingto collect data, I collected roughly 6 minutes of data for each label, but I recommend you start with a minute or so for each label. Machine learning is most often an iterative process, so start small and adjust if needed. - When collecting data from liquids, ensure the sensors are immersed deep enough.
- Check the animation in the beginning of this tutorial, the liquids are very close to the glass rims.
- Name the liquids, preferably with a shortish label as they will be displayed on the WIO Terminal later.
- Try to collect roughly the same amount of data for each liquid.
- You want to put aside some of the data samples as test data that will be used later. Depending on how you are collecting data, this will happen automatically or not. If the pie chart at the top shows 100%/0% as Train/Test split, you’ll need to manually intervene. One way is to separately click on
Testin theDatasetsection and collect data there, but especially the first time it is easier to select ´Dashboard, scroll down and then clickPerform train/test split`. This will create an ideal split of 80%/20%.
Training and Building the Model
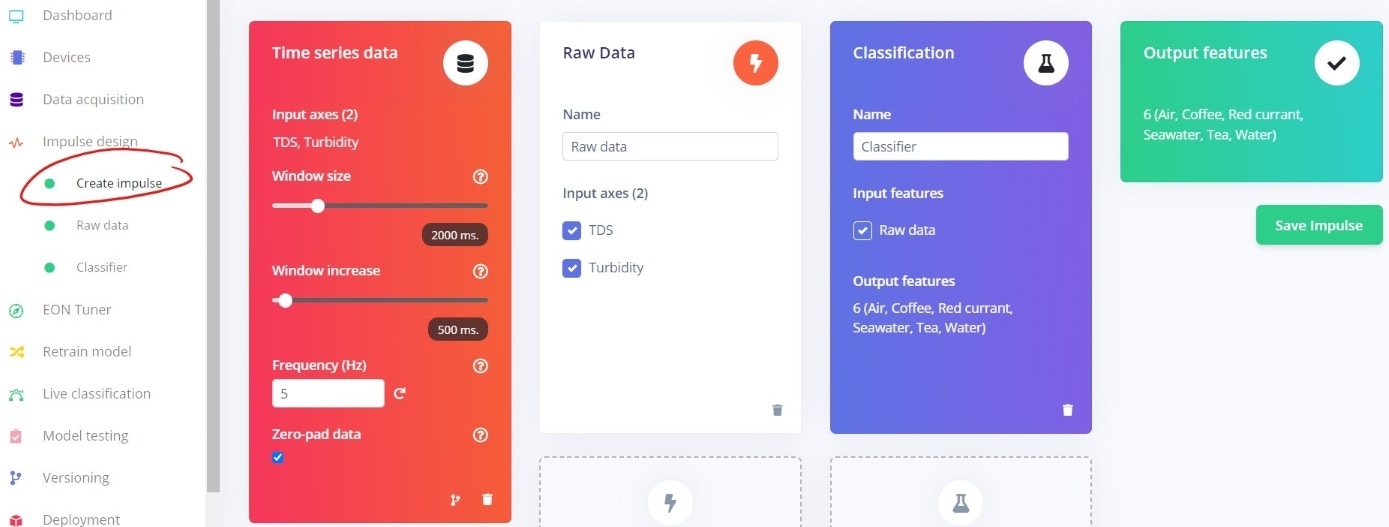
After collecting some data you are now ready to build and train a ML model: Create an Impulse and Generate Features- Select
Create impulsefrom the menu, set the Window size to 2000 ms, Window increase to 500 ms, and frequency to 5 Hz. - Select
Raw DataasProcessing blockandClassificationasLearning block - Click
Save impulse
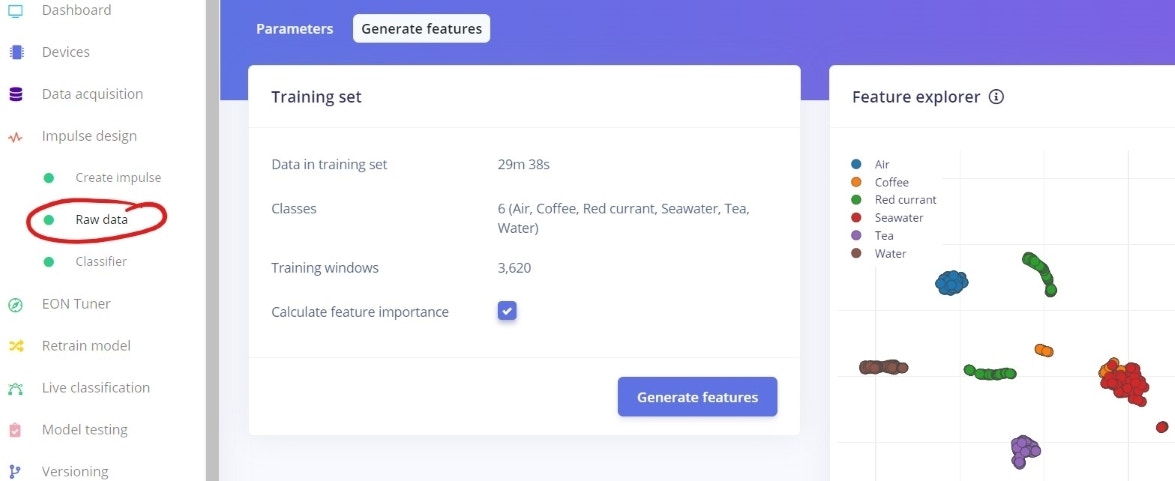
- Select
Raw datafrom the menu - Click
Generate features- After a while you’ll see a graphical representation in the Feature explorer at the right. The more separated the classes are, the easier it will be for the model to classify. In this case the exact same liquid concentrations were used for each sample, this explains the nice separations. In most real cases though, the concentrations will to some degree vary from time to time, e.g. you probably never manage to brew tea with exactly same strength every time.
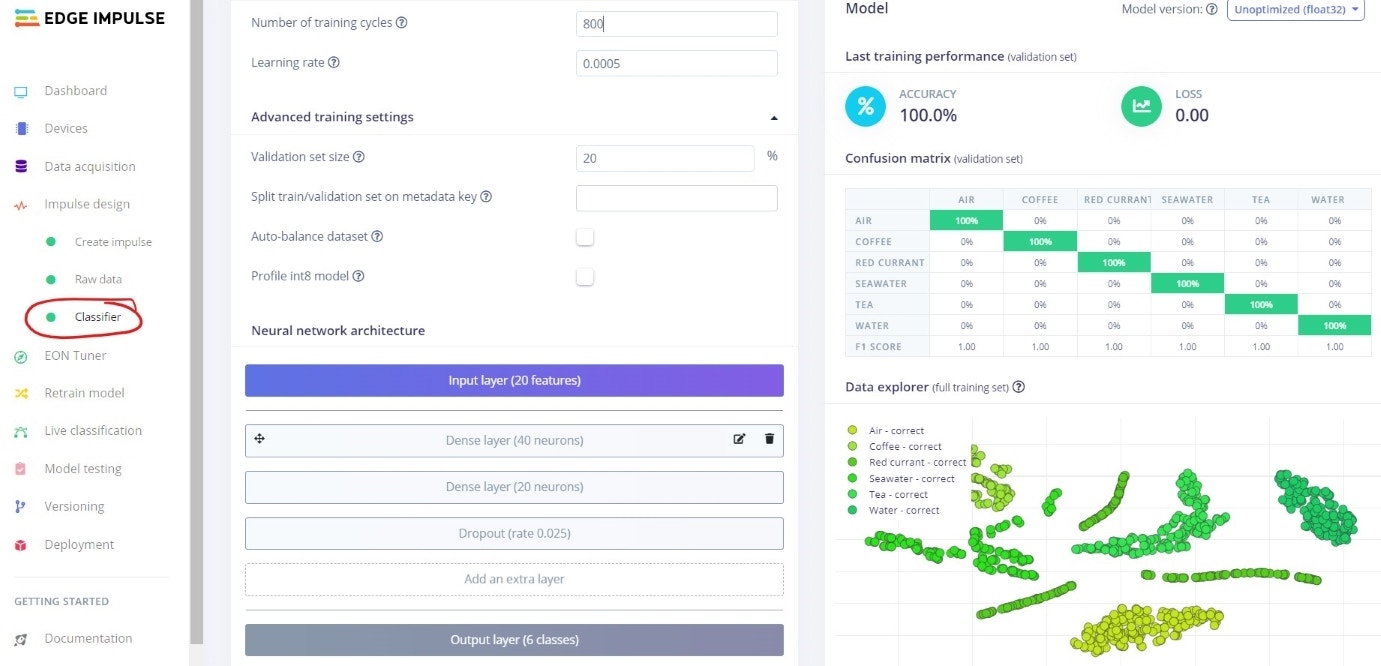
- Select
Classifierfrom the menu - Change the settings as in the picture, most important changes are the Dense layers and the Dropout rate, but feel free to play around with other settings.
- The unoptimized float32 model with these settings will be very tiny, so there’s no need to profile an quantized int8 model.
- In my case the int8 accuracy has actually been extremely poor and useless, I haven’t though investigated why, as the float32 model works just fine.
- Click on
Start training, unless you have lots of data and/or a very huge neural network, the training will in this case take just a few minutes. - Depending on your data quality/quantity and your model settings, you might or might not achieve a satisfying accuracy.
- If you get a very poor accuracy with the unoptimized float32 model, you might need to collect more data, but in this case you should also check that the turbidity sensor (the wider one), really is immersed enough in the liquid, otherwise the optics might “see” only air.
- After you have collected new data, click on
Retrain model. This way you don’t need to generate new features.
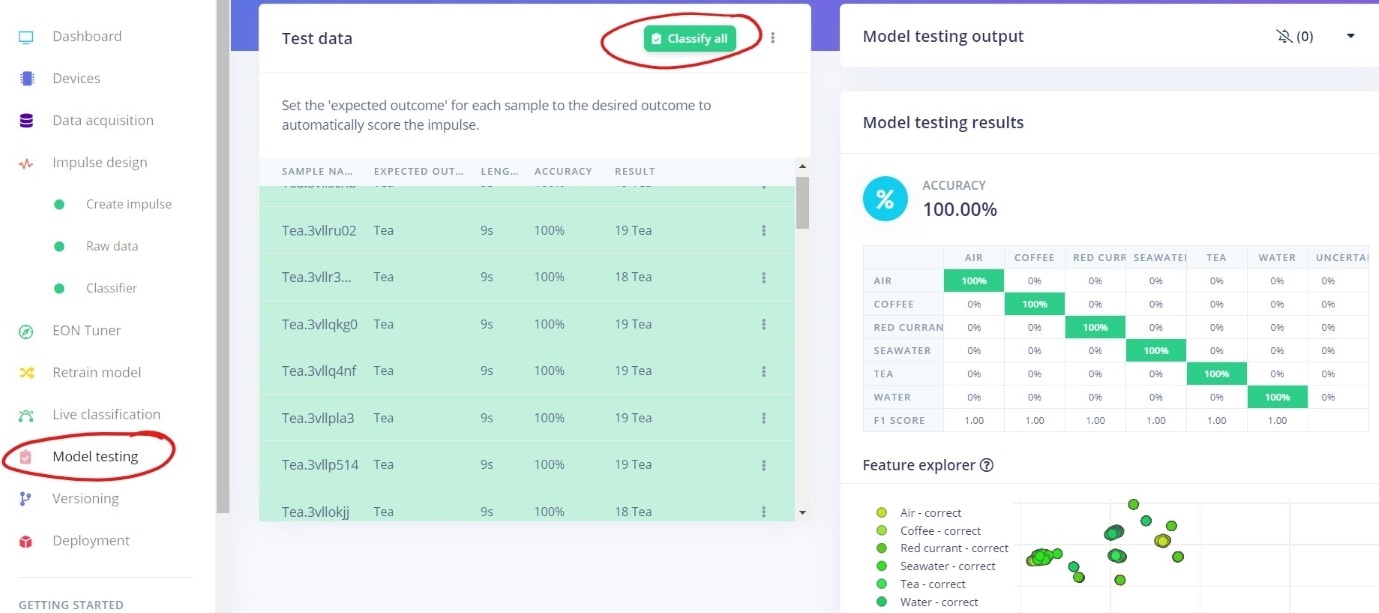
- Select
Model testingand clickClassify all. - Again you’ll need to wait for a short while before seeing how the model performs on unseen data. Often the accuracy might be slightly worse than in the training phase, but sometimes it might even be better. The final truth will though be revealed first during wet testing.
- If the accuracy is much worse than in the training phase, the reason is often that the model is overfitting i.e., it models the training data too well and is not able to generalize.
- In this case it might help to make the model less complex (reduce amount of neurons), increase the dropout rate, or if you have just a few data samples, collect more data.
Model Deployment (Wet Testing)
When you are ready to test the model in real life, in this case with WIO Terminal, Edge Impulse has again made it very easy for you:- Select
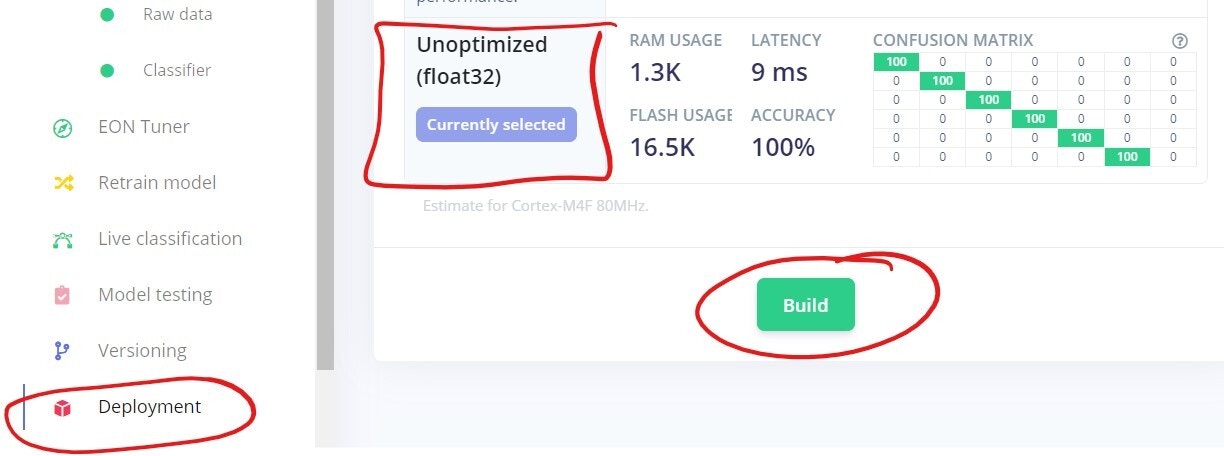
Deploymentfrom the menu - Select
Arduino library - Select
Unoptimized (float32), and clickBuild
- After a few minutes, a window will pop up, showing you how to include the Arduino library into your own code.
- In this case, you should again open the file
Tongue.inoin Arduino IDE, include the new library as instructed, and then replace<Tongue_inferencing.h>with your own library’s header file. If you named your project e.g.Liquidsin Edge Impulse, you’d put<Liquids.h>here.
- In this case, you should again open the file
- Finally compile and upload the program to WIO Terminal.
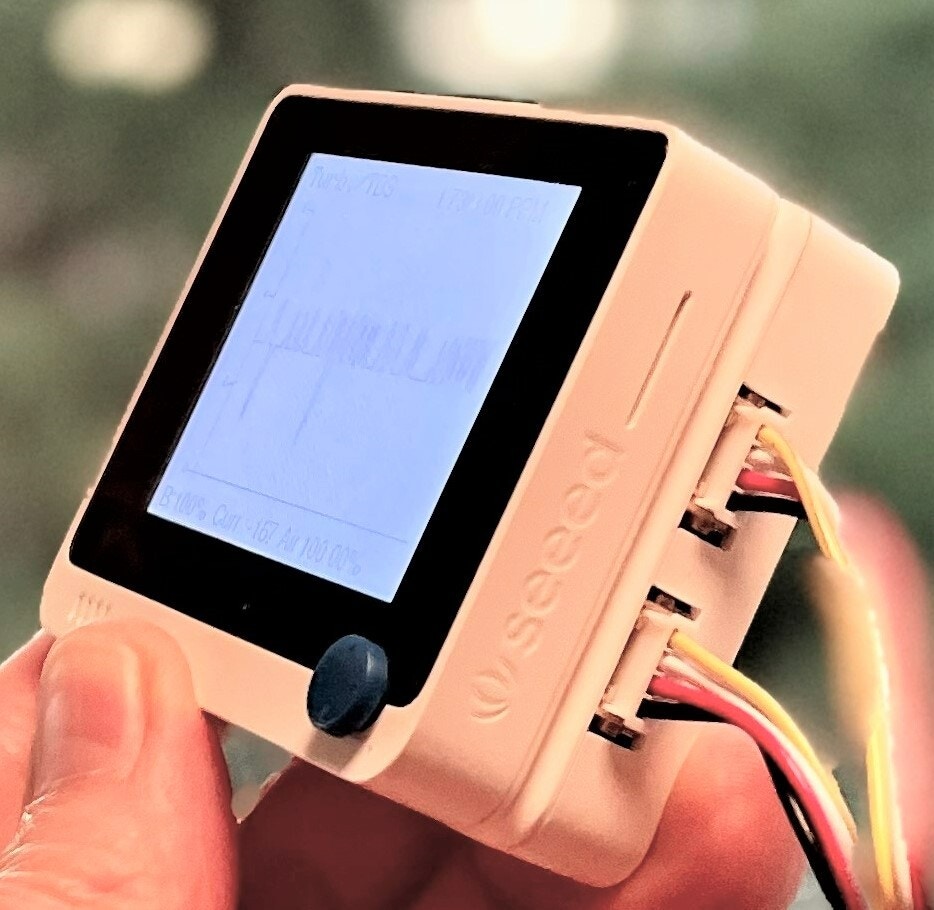
- If everything works you should on the device itself see a line chart with slightly varying data
- The sensor data is also shown in the Arduino IDE terminal window
Tongue.ino program:
- It finds the maximum classification value and takes that as the final prediction
- It is not using any uncertainty threshold i.e., it will classify everything it senses into one of the classes. Feel free to add uncertainty classification code into the Arduino program if you see a need for it, you only need to compare the classification value to a given uncertainty percentage threshold, e.g. 60 %.
Results
The first results I got when testing the model in wet conditions were very mixed. Sometimes the model could always classify a liquid correctly, sometimes it completely failed. As I suspected I had not initially paid attention to having the turbidity sensor at proper and consistent depth, I started over from scratch by filling all glasses almost to the rims before data collection. This seems to have been the resolution to the problem as the model now works 100 % correctly. Again, this shows that machine learning as a paradigm is often an iterative process and it’s better to start with a smaller amount of data, build and test a ML model, and then adjust if needed. As mentioned earlier, the quantized int8 model performs extremely poorly and is useless. This is interesting as the unoptimized float32 model has a 100 % accuracy both in theory as well as in practice. I’ve not investigated this further, but would be interested in learning why this huge discrepancy occurs, and how to correct it.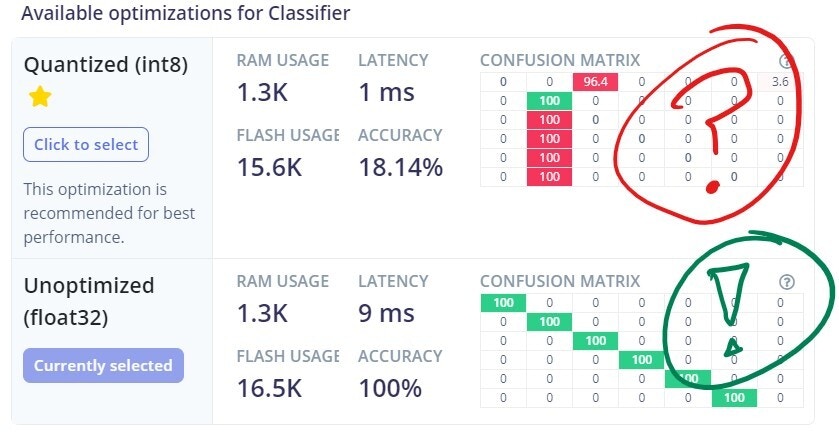
Conclusion
In this project you’ve learned how to build a functioning ML project able to classify different liquids with a good, or hopefully perfect accuracy. You are recommended to explore this more and take it a step further by adding more and different types of sensors, and especially try to find use cases where this type of technology can make a difference.