Project Demo
Intro
Pipeline clogs can have serious and destructive effects on industrial operations. Clogs can occur for a variety of reasons, such as the build-up of debris, corrosion, and other types of damage. When a pipeline clogs, it can disrupt the flow of materials and lead to costly repairs, downtime, and other problems. In this essay, we will explore the destructive effects of clogs in industrial pipelines and discuss some ways to prevent and mitigate these issues. One of the primary effects of pipeline clogs is reduced efficiency and productivity. When a pipeline is clogged, the flow of materials is disrupted, which can lead to delays and bottlenecks in the production process. This can result in missed deadlines, reduced output, and decreased profits. Additionally, clogs can cause equipment to wear out more quickly, which can result in higher maintenance and repair costs. Another destructive effect of pipeline clogs is environmental damage. When a pipeline clogs, it can lead to spills and leaks, which can have serious consequences for the environment. For example, if a pipeline carrying hazardous materials clogs, the materials may leak out and contaminate the surrounding area. This can have serious impacts on wildlife, ecosystems, and human health. In addition to these effects, pipeline clogs can also pose a safety risk to workers. If a clog occurs in a pipeline carrying high-pressure fluids or gases, it can lead to explosions or other hazards. This can put workers at risk of injury or death, as well as cause damage to equipment and facilities. As a proposed solution to the problem of pipeline clogs in industrial operations, we are introducing the use of artificial intelligence (AI) and machine learning. Our AI system uses flow rate sensor data to detect clogs in pipelines by analyzing changes in flow rates that may indicate a blockage. This approach has the potential to prevent disruptions and costly repairs, as well as reduce the risk of environmental damage and safety incidents. To implement this solution, flow rate sensors would be installed along the length of the pipeline. These sensors would continuously measure the flow rate of materials through the pipeline and transmit the data back to the AI system. The AI system would then use machine learning algorithms to analyze the data and detect any changes that may indicate a clog. If a clog is detected, the system could alert maintenance personnel, who can then take action to address the problem.Hardware Requirements
Software Requirements
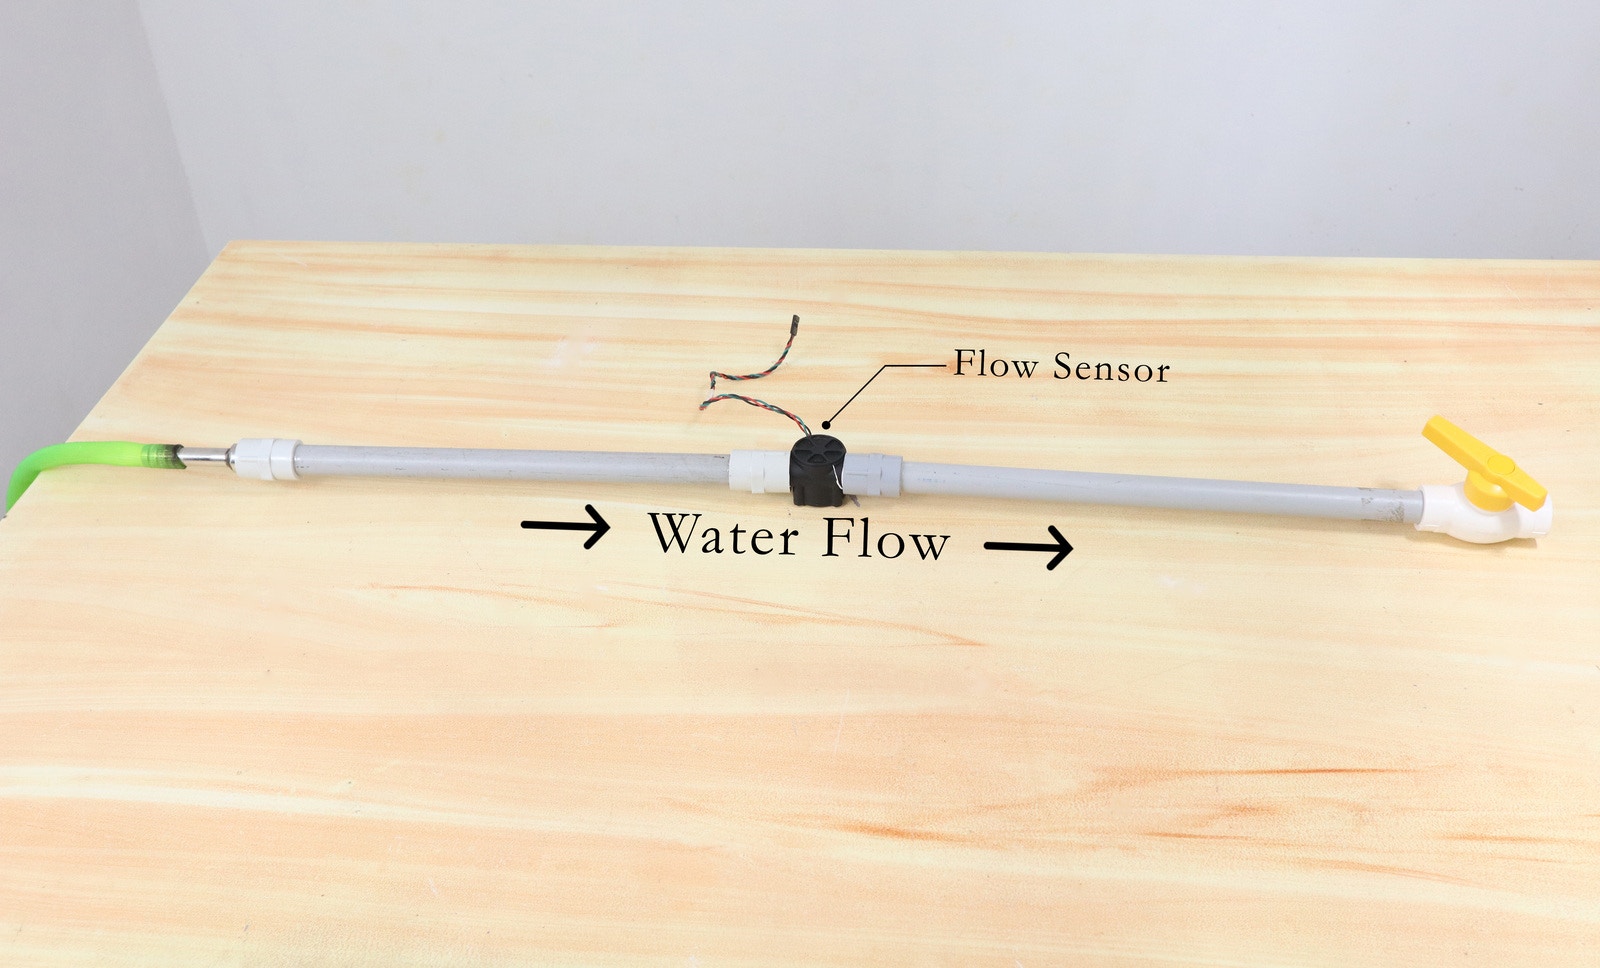
Hardware Setup
In this project, we utilized the Seeed Wio Terminal development board. This particular board was chosen for its comprehensive capabilities as a complete system, including a screen, a development board, an input/output interface, and an enclosure. Essentially, the Seeed Wio Terminal provides everything needed for a successful project in a single, integrated package. Additionally, this development board is known for its reliability and ease of use, making it an ideal choice for our project.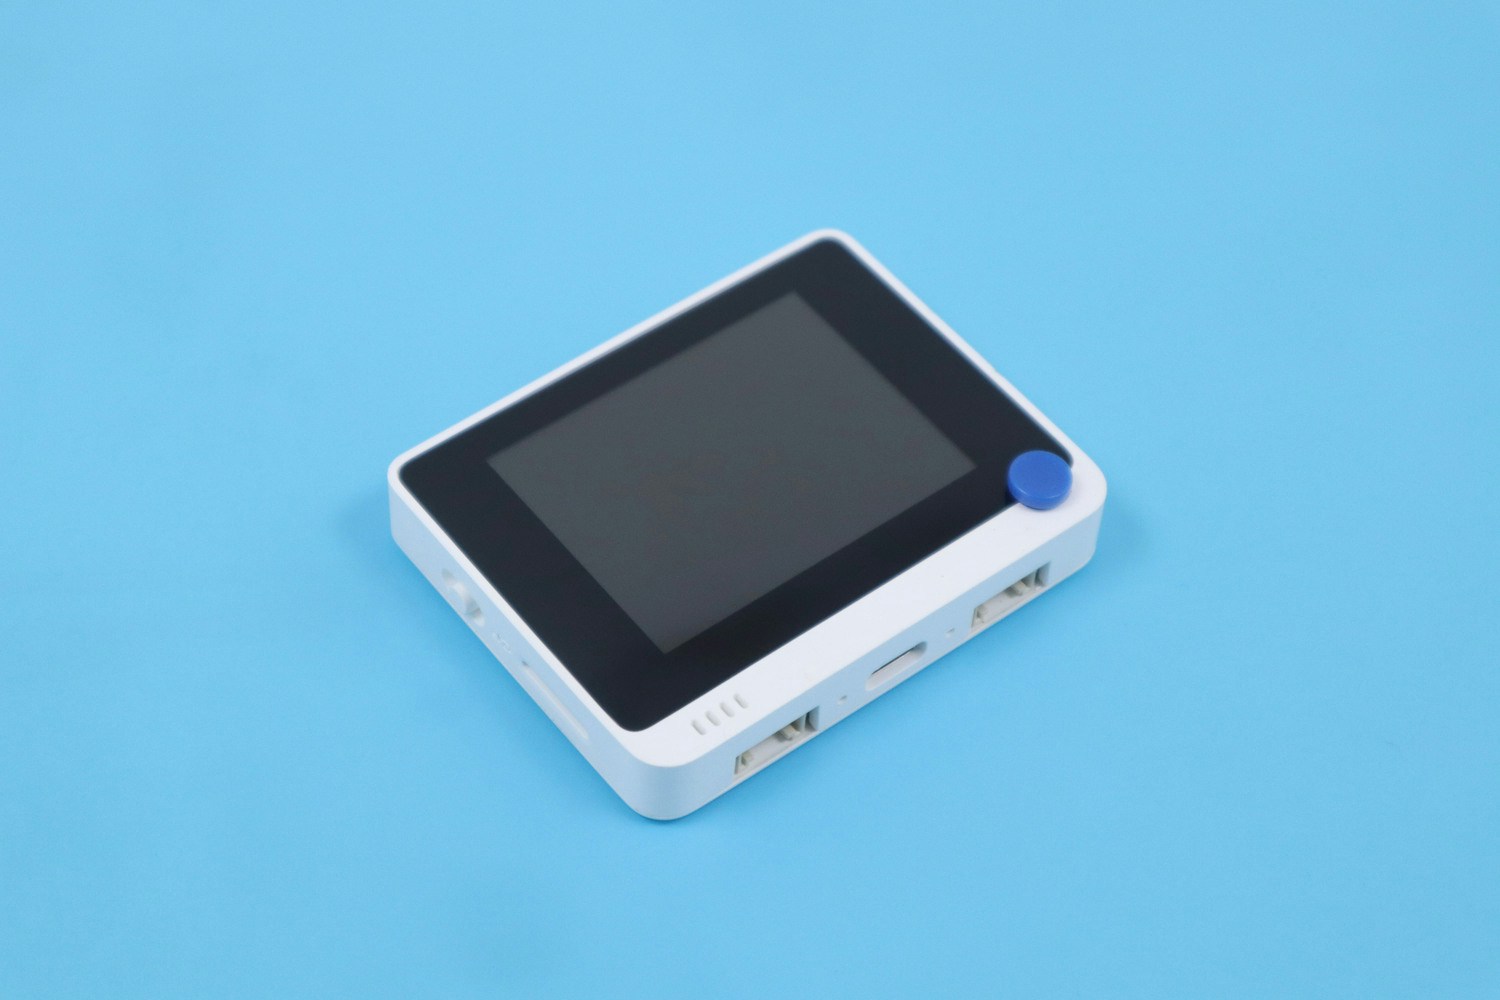
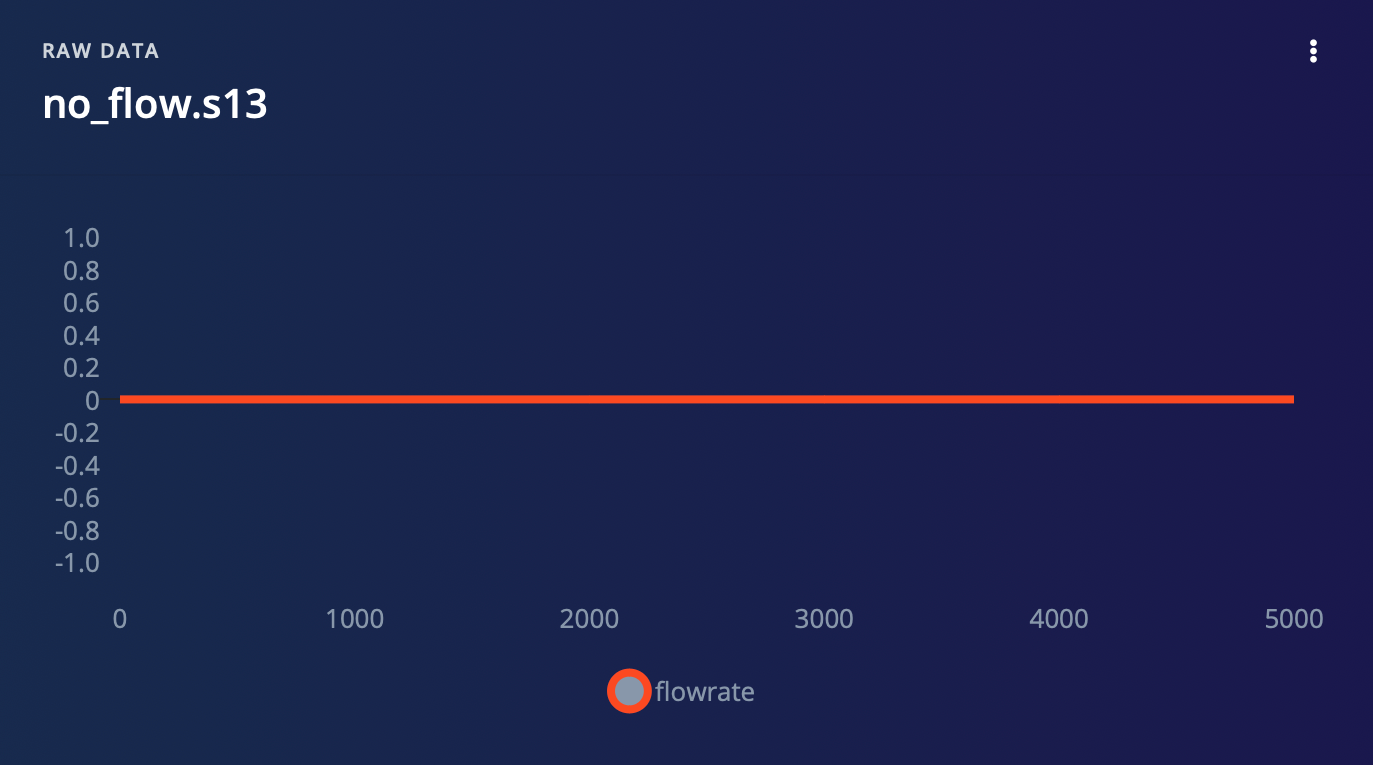
- When there is no flow
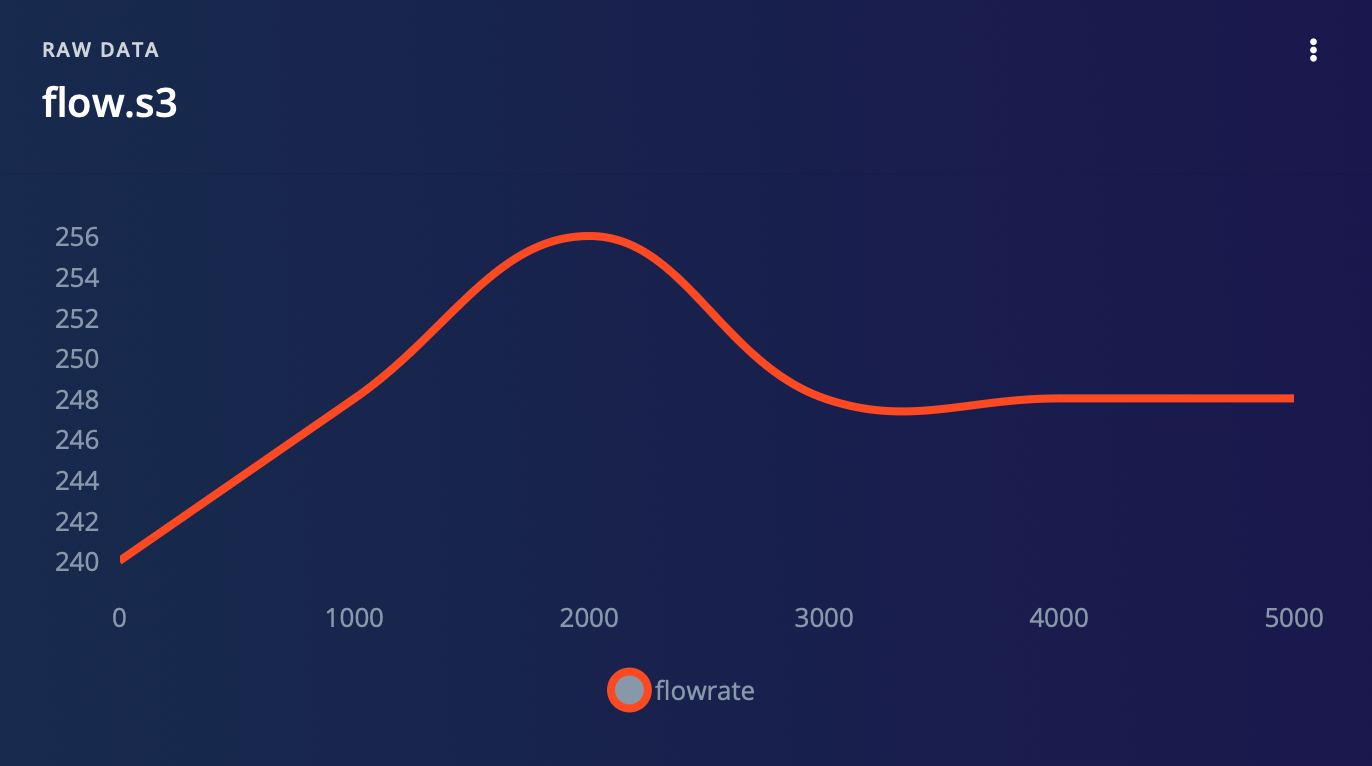
- When there is a flow
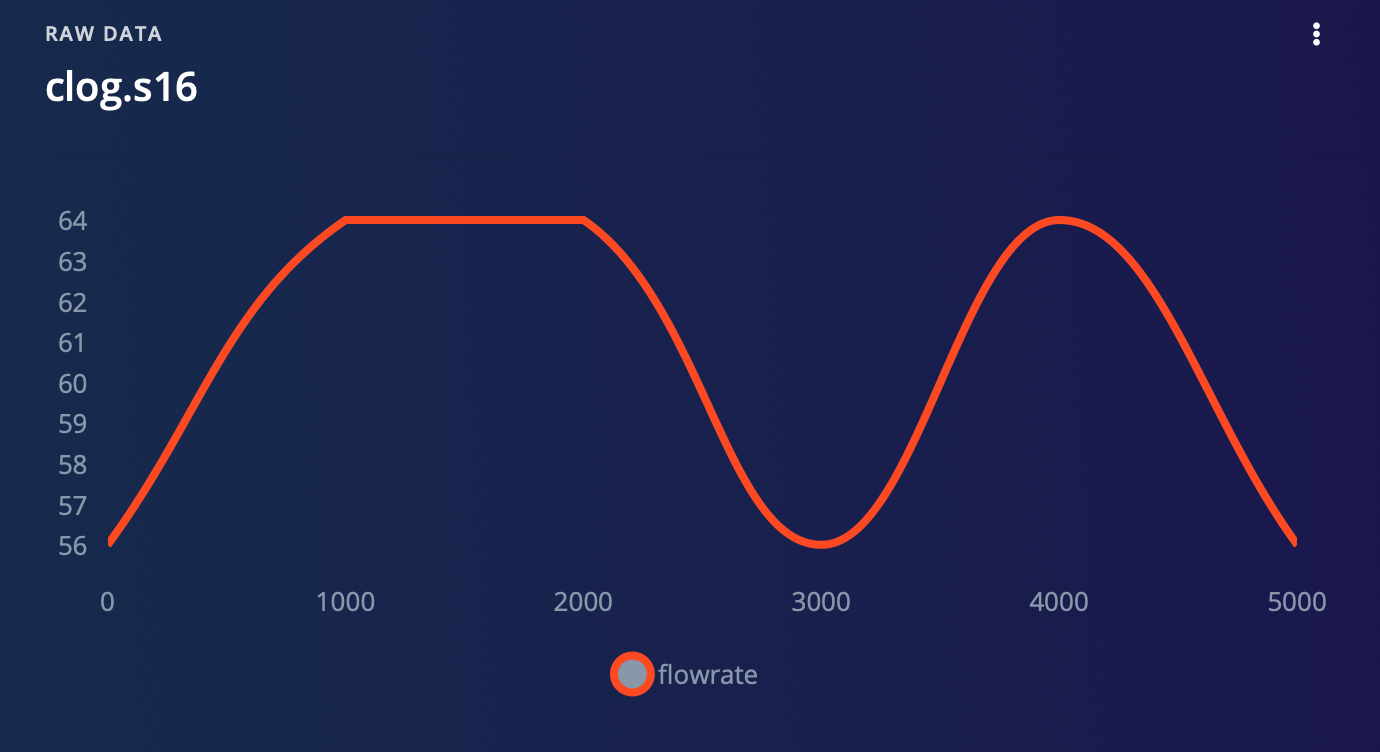
- When there is a clog
Software Setup
To prepare your Seeed Wio Terminal for use with Edge Impulse, you can follow the instructions provided in the official guide. However, we have chosen to employ an alternative method for collecting data in our project. Specifically, we are using CSV files to gather data, which we then upload to Edge Impulse. From there, we follow the usual process of generating a TinyML model using the data collected in this manner. Our method allows us to collect data in a flexible, portable format that can be easily transferred to Edge Impulse for further analysis and model creation.1. Data Collection
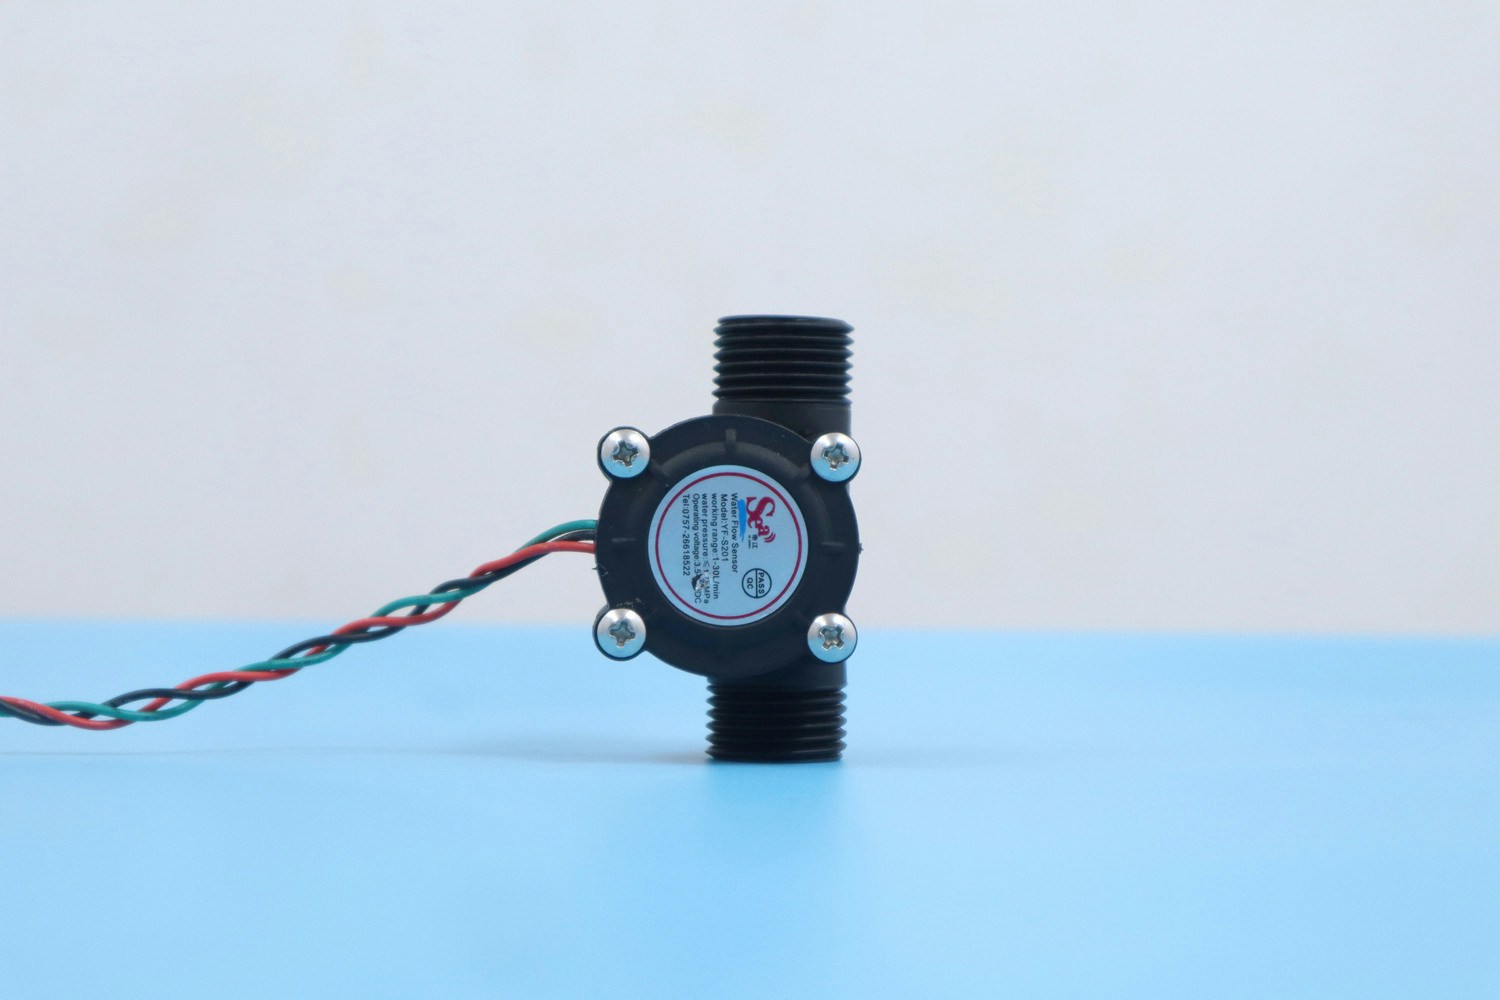
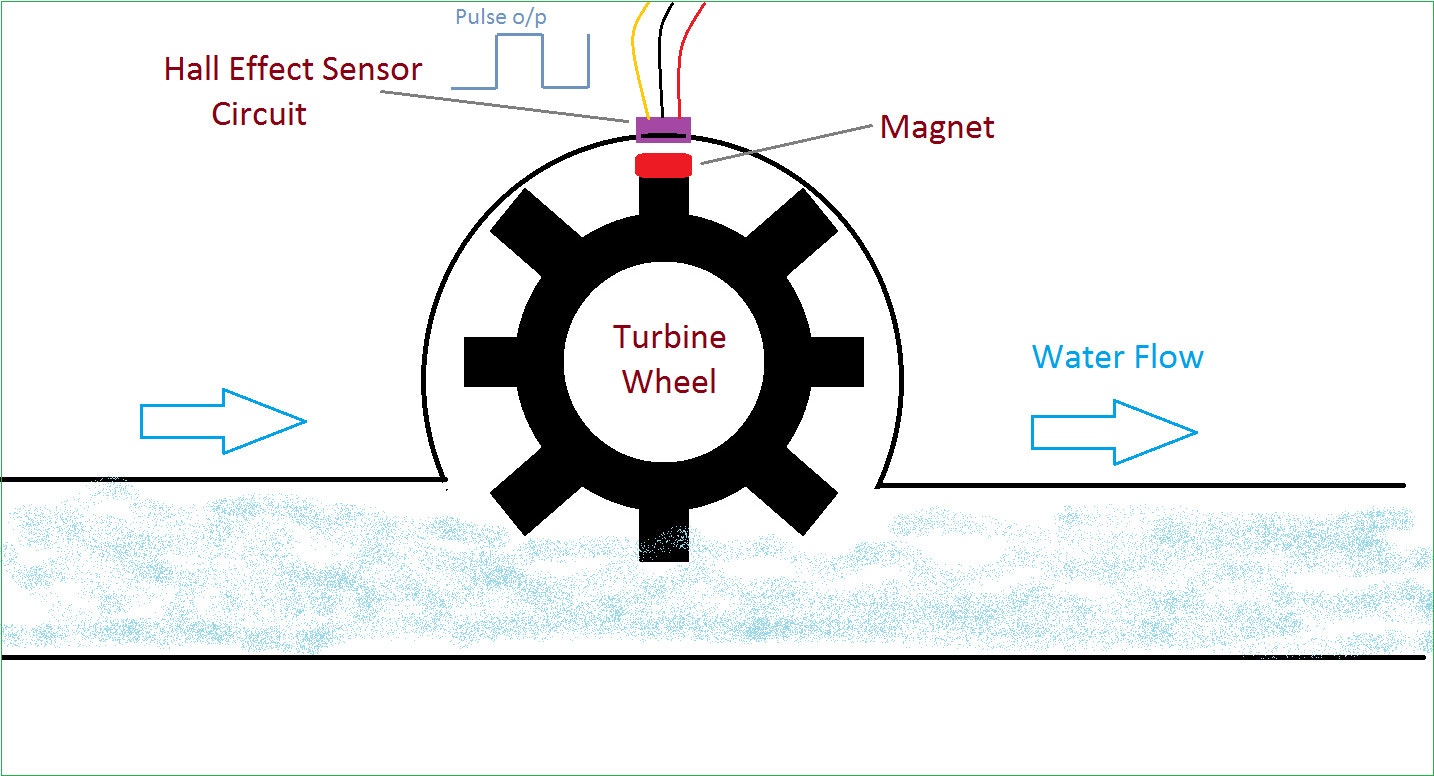
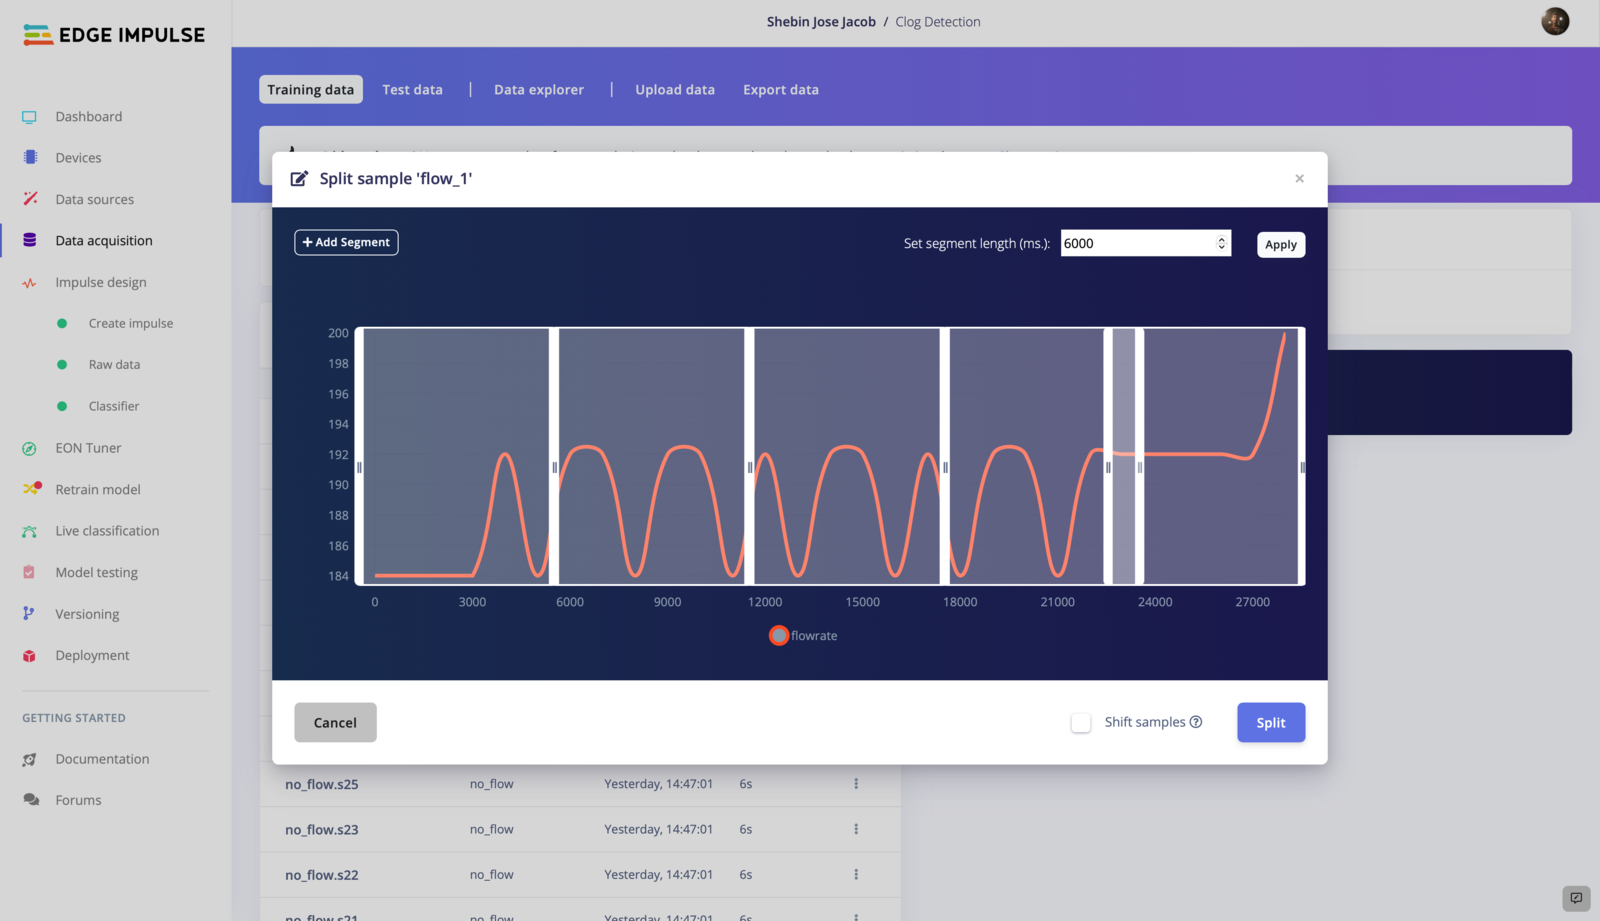
For our project, we are utilizing a water flow sensor that produces a pulse width modulation (PWM) signal as its output. Rather than collecting the analog values directly from the sensor, we have chosen to calculate the flow rate using an equation based on the PWM signal. This flow rate data is then collected as time series data, allowing us to track changes in flow rate over time. We have also collected flow rate data for three different scenarios: no flow, normal flow, and a clog. Through our analysis, we have determined that these three scenarios produce distinguishable patterns in the flow rate data that can be detected by our model. To collect data for your project, follow these steps:- Upload DataCollection.ino to Wio Terminal.
- Plug your Wio Terminal into the computer.
- Run SerialDataCollection.py in the computer.
- Press button C to start recording.
- When you have enough data, press button C again to stop recording.
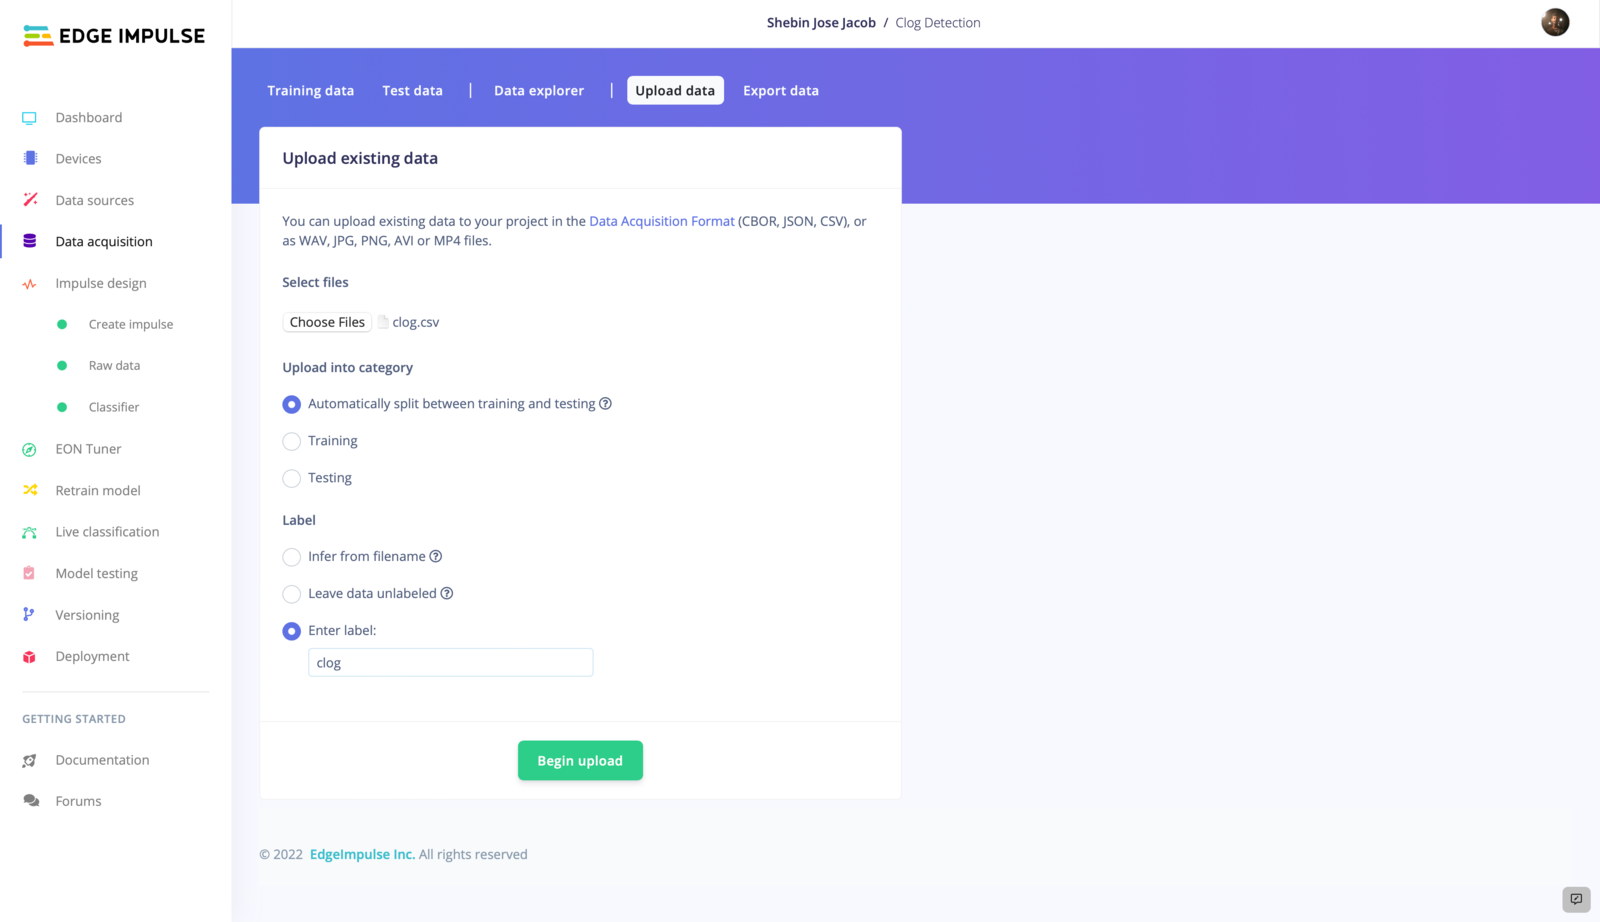
- Once you have stopped recording, it will generate a CSV file on your computer. Name it according to the flow state.
- Upload the CSV file to EdgeImpulse using the Data Acquisition Tab.
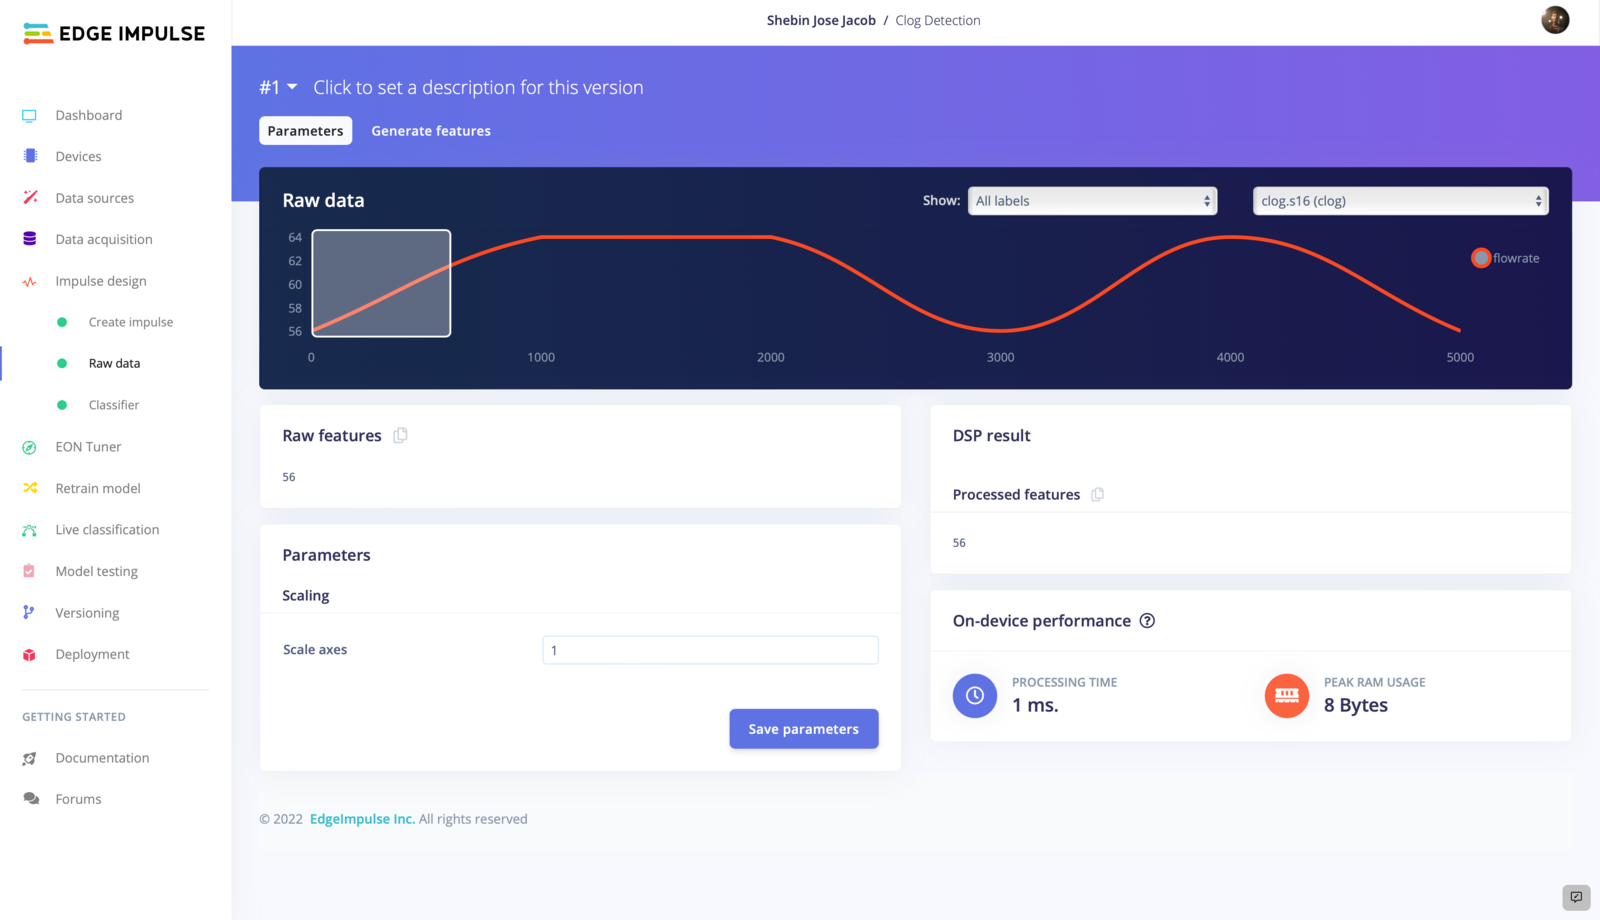
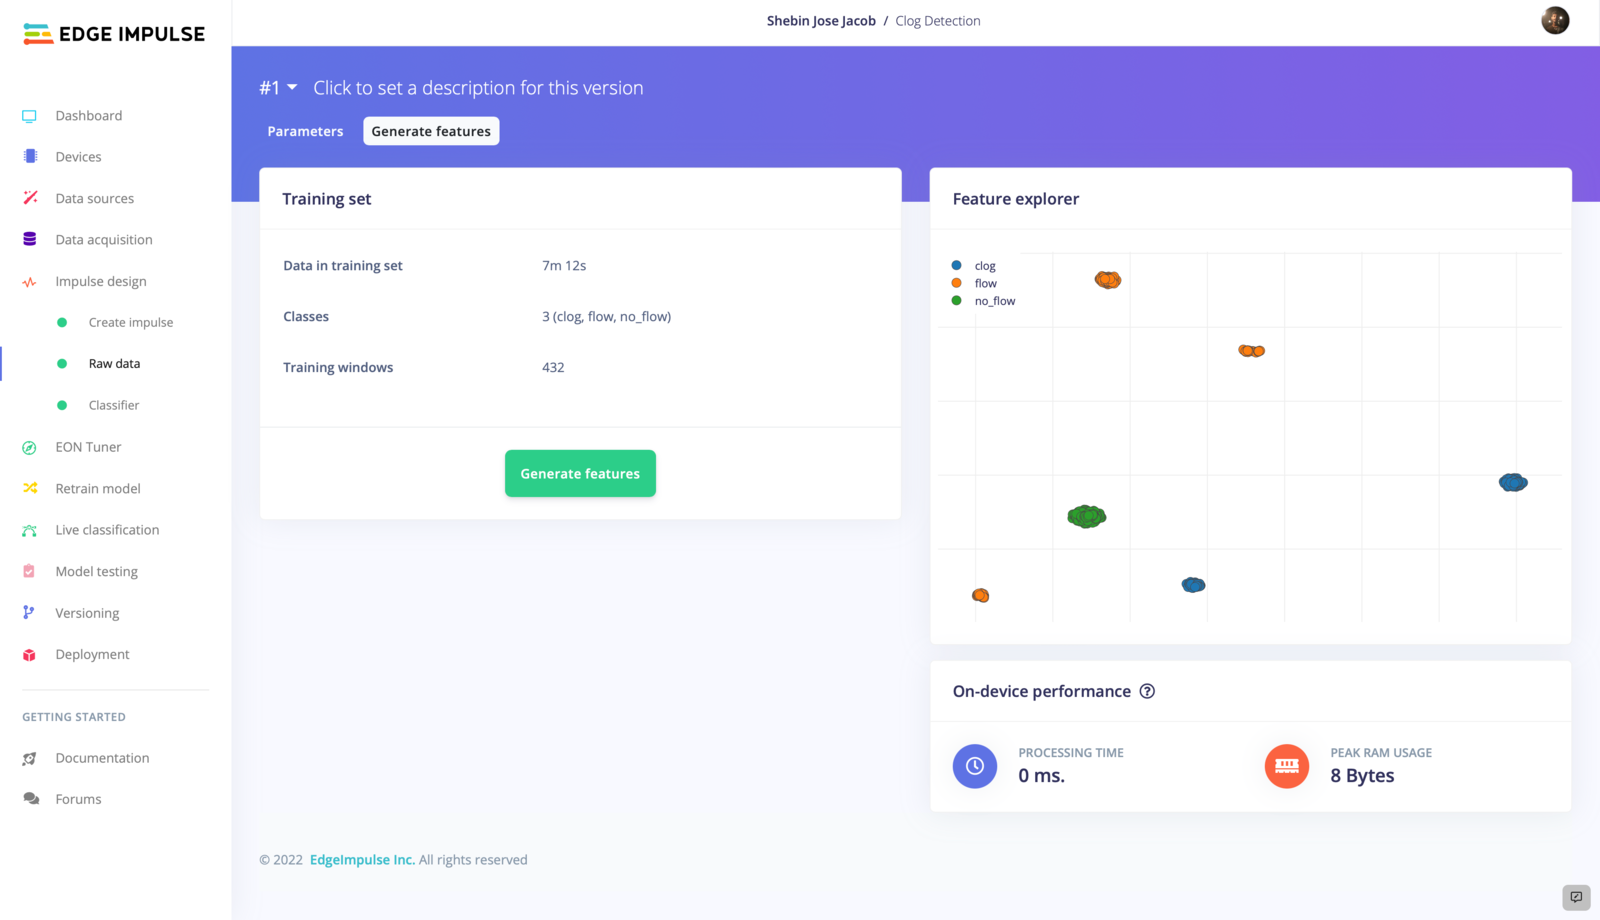
2. Impulse Design
An impulse is a specialized machine learning pipeline designed to extract useful information from raw data and use it to make predictions or classify new data. The process of creating an impulse typically involves three main stages: signal processing, feature extraction, and learning. During the signal processing stage, the raw data is cleaned and organized in a format that is more suitable for analysis. This may involve removing noise or other extraneous information, and may also involve preprocessing the data in some way to make it more useful for the next stage of the process. Next, the feature extraction stage involves identifying and extracting important characteristics or patterns from the processed data. These features are the key pieces of information that the learning block will use to classify or predict new data. Finally, the learning block is responsible for categorizing or predicting new data based on the features extracted in the previous stage. This may involve training a machine learning model on the extracted features, or it may involve applying some other type of classification or prediction algorithm.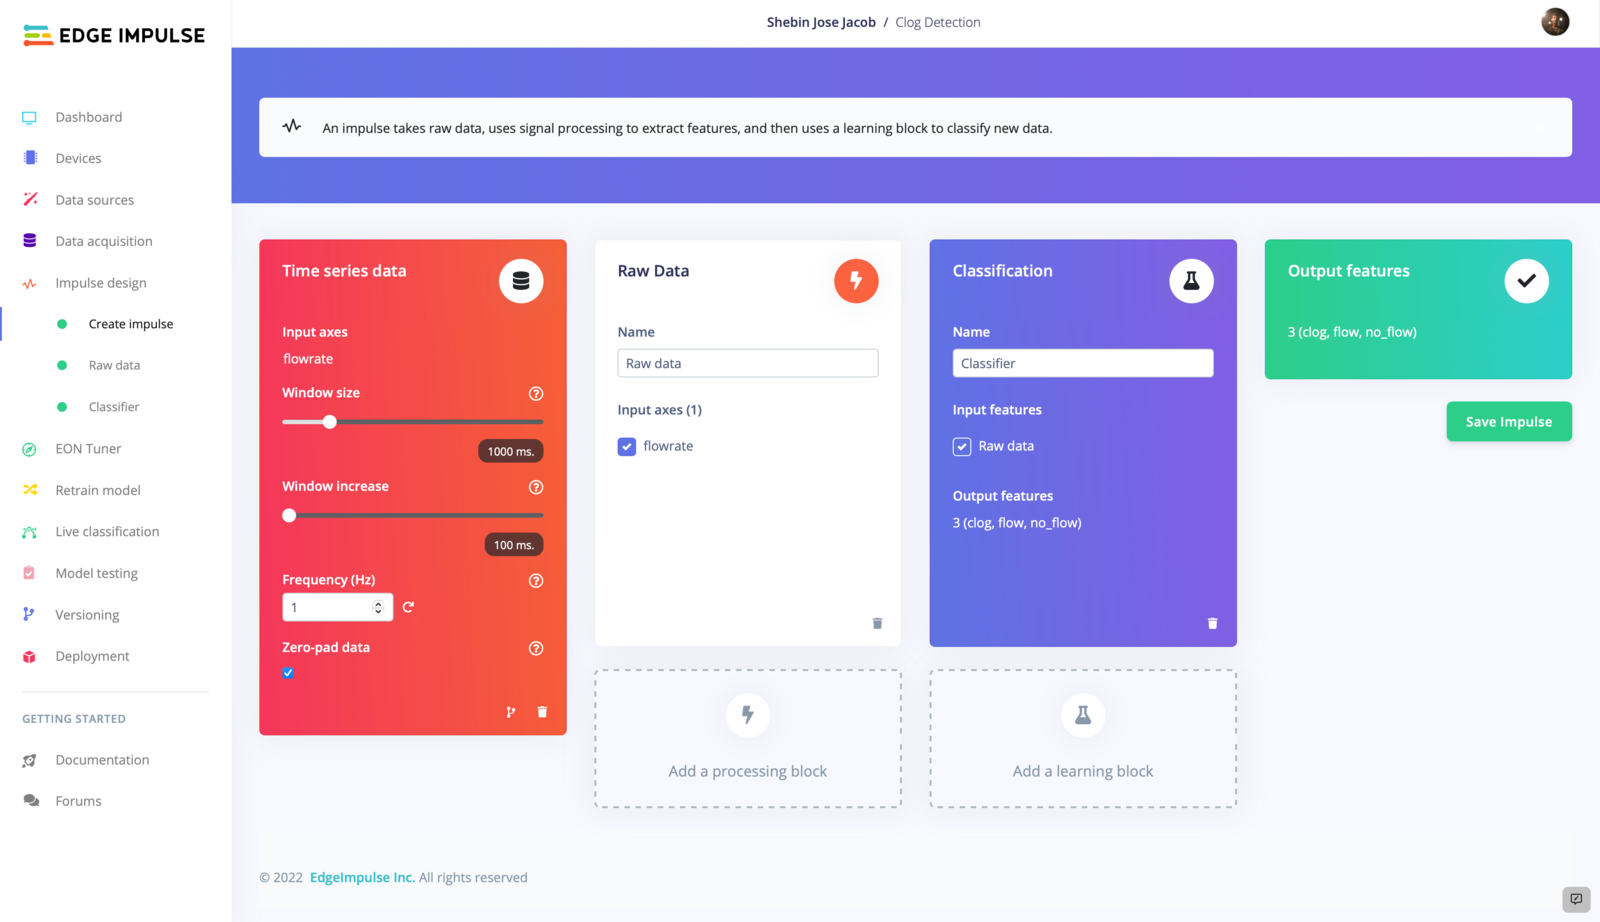
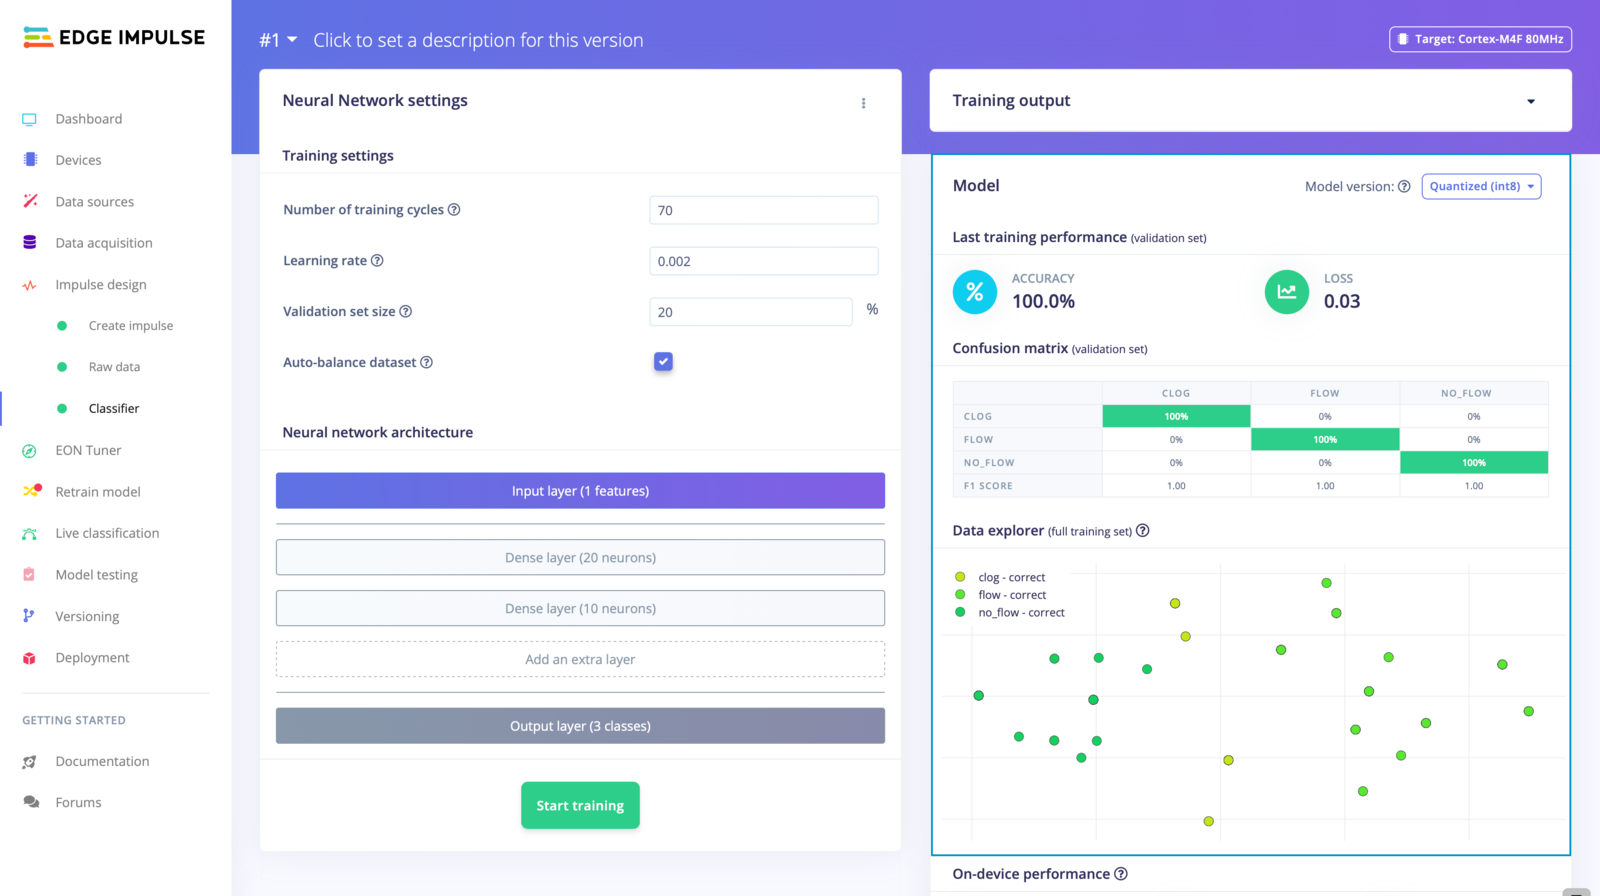
3. Model Training
Now that we have extracted and prepared our features, we are ready to move on to the Classifier tab to train our model. The Classifier tab provides several options for modifying the behavior of our model, including the number of neurons in the hidden layer, the learning rate, and the number of epochs. Through a process of trial and error, we experimented with different combinations of parameters until we were able to achieve a training accuracy that met our standards. This process involved adjusting the number of neurons in the hidden layer, the learning rate, and the number of epochs, among other things. Ultimately, we were able to find a set of parameters that resulted in a model with desired training accuracy which is shown in the figure.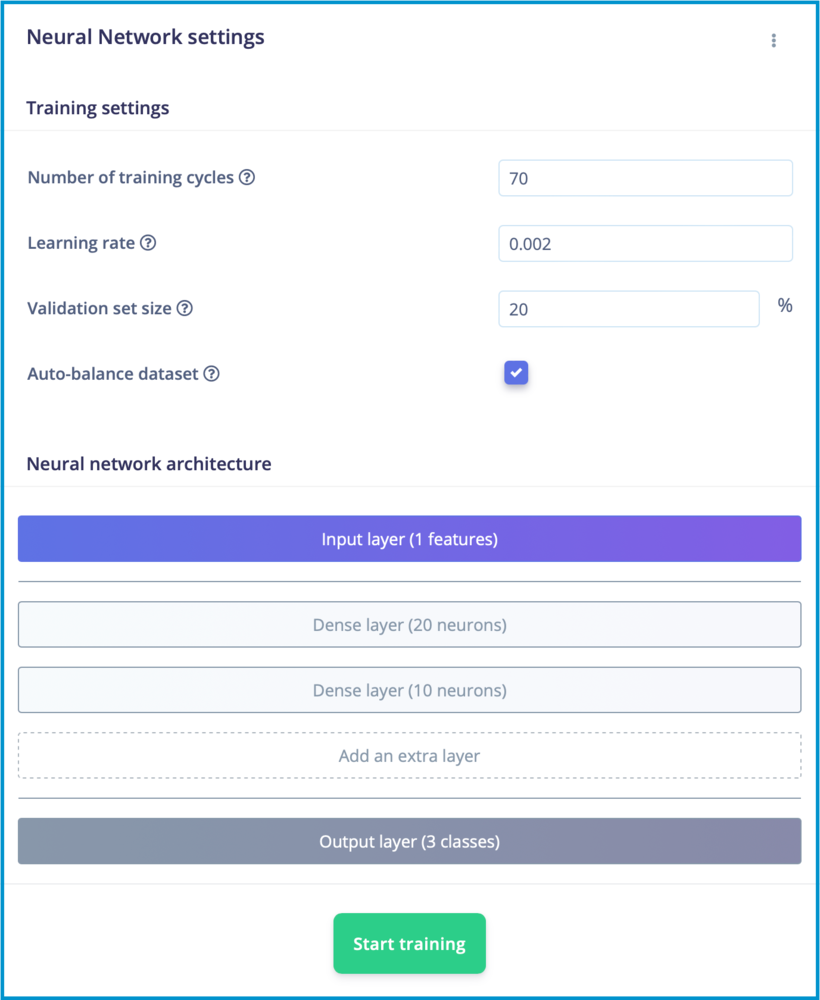
4. Model Testing
Having trained and fine-tuned our model to achieve a high level of accuracy, we are now ready to test its performance on some previously unseen data. To do this, we will navigate to the Model Testing tab and use the Classify All feature to evaluate the model’s performance. By applying the model to a new set of data, we can determine whether it is capable of accurately predicting flow rate patterns and classifying the data into one of three categories. If the model performs well on this test data, we can be confident that it will be able to provide useful and reliable insights when applied to real-world situations.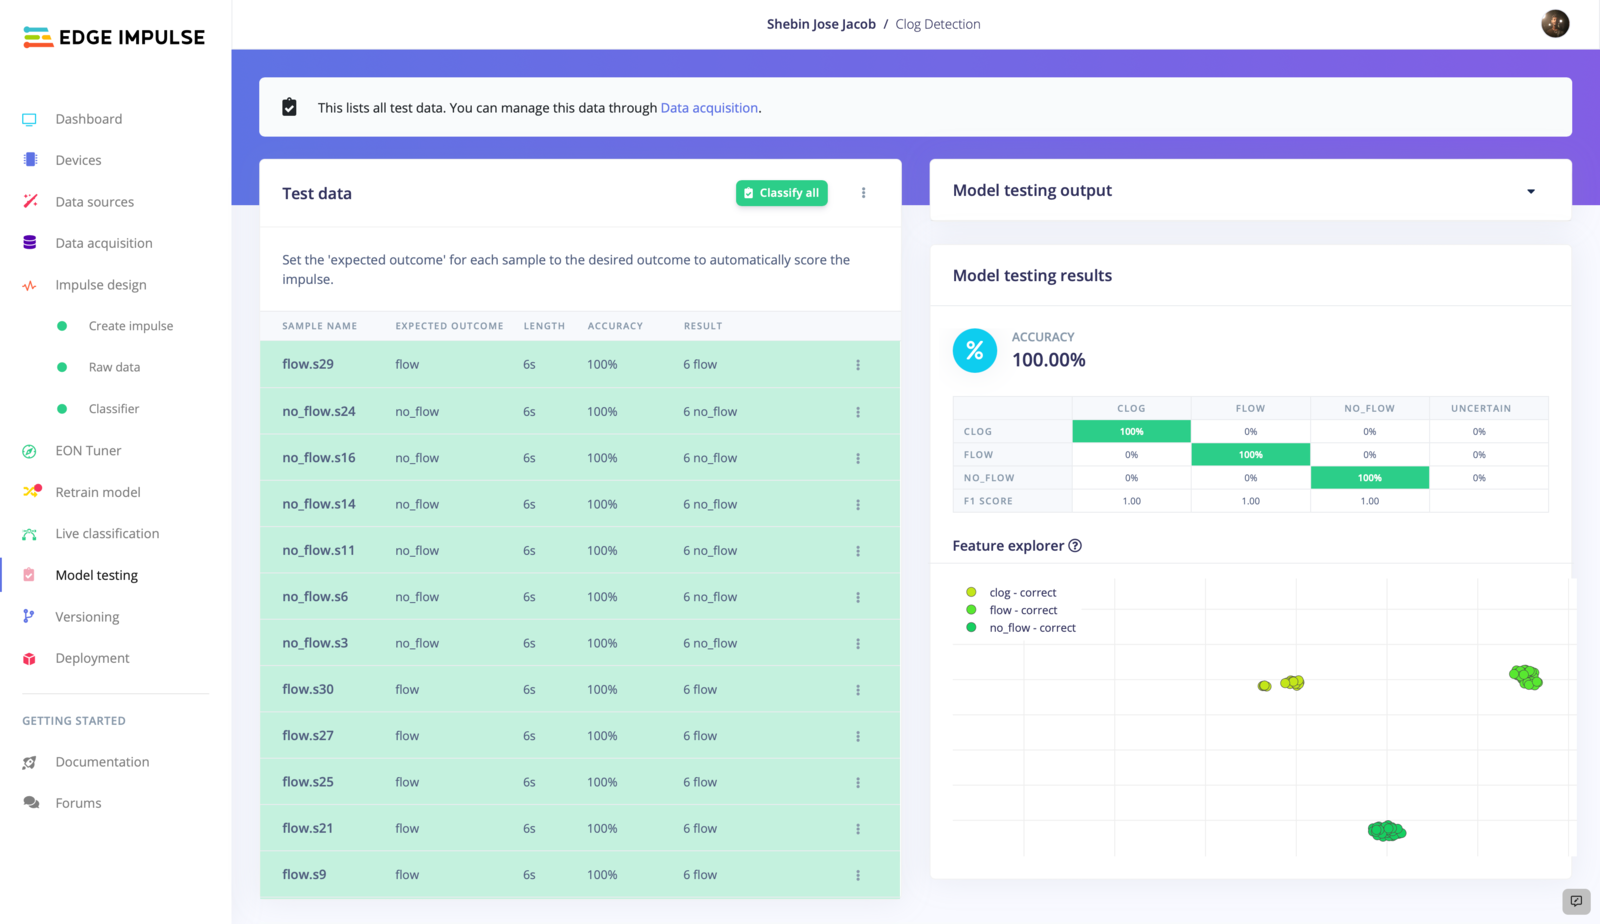
5. Deployment
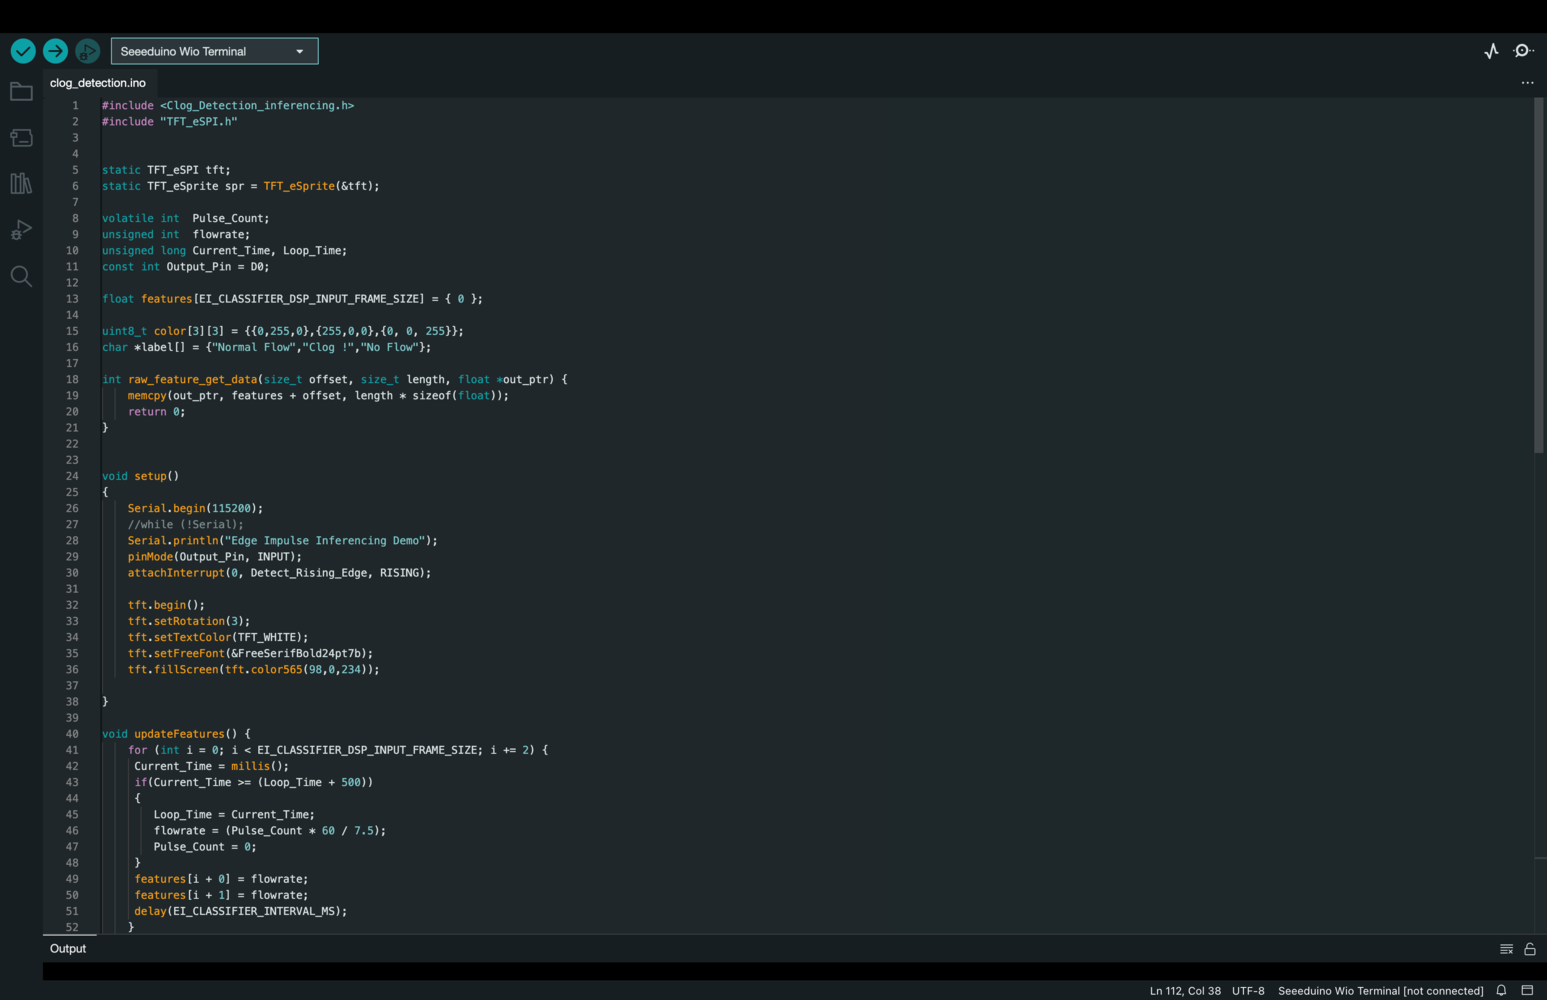
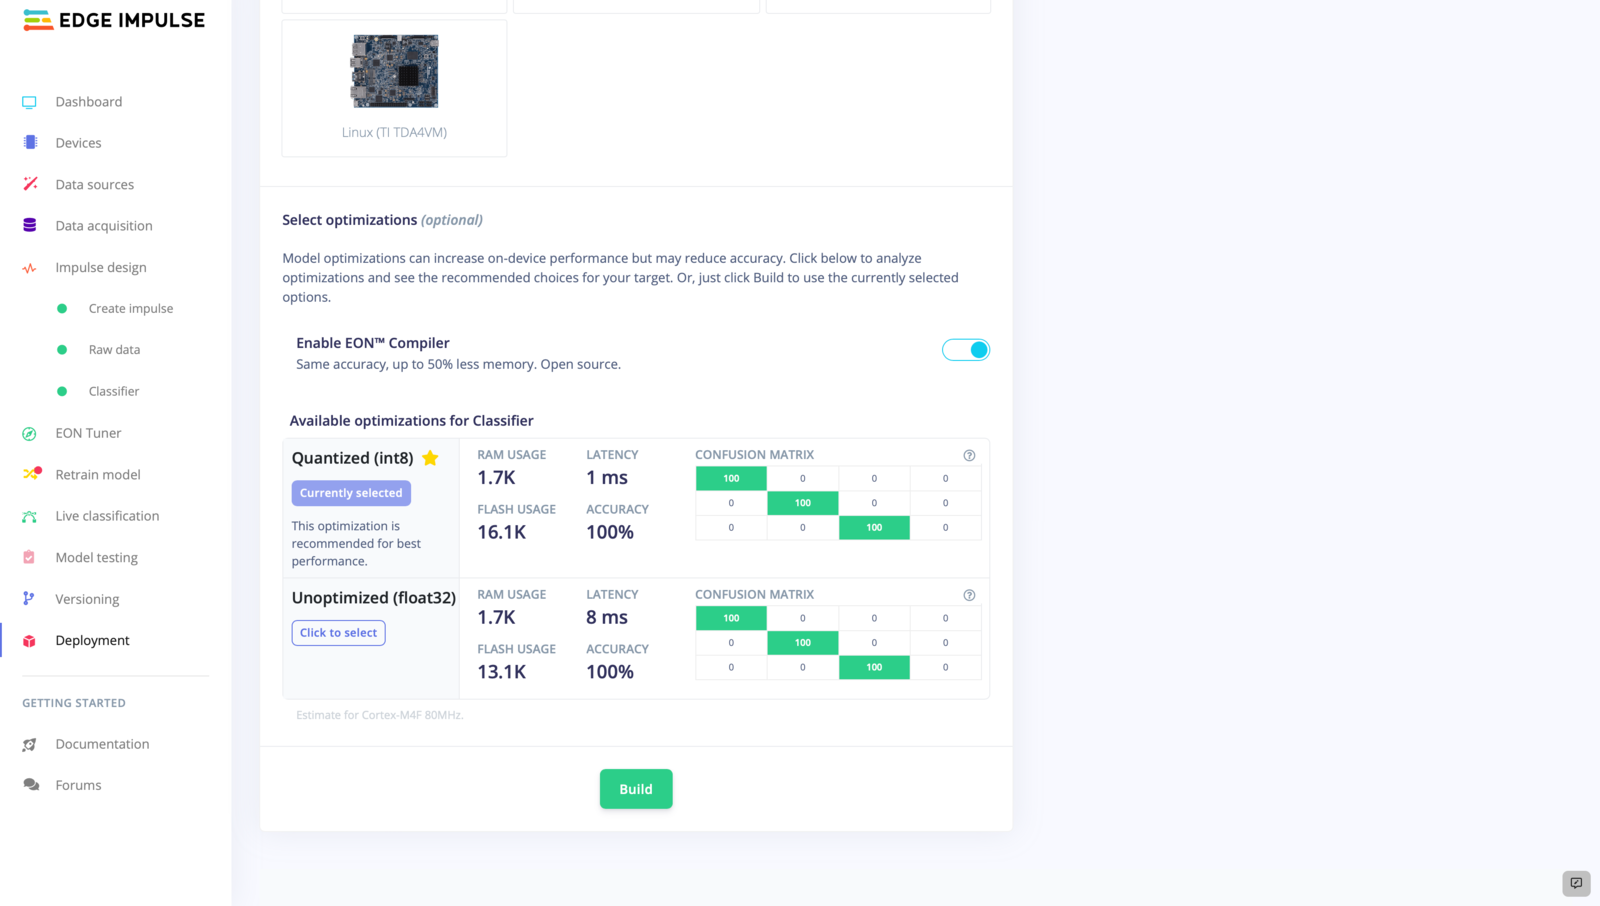
Now that we have created and tested a well-functioning model for predicting and classifying flow rate patterns in industrial pipelines, we are ready to deploy it as an Arduino Library.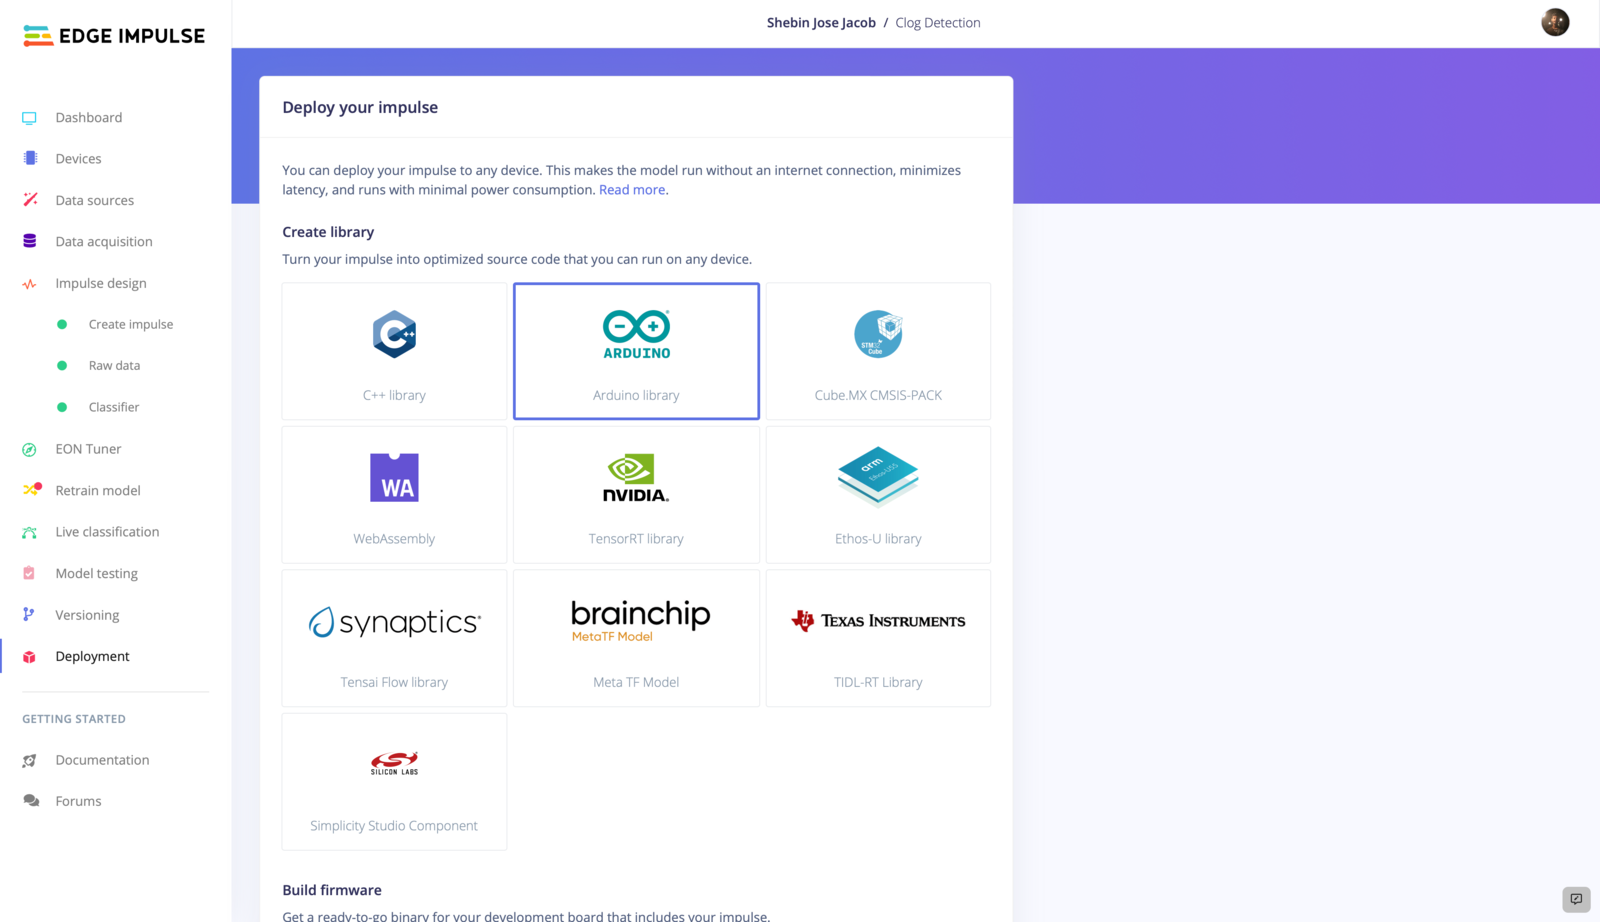
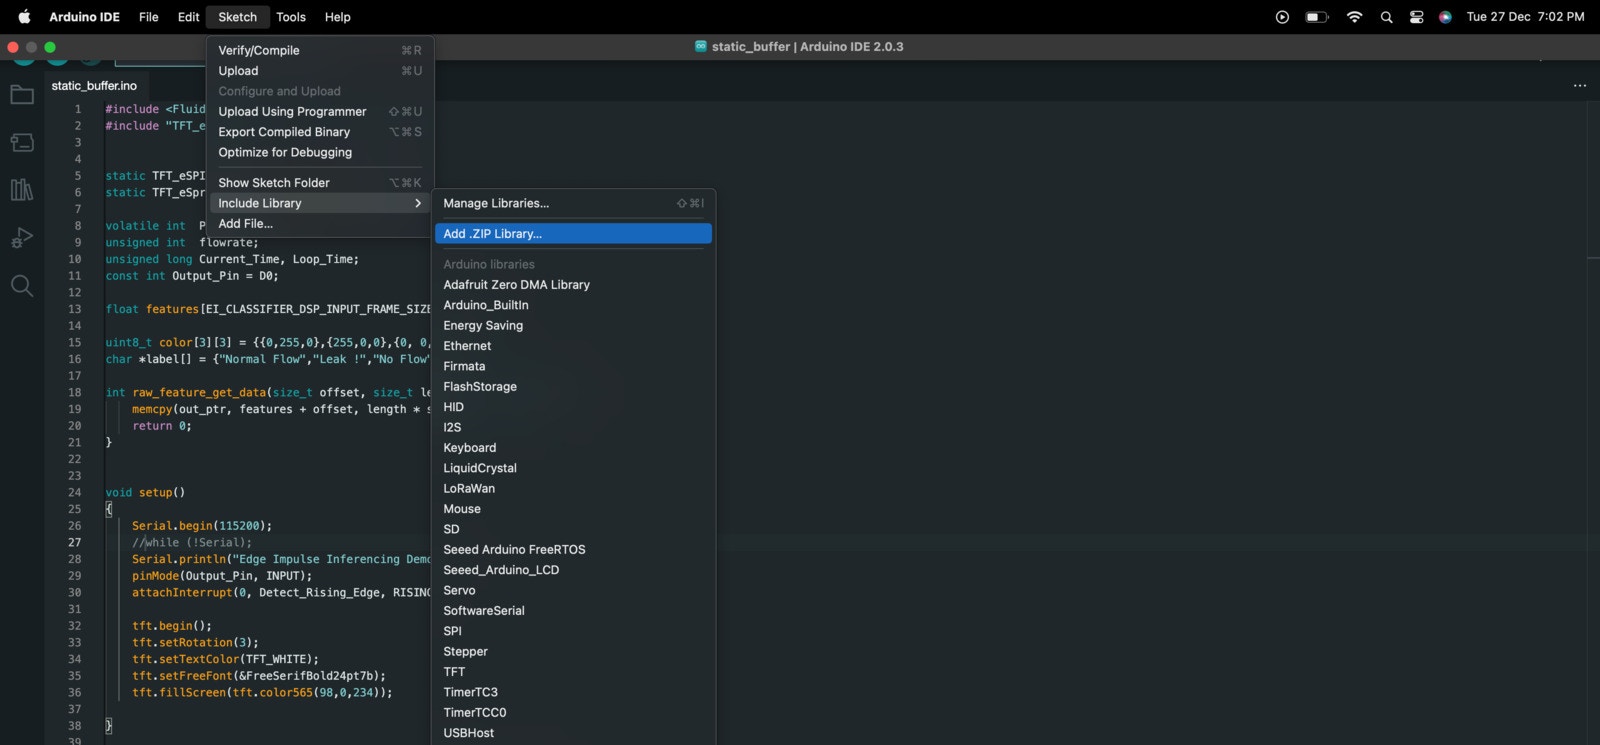
static_buffer.ino file located in the Arduino Integrated Development Environment (IDE) for the purpose of enabling dynamic inferencing. We can begin by opening the Arduino IDE and navigating to File > Examples > Your Project Name > static_buffer > static_buffer.ino.
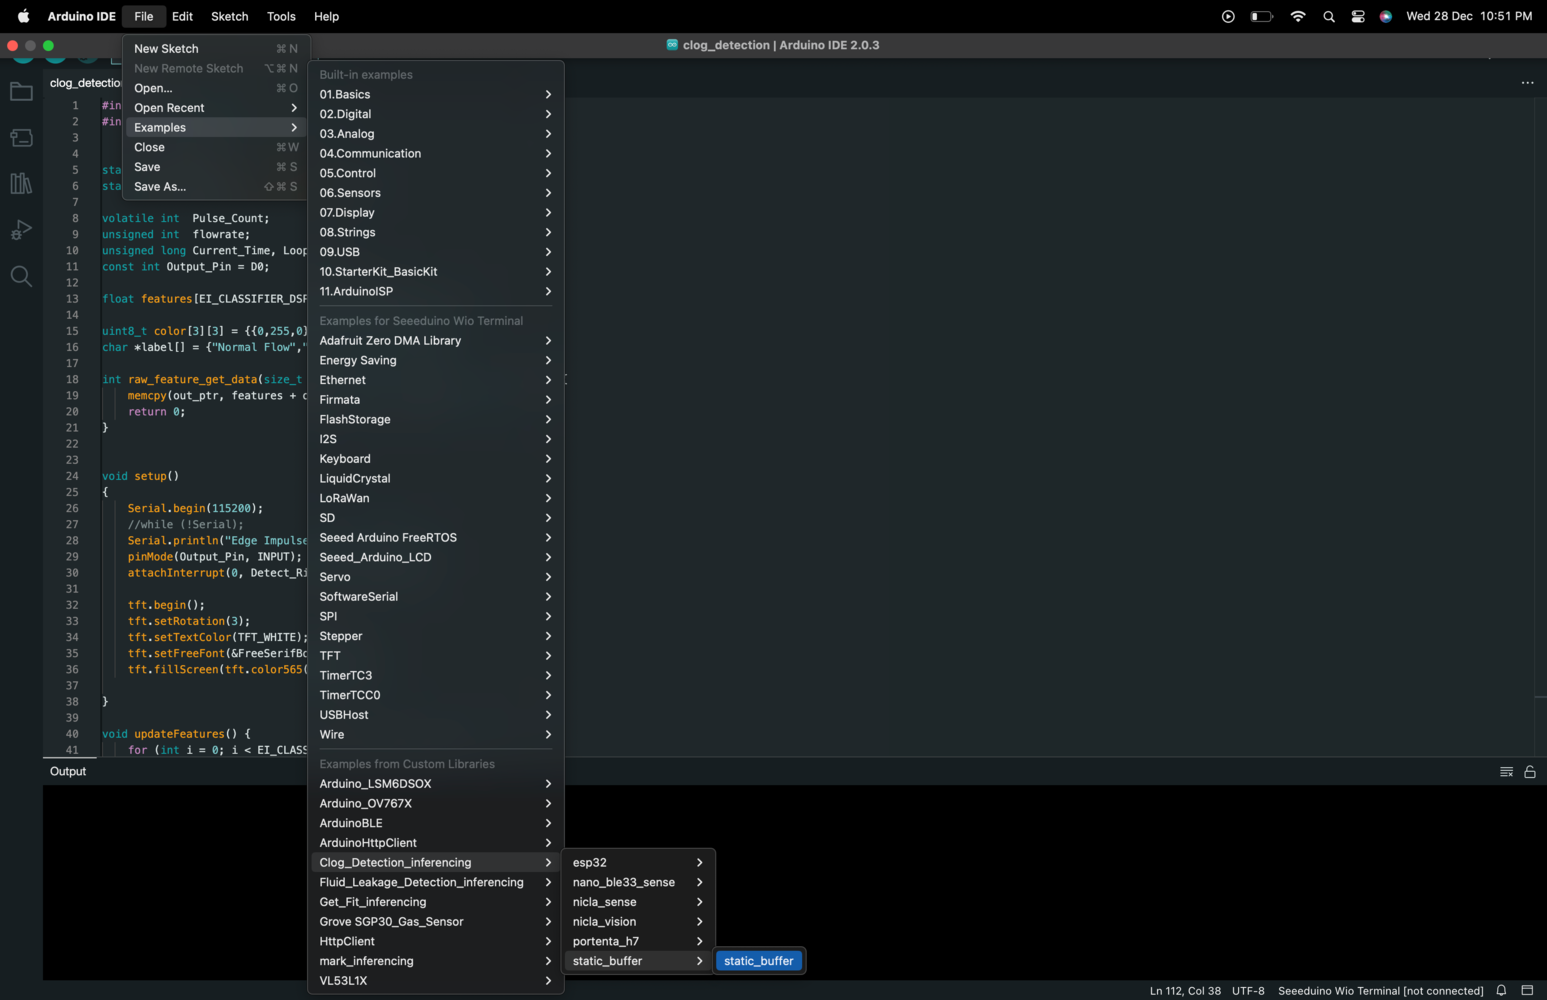
static_buffer.ino file in the editor window, allowing us to make changes to the code as needed.