Advantages of Processing with Edge Devices
Data complexity: If you’ve got a factory or manufacturing floor with hundreds of cameras and sensors in it then there’s just no way to send that information across the Internet to the cloud for processing — it’s going to overwhelm whatever kind of connection you have. Latency: This is the time it takes for something to happen after a key event happened. It’s important in industrial and manufacturing because if there are sudden changes, such as a potential machine malfunction — then those cloud-based compute devices won’t be able to make decisions or predictions quick enough. Cloud processing is simply too slow. Predictive models running on the edge is the way to go. Cost: The economics of cloud computing are getting better and cheaper all the time, but it still costs money. Edge Computing can reduce data consumption by sending less information to a server in a remote location, which saves energy as well as provides faster network speeds for users on competitive websites who do not have this advantage over them yet. Reliability: The local processing of an asset-monitoring system means that it will be able to work even when connectivity goes down. Edge machine learning is great for both on- and off-grid industrial assets. Privacy: With edge compute, sensitive live operational sensor data does not need to leave the facility or be shared with third parties.Building a Predictive Maintenance Demonstration
Let’s look at how to assemble a solution that detects anomalous hardware vibrations.Hardware Requirements
- Akida Development Kit Raspberry Pi, keyboard, mouse, monitor
- ADXL345
- 120mm case fan
- Standoffs and screws — used are a #2-52 screw/nut to secure to fan
Hardware Setup
First, connect the accelerometer to the Raspberry Pi header like so: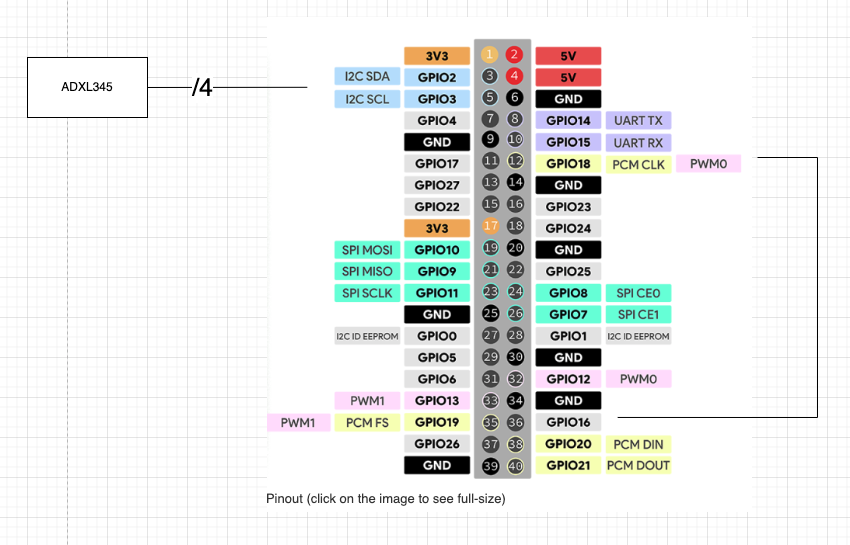
Hardware schematic showing connection to accelerometer and PWM
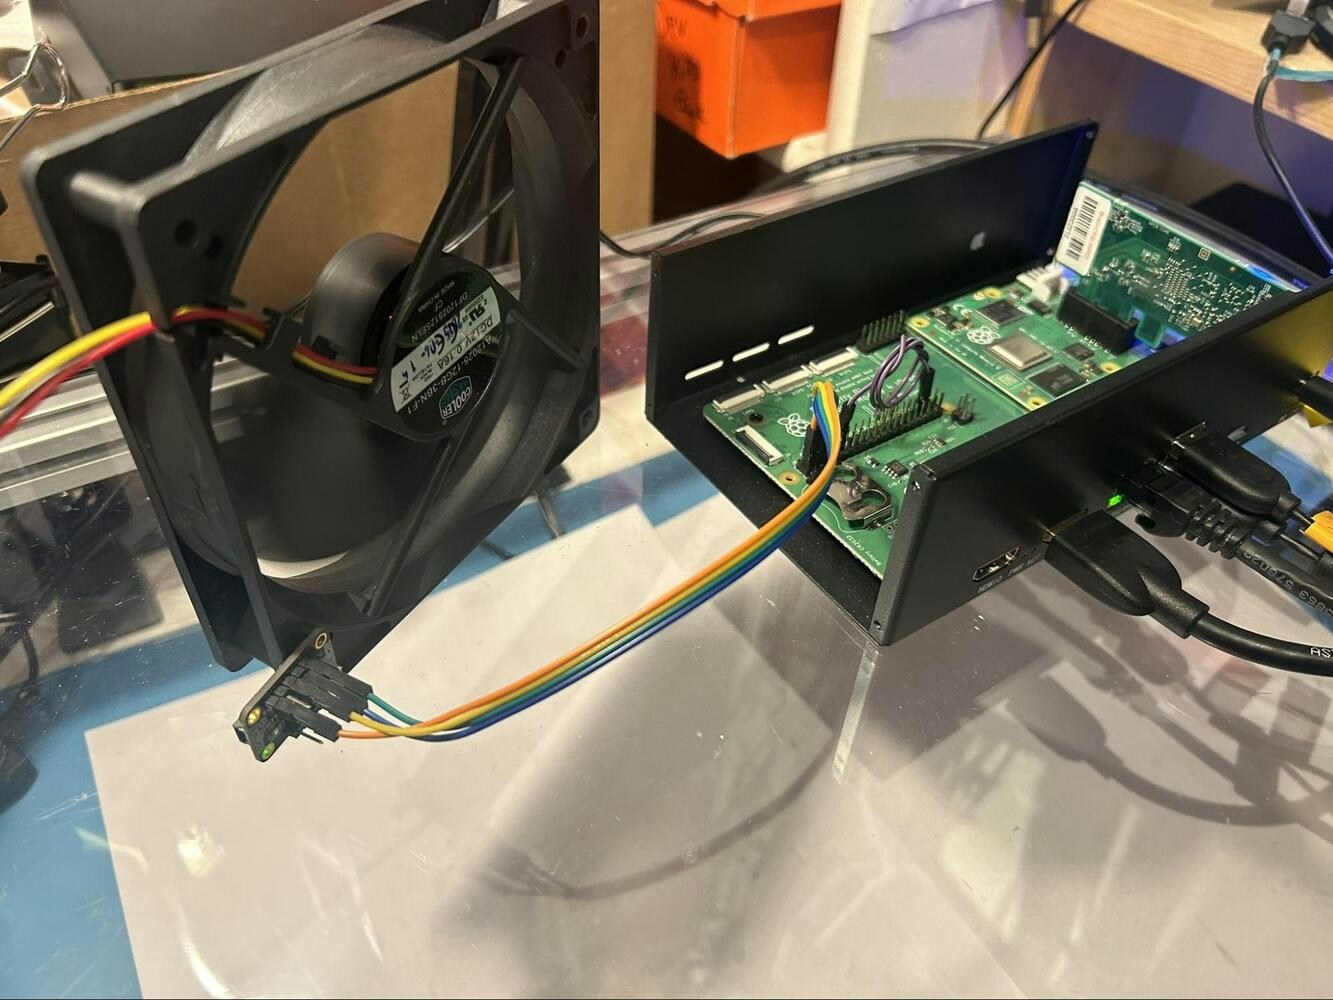
Fan connected to the Raspberry Pi headers
Software Setup
Create an Edge Impulse project
Please follow these instructions for setup and creation of your Edge Impulse account. Once you have an empty project created you can set up your AkidaTM Development Kit and collect your accelerometer data. You will design the Impulse later in this guide.Set Up the Akida Development Kit
To start setting up the device for a custom model deployment, let’s verify you have installed all the packages you need. Ensure the development kit is powered on and connected to the network. Setup Visual Studio Code for remote debugging and open a terminal in VSCode once connected. Run these commands to install the needed components.Data Acquisition to create ML Dataset
After getting the Akida Development Kit configured and having the accelerometer connected you will need to collect data from the accelerometer/fan setup. Since you are using custom devices we have developed code that you can use immediately. You can download with git using: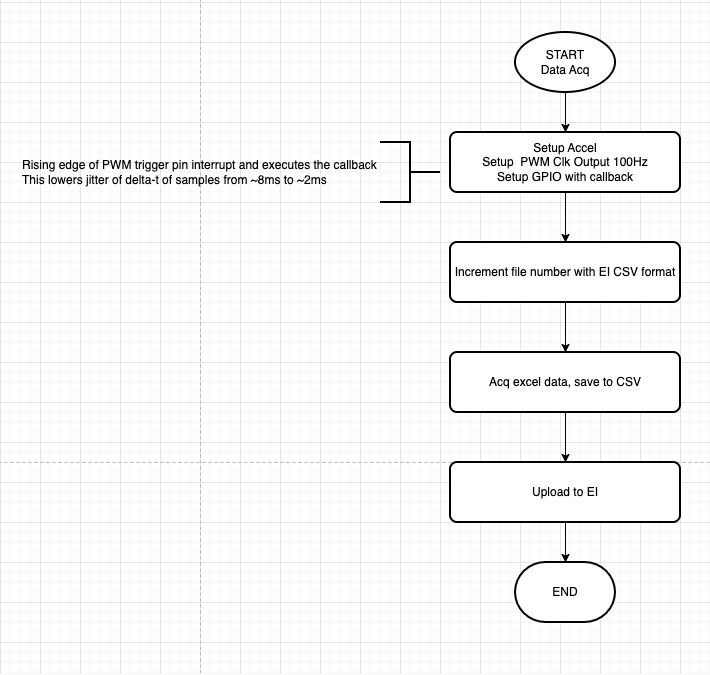
Flow chart of data acquisition
- Fan off — label as “off”
- Fan on — label as “on”
- Fan on with finger lightly rubbing the spinning center hub of the motor — label this as “center”. This is to simulate one possible fault condition.
- Fan on with finger light touching the spinning blade at the outermost edge — label this as “edge”. This simulates another possible fault condition.
Acquiring Accelerometer Data
The Ubuntu operating system running on Raspberry Pi is not an RTOS and so it is impossible to get consistently spaced accelerometer samples. That is, the data acquisition is not hardware timed as the OS has to be interrupted to service the sampling and it can be delayed by other tasks. Therefore there is no guarantee that samples are acquired at a fixed delta-t. In order to get good performance the code implements a hardware interrupt with the PWM and GPIO pins. Our testing showed that the maximum delay in servicing the interrupt went from approximately 8ms to 2ms. The codemake an assumption that the delta-t is fixed at the sample frequency and no variance is recorded.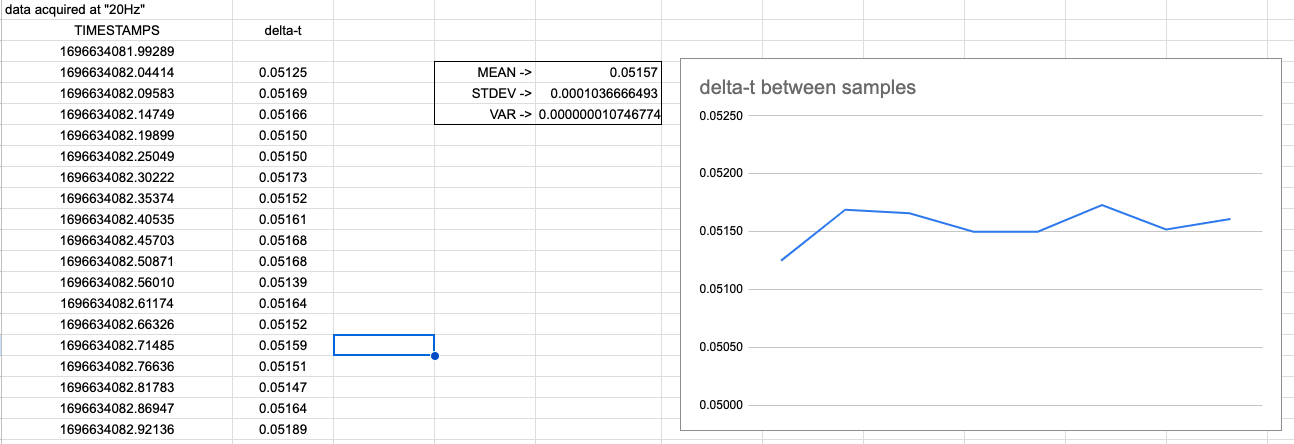
Example data of delta-t between samples over one second. Notice the sample frequency is close to, but not exactly, 50Hz in this example
Less Code with Two Edge Impulse Projects
Since you have not implemented custom C++ processing code for this custom processing block, you are not able to deploy an EIM compiled model from Edge Impulse Studio. That is, if you tried to build an EIM for “Linux (AARCH64 with AKD1000 MINI PCIe)” there would be a build error because of the lack of C++ code to run the DSP on the CPU. You can work around this issue by creating two projects: One that does the custom feature generation (the customer DSP block) to which you select the FBZ file for Akida. Then, a second project that is used only for anomaly detection. This second project you will output the EIM for the anomaly detection to run on the CPU. The Python code that runs on the Enablement device will tie all the pieces together.The First Project: Impulse Setup for Classification Project
Once you have collected the data it is time to design the rest of the Edge Impulse Studio project. This is what your Impulse design should eventually look like.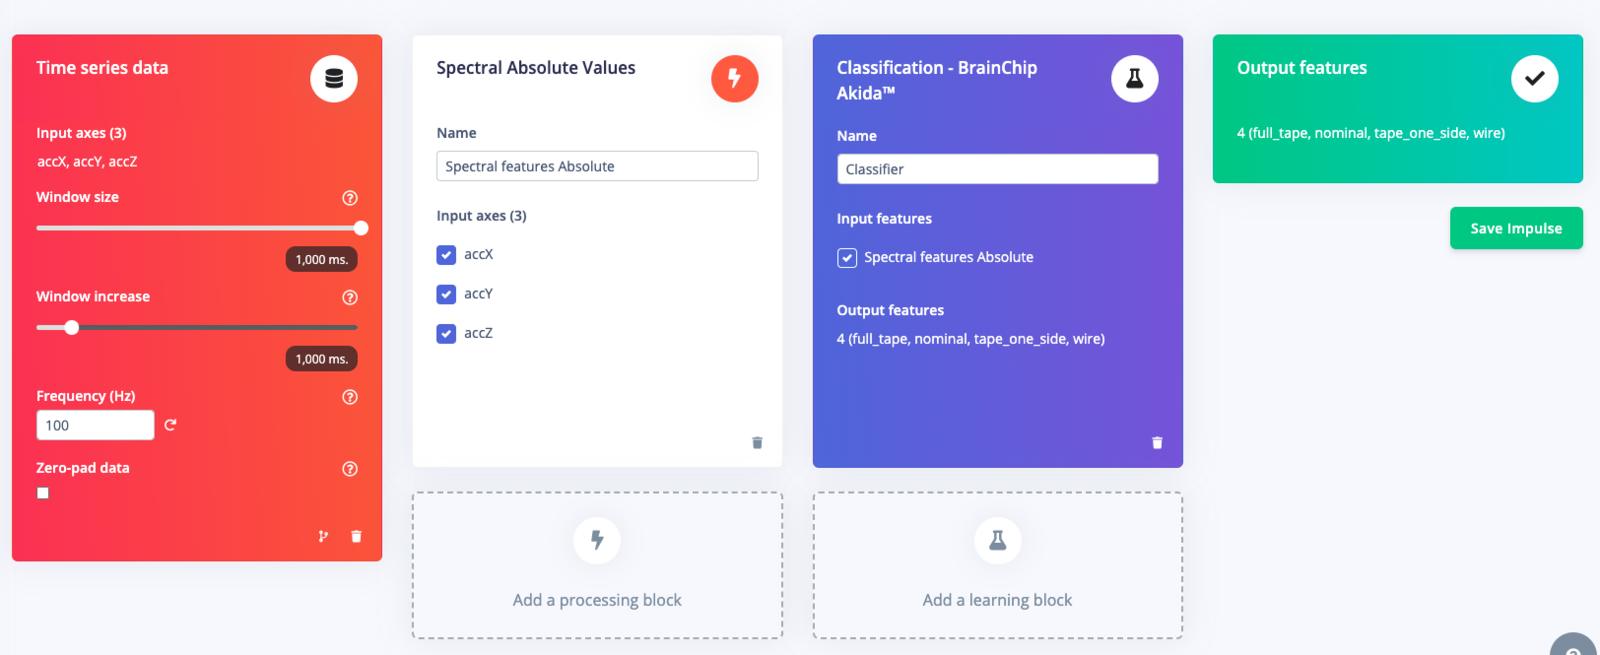
Impulse Design for Classification Project
Timing Series Block
Since you have taken accelerometer data at 100Hz for 1-second record lengths it is important to use those values in the Timing series data block.Processing Block: Custom Spectral Features
Akida dense network uses 4 bit uint8 inputs. This means that the range of input data allowed must be between 0 and 15. The default classification blocks with Edge Impulse output signed float data. Therefore you must use custom spectral features code that makes the training and test dataset correct for the 4-bit, uint8 dense layer classifier. The code for the custom processing block is found here. You will need to follow the instructions of using Custom Processing Blocks to add to your Edge Impulse Studio project.Learn Block: Classification - BrainChip Akida™
Select the Classification - BrainChip Akida™ as the learn block and ensure that the Spectral Features input box is checked. Save the Impulse and proceed onto feature generation.Feature Generation
This process of generating features and determining the most important features of your data will further reduce the amount of signal analysis needed on the device with new and unseen data. An obstruction in the fan will create a much different waveform on all three accelerometer axes than a nominal sample; you can use the most important features to more quickly and accurately determine if a new incoming signal is an obstruction or a fan failure, etc.Training the Classifier
When using the Akida blocks it is important to review the accuracy of the model. Akida heavily quantizes the model and without proper training (especially quantization ware training). The Akida Learning Blocks have this training code implemented and the defaults can work really well with this type of data. To view the model accuracy and Akida specific metrics be sure to select the “Quantized (akida)” as the model version.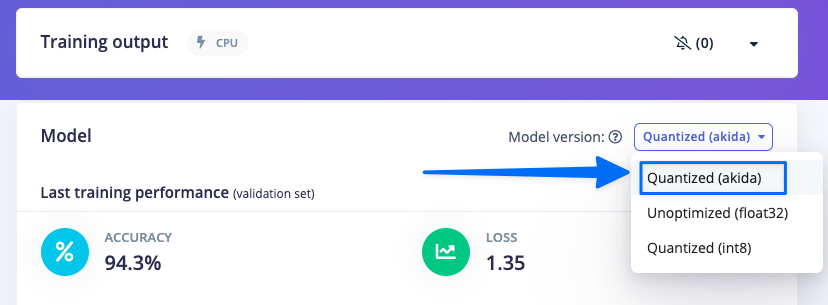
The Second Project: Impulse Setup for the Anomaly Project
Download Data and Create Second Project
From the first project (the classifier project) go into the Dashboard and select Export and follow the step to download the data. Once downloaded go back to the second project (the anomaly project) and in the Data Acquisition tab to upload the recently downloaded data. With the data uploaded you will need to create a new Impulse as shown below.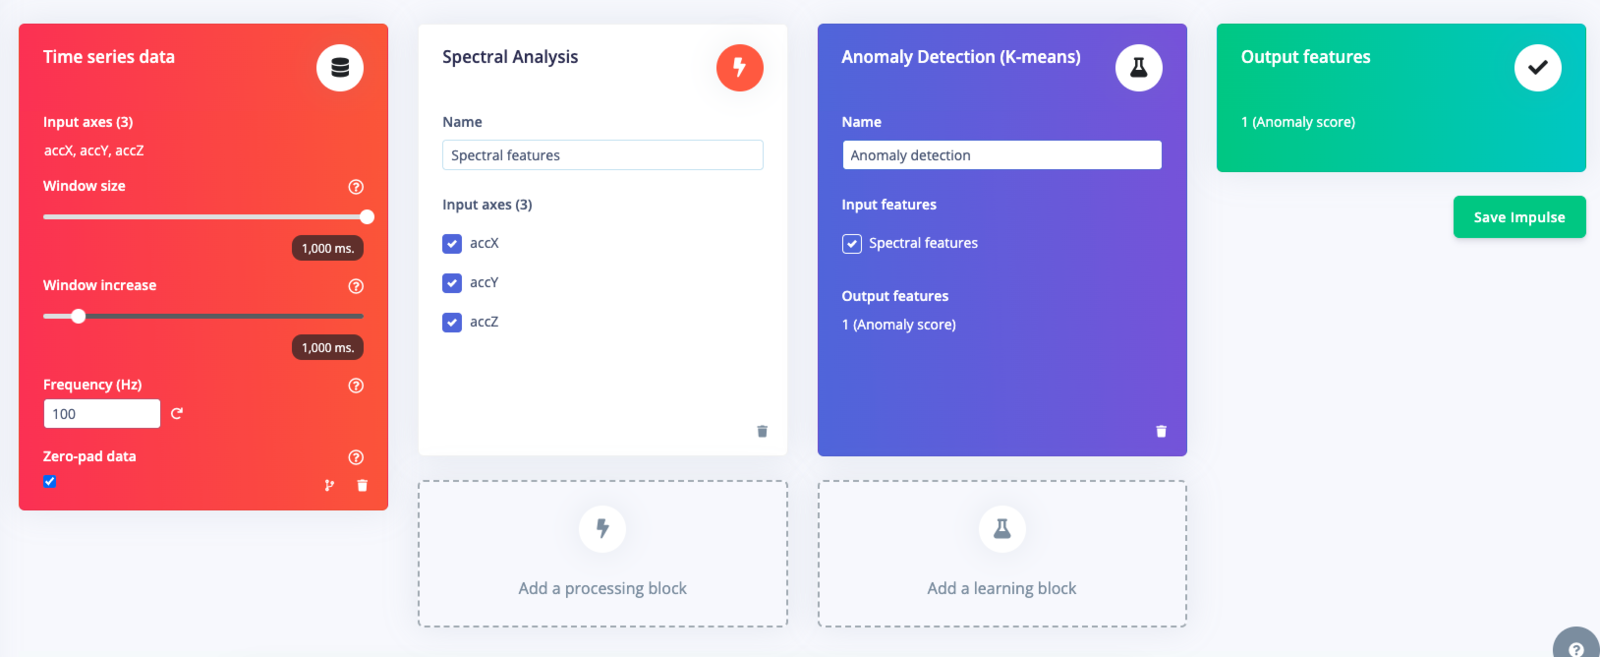
Impulse Design for Second (Anomaly only) Project
Timing Series Block
Since you have taken accelerometer data at 100Hz for 1 second record lengths it is important to use those values in the Timing series data block.Processing Block: Spectral Analysis
The k-mean algorithm does not have the restriction of 4-bit, unsigned data and so does not require a custom block. Please select the default Spectral Analysis block.Learn Block: Anomaly Detection (K-means)
Anomaly detection can be used to detect irregular patterns in the collected sensor data. In Edge Impulse you can implement anomaly detection using one of the available anomaly detection blocks. For this setup you will be using k-means as it is freely available to all Edge Impulse developers. In the anomaly detection block, make sure to click the “Select Suggested Axes” to highlight the features of importance . Without selecting this button, the anomaly detection settings will default to your data’s Root-Mean-Square value (or RMS) for each of the axes. Prior to the release of the feature importance view in the DSP block, the anomaly detection block would prioritize the RMS values, and you would then have to make a decision by yourself if the RMS values were most meaningful for your anomaly detection use case. With feature importance, you take the guesswork out of this and get your model to production even faster!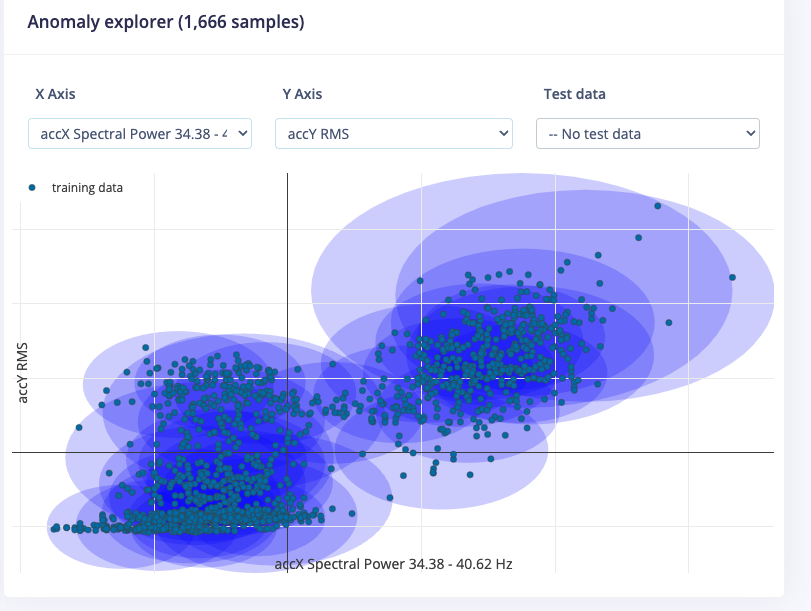
Example of Anomaly Explorer
Download of MetaTF FBZ File
You are using custom code for this project and you will need the Akida compatible model file stored in FBZ format. Proceed to the dashboard of the first project (the classifier project) and select the Classifier model - MetaTF file. Once the file is presented download to your machine and then drag and drop into the brainchip_accelerometer folder in the open Visual Studio Code file viewer.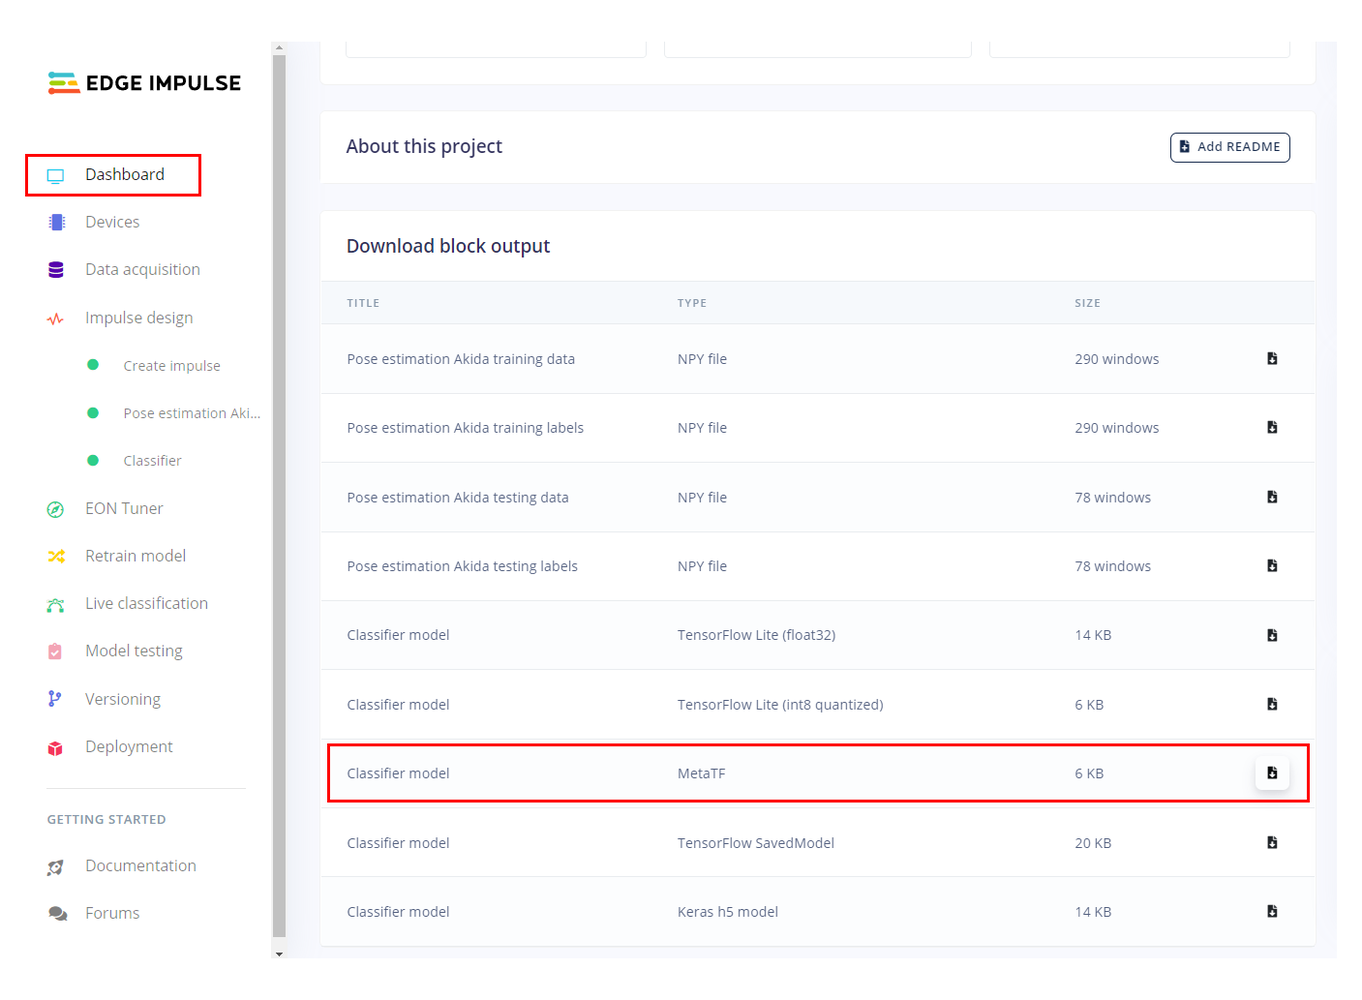
Download of Edge Impulse Anomaly Scoring model .eim
The anomaly scoring algorithm can be neatly packaged into an Edge Impulse .eim file. To do so go to the Deployment tab of the second Edge Impulse project (the one with the k-mean anomaly scoring) and select Linux (AARCH64) from the drop down menu and click Build. Once the file is presented, download it to your machine and then drag and drop into the brainchip_accelerometer folder in the open Visual Studio Code file viewer.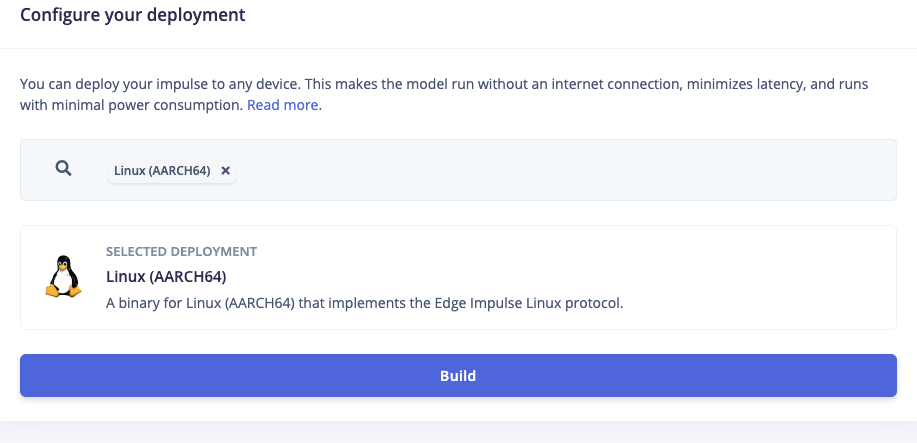
On-Device Inferencing
Once all the files are in the correct directory you can run the inference demo with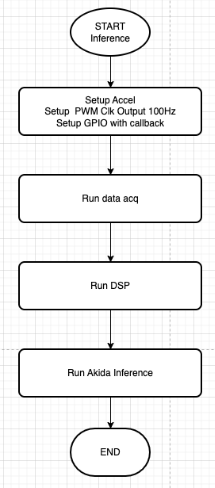
Flow chart of inferencing code