Introduction
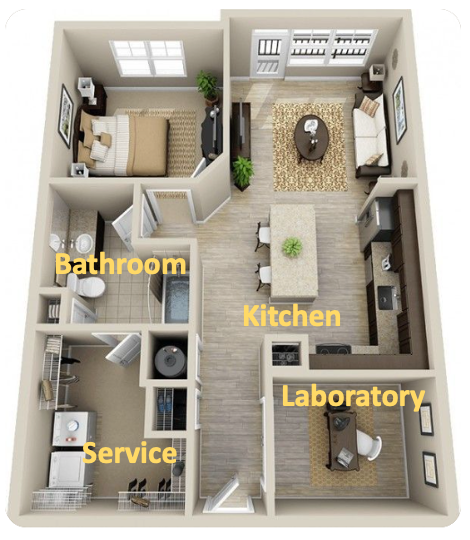
This tutorial will develop a model based on the data captured with the Sony Spresense sensor extension board, SensiEDGE’s CommonSense. The general idea is to explore sensor fusion techniques, capturing environmental data such as temperature, humidity, and pressure, adding light and VOC (Volatile Organic Compounds) data to estimate what room the device is located within. We will develop a project where our “smart device” will indicate where it is located among four different locations of a house:- Kitchen,
- Laboratory (Office),
- Bathroom, or
- Service Area
- Sony’s Spresense main board installation and test (Arduino IDE 2.x)
- Spresense extension board installation and test (Arduino IDE 2.x)
- Connecting the CommonSense board to the Spresense
- Connecting the CommonSense board to the Edge Impulse Studio
- Creating a Sensor Log for Dataset capture
- Dataset collection
- Dataset Pre-Processing (Data Curation)
- Uploading the Curated data to Edge Impulse Studio
- Training and testing the model
- Deploying the trained model on the Spresense-CommonSense board
- Doing Real Inference
- Conclusion
Sony’s Spresense Installation (Arduino IDE 2.x)
You can follow this link for a more detailed explanation.- Installing USB-to-serial drivers (CP210x)
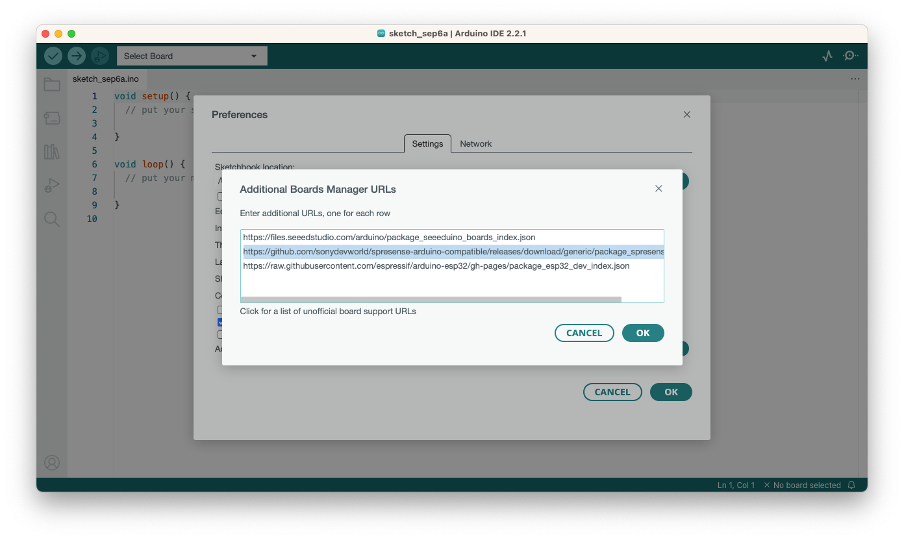
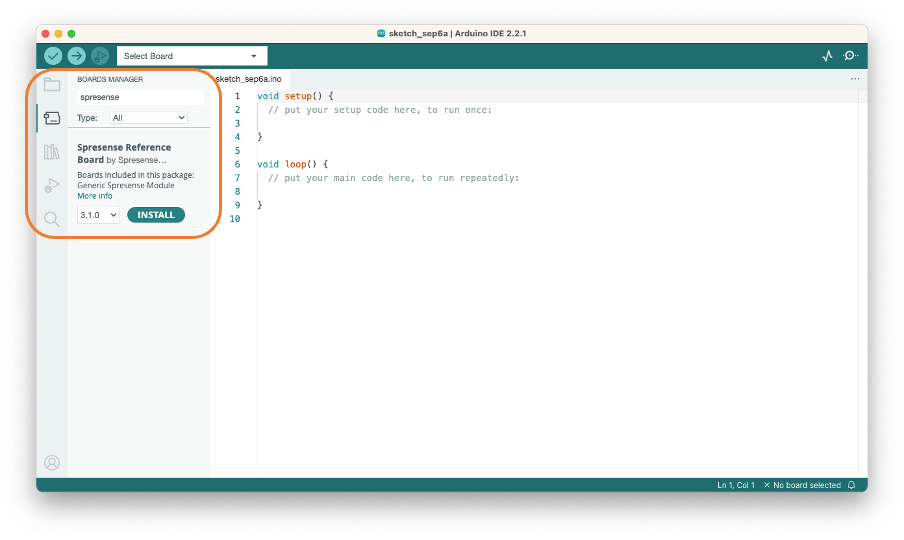
- Install Spresense Arduino Library
https://github.com/sonydevworld/spresense-arduino-compatible/releases/download/generic/package_spresense_index.json
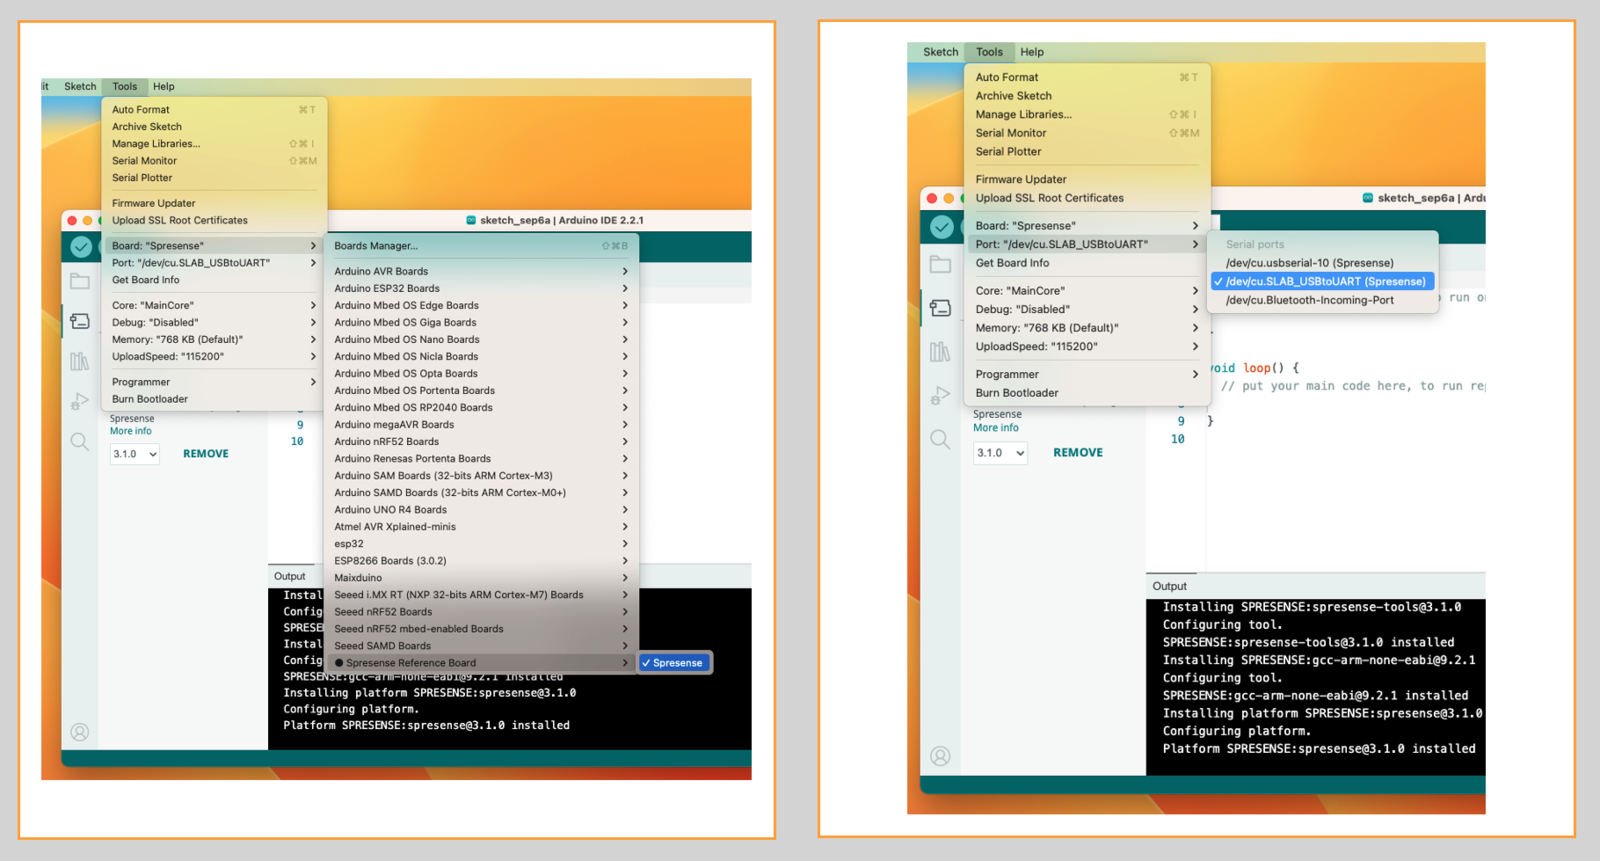
- Install Reference Board:
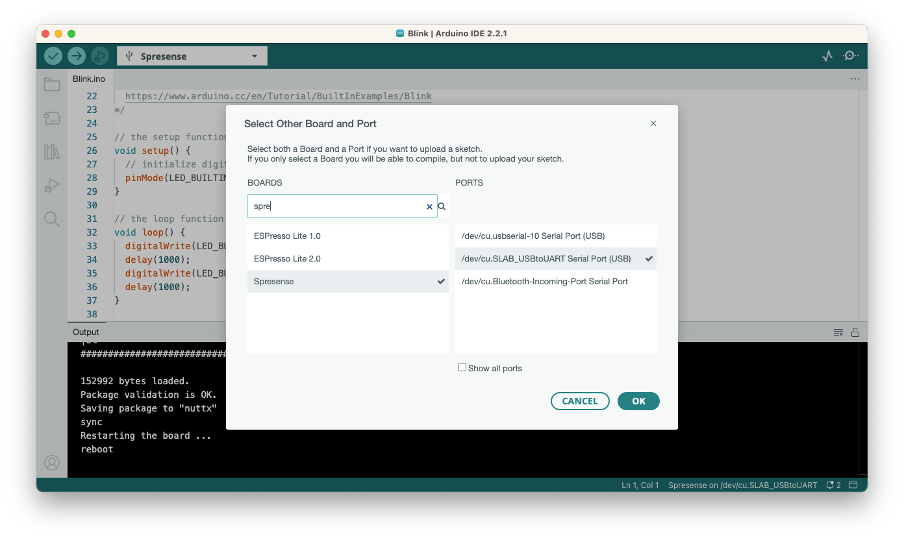
- Select Board and Port
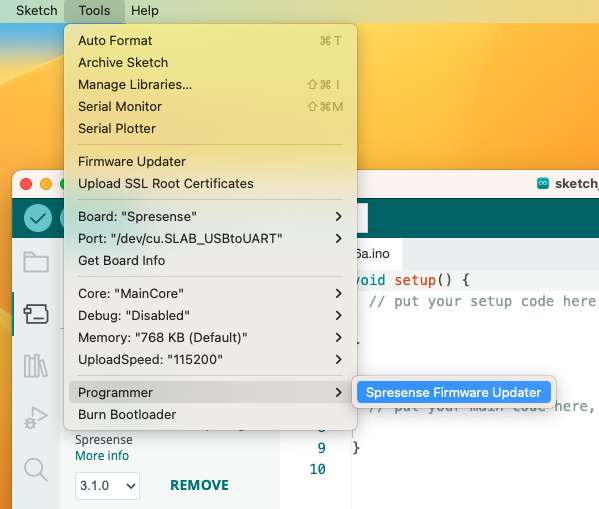
- Install BootLoader
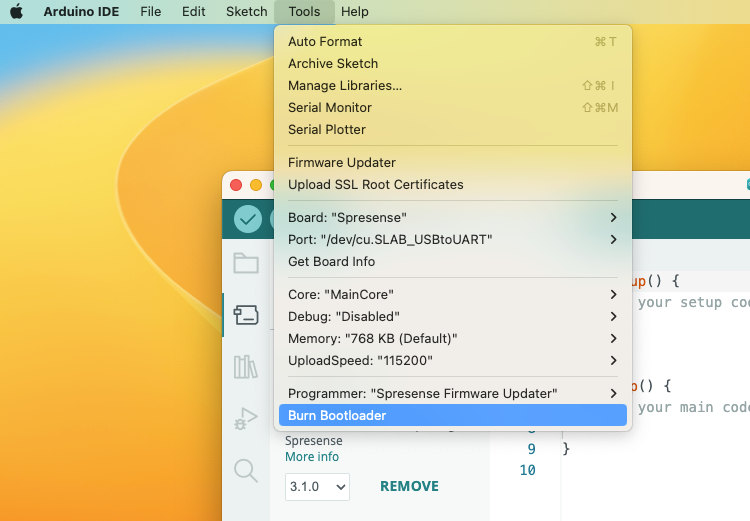
Testing Installation
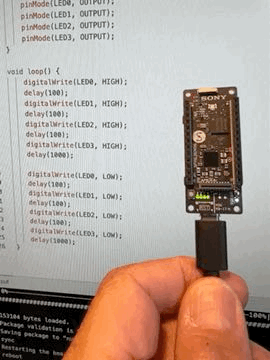
Run the BLINK sketch on Examples → Basics → Blink.ino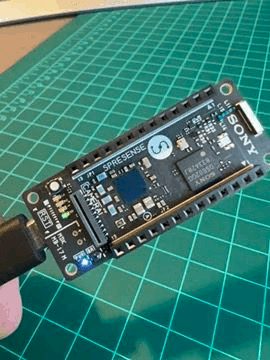
Installing the Spresense Extension Board
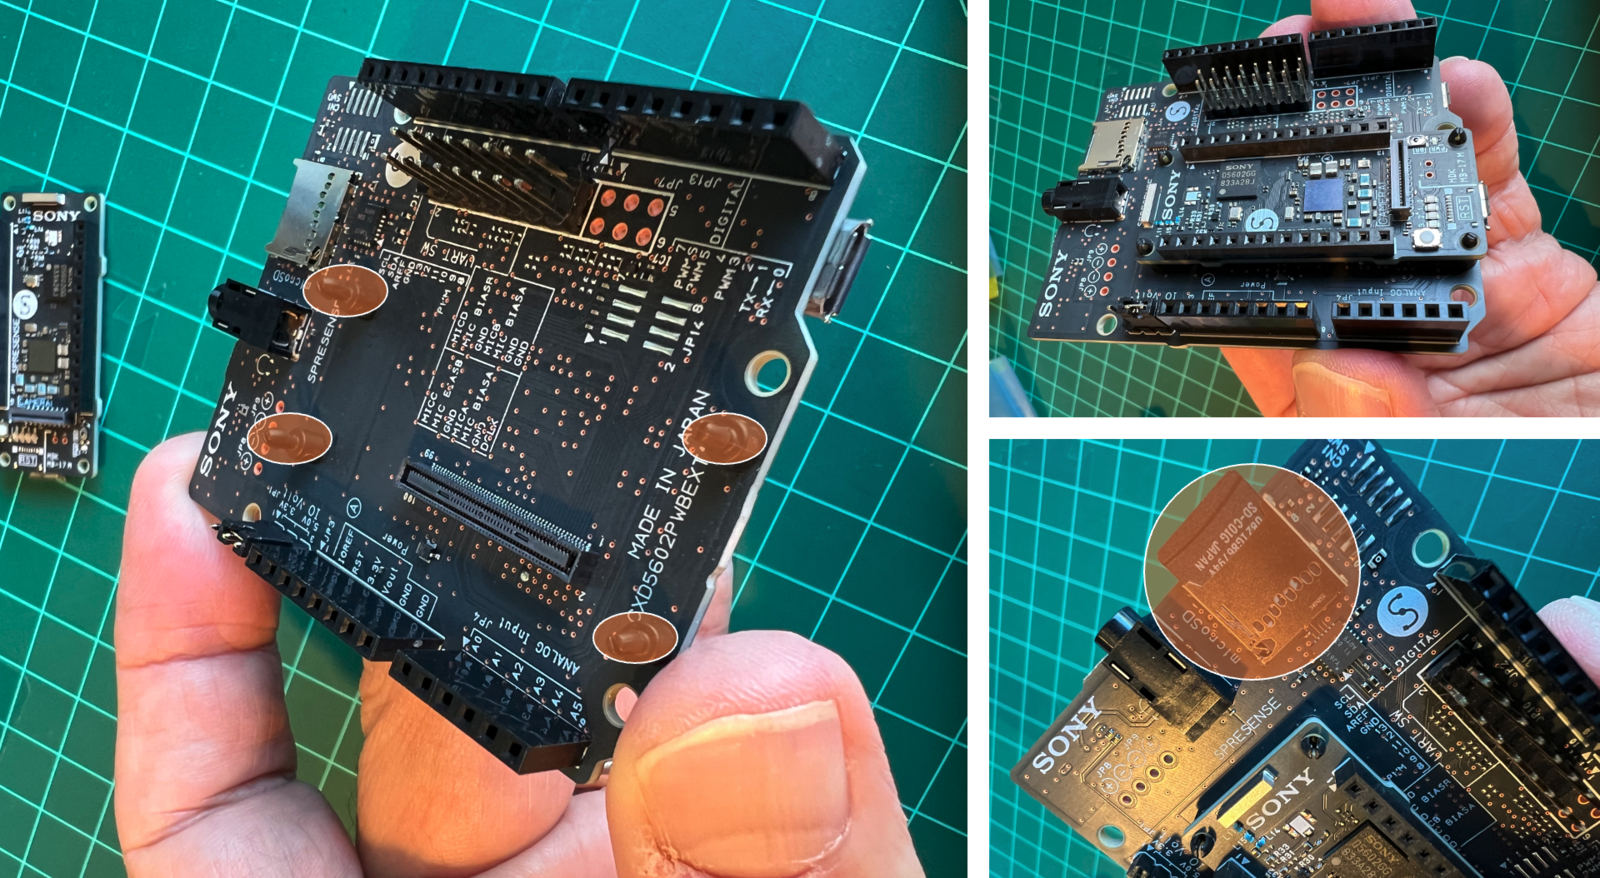
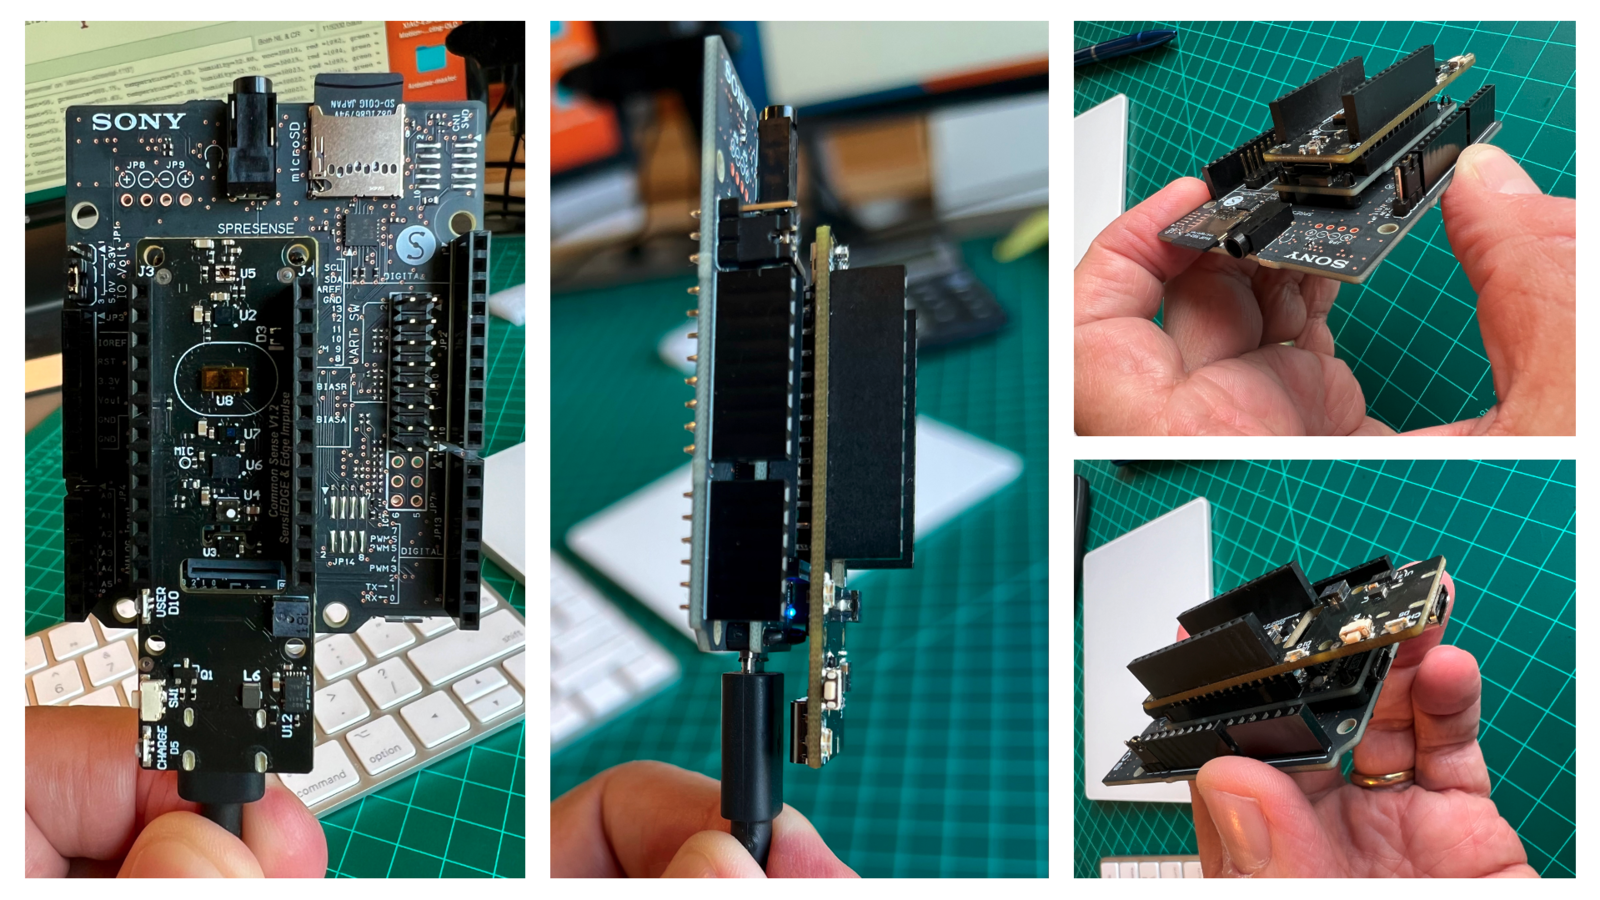
Main Features: Audio input/output - 4ch analog microphone input or 8ch digital microphone input, headphone output Digital input/output - 3.3V or 5V digital I/O Analog input - 6ch (5.0V range) External memory interface - microSD card slot It is important to note that the Spresense main board is a low-power device running on 1.8V (including I/Os). So, installing the main board on the extension board, which has an Arduino UNO form factor and accepts up to 5V on GPIOs, is advised. Besides, the microSD card slot will be used for our Datalog.How to Attach the Spresense Extension Board and the Main Board
The package of the Spresense board has 4 spacers to attach the Spresense main board.
Testing the SD Card Reader
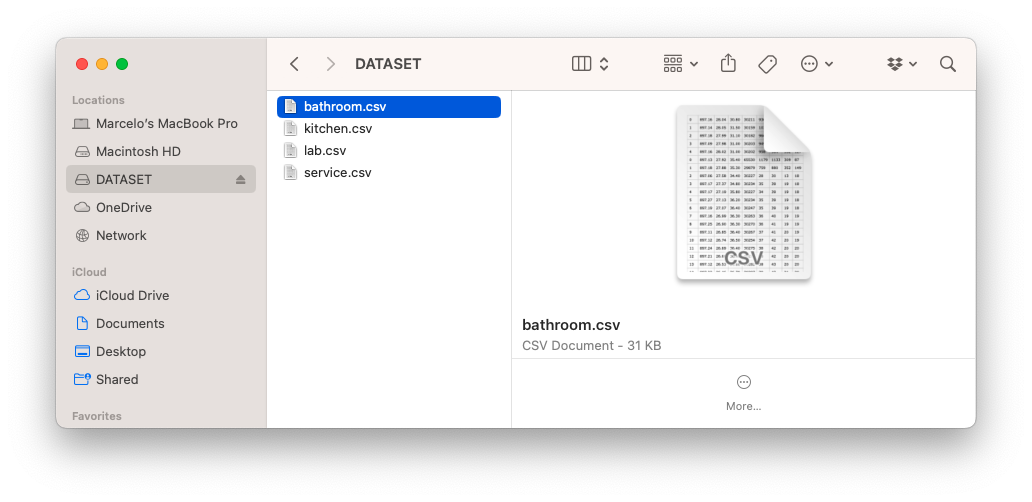
Run: Examples → File → read_write.ino under Espressif. You should see the messages on the Serial Monitor showing that “testing…” was written on the SD card. Remove the SD card and check it on your computer. Note that I gave my card the name DATASET. Usually, for new cards, you will see, for example, NO NAME.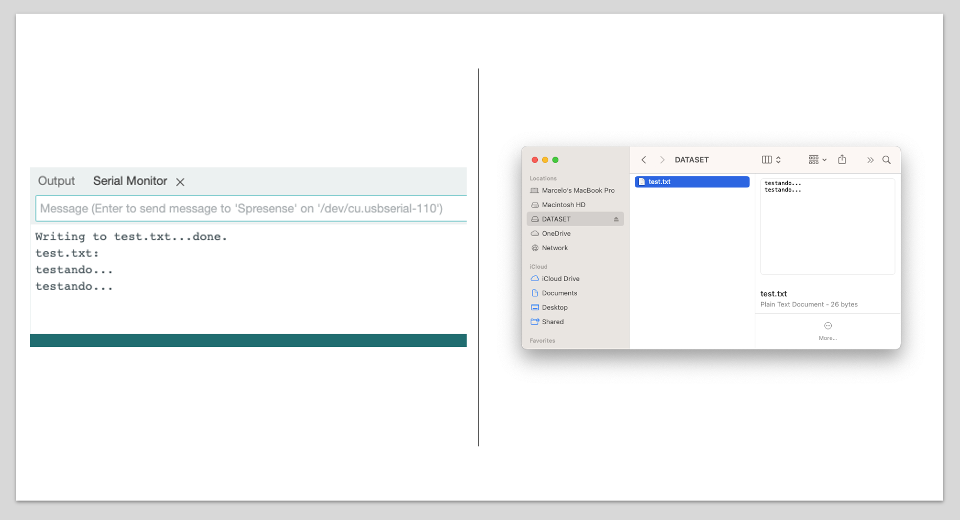
Installing the SensiEDGE’s CommonSense Board
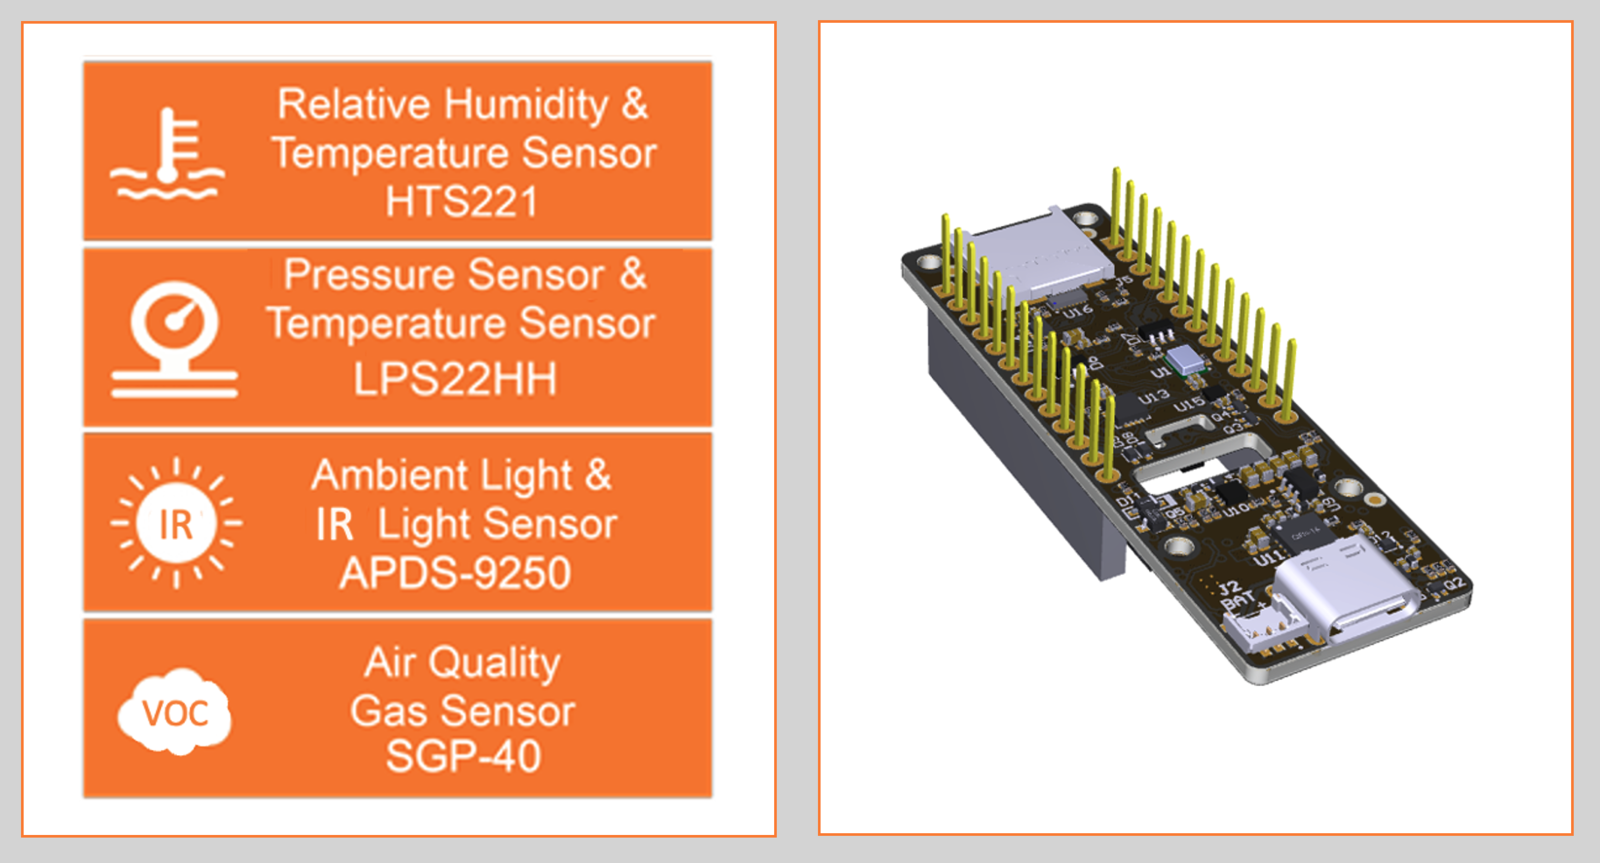
The CommonSense expansion board, produced by SensiEDGE, provides an array of new sensor capabilities to Spresense, including an accelerometer, gyroscope, magnetometer, temperature, humidity, pressure, proximity, ambient light, IR, microphone, and air quality (VOC). As a user interface, the board contains a buzzer, a button, an SD card reader, and a RGB LED. The CommonSense board also features an integrated rechargeable battery connection, eliminating the necessity for a continuous power supply and allowing finished products to be viable for remote installations where a constant power source might be challenging to secure. Below is a block diagram showing the board’s main components: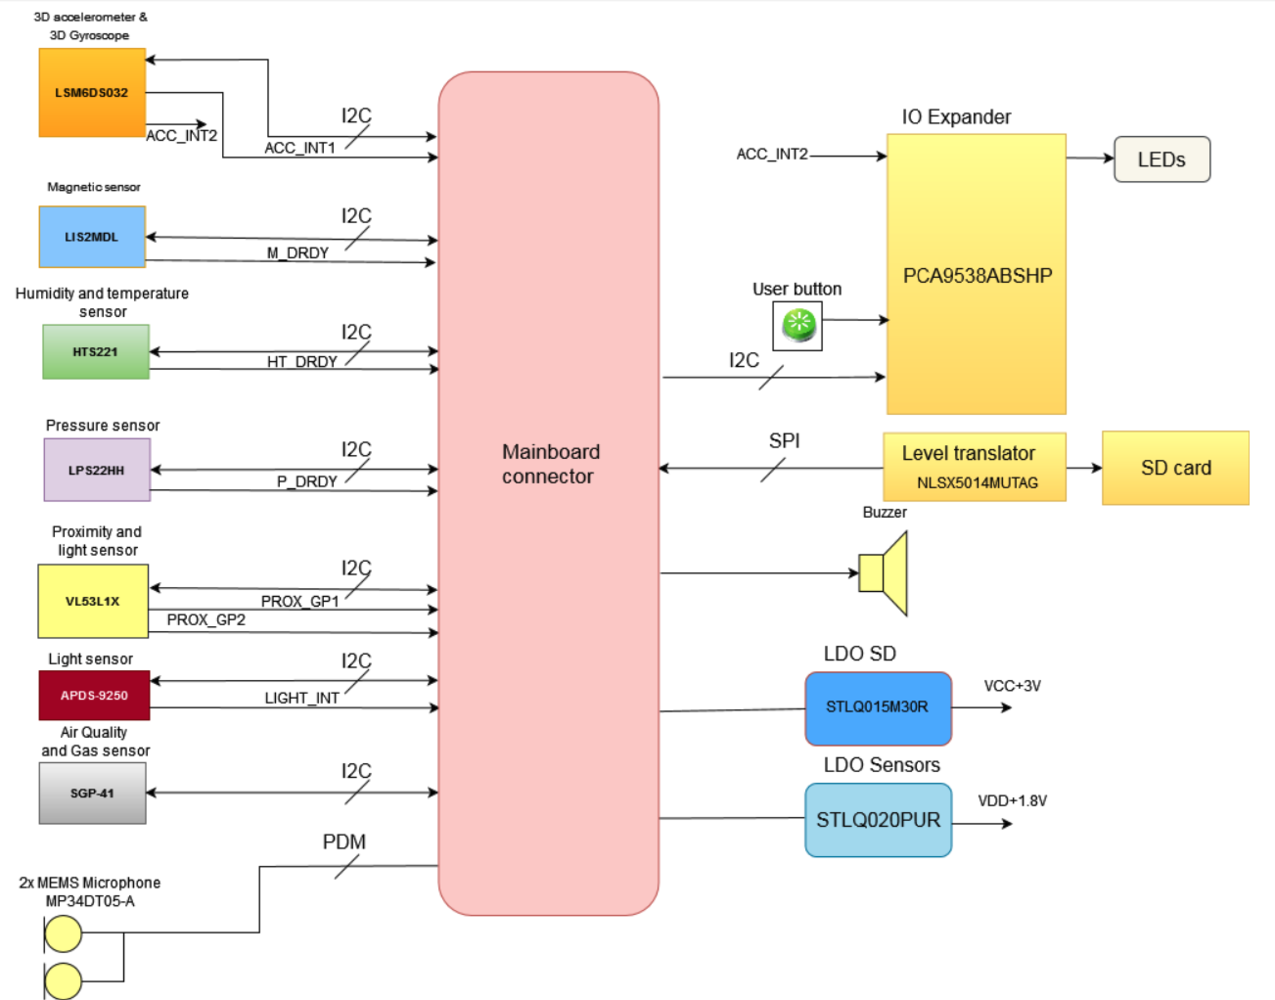
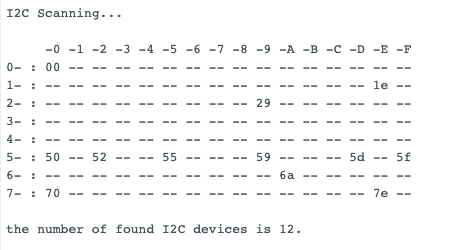
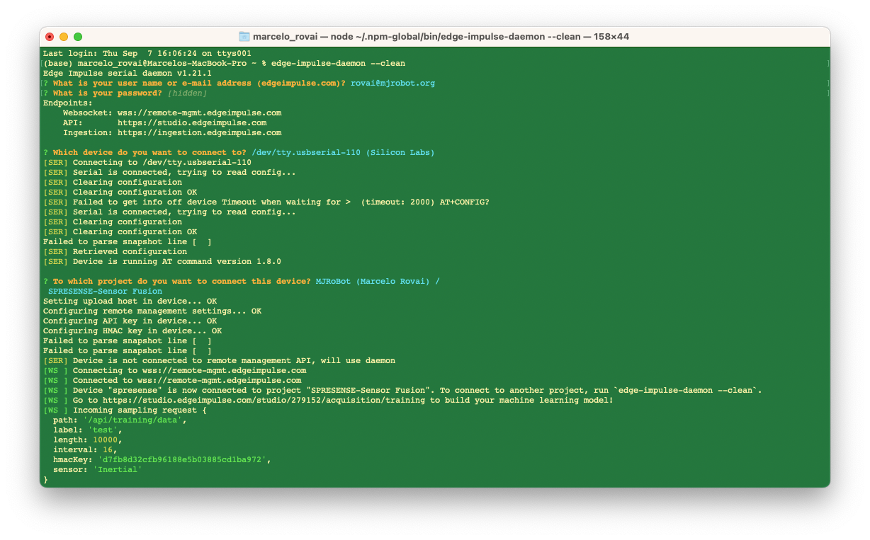
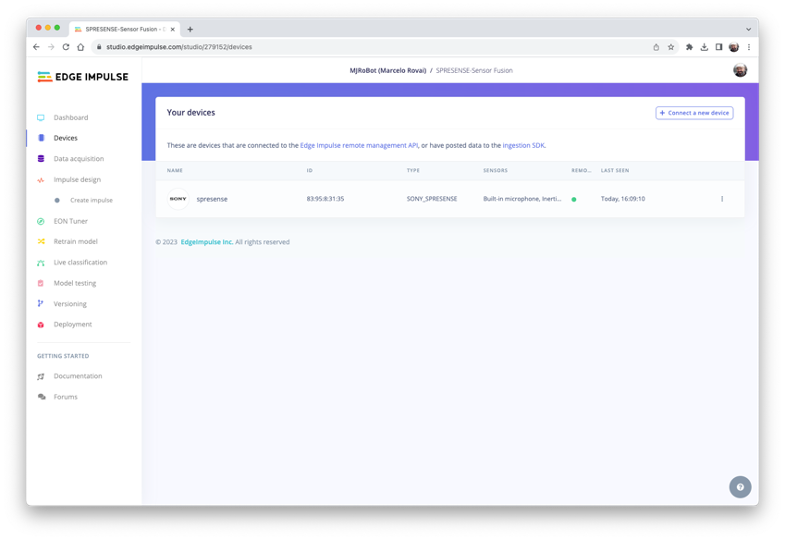
Connecting the CommonSense Board to the Edge Impulse Studio
Go to EdgeImpulse.com, create a Project, and connect the device: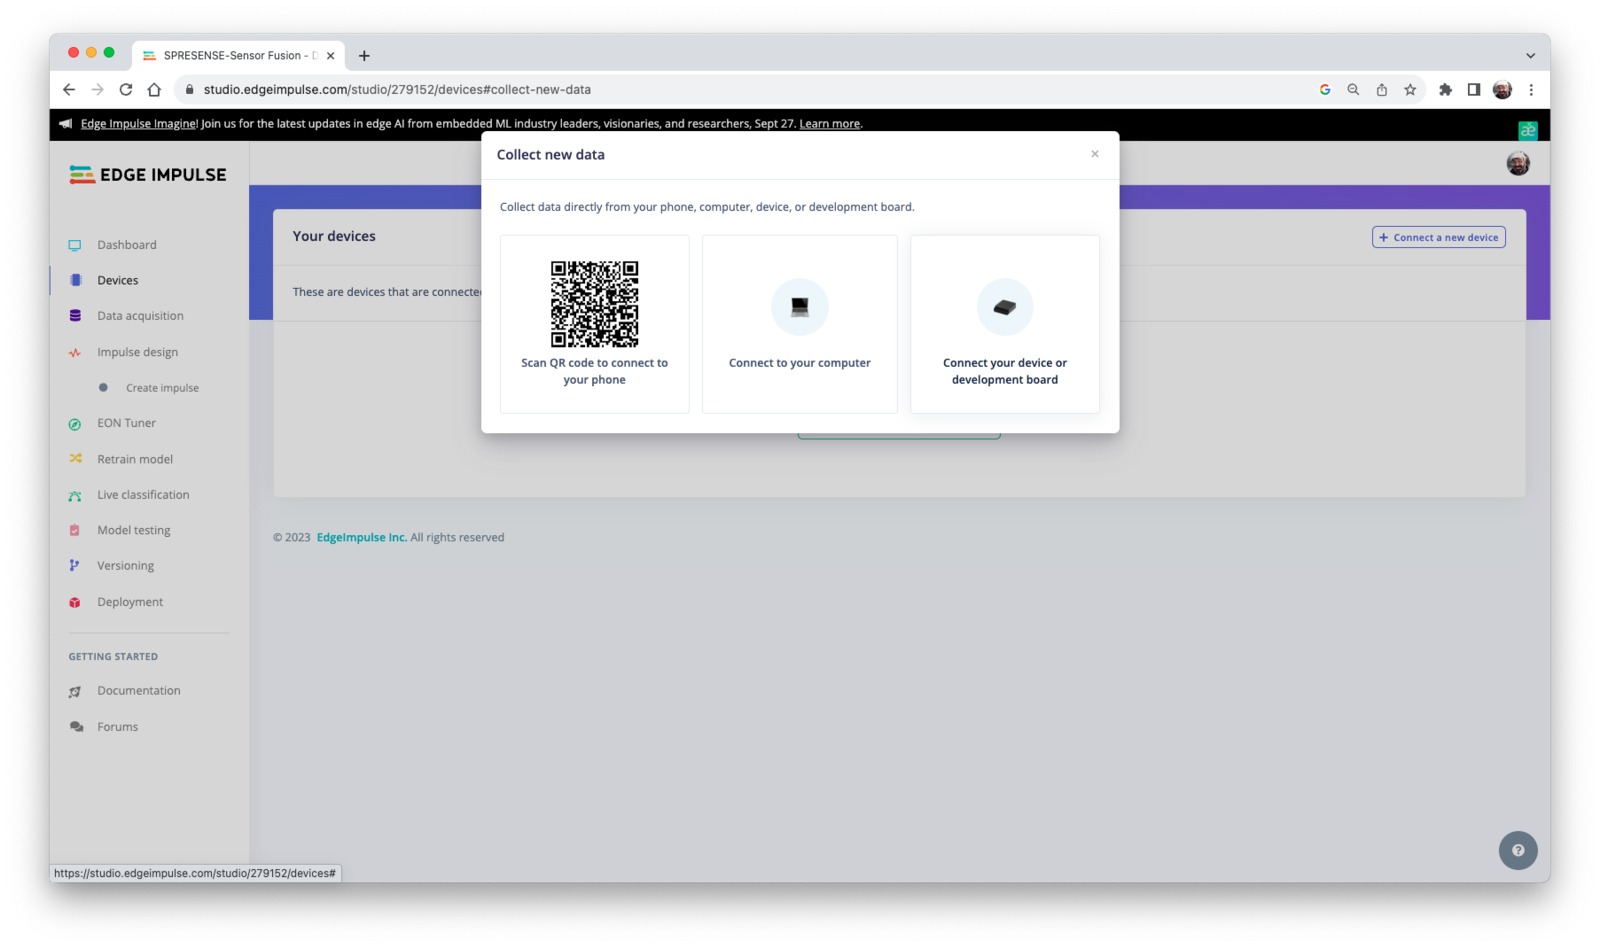

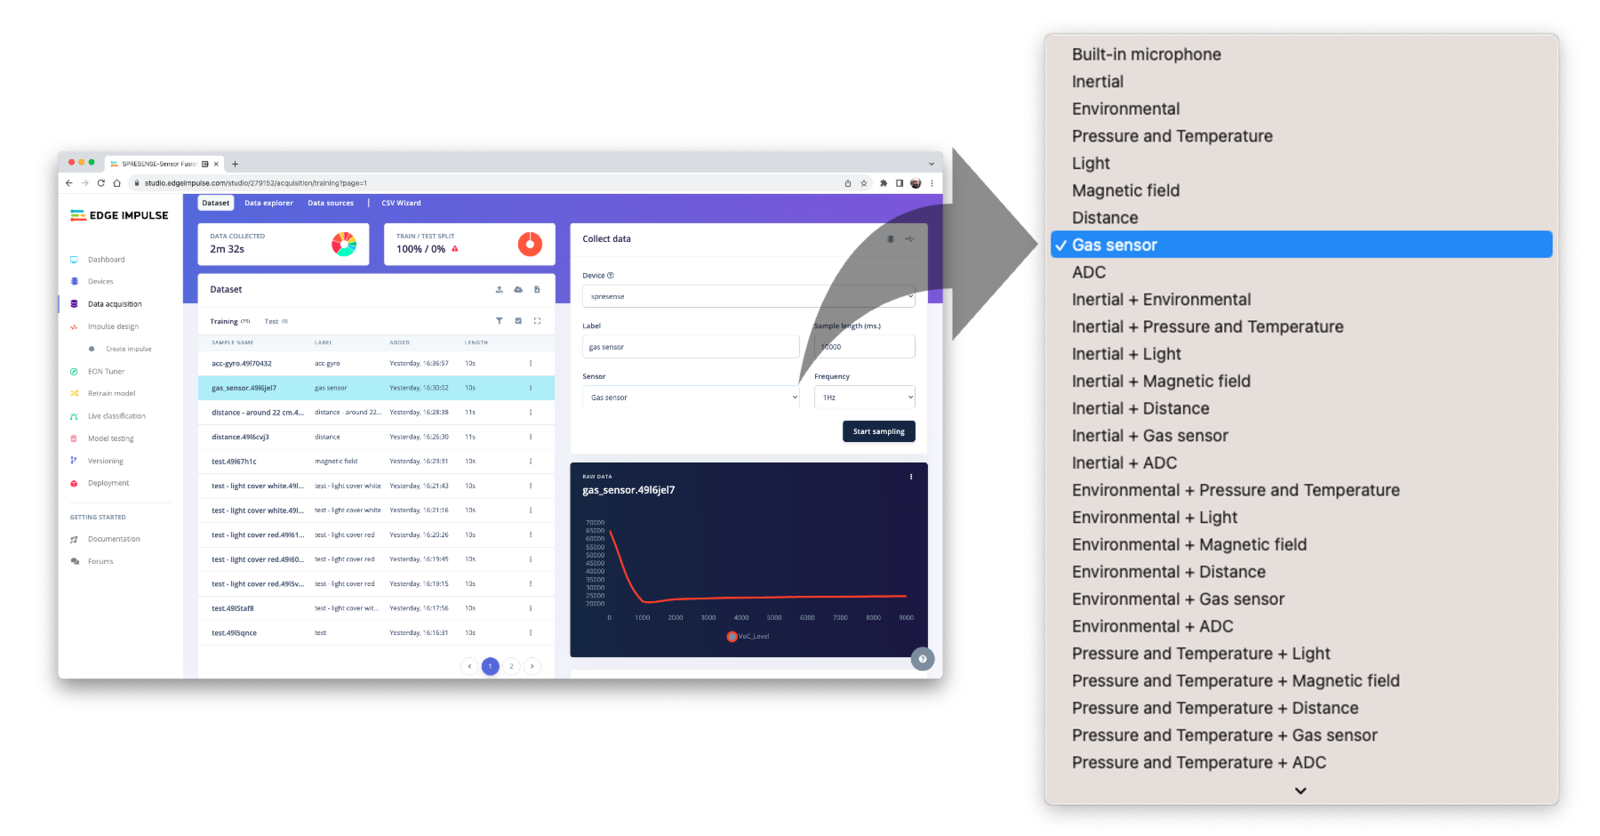
Creating a Sensor Datalogger
Installing the Sensor Libraries on the Arduino IDE
For our project, we will need to install the libraries for the following sensors:- VOC - SGP40
- Temperature & Humidity - HTS221TR
- Pressure - LPS22HH
- Light - APDS9250
- APDS-9250: Digital RGB, IR, and Ambient Light Sensor Download the Arduino Library and install it (as .zip): https://www.artekit.eu/resources/ak-apds-9250/doc/Artekit_APDS9250.zip
- HTS221 Temperature & Humidity Sensor Install the STM32duino HTS221 directly on the IDE Library Manager
- SGP40 Gas Sensor Install the Sensirion I2C SGP40
- LPS22HH Pressure Sensor Install the STM32duino LPS22HH
- VL53L1X Time-of-Flight (Distance) Sensor (optional*) Install the VLS53L1X by Pololu
- LSM6DSOX 3D accelerometer and 3D gyroscope Sensor (optional*) Install the Arduino_LSM6DSOX by Arduino
- LIS2MDL - 3-Axis Magnetometer Sensor (optional*) Install the STM32duino LIS2MDL by SRA
The Datalogger Code
The code is simple. On a specified interval, the data will be stored on the SD card with a sample frequency specified on the line: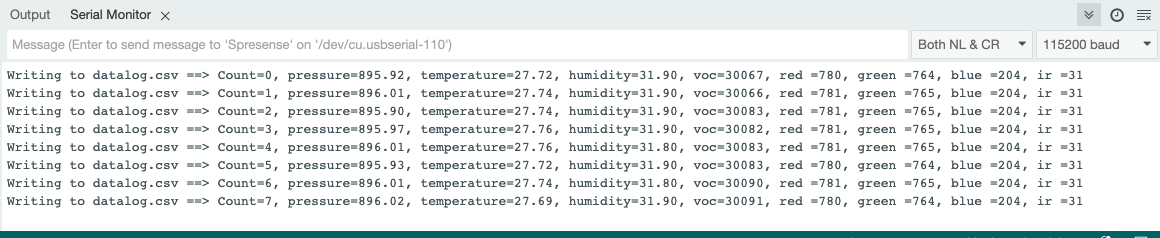
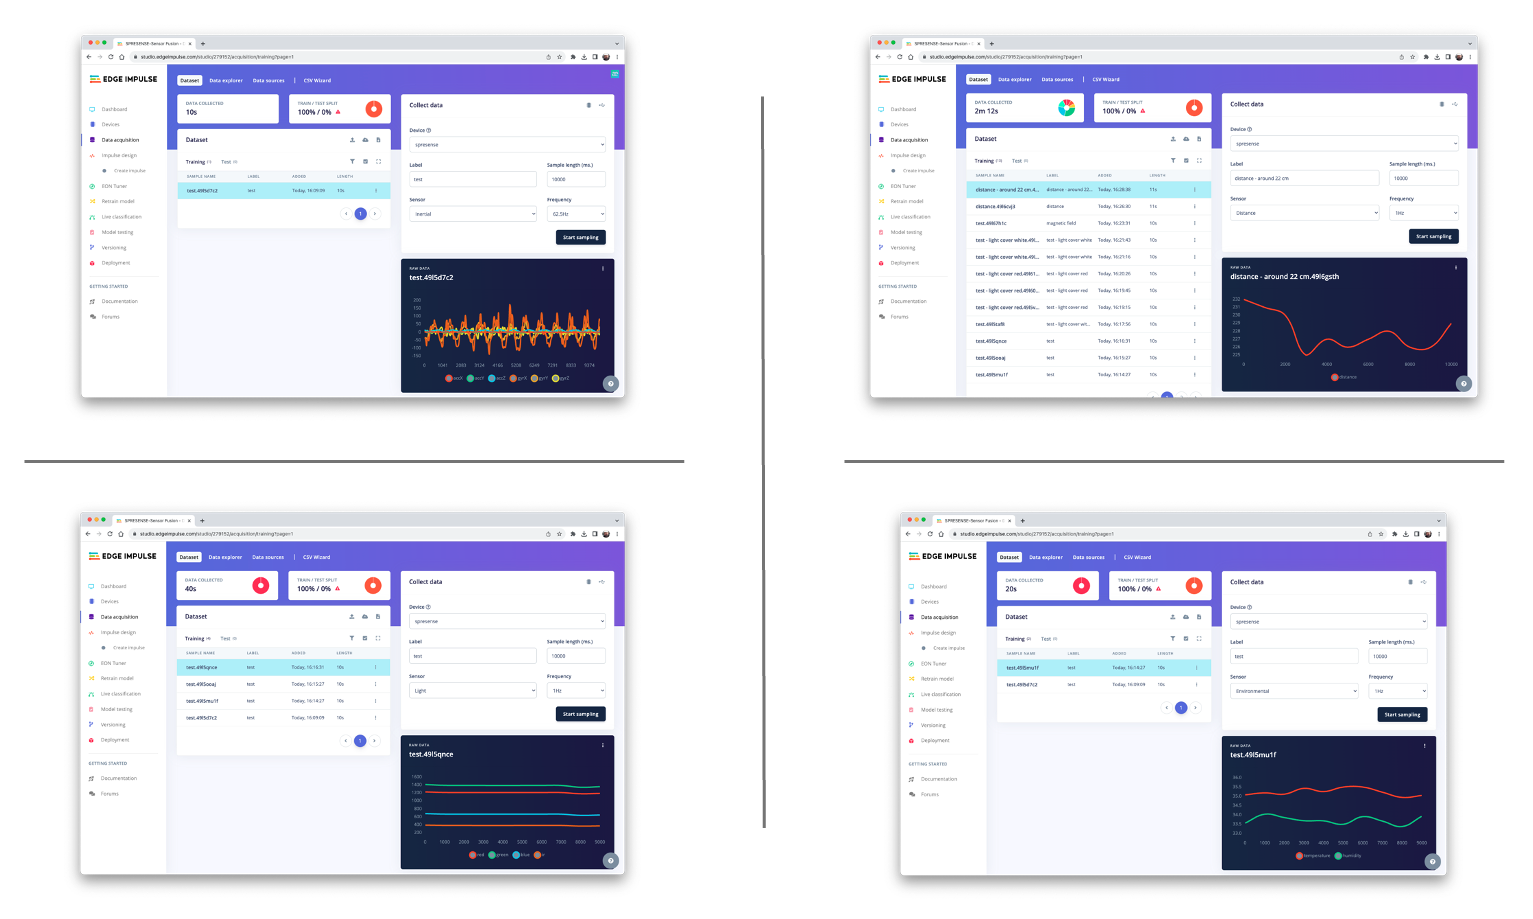
Dataset Collection
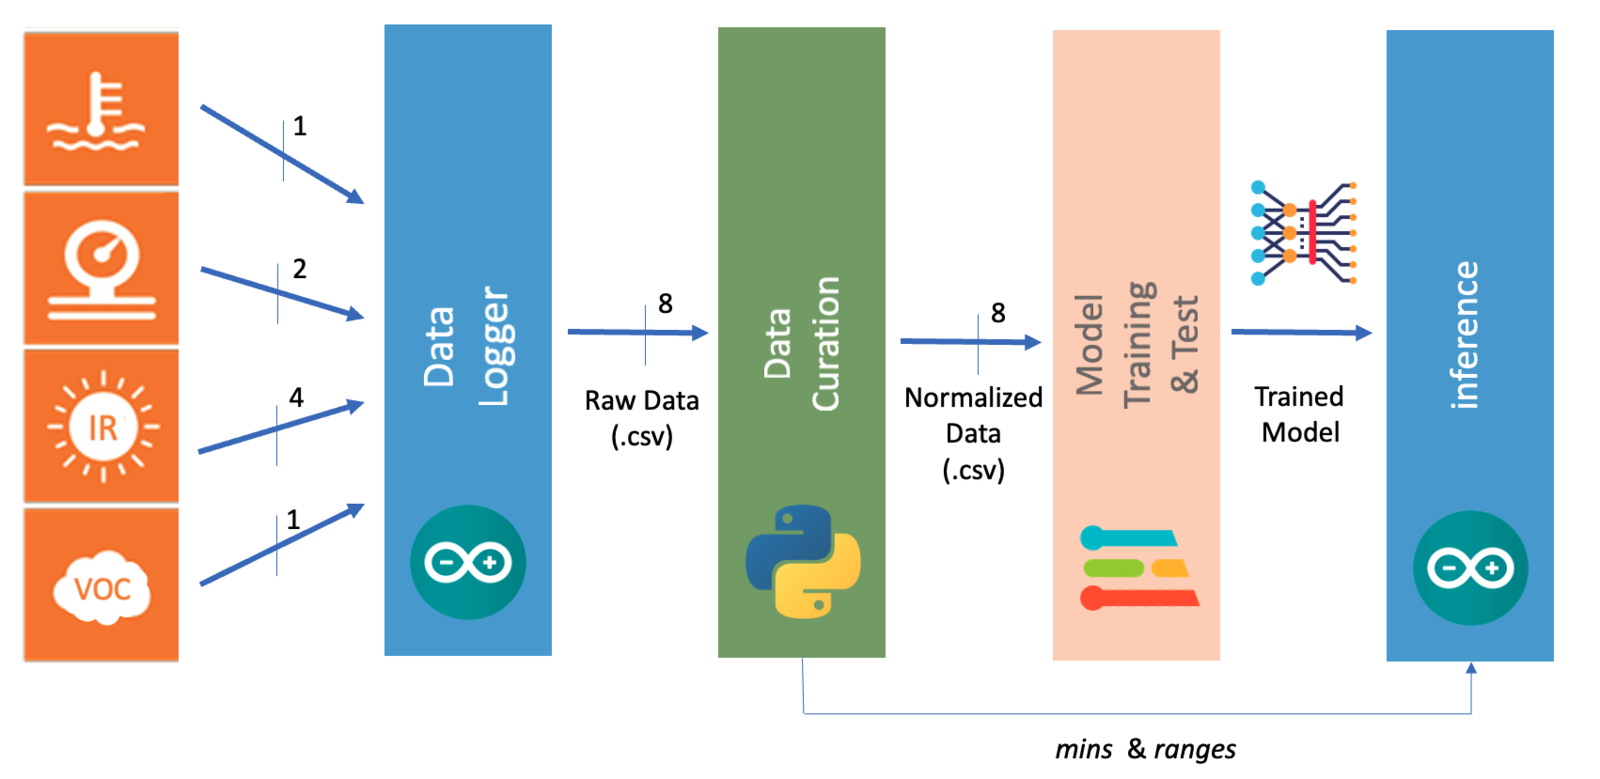
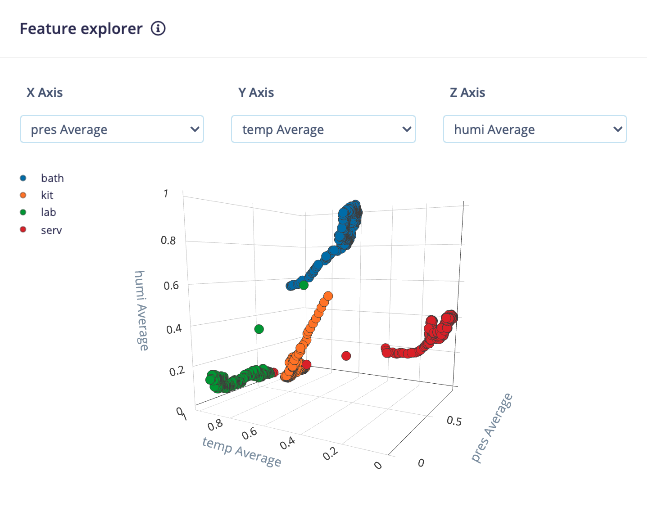
The data logger will capture data from the eight sensors (pressure, temperature, humidity, VOC, light-red, light-green, light-blue, and IR). I have captured around two hours of data (one sample every 10 seconds) in each housing area (Laboratory, Bathroom, Kitchen, and Service Area). The CommonSense device worked offline and was powered by a 5V Powerbank as shown below: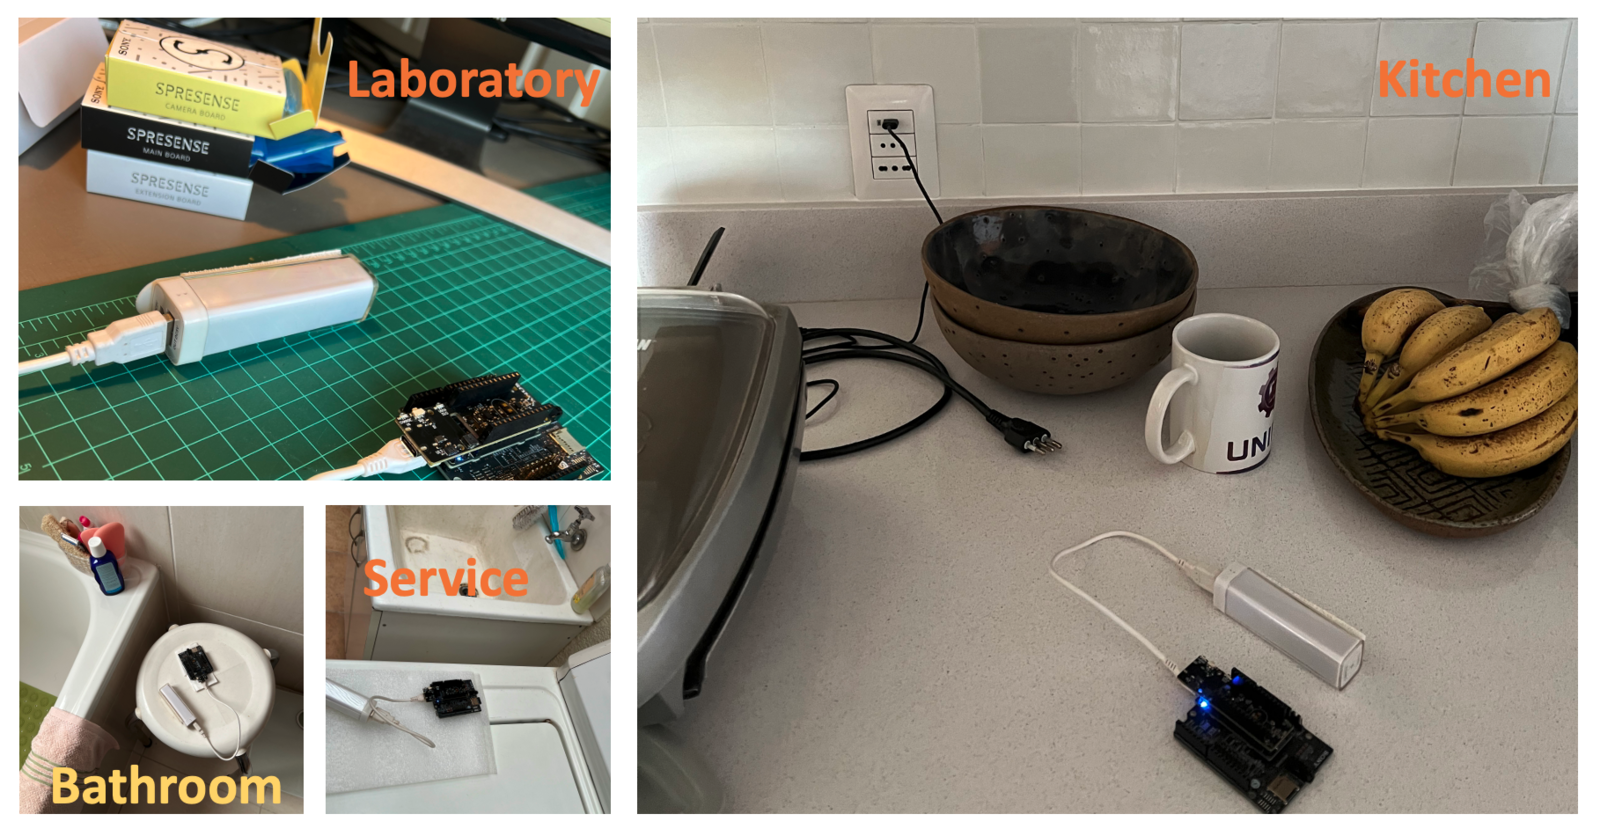
Uploading the Data to Edge Impulse Studio
As a first test, I uploaded the data to the Studio using the “CSV Wizard” tool. I also left it to the Studio to split the data into Train and Test data. Once the TimeStamp column of my raw data was a sequential number, the Studio considered the sampled frequency, 1Hz, which is OK.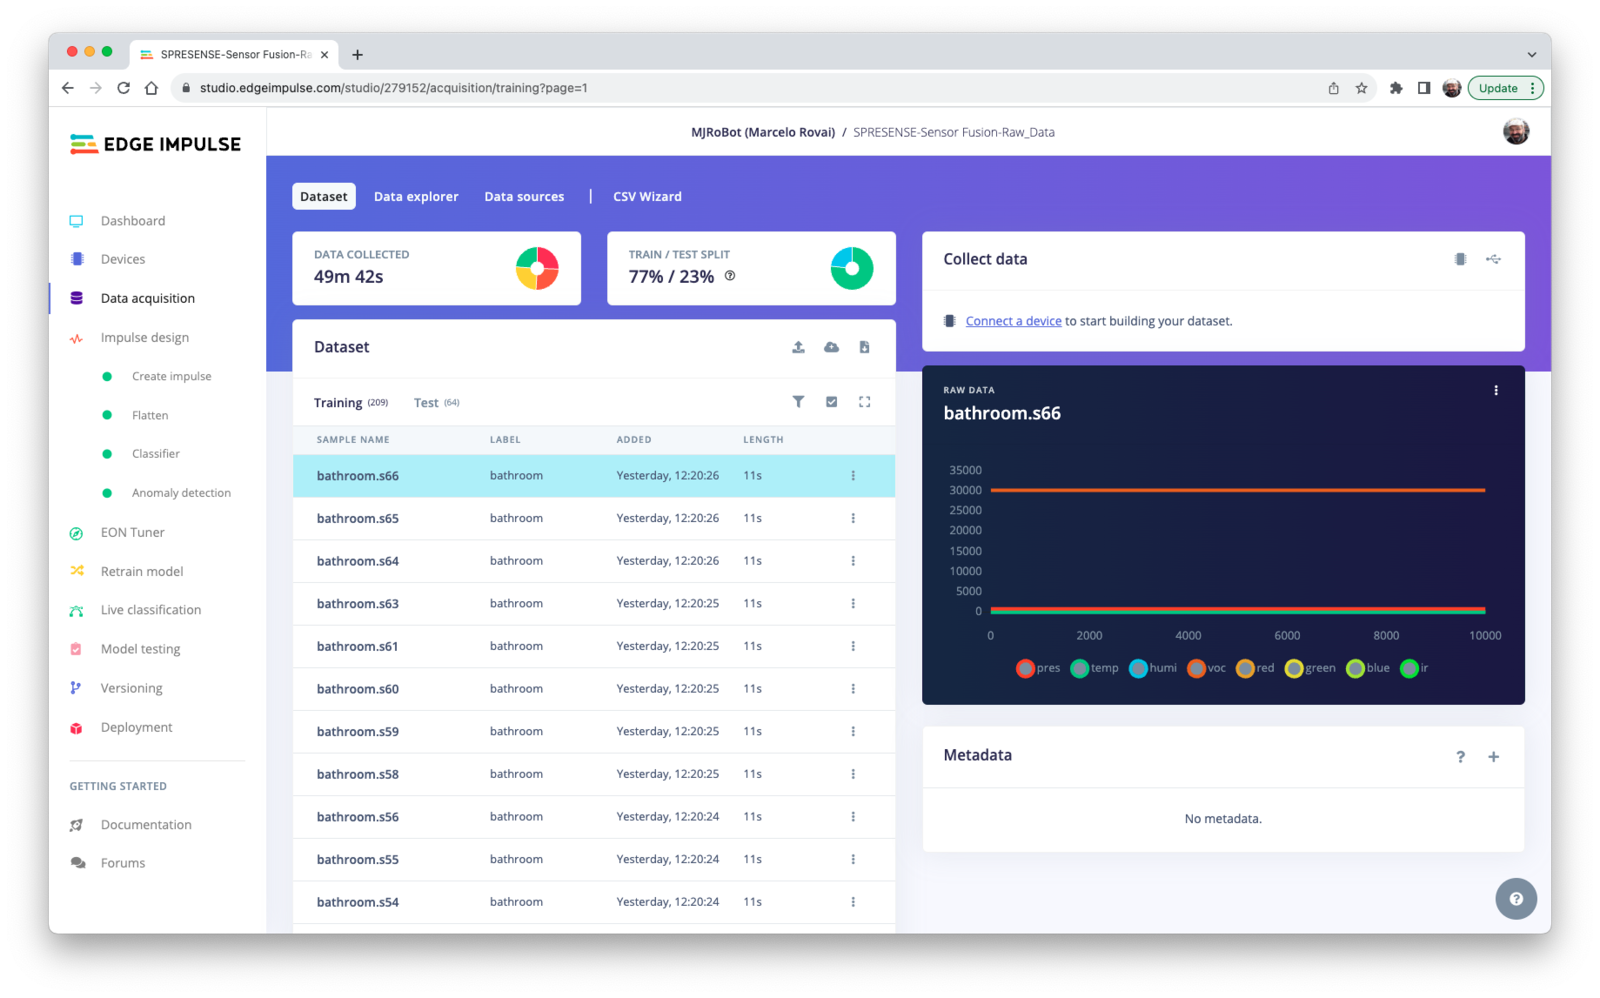
Curating the Dataset
In the tutorial “Using Sensor Fusion and Machine Learning to Create an AI Nose”, Shawn Hymel explains how to have a sound Sensor Fusion project. In this project, we will follow his advice. Use the notebook[data_preparation.ipynb](https://github.com/Mjrovai/Sony-Spresense/blob/main/notebooks/Spresence-CommonSense/data_preparation.ipynb) for data curation, following the steps:
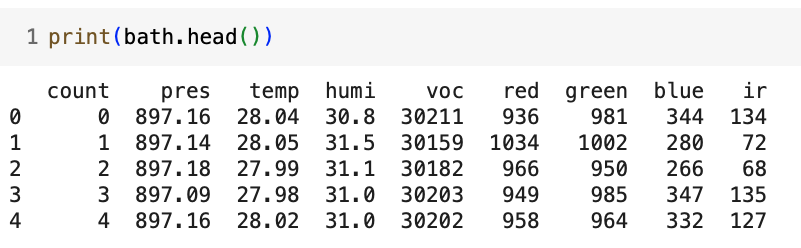
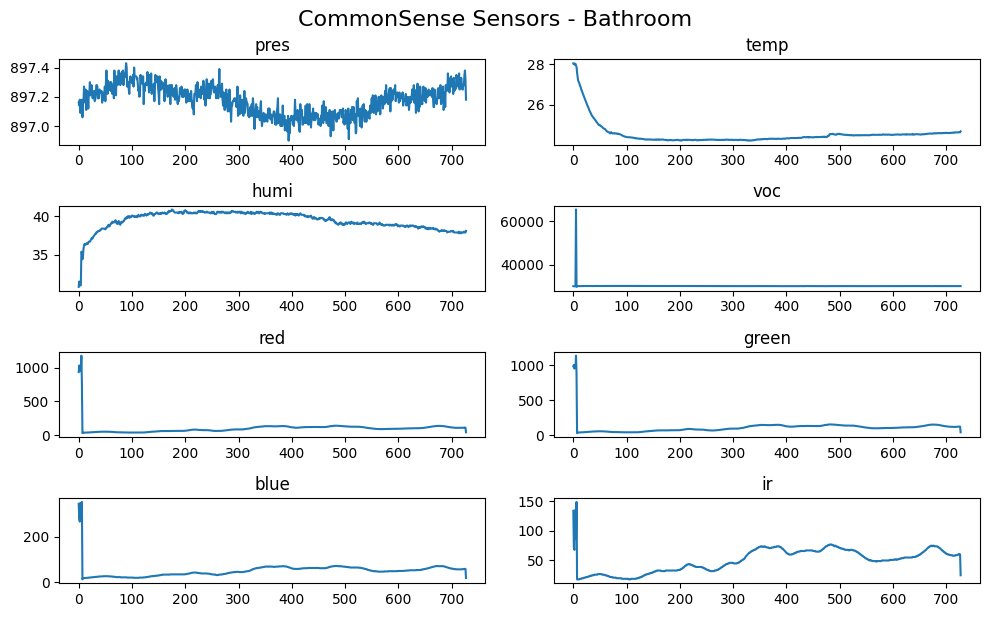
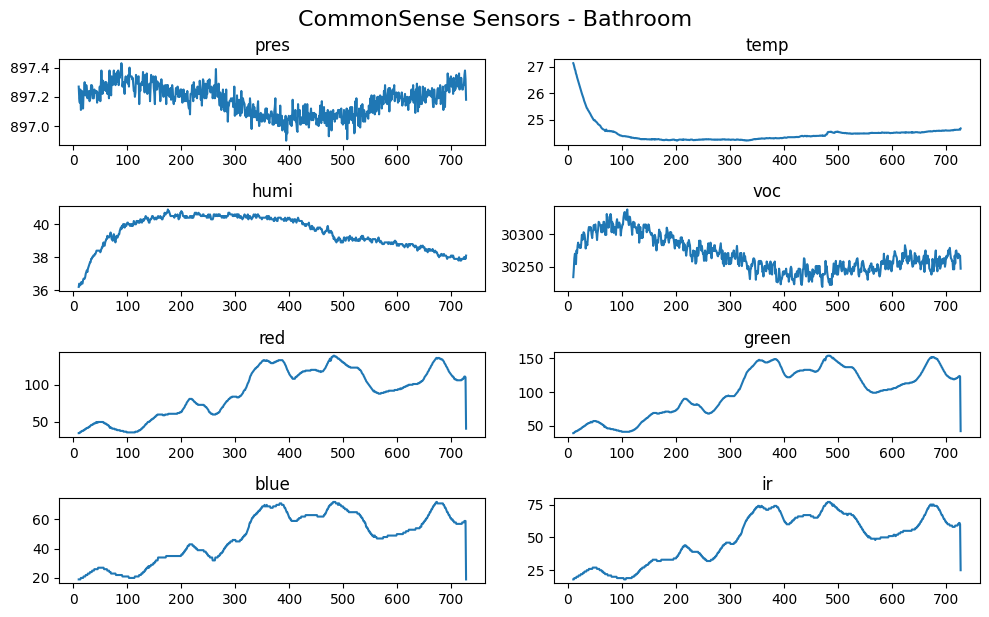
Download, Analyze, and clean Raw Data
- Open the Notebook on Google Colab
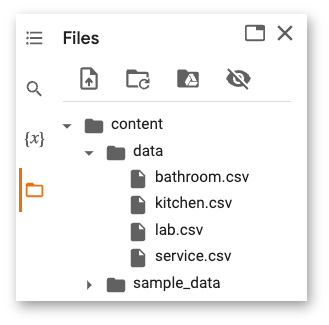
- Open the File Manager on the left panel, go to the “three dots” menu, and create a new folder named “data”
- On the data folder, go to the three dots menu and choose “upload”
- Select the raw data .csv files on your computer. They should appear in the Files directory on the left panel
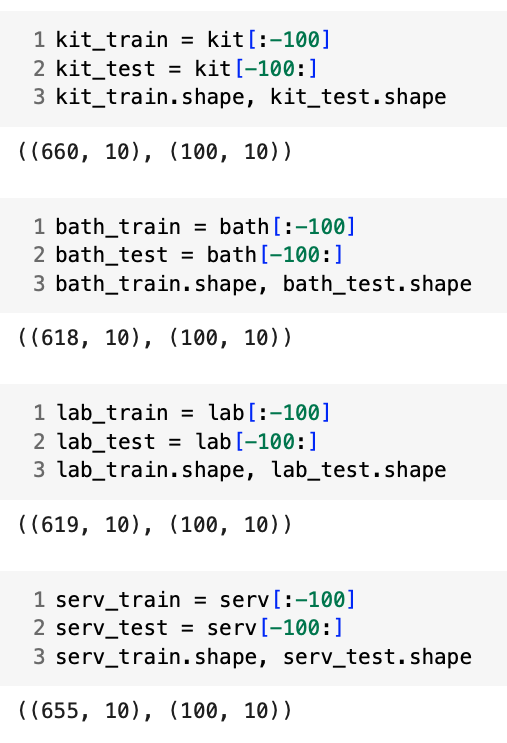
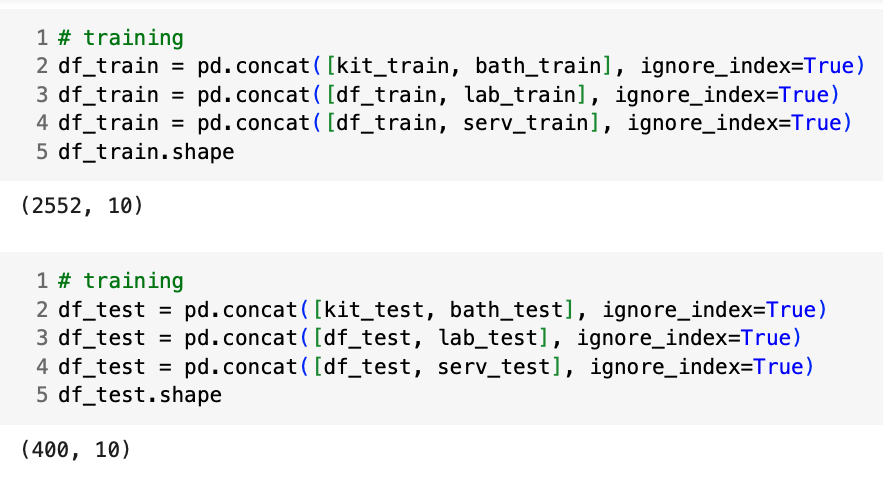
Splitting Data and Creating Single Datasets
We should split data into Train and Test at this early stage, because we should later apply the standardization or normalization to Test data with the Train data parameters. To start, let’s create a new column with the corresponding label.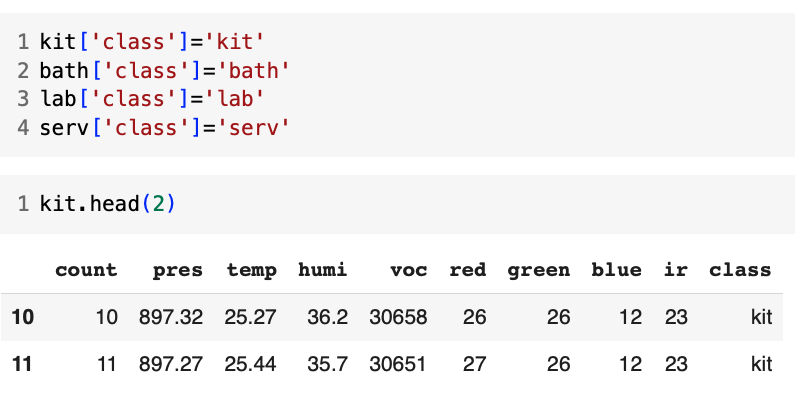
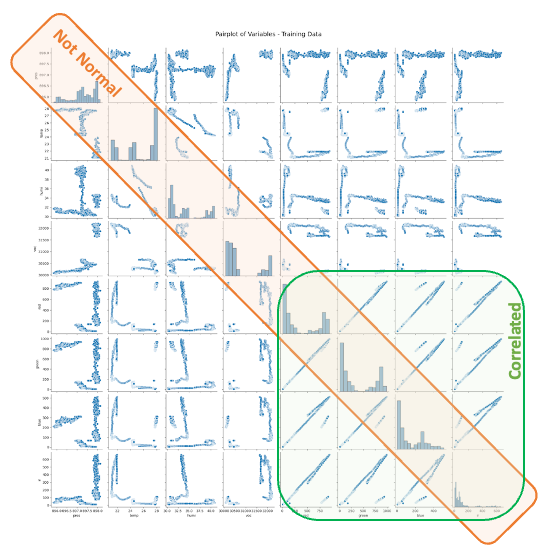
Normalizing Data
We should apply the normalization to the numerical features of the training data, saving as a list the mins and ranges found for each column. Here is the function used to Normalize the train data: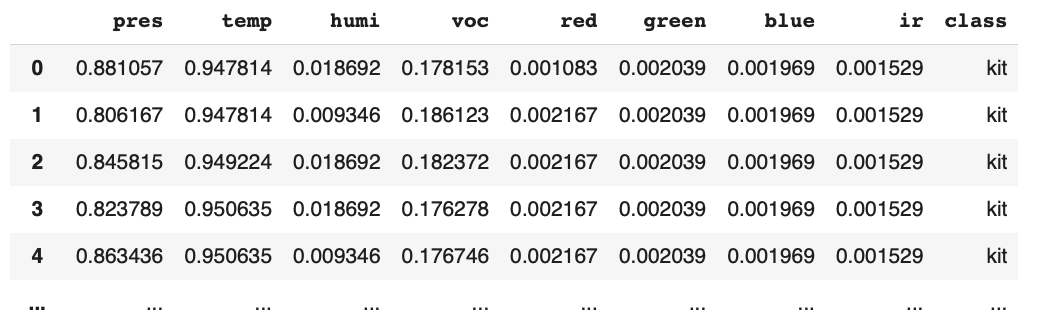
Saving Datasets
The last step in the preparation should be saving both datasets (Train and Test) and also the train mins and ranges parameters to be used during inference.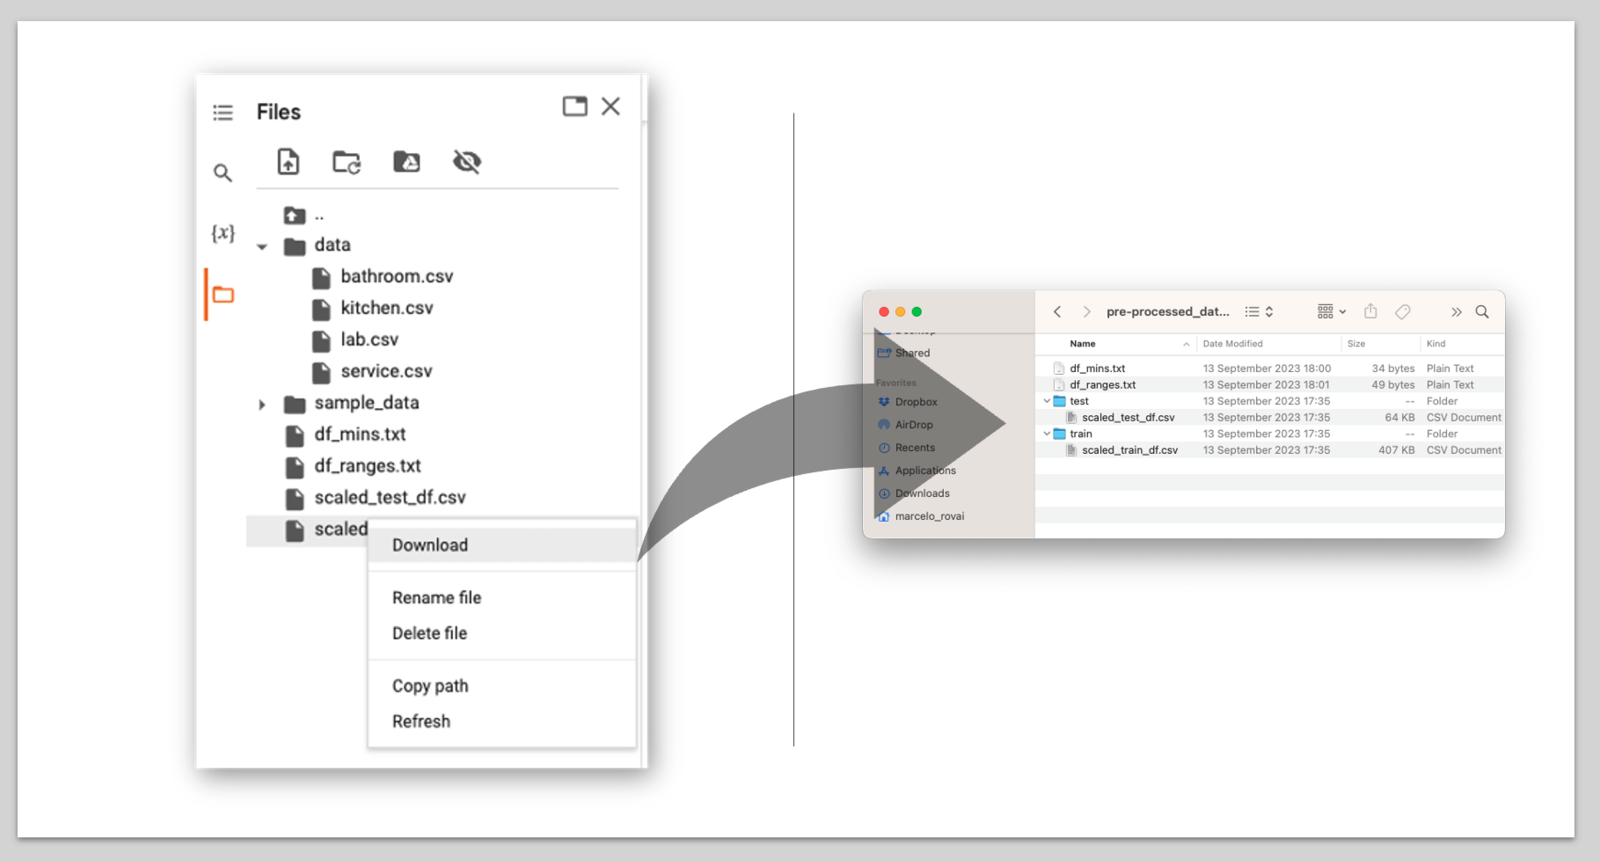
Uploading the Curated Data to Edge Impulse Studio
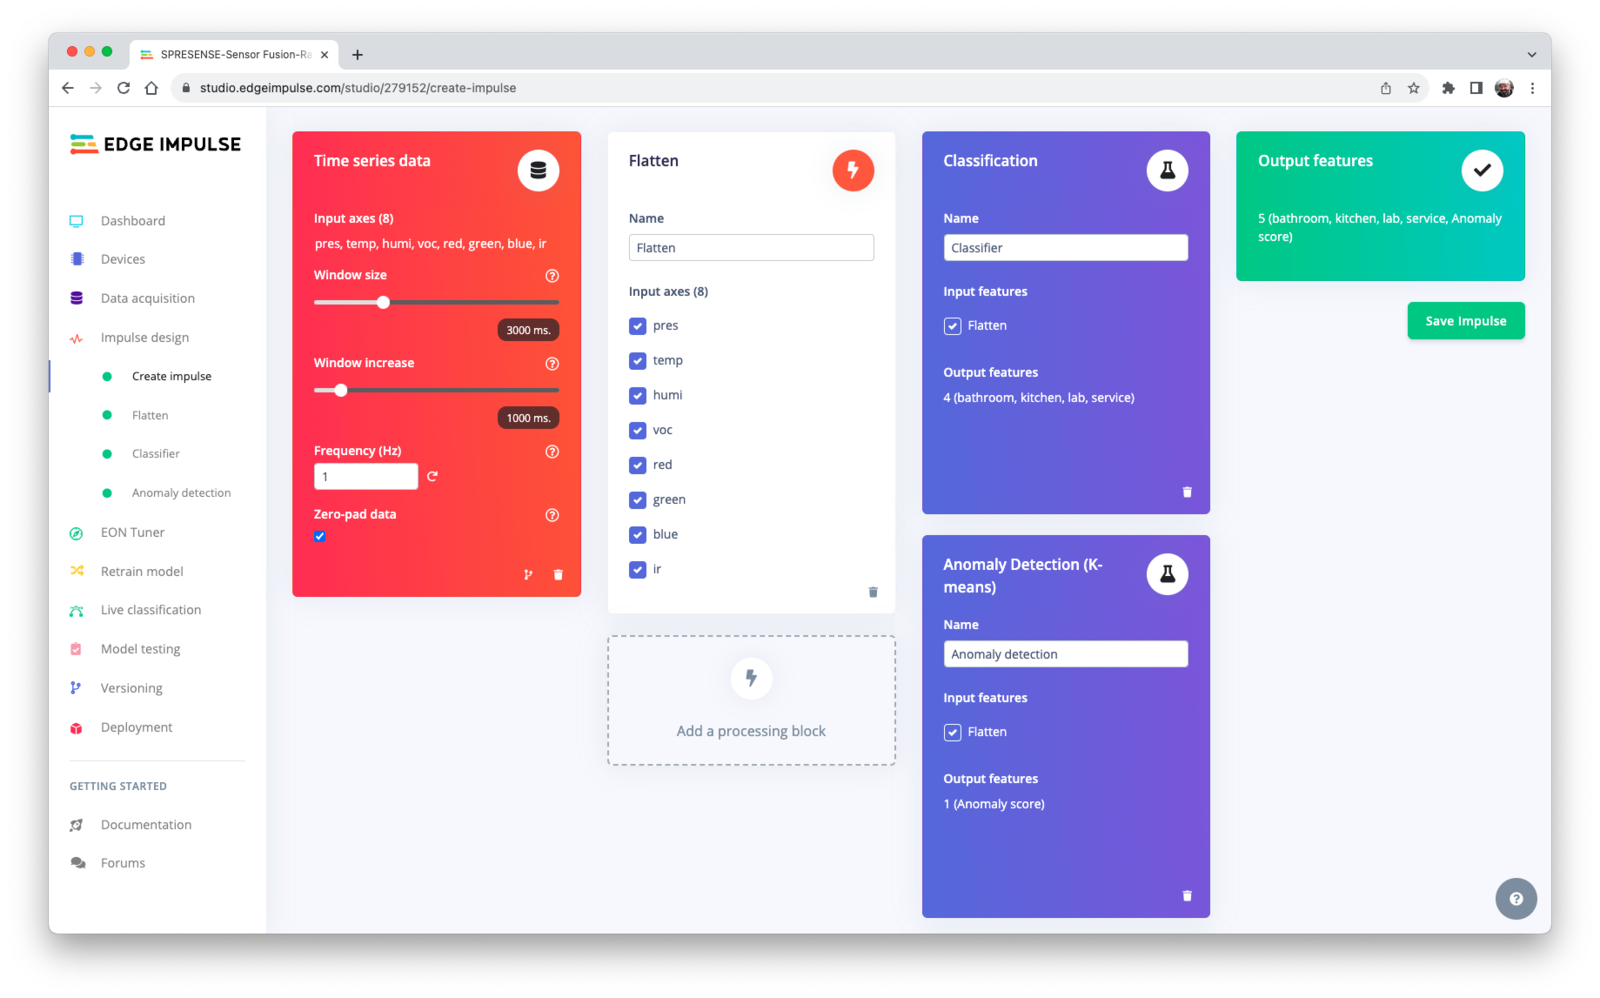
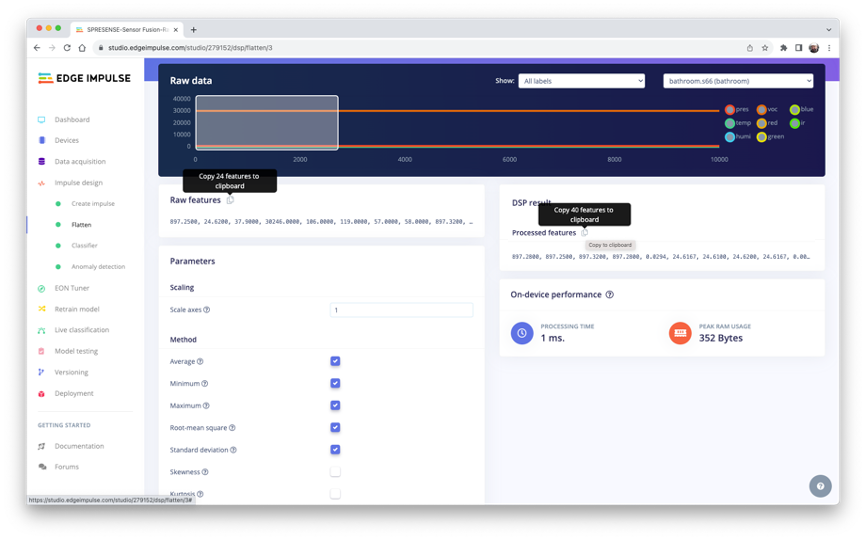
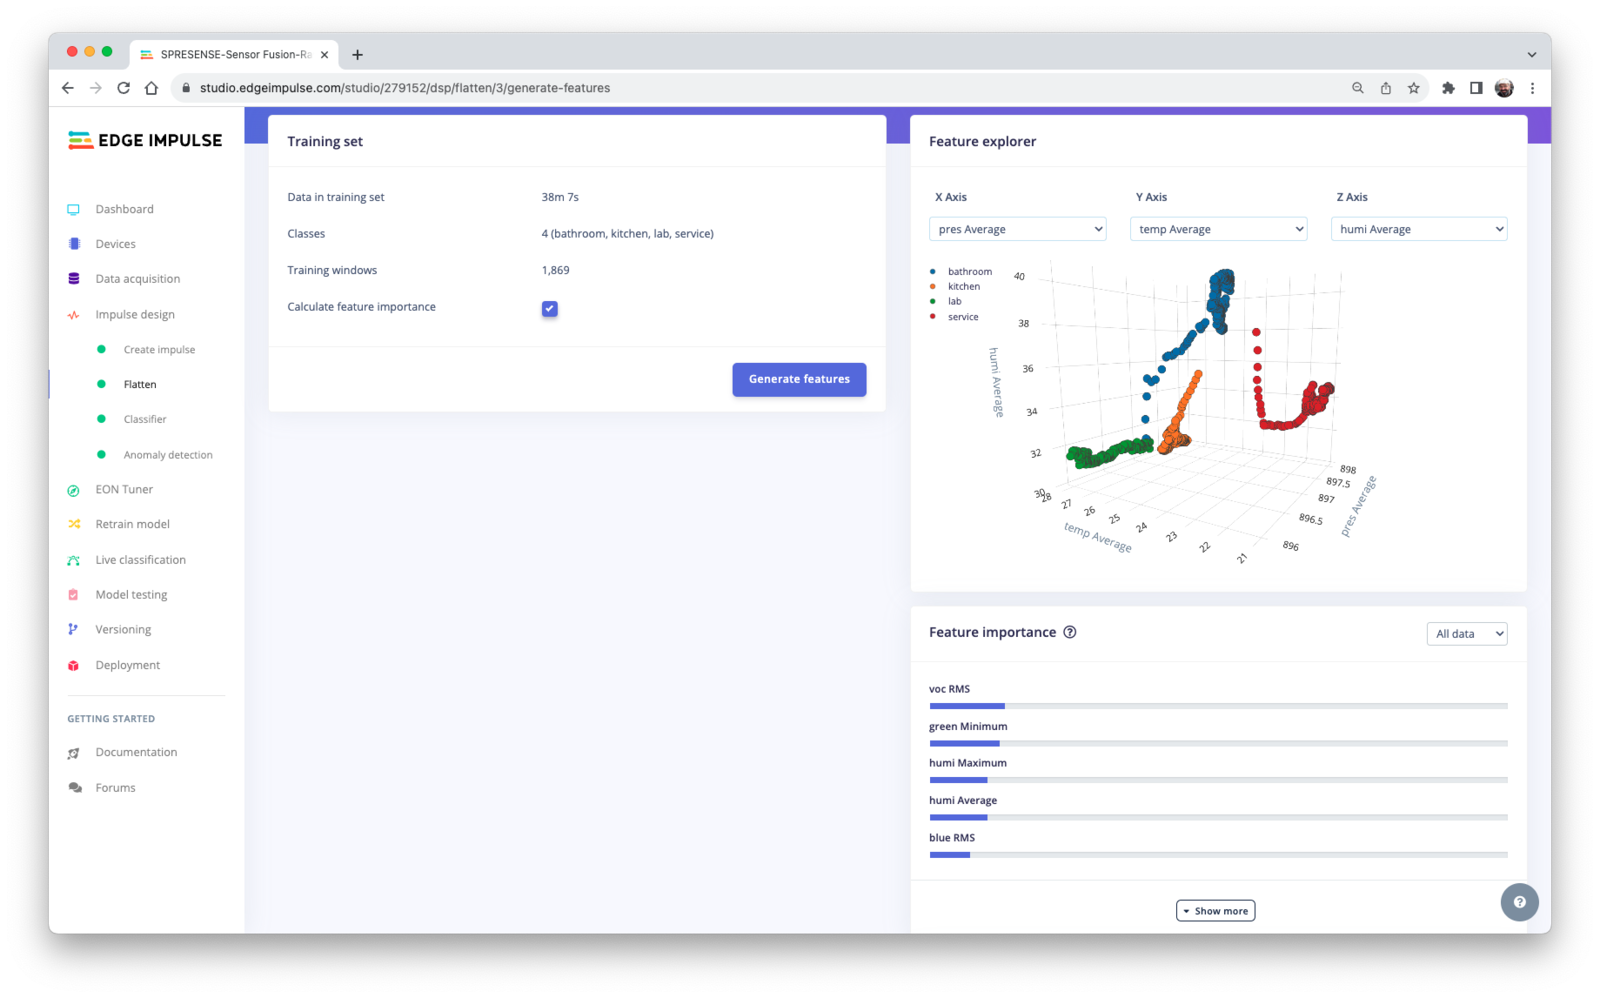
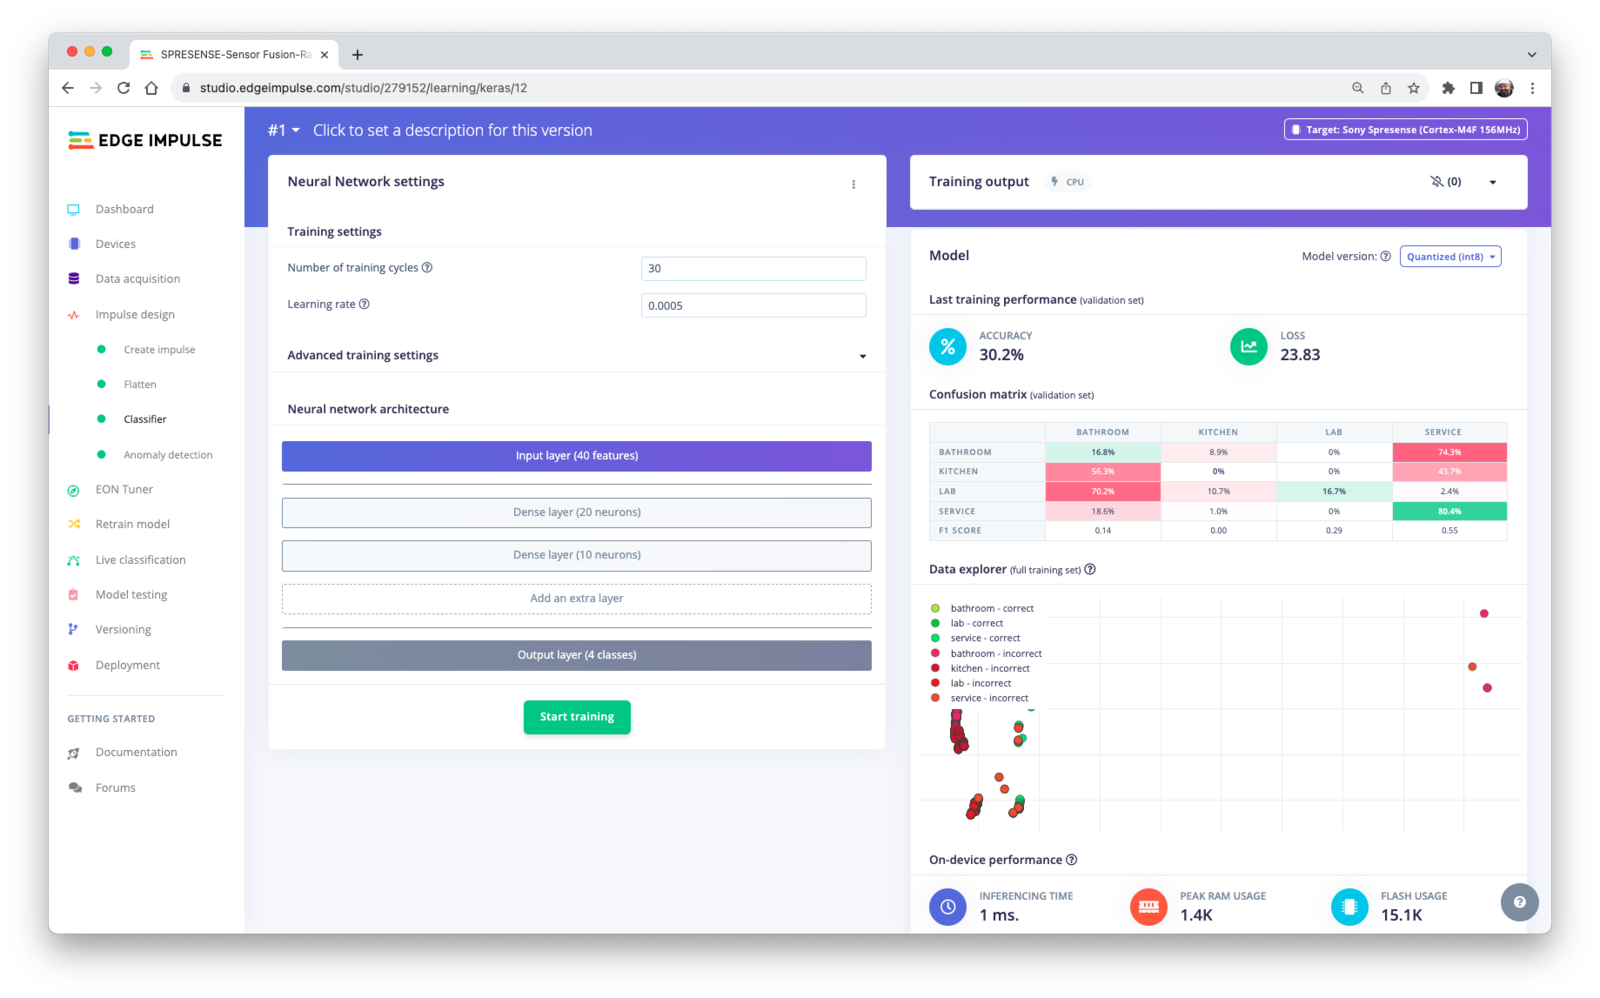
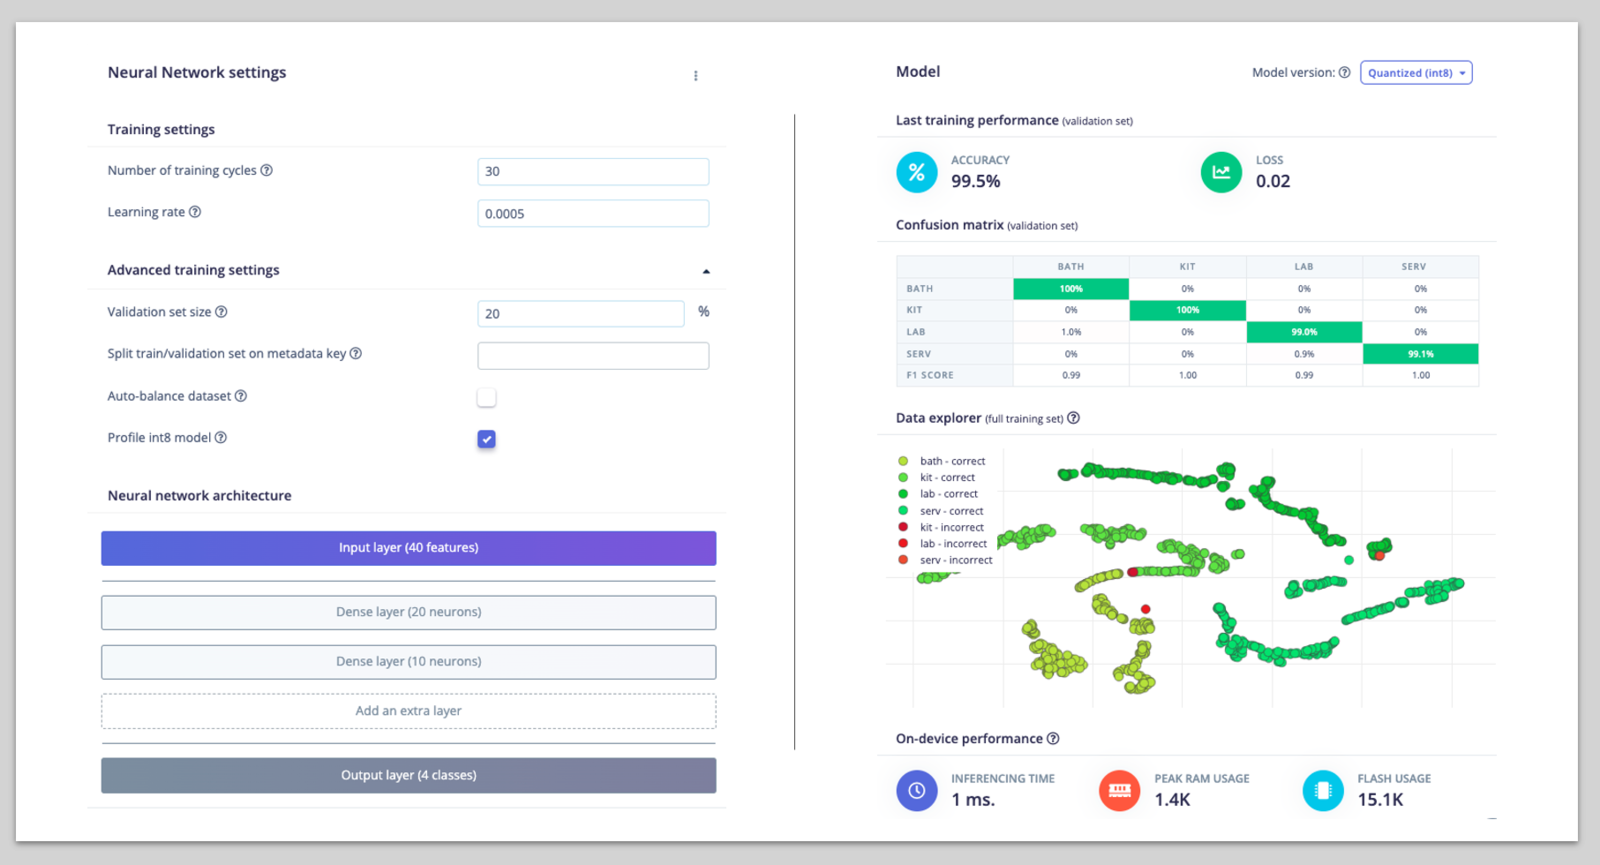
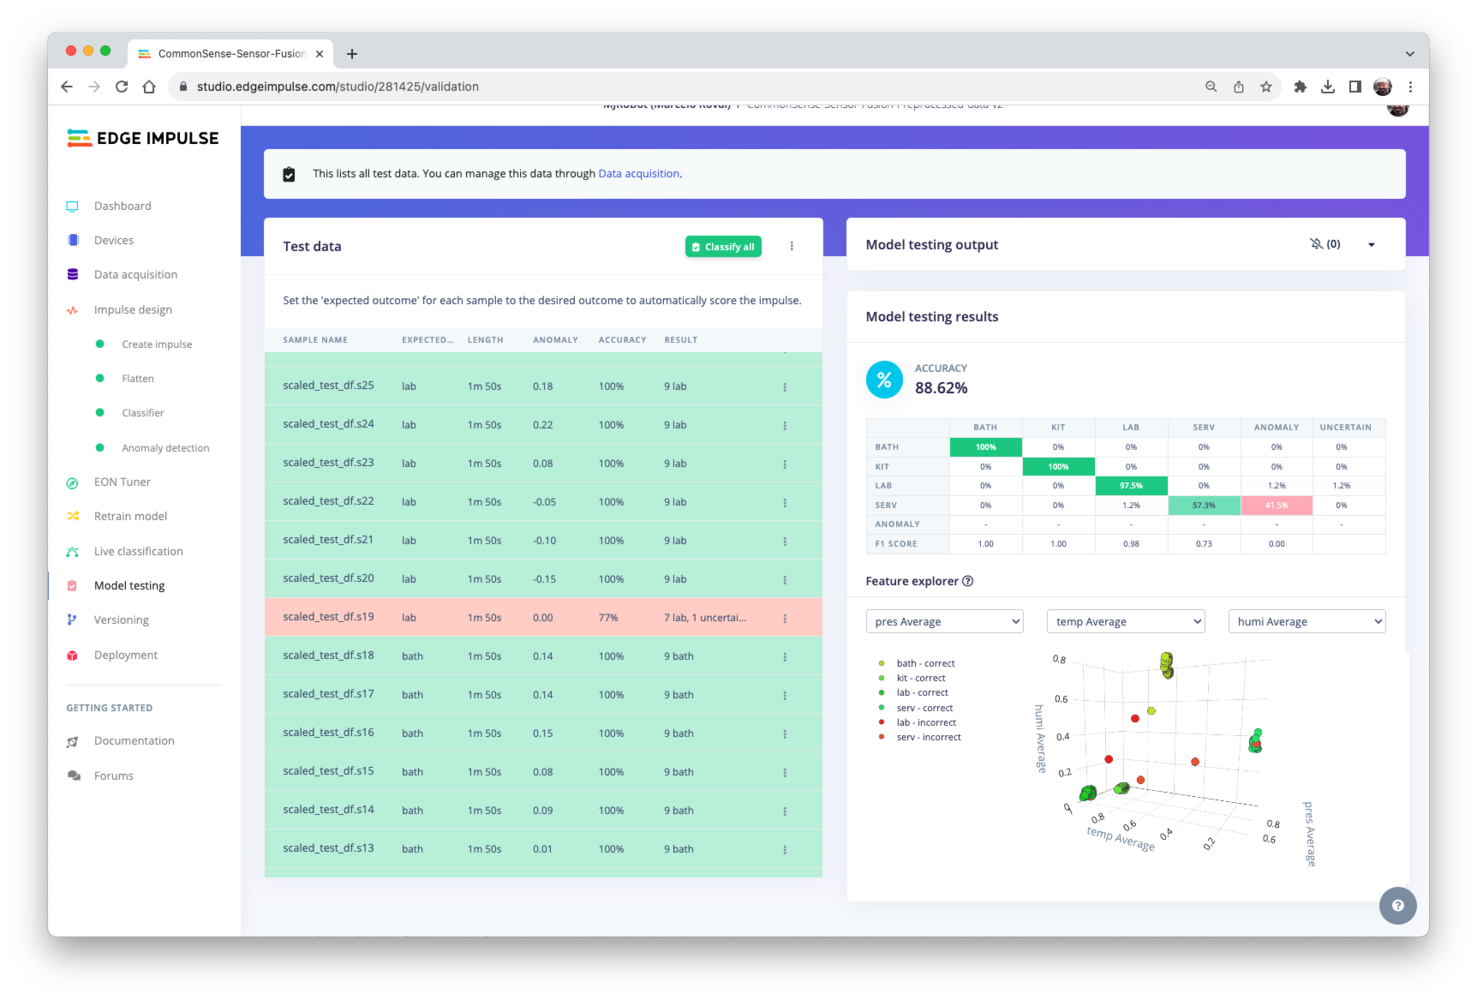
As we did before, we should upload the curated data to the Studio using the “CSV Wizard” tool. Now, we will upload 2 separate files, Train and Data. When we saved the .csv file, we did not include a timeStamp (or count) column, so on the CSV Wizard, we should inform the sampled frequency (in our case, 0.1Hz). I also left it to the Studio to define the labels, informing where they were located (column “class”). For the Impulse, I considered a window of 3 samples (here 3,000 ms) with a slice of 1 sample (1,000 ms). As a Processing Block, “Flatten” was chosen; as this block changes an axis into a single value, it is helpful for slow-moving averages like the data we are capturing. For Learning, we will use “Classification” and Anomaly Detection (this one only for testing). The main difference now, after we upload the files, is that the total Data collected time will show more than 8 hours, which is correct once I captured around 2 hours in each of my home rooms.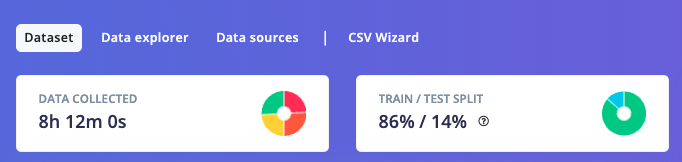
Deploying the Model
For Deployment, we will select an Arduino Library and a non-optimized (Floating Point) model. Again, the cost of memory and latency is very small, and we can afford it on this device.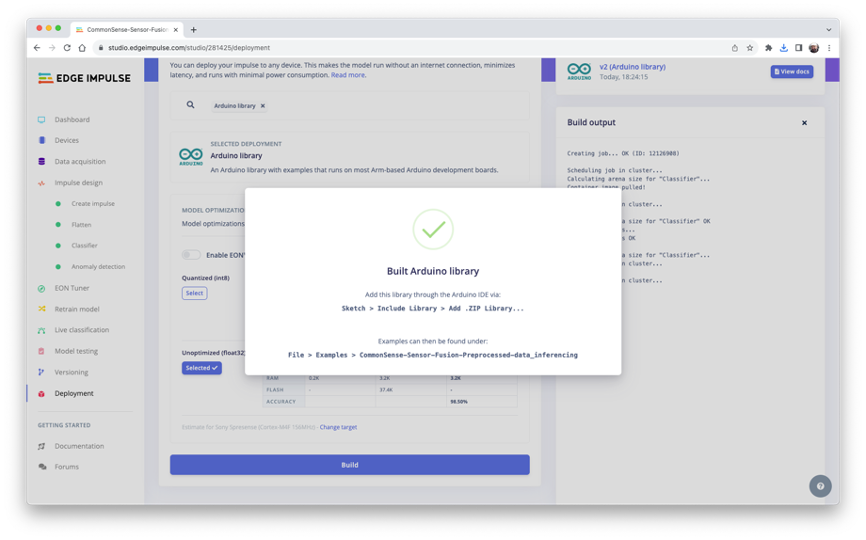
Testing the Inference
To start, let’s run the Static Buffer example. For that, we should select one Raw sample as our model input tensor (in our case, a data point from the Service Room (class: serv). This value should pasted on the line: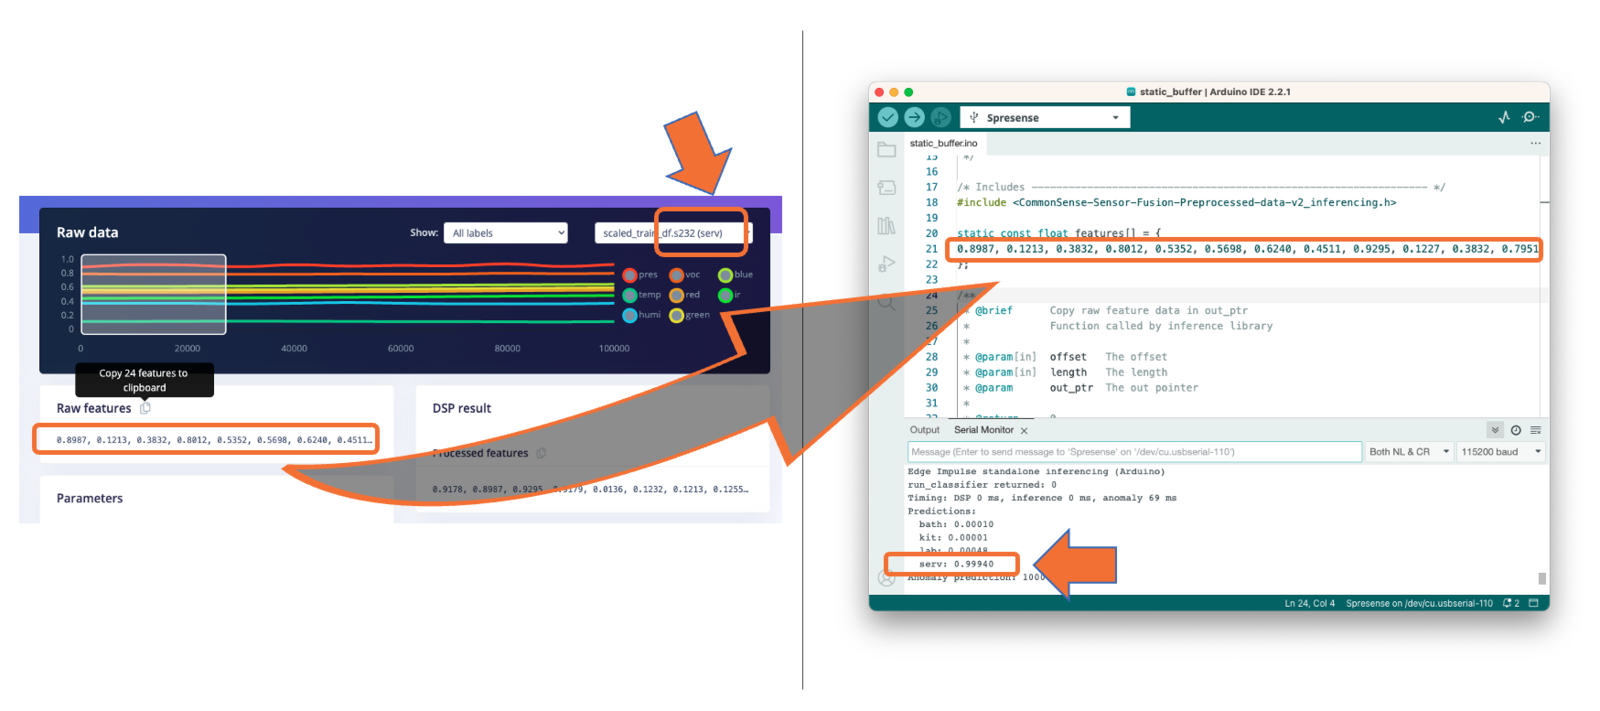
Doing Real Inference
Based on the work done by Shawn Hymel, I adapted his code for using our Spresense-CommonSense board. The complete code can be found here: Spresense-Commonsense-inference.ino Here is the code to be used: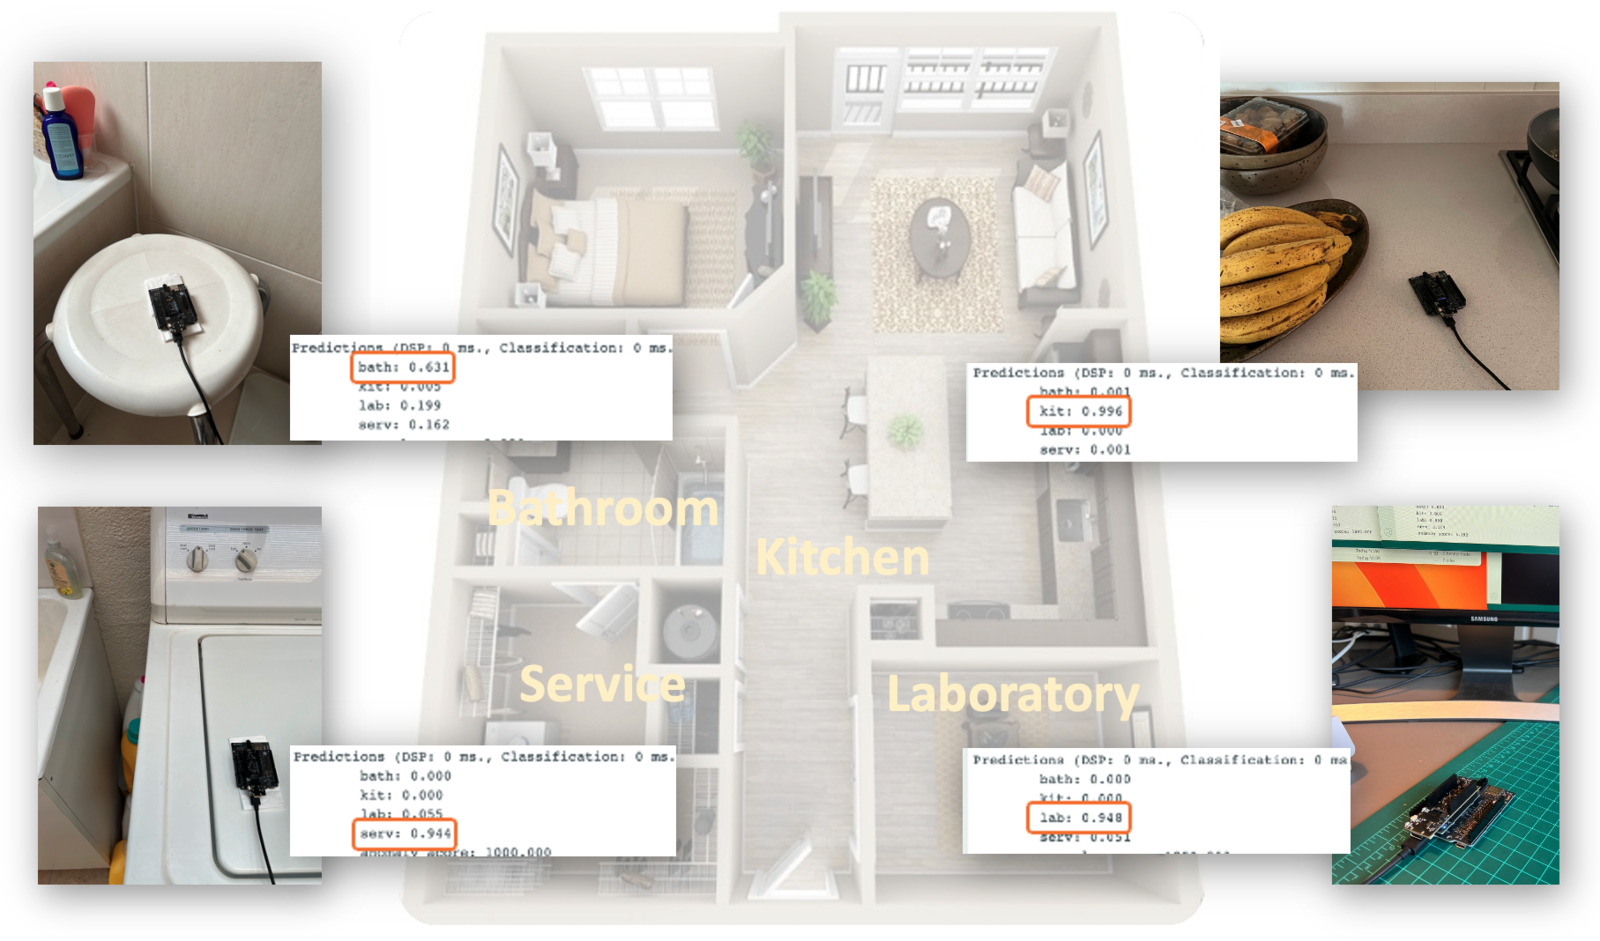
Conclusion
SensiEDGE’s CommonSense board is a good choice for developing machine learning projects that involve multiple sensors. It provides accurate sensor data and can be used for sensor fusion techniques. This tutorial went step by step on a successfully developed model to estimate the location of a device in different rooms of a house using the CommonSense board, Arduino IDE, and Edge Impulse Studio.- All the code and notebook used in this project can be found in the Project Repo: Sony-Spresense.
- And the Edge Impulse Studio project is located here: CommonSense-Sensor-Fusion-Preprocessed-data-v2