Description
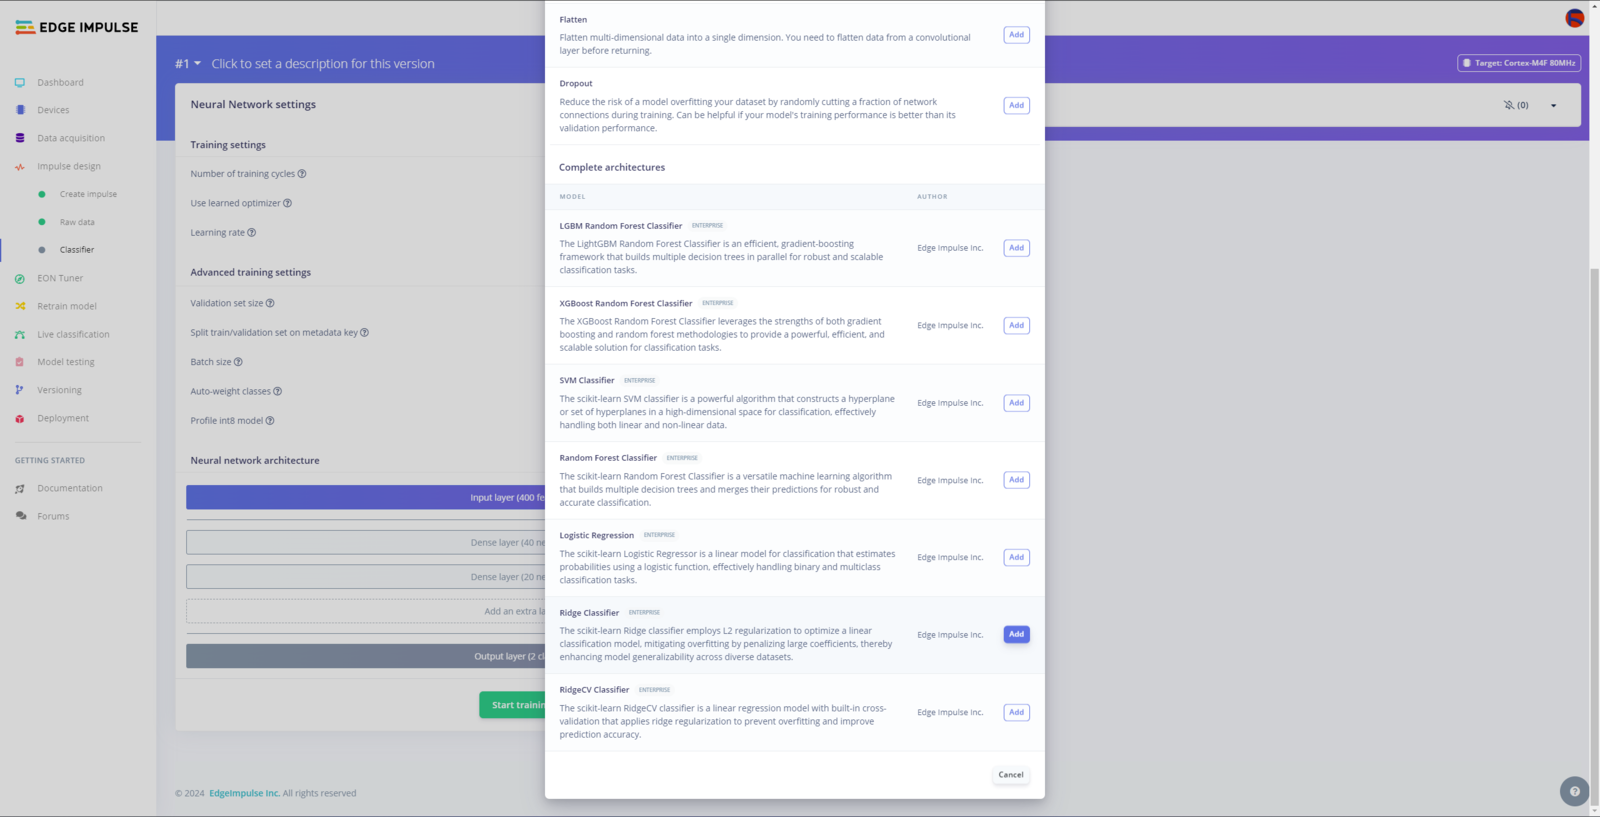
Even though most of us consider water contamination as a gradual occurrence, especially for thriving landscapes, impending pollution can pervade water bodies instantaneously. In the case of enclosed water bodies such as closed lakes, pernicious contaminants can arise in a week and threaten aquatic environments despite not manifesting any indications. These furtively spreading pollutants can even impinge on the health of terrestrial animals by not only poisoning precious water sources but also withering aquatic plants. In most cases, conducting only surface-level water quality tests is insufficient to pinpoint the hiding pollutants since contaminants can form in the underwater substrate by the accumulation of the incipient chemical agents. These underwater chemical reactions are commonly instigated by detritus, industrial effluents, and toxic sediment rife in the underwater substrate. After the culmination of the sinking debris, these reactions can engender algal blooms, hypoxia (dead zones), and expanding barren lands[^1]. Since the mentioned occurrences are only the result of prolonged water pollution, they lead to the inexorable progress of complex toxic chemical interactions, even with plastic debris[^2]. Therefore, the precedence must be given to identifying the underlying conditions of increasing underwater chemical reactions. Especially in lower substrate levels, before reaching hazardous amounts, the combined chemical reactions between pollutants yield ample gas molecules enough to accumulate small-to-moderate air bubbles underwater. These lurking gas pockets affect aquatic plant root systems, deliver noxious contaminants to the surface level, and alter water quality unpredictably due to prevalent emerging contaminants. As a result of the surge of toxic air gaps, the affected water body can undergo sporadic aquatic life declines, starting with invertebrate and fry (or hatchling) deaths. Although not all instances of underwater air bubble activity can be singled out as an imminent toxic pollution risk, they can be utilized as a vital indicator to test water quality to preclude any potential environmental hazards. In addition to protecting natural enclosed water bodies, detecting the accumulating underwater pollutants can also be beneficial and profitable for commercial aquatic animal breeding or plant harvesting, widely known as aquaculture. Since aquaculture requires the controlled cultivation of aquatic organisms in artificially enclosed water bodies (freshwater or brackish water), such as fish ponds and aquariums, the inflation of underwater air bubbles transferring noxious pollutants to the surface can engender sudden animal deaths, wilting aquatic plants, and devastating financial losses. Especially for fish farming or pisciculture involving more demanding species, the accumulating air bubbles in the underwater substrate can initiate a chain reaction resulting in the loss of all fish acclimatized to the enclosed water body. In severe cases, this can lead to algae-clad artificial environments threatening terrestrial animals and the incessant decline in survival rates. After perusing recent research papers on identifying air bubbles in the underwater substrate, I noticed that there are no practical applications focusing on detecting underwater air bubbles and assessing water pollution consecutively so as to diagnose potential toxic contaminants before instigating detrimental effects on the natural environment or a commercial fish farm. Therefore, I decided to develop a feature-rich AIoT device to identify underwater air bubbles via a neural network model by applying ultrasonic imaging as a nondestructive inspection method and to assess water pollution consecutively based on multiple chemical water quality tests via an object detection model. In addition to AI-powered functions, I also decided to build capable user interfaces and a push notification service via Telegram. Before working on data collection procedures and model training, I thoroughly searched for a natural or artificial environment demonstrating the ebb and flow of underwater substrate toxicity due to overpopulation and decaying detritus. Nevertheless, I could not find a suitable option near my hometown because of endangered aquatic life, unrelenting habitat destruction, and disposal of chemical waste mostly caused by human-led activities. Thus, I decided to set up an artificial aquatic environment simulating noxious air bubbles in the underwater substrate and potential water pollution risk. After conducting a meticulous analysis of fecund aquatic life with which I can replicate fish farm conditions in a medium-sized aquarium, I decided to set up a planted freshwater aquarium for harmonious and proliferating species — livebearers (guppies), Neocaridina shrimp, dwarf (or least) crayfish (Cambarellus Diminutus), etc. In the following steps, I shall explain all species in my controlled environment (aquarium) with detailed instructions. Since the crux of identifying underwater air bubbles and assessing water pollution simultaneously requires developing an AI-driven device supporting multiple machine learning models, I decided to construct two different data sets — ultrasonic scan data (buffer) and chemical water quality test result (color-coded) images, build two different machine learning models — neural network and object detection, and run the trained models on separate development boards. In this regard, I was able to program distinct and feature-rich user interfaces for each development board, focusing on a different aspect of the complex AI-based detection process, and thus avoid memory allocation issues, latency, reduced model accuracy, and intricate data collection methods due to multi-sensor conflict. Since Nano ESP32 is a brand-new and high-performance Arduino IoT development board providing a u-blox® NORA-W106 (ESP32-S3) module, 16 MB (128 Mbit) Flash, and an embedded antenna, I decided to utilize Nano ESP32 to collect ultrasonic scan (imaging) information and run my neural network model. Since I needed to utilize submersible equipment to generate precise aquatic ultrasonic scans, I decided to connect a DFRobot URM15 - 75KHZ ultrasonic sensor (via RS485-to-UART adapter module) and a DS18B20 waterproof temperature sensor to Nano ESP32. To produce accurate ultrasonic images from single data points and match the given image shape (20 x 20 — 400 points), I added a DFRobot 6-axis accelerometer. Finally, I connected an SSD1306 OLED display and four control buttons to program a feature-rich user interface. I also employed Nano ESP32 to transfer the produced ultrasonic scan data and the selected air bubble class to a basic web application (developed in PHP) via an HTTP POST request. In this regard, I was able to save each ultrasonic scan buffer with its assigned air bubble class to a separate text (TXT) file and construct my data set effortlessly. I shall clarify the remaining web application features below. After completing constructing my ultrasonic scan data set, I built my artificial neural network model (ANN) with Edge Impulse to identify noxious air bubbles lurking in the underwater substrate. Considering the unique structure of ultrasonic imaging data, I employed the built-in Ridge classifier as the model classifier, provided by Edge Impulse Enterprise. As a logistic regression method with L2 regularization, the Ridge classification combines conventional classification techniques and the Ridge regression for multi-class classification tasks. Since Edge Impulse is nearly compatible with all microcontrollers and development boards, even for complex Sklearn linear models, I have not encountered any issues while uploading and running my advanced model on Nano ESP32. As labels, I simply differentiate the ultrasonic scan samples depending on the underwater air bubble presence:- normal
- bubble
- sterile
- dangerous
- polluted


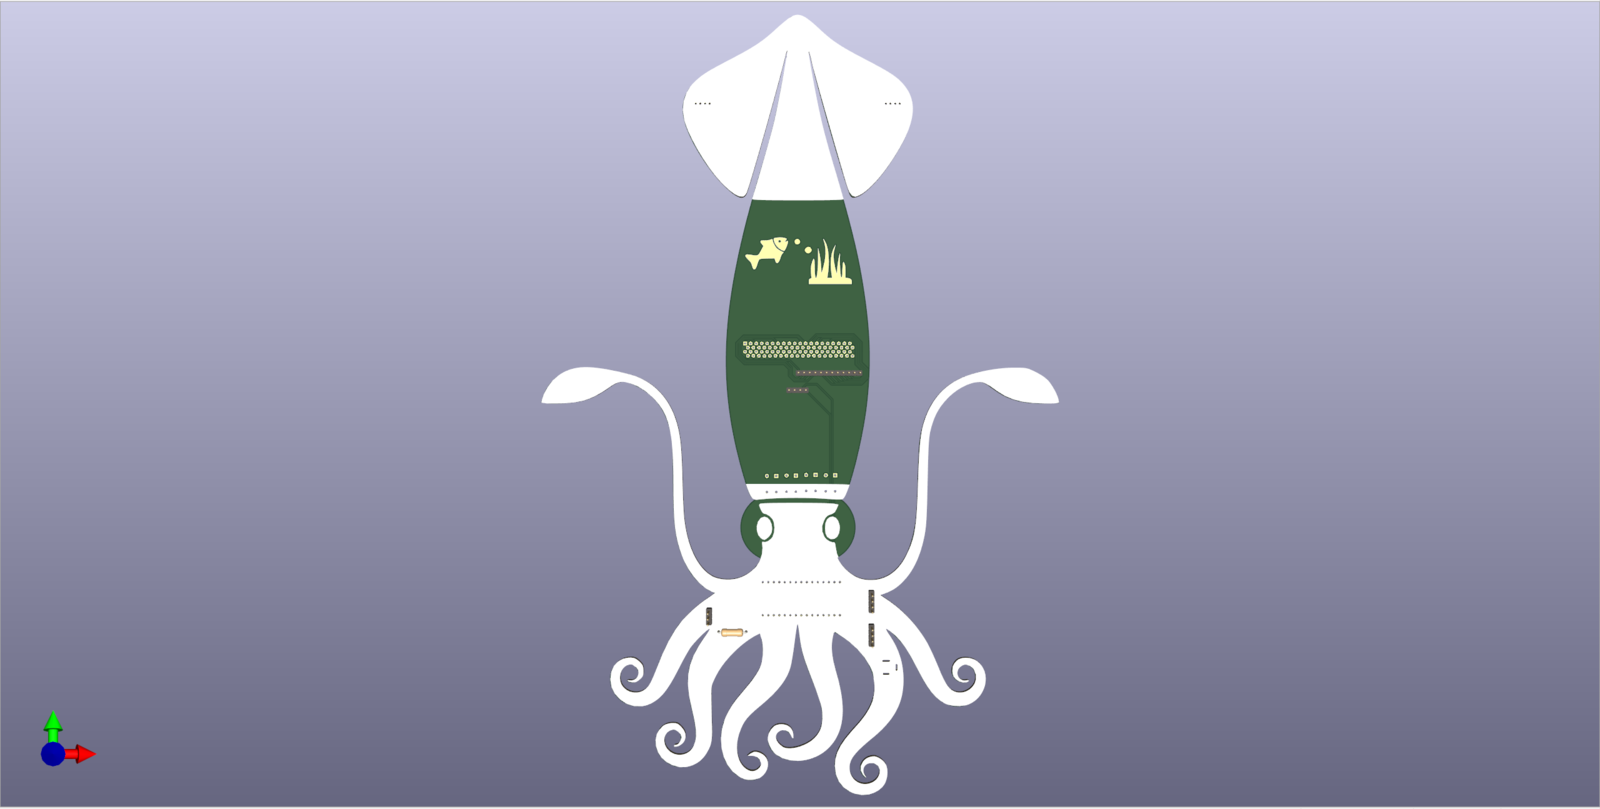
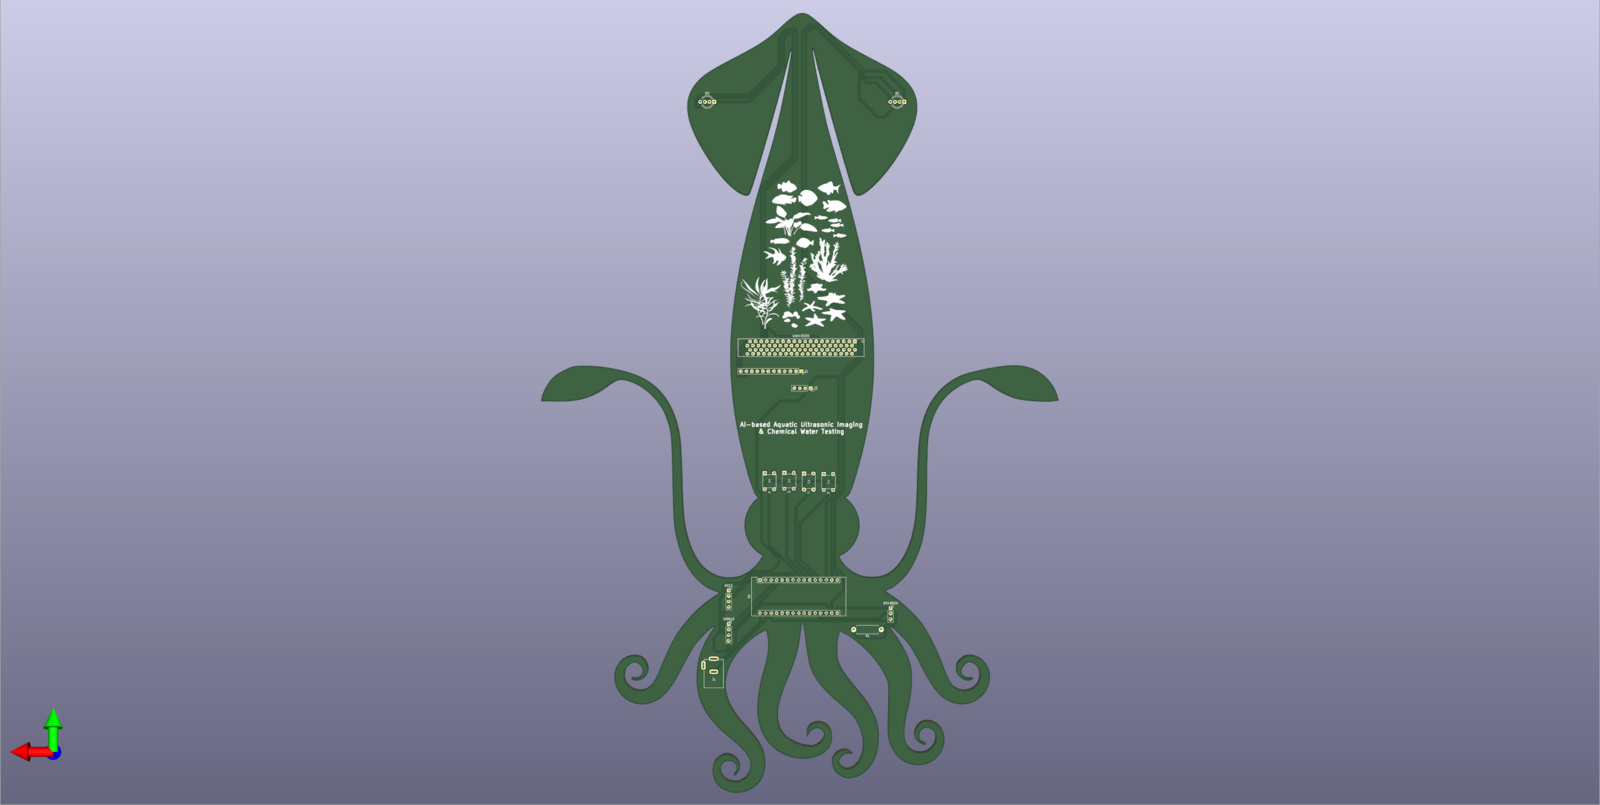
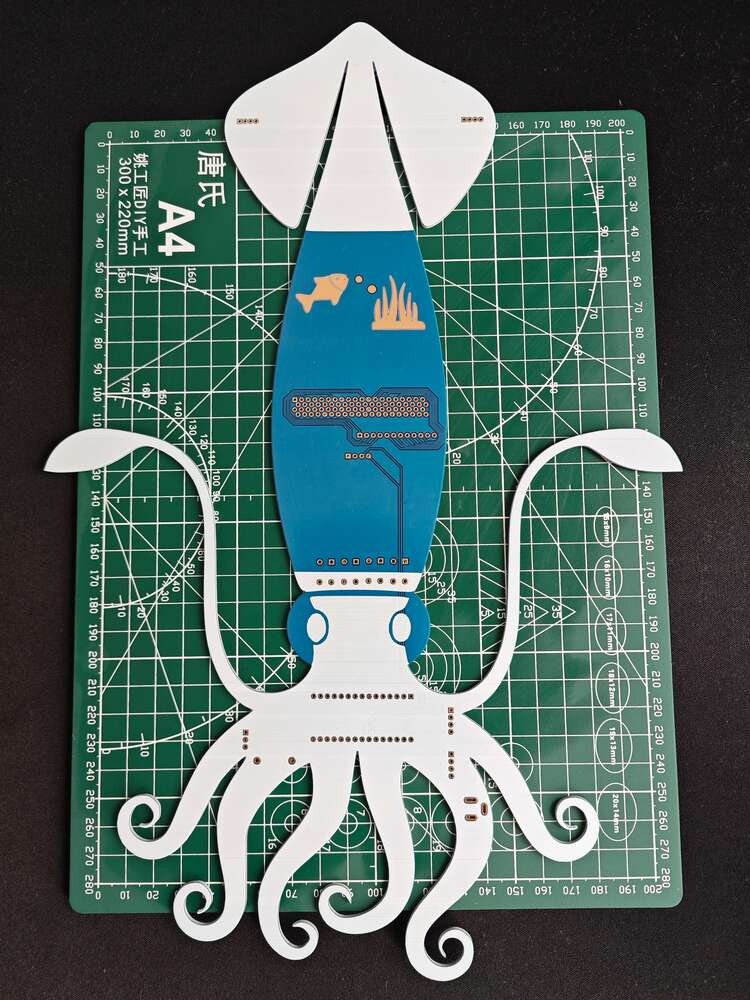
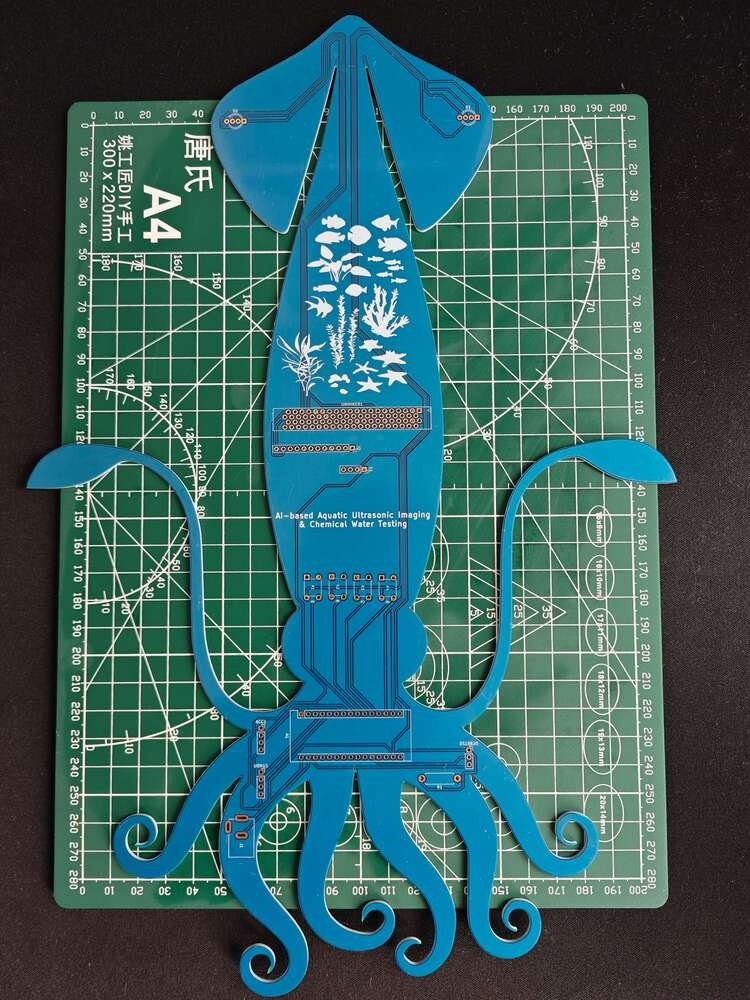
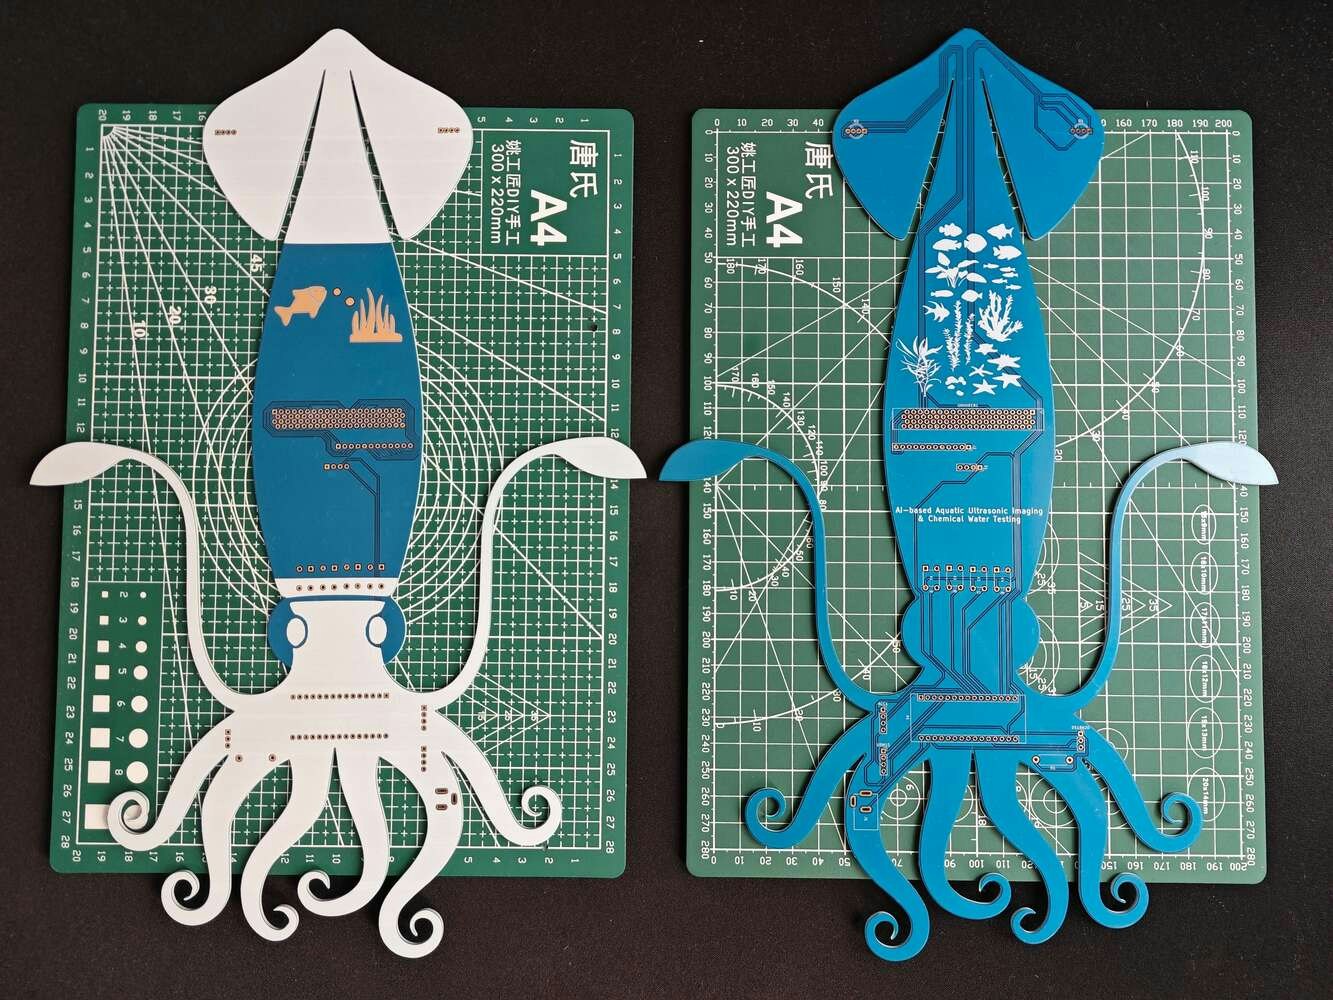
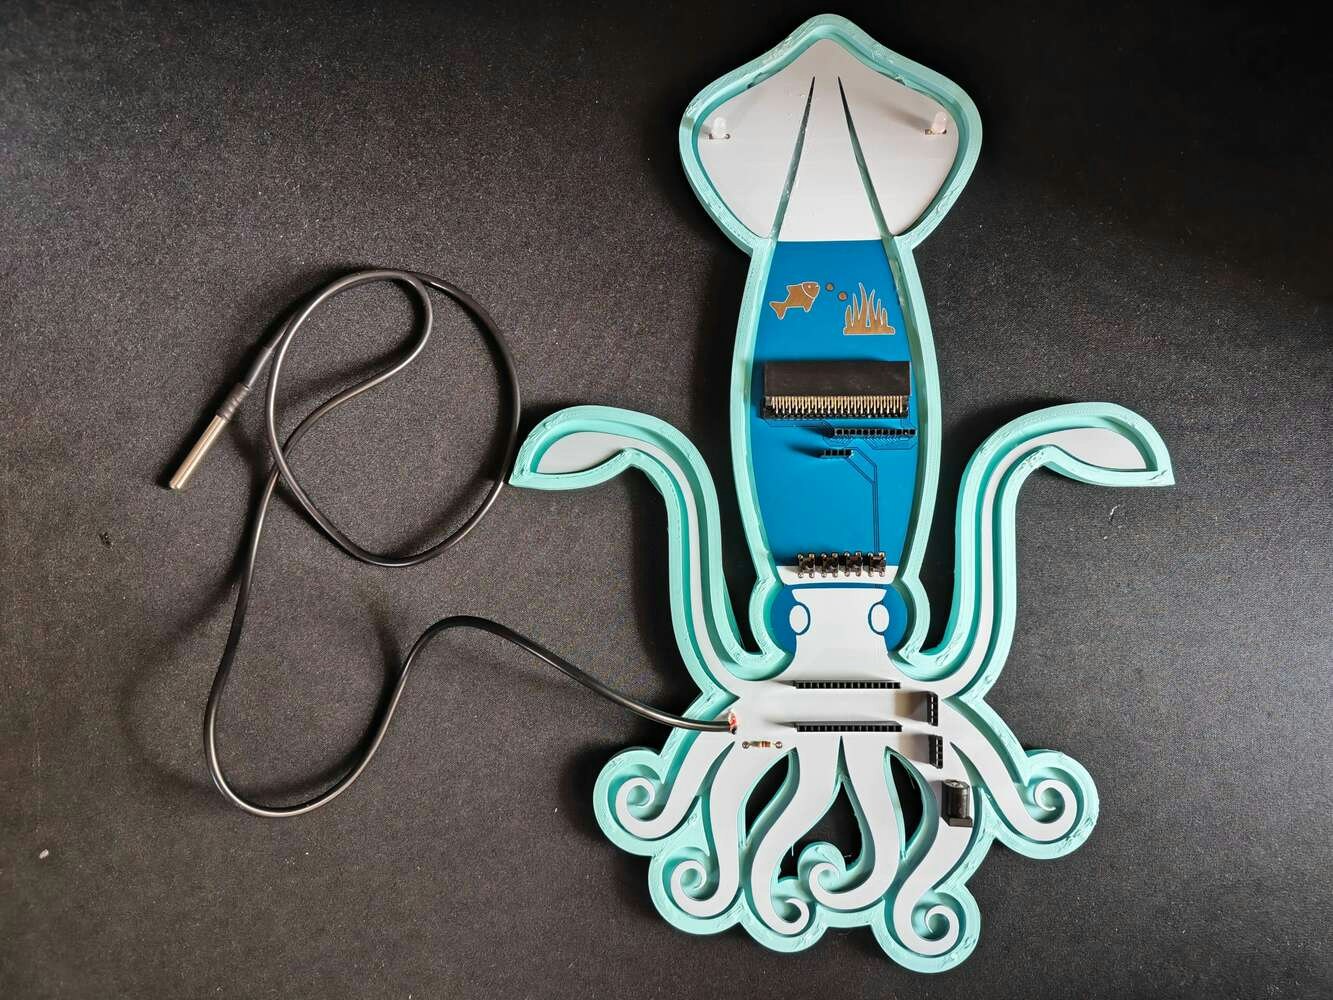
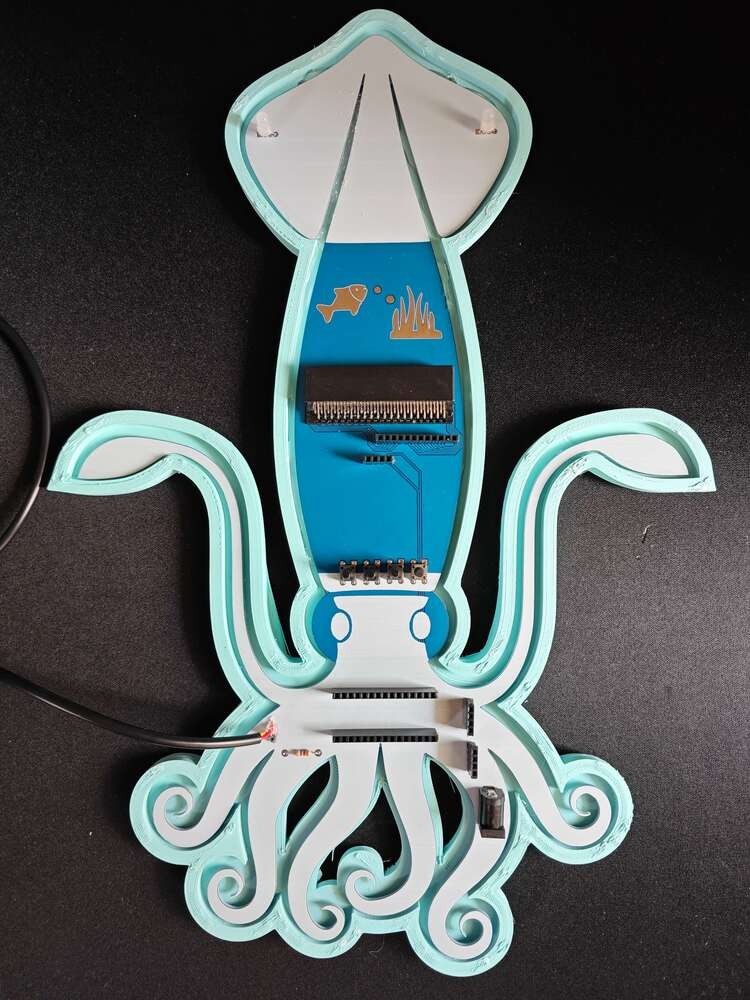
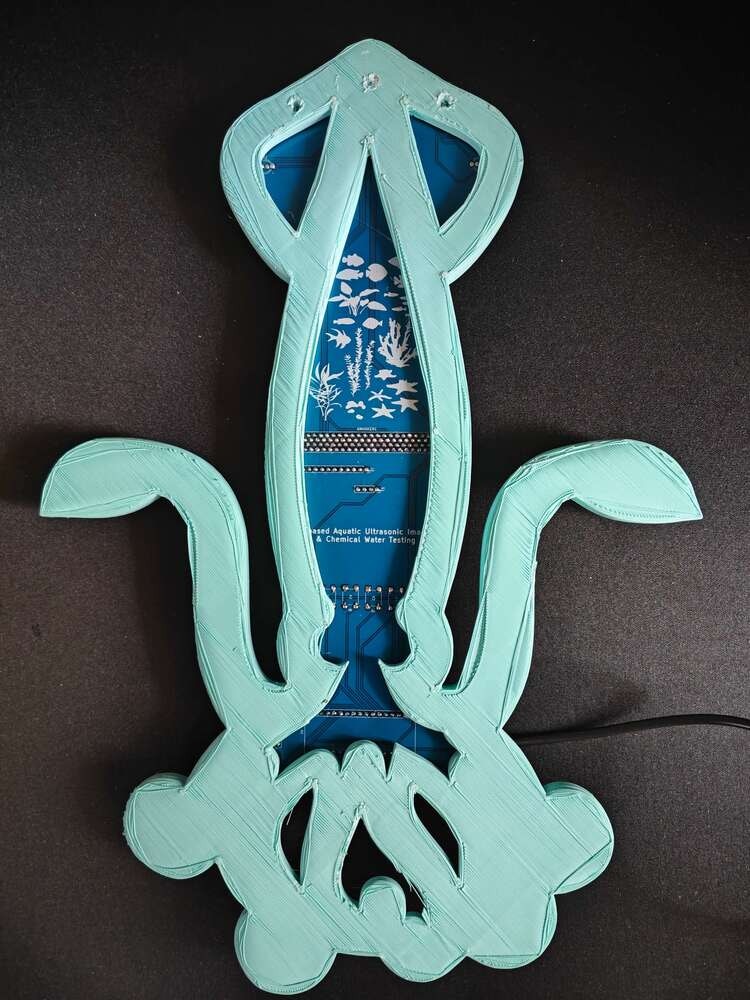
Step 1: Designing and soldering the Squid-inspired PCB
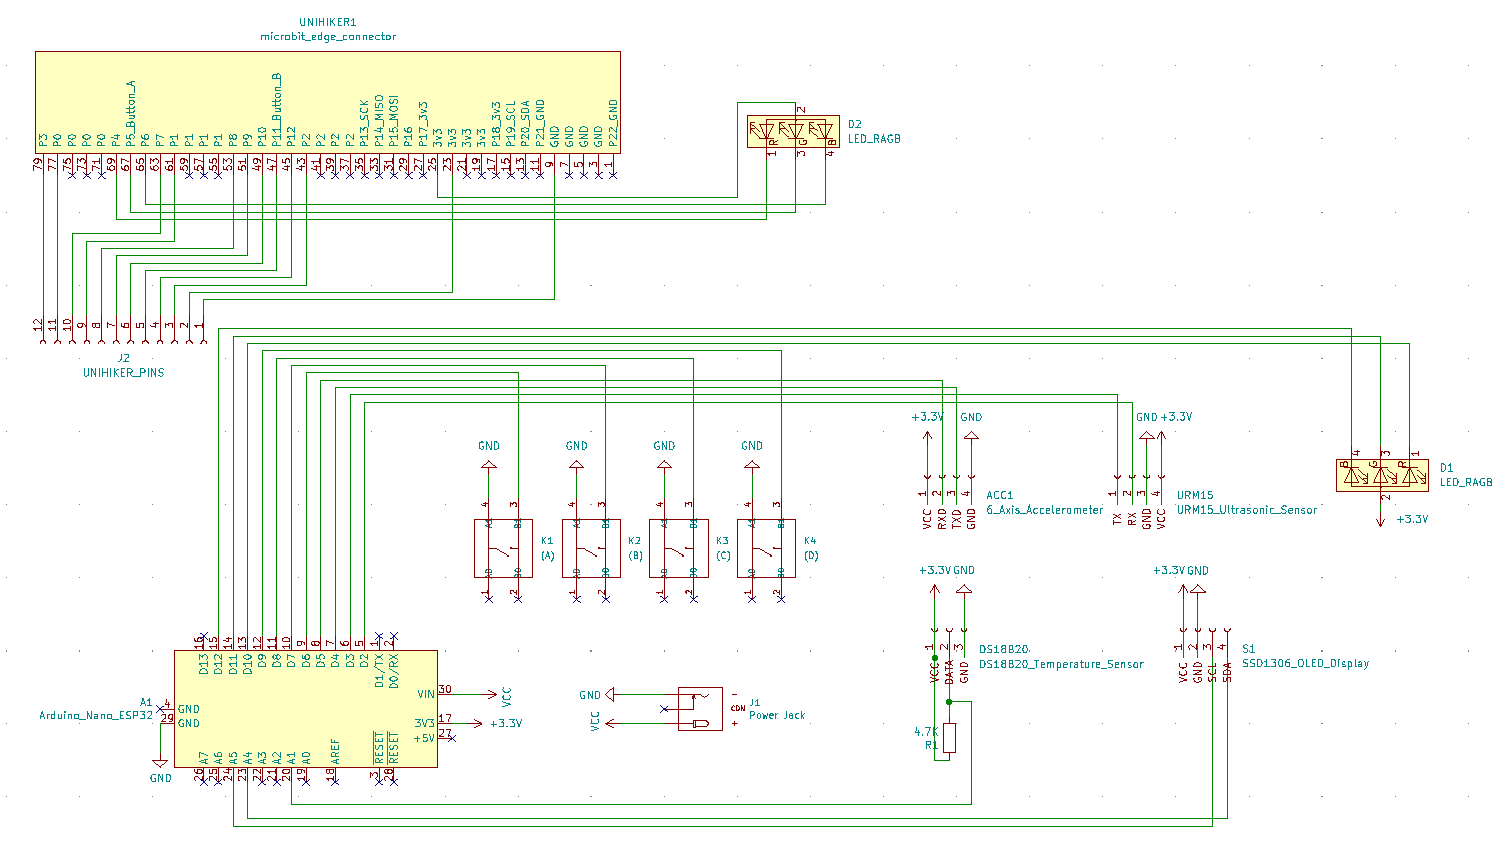
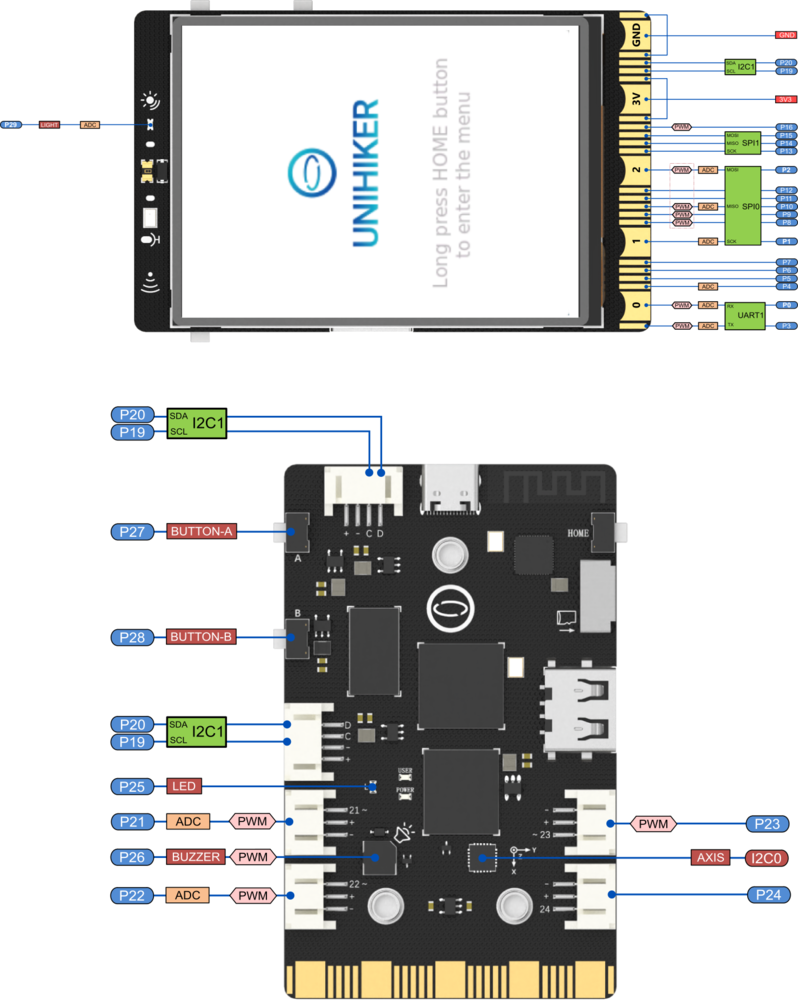
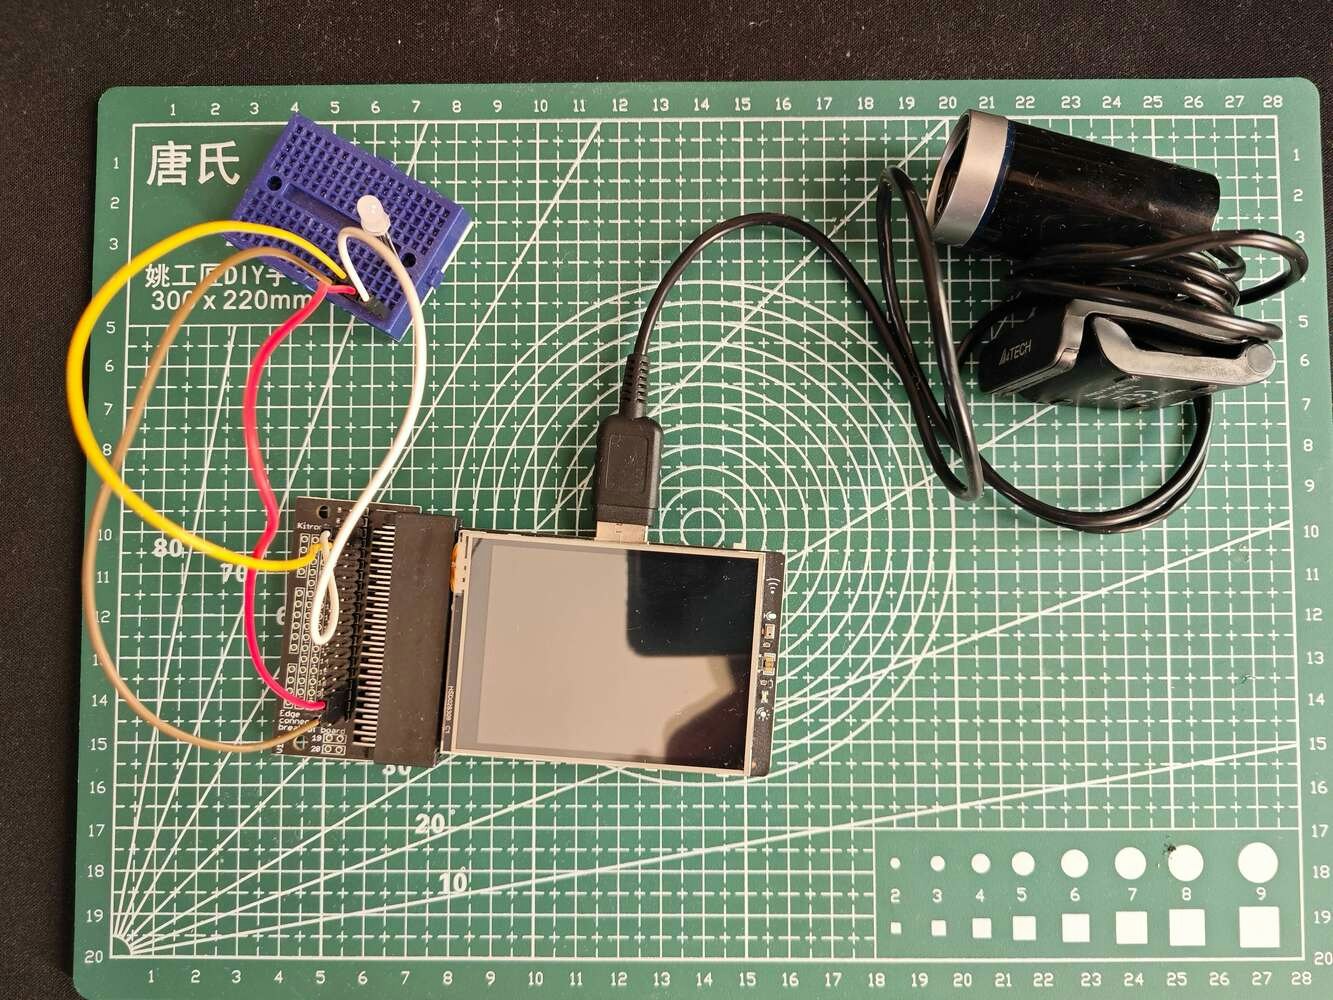
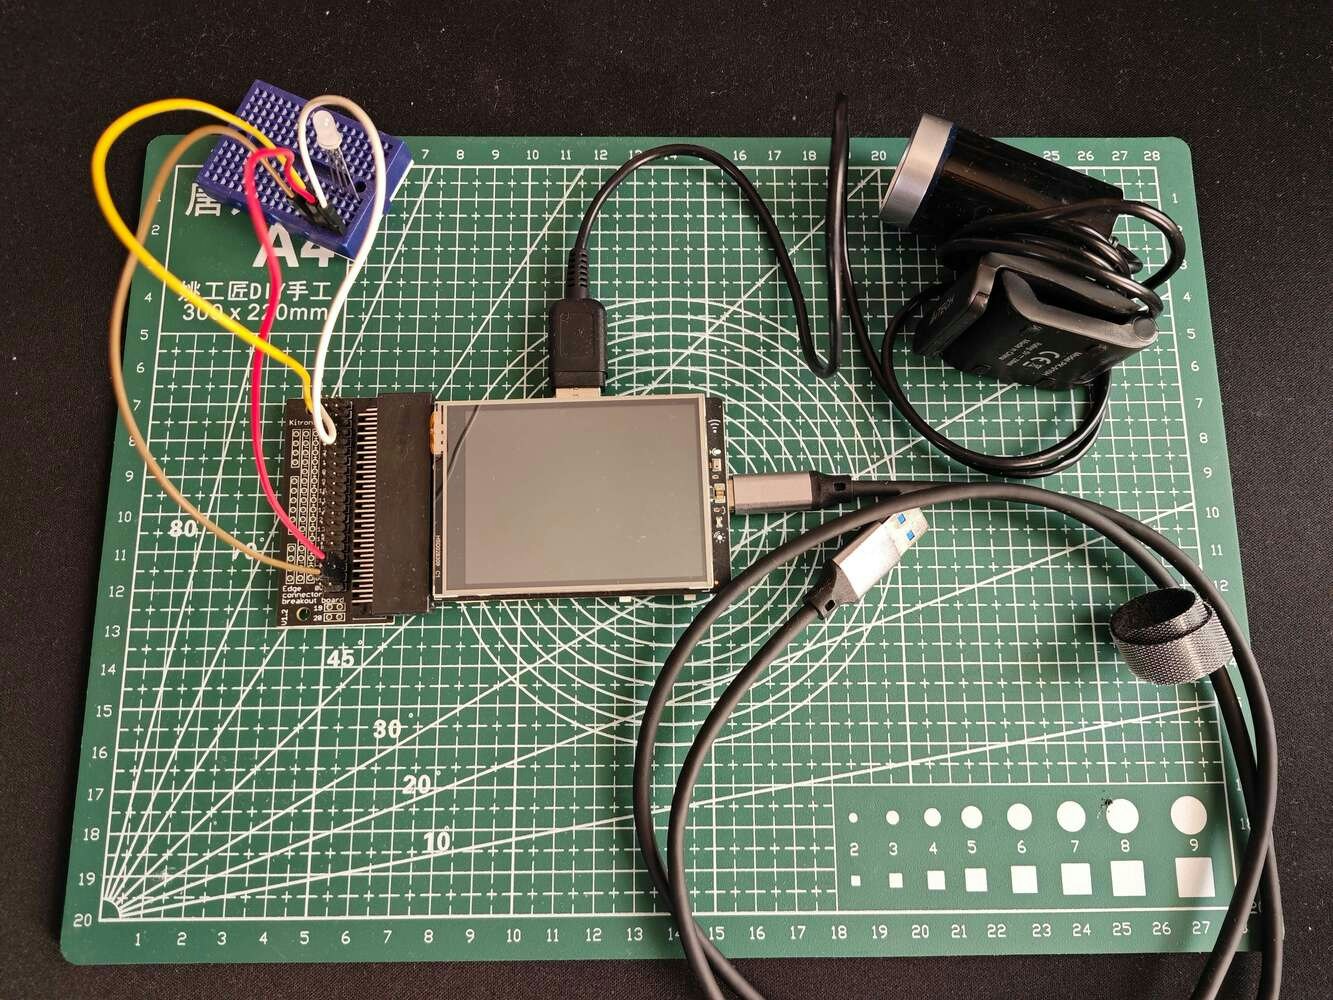
Before prototyping my Squid-inspired PCB design, I inspected the detailed pin reference of Nano ESP32, the micro:bit connector-based UNIHIKER pinout, and the supported transmission protocols of the measurement sensors. Then, I checked the wireless (Wi-Fi) communication quality between Nano ESP32, UNIHIKER, and the web application while transferring and receiving data packets.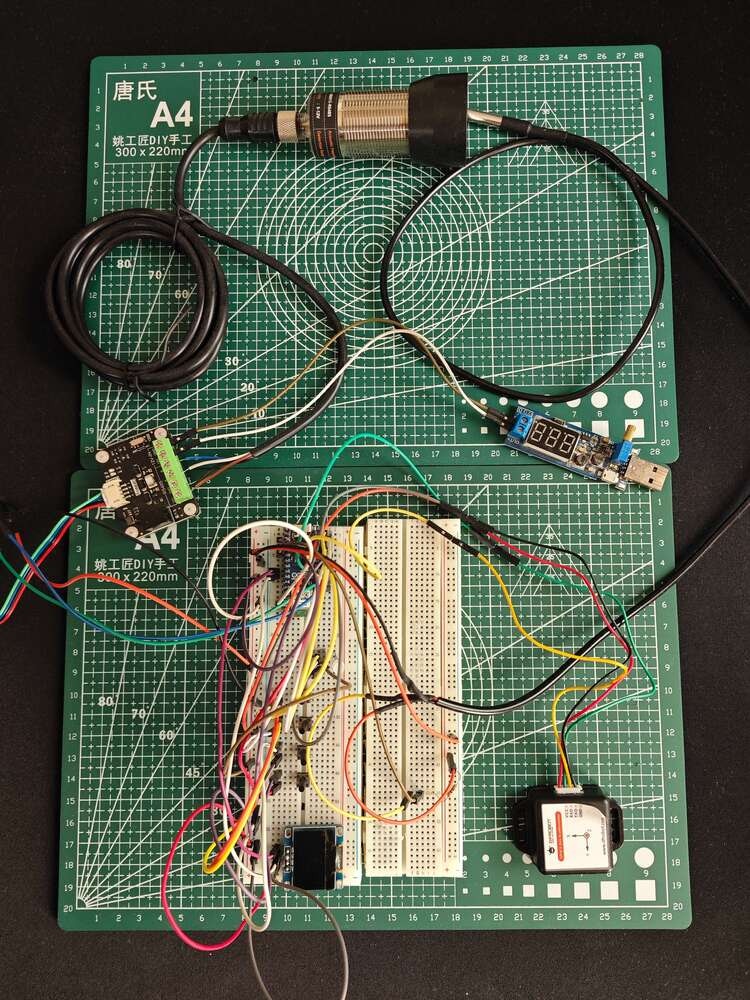
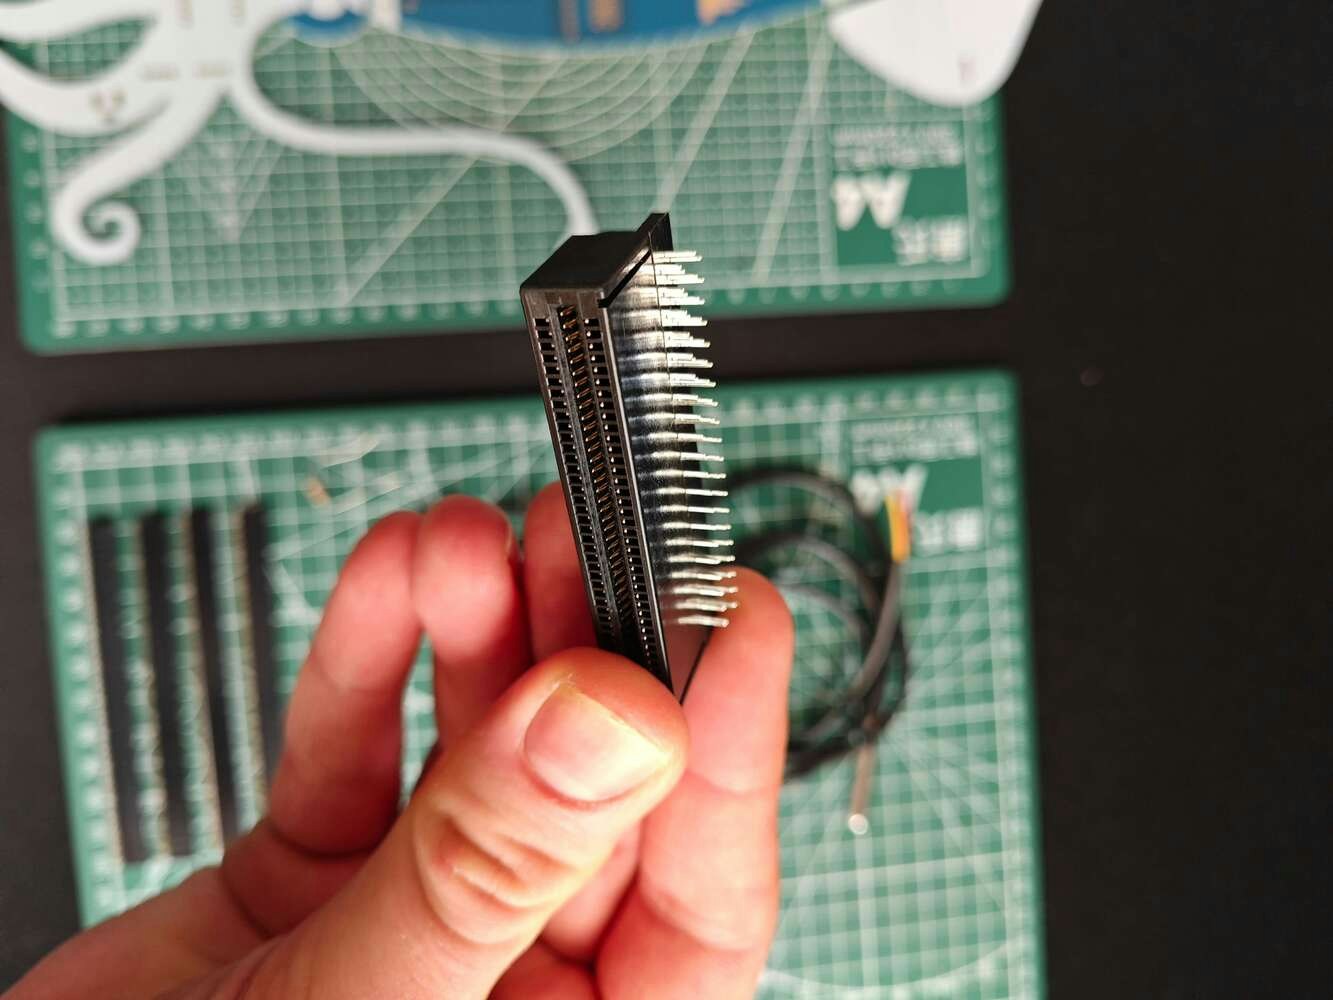
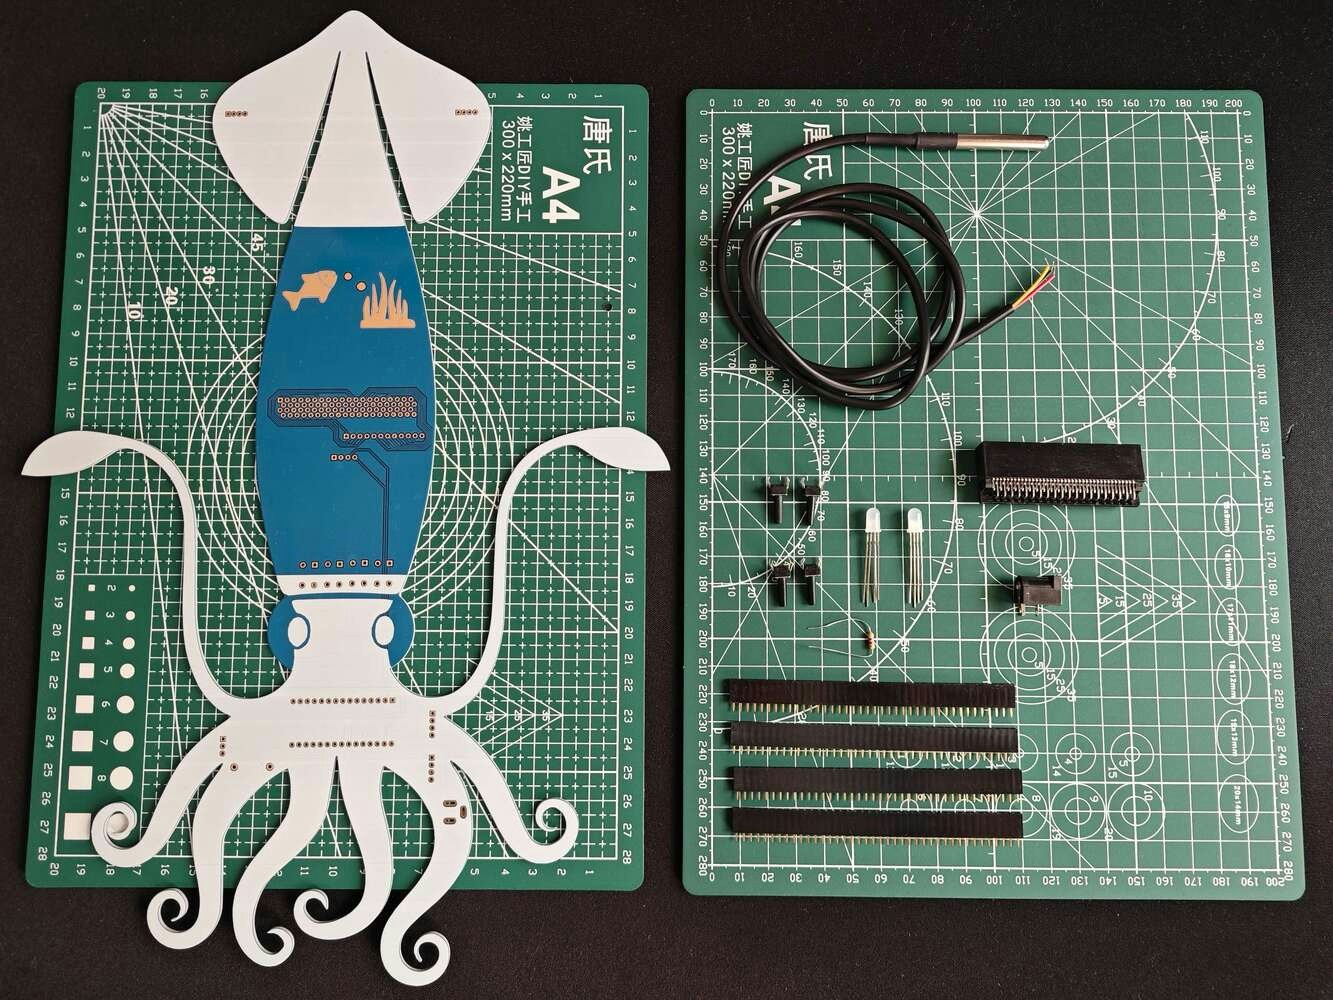
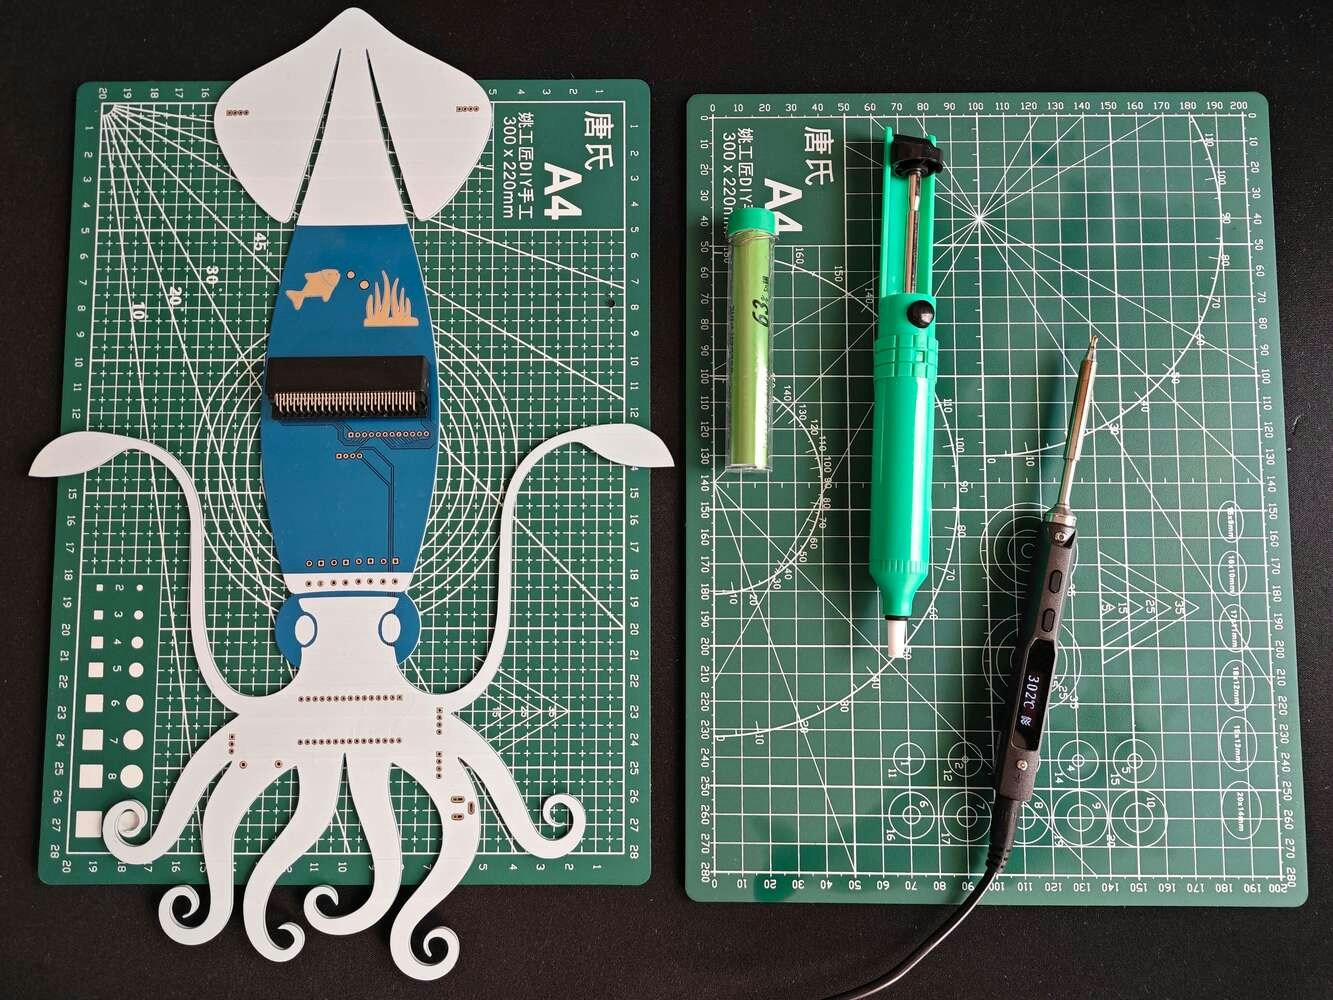
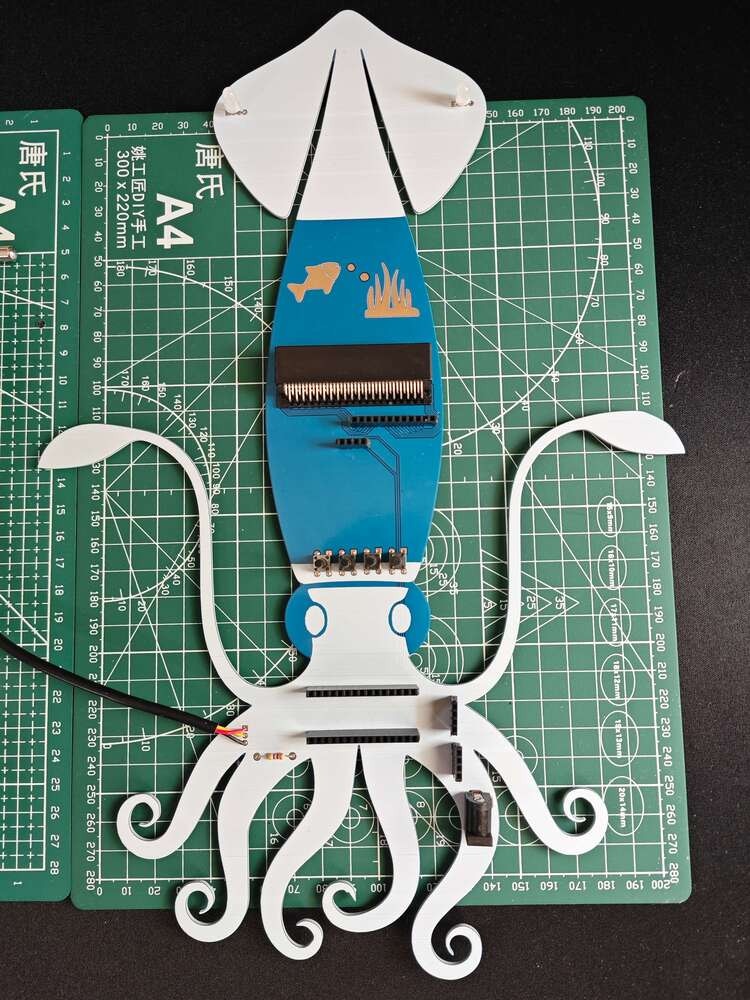
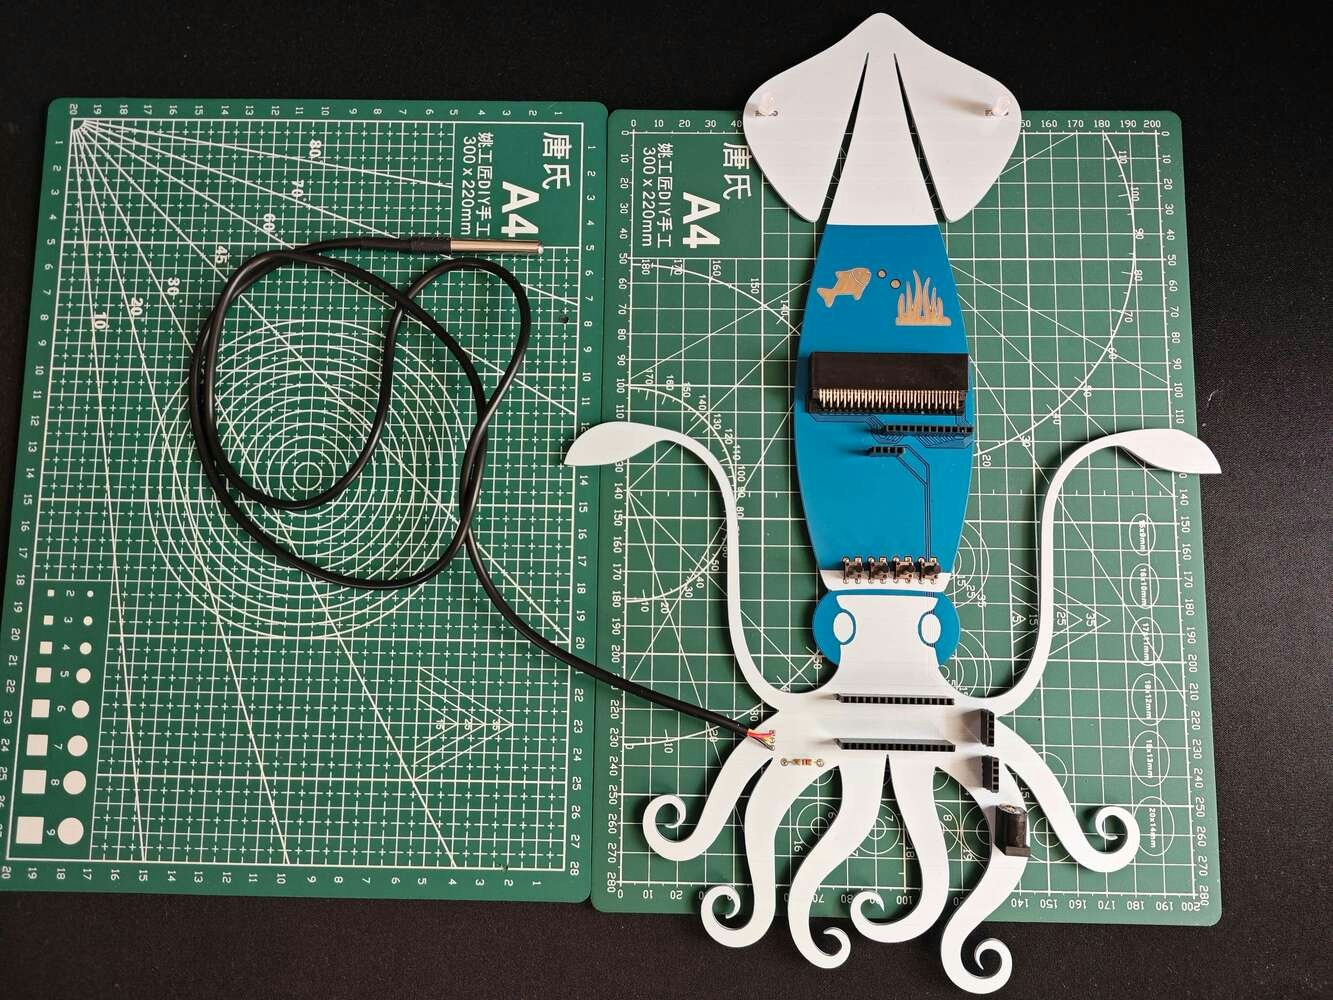
Step 1.1: Making connections and adjustments
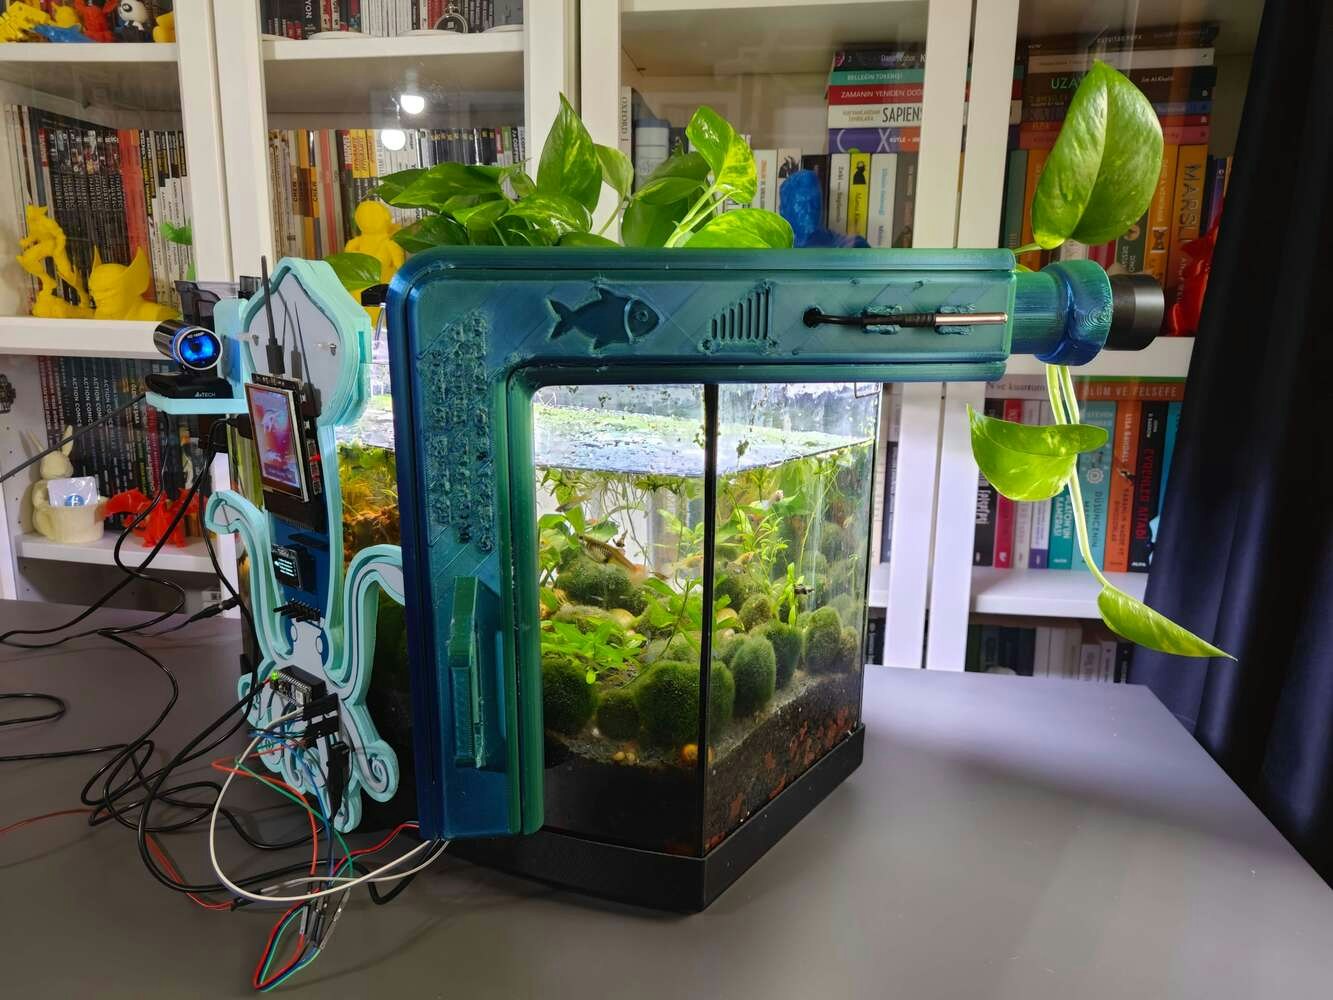
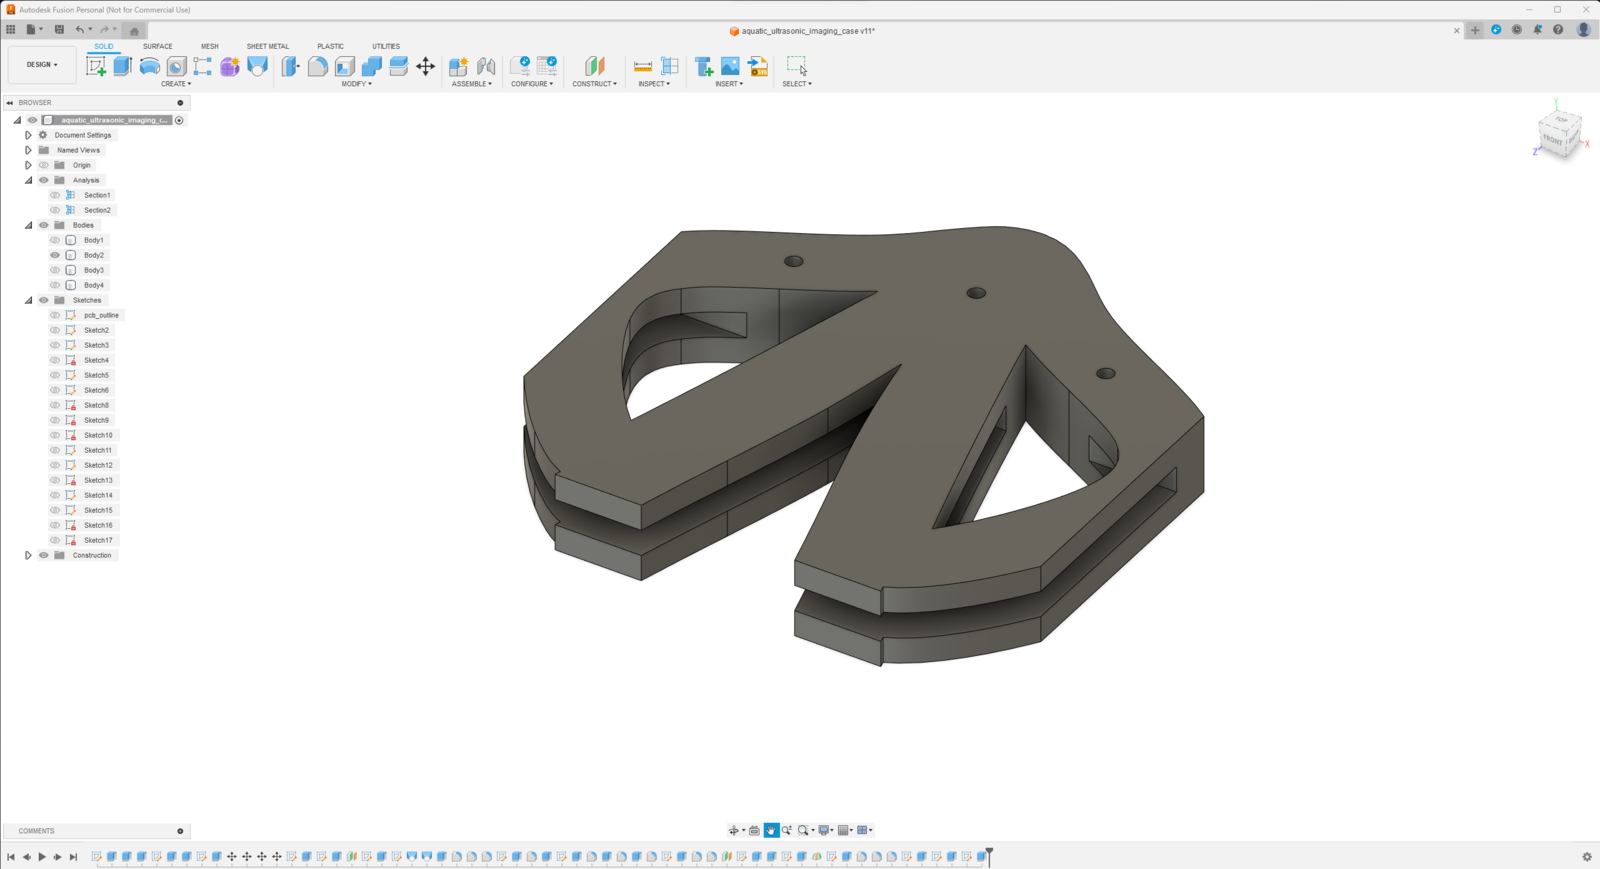
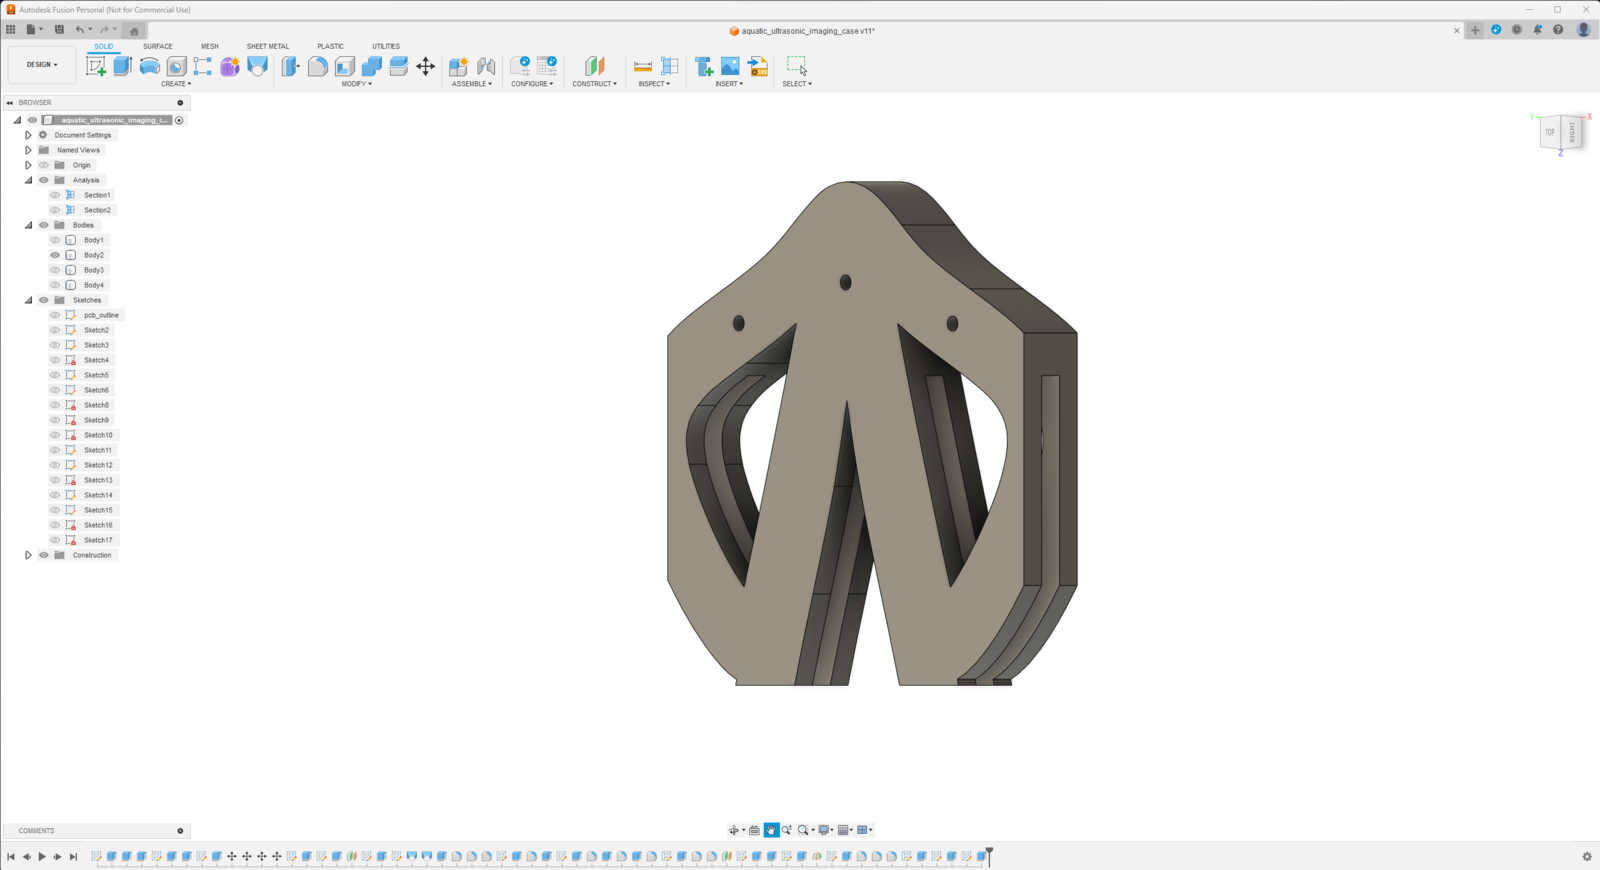
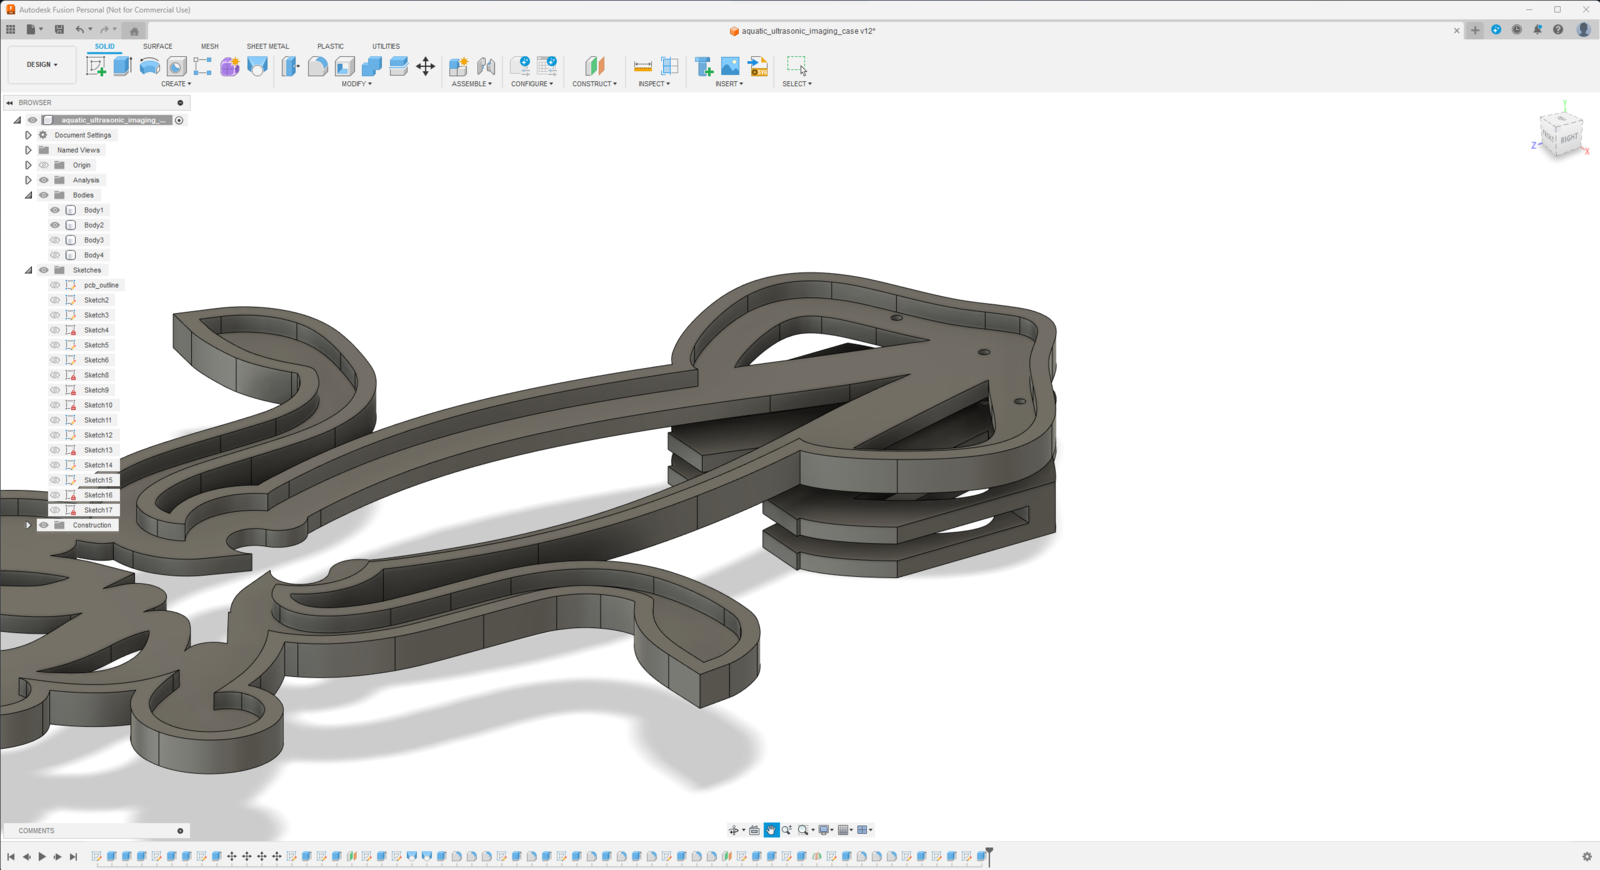
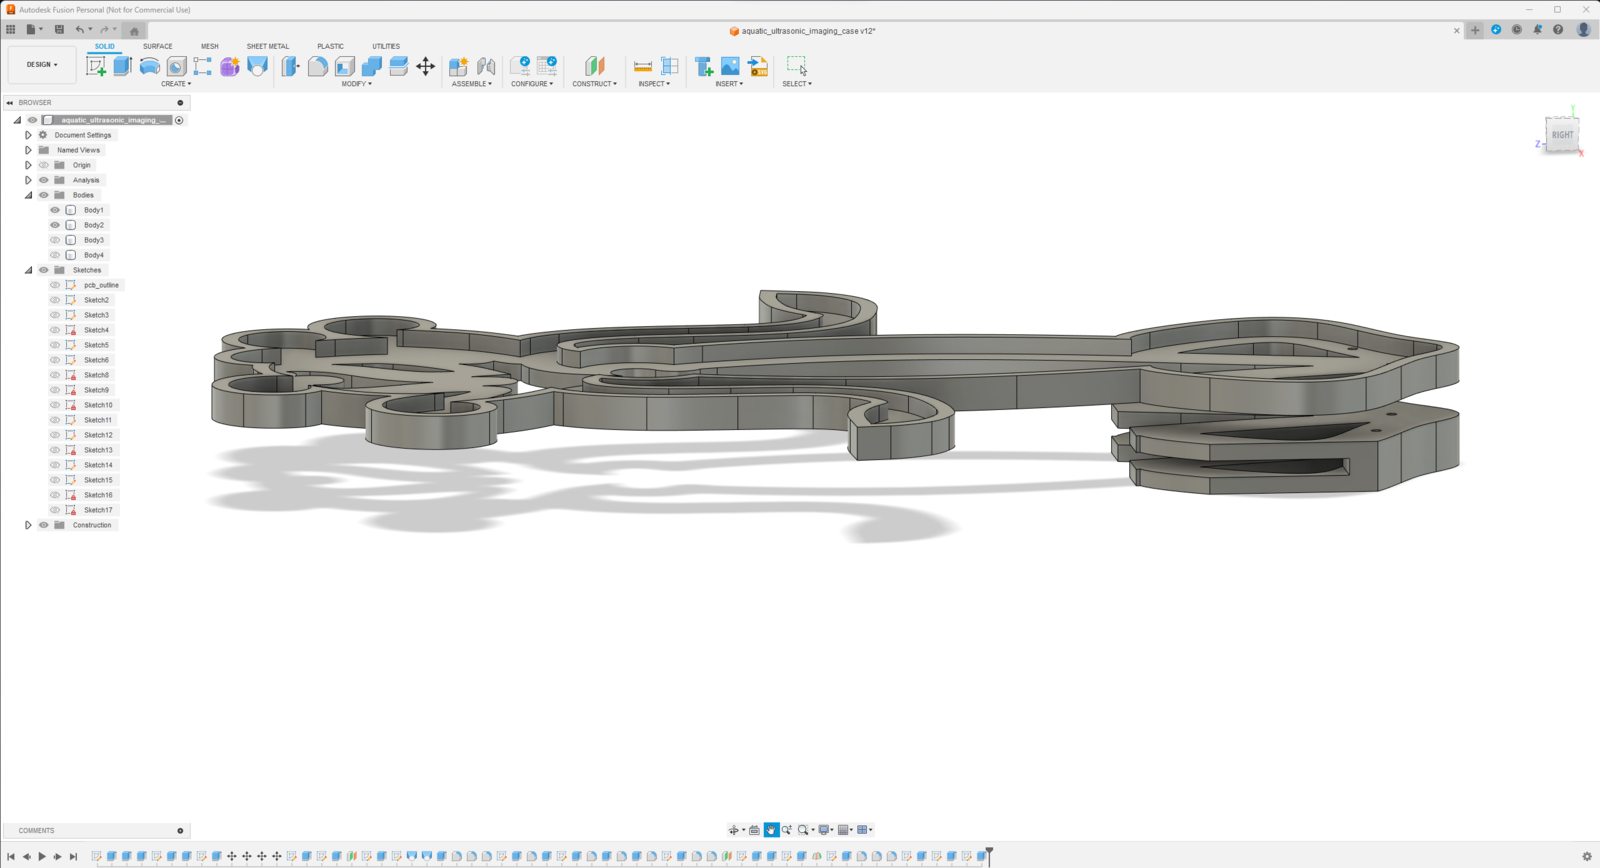
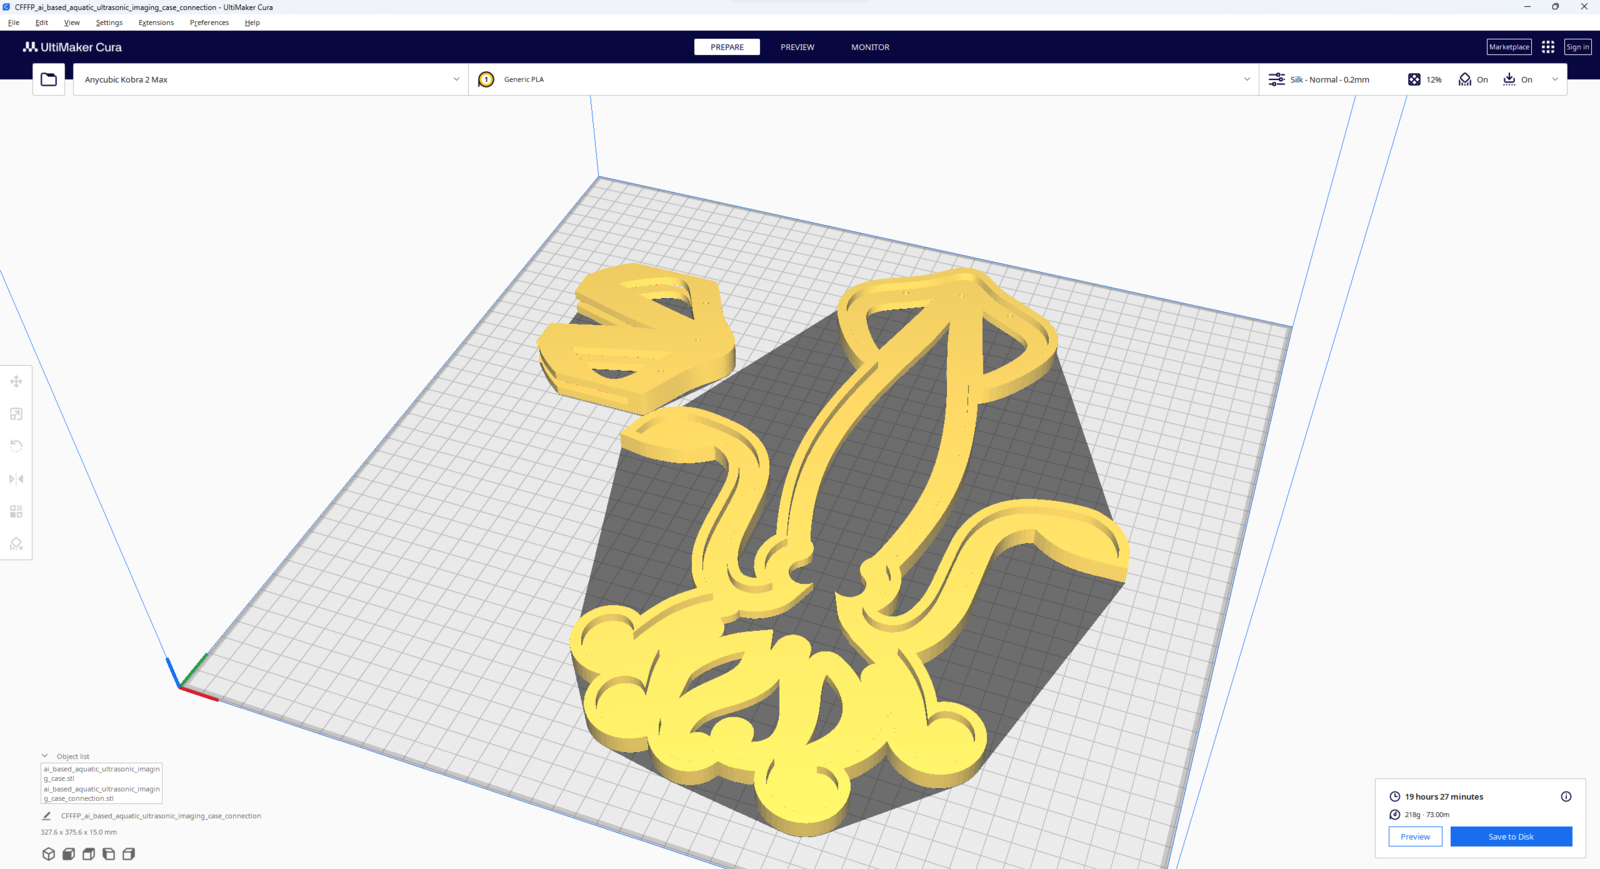
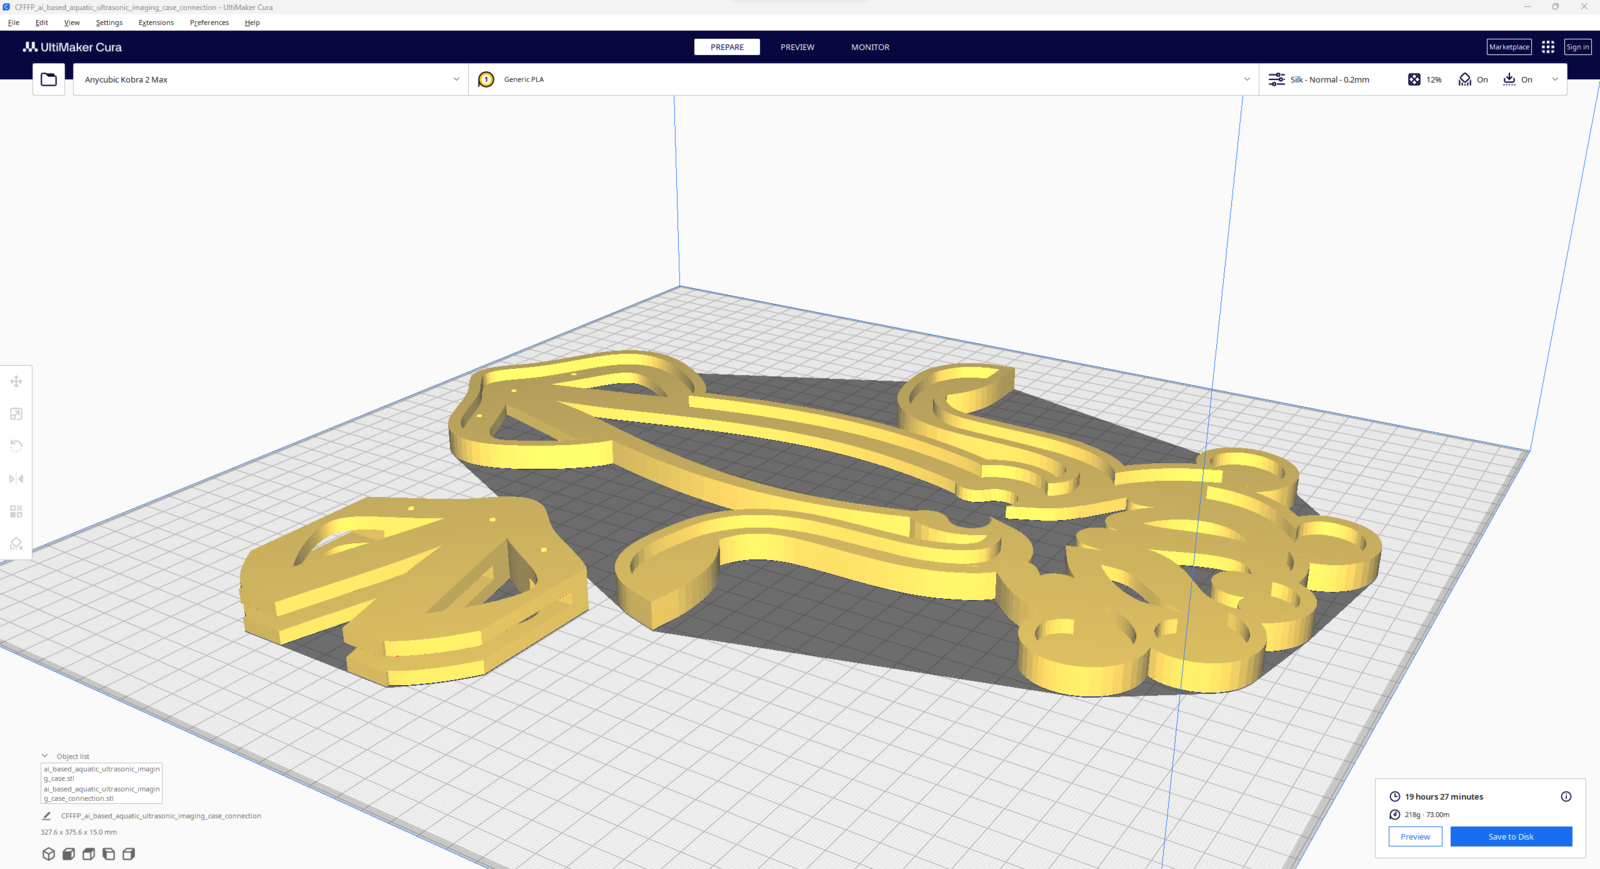
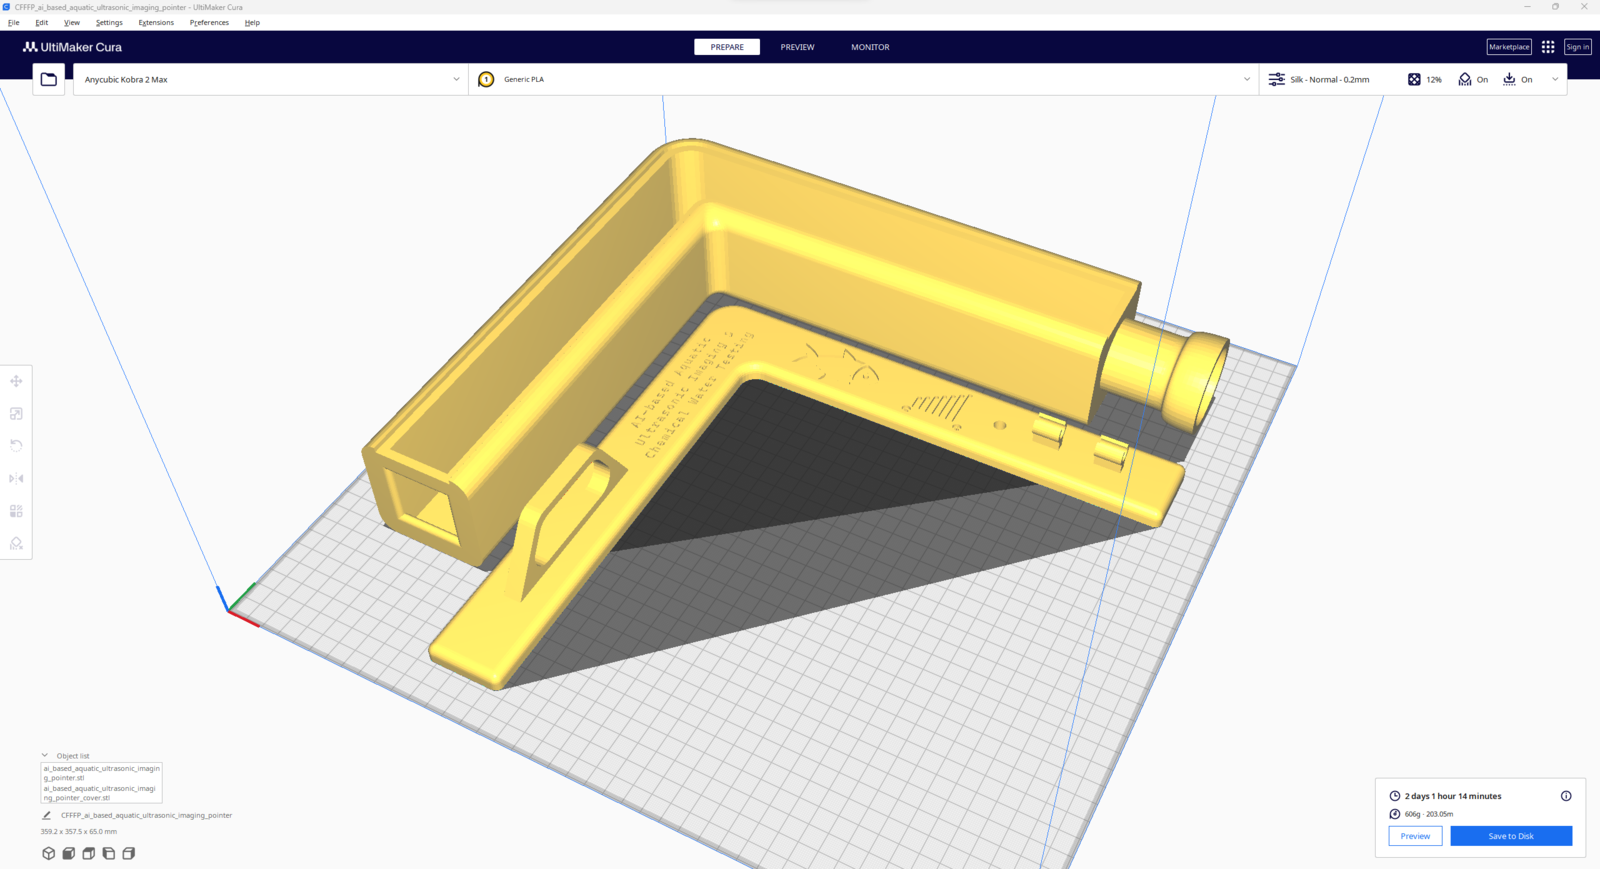
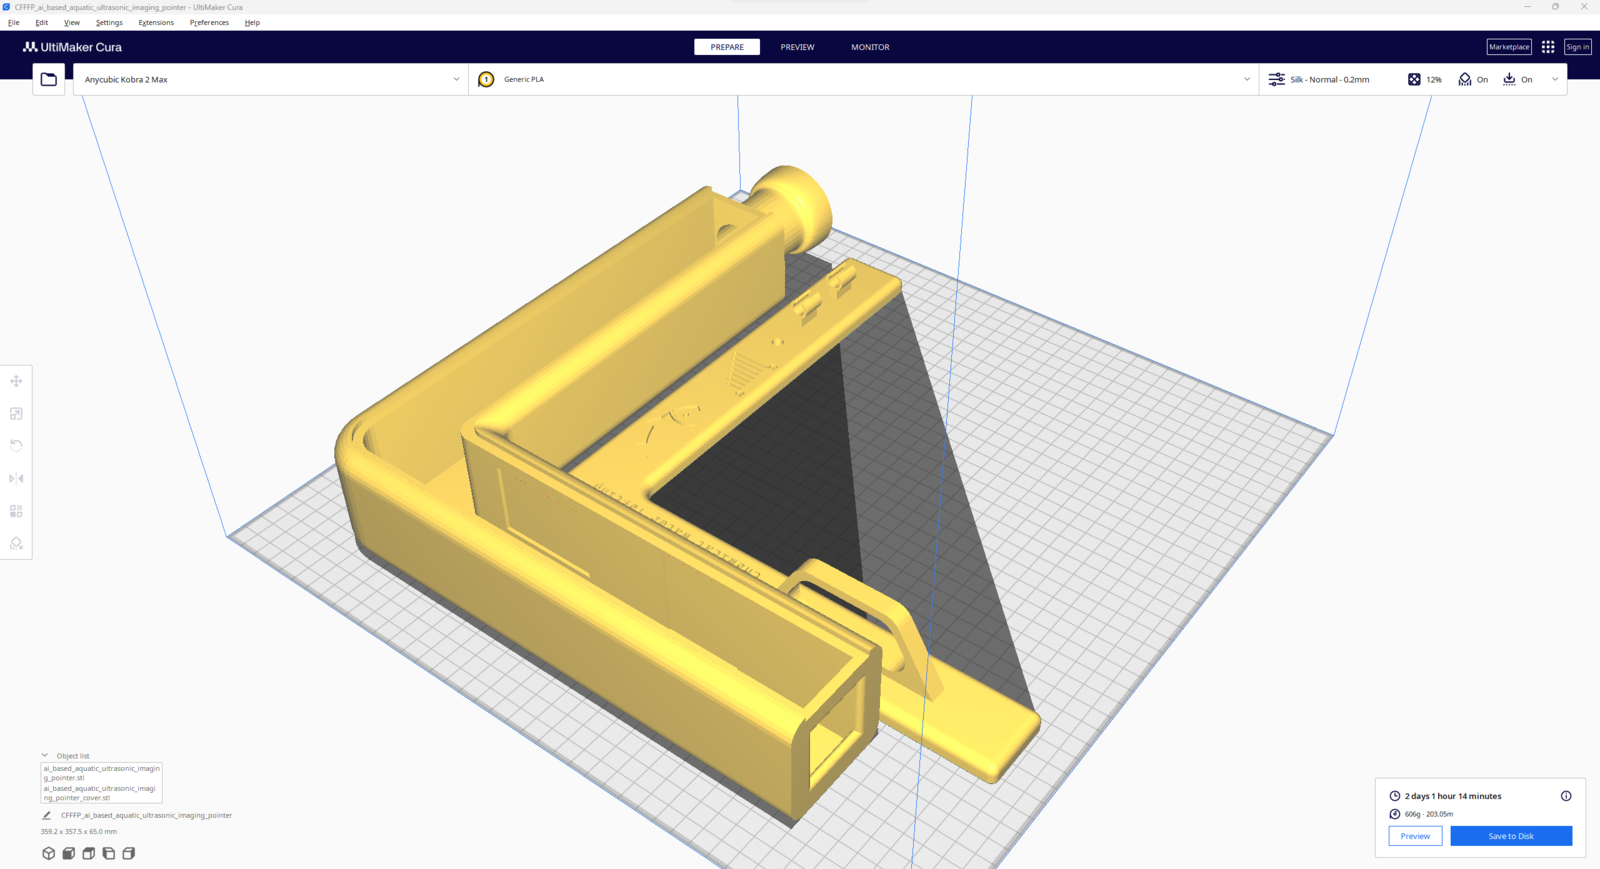
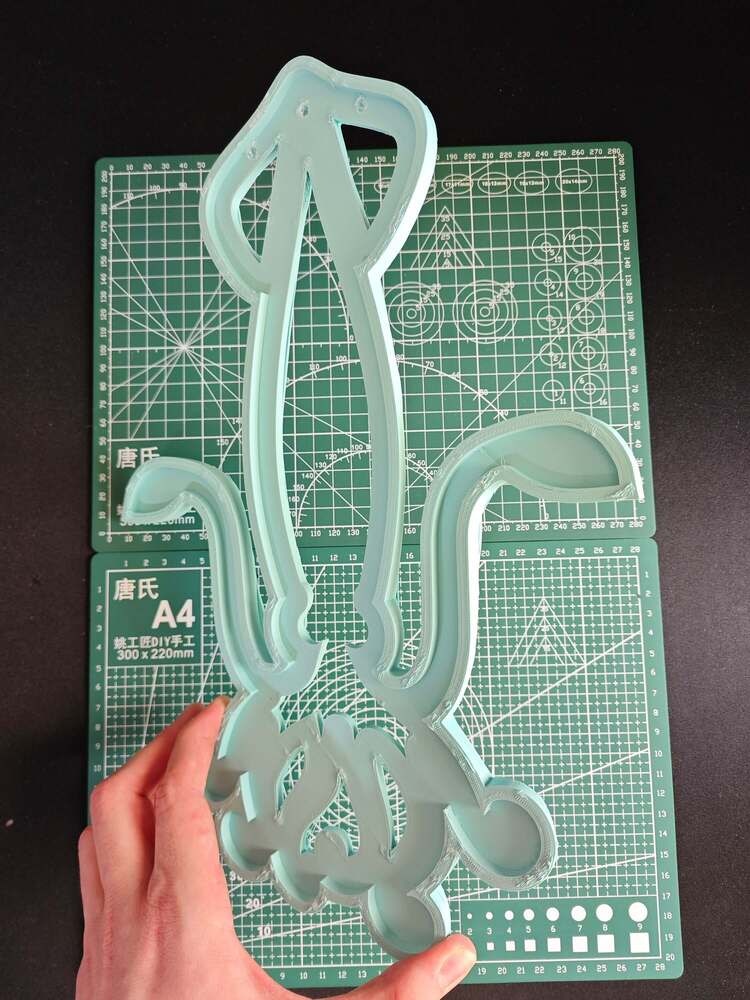
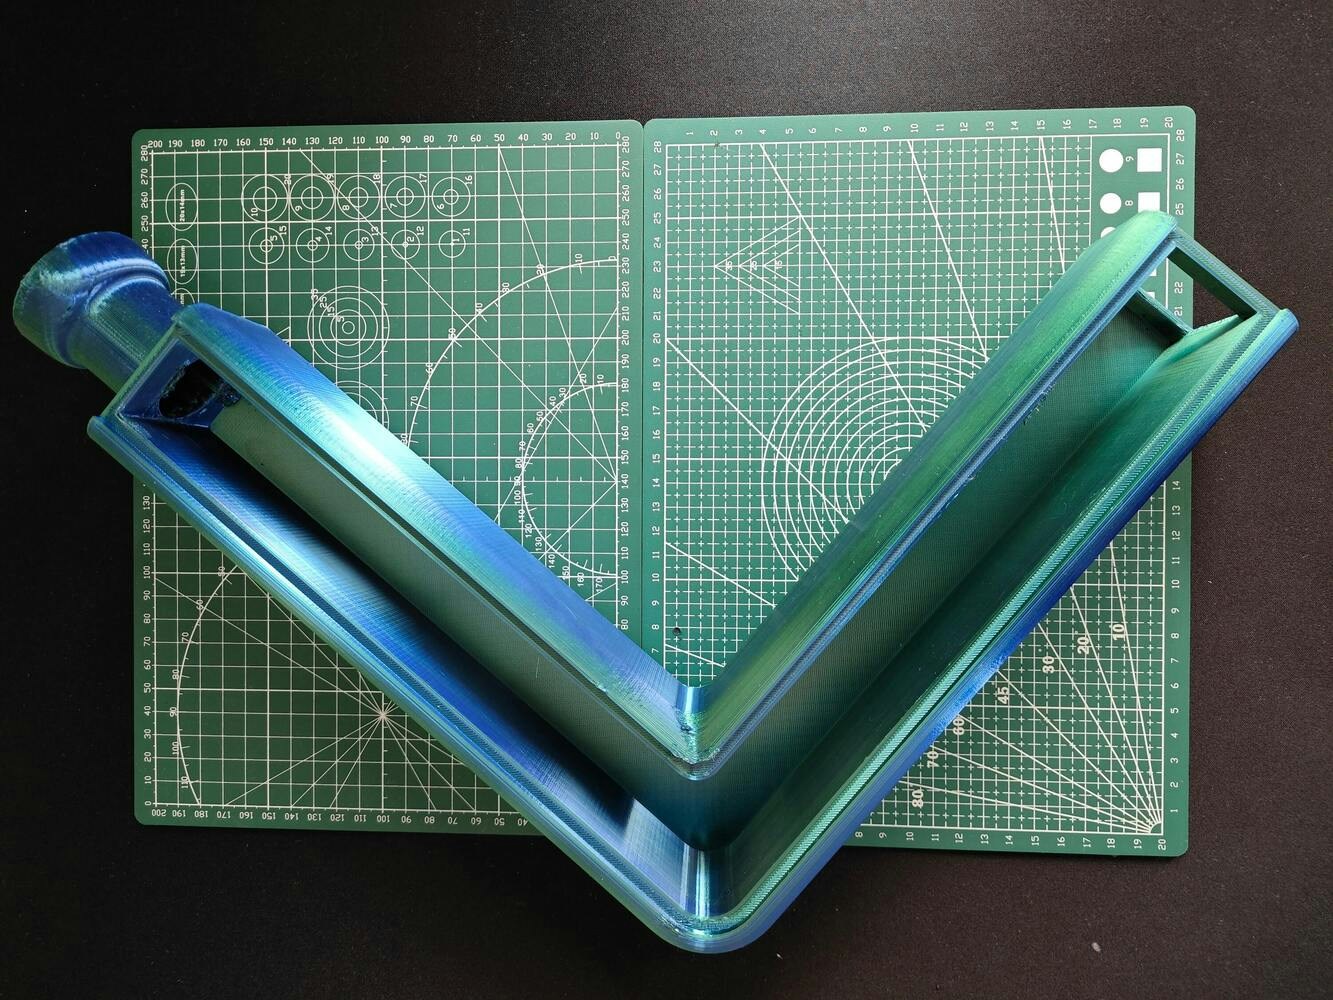
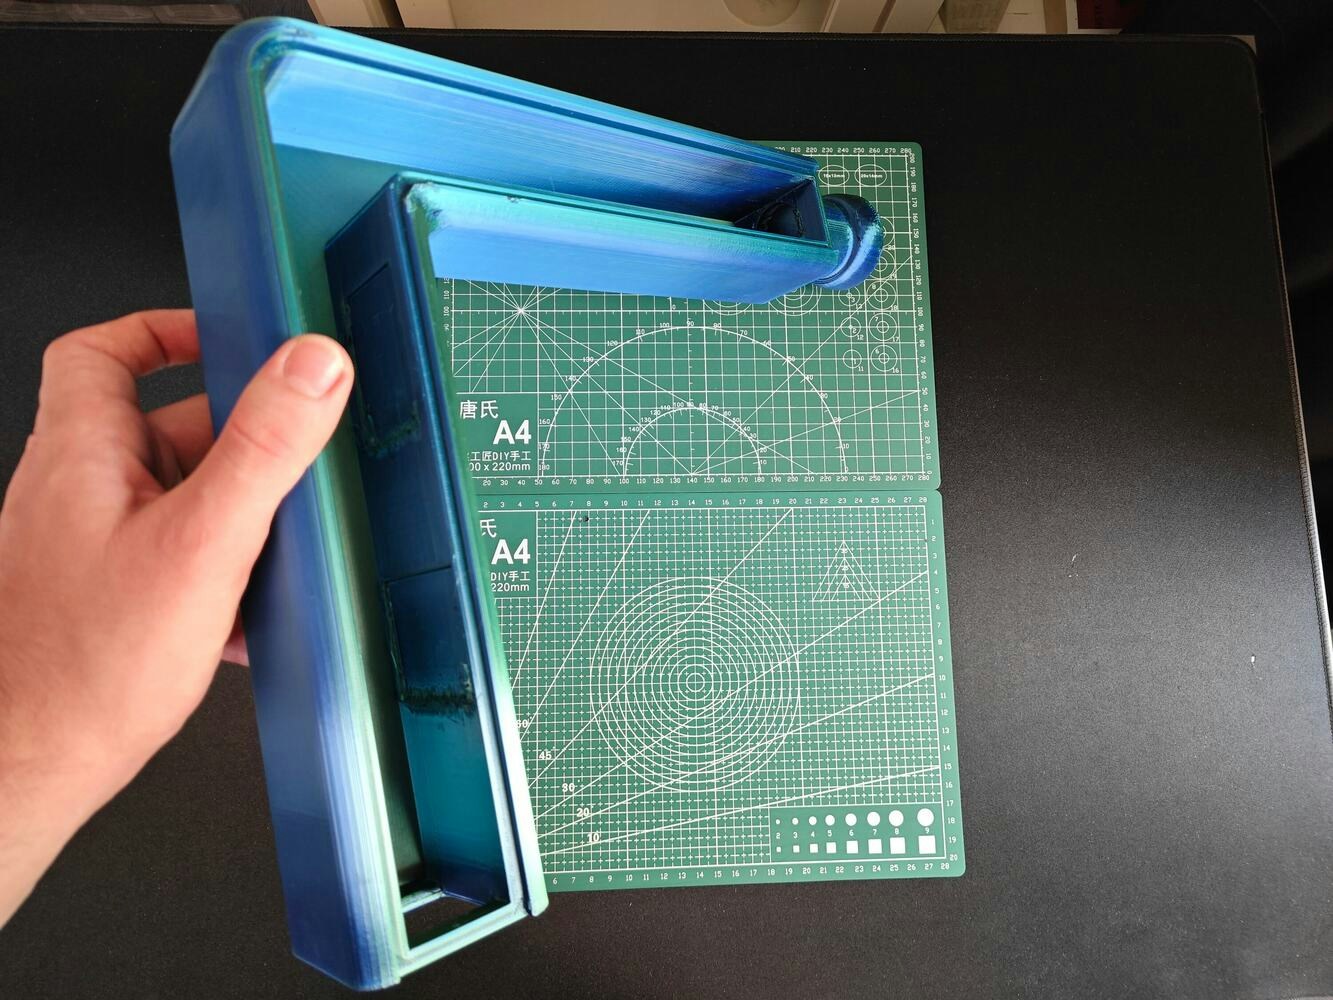
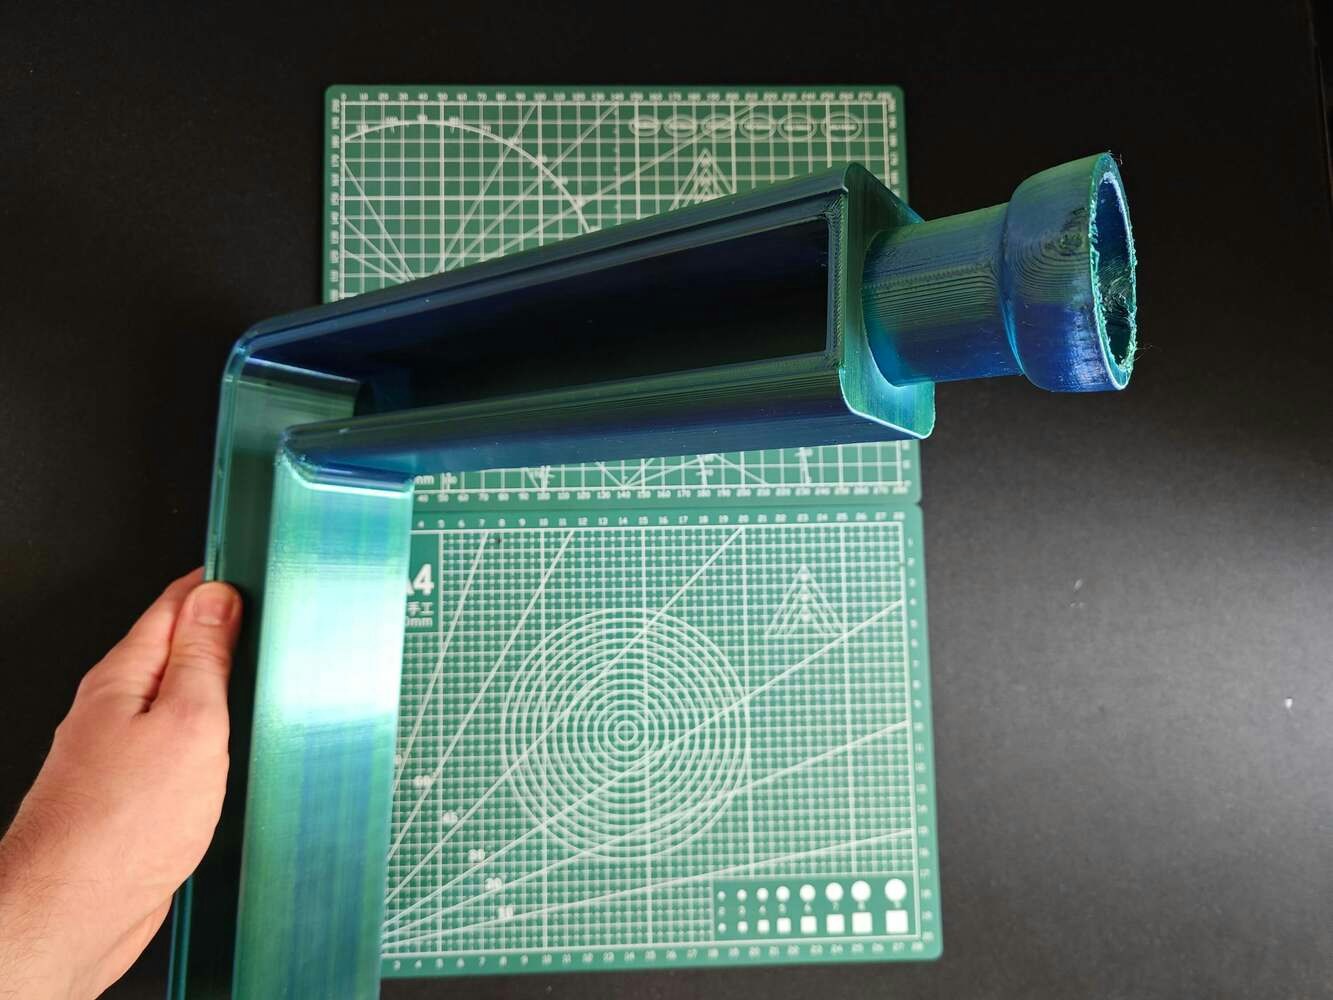
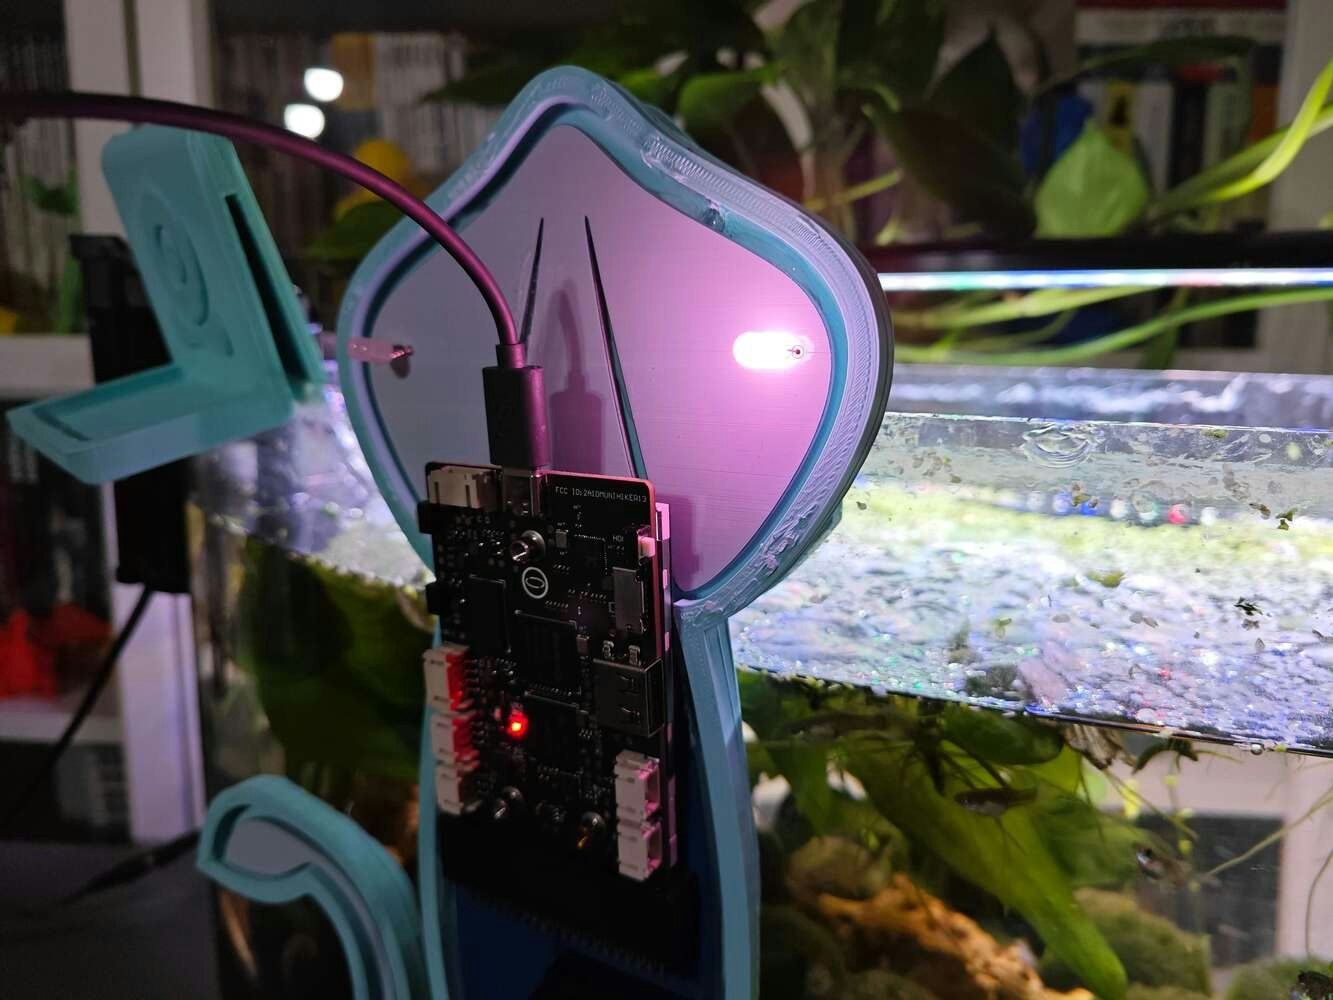
Step 2: Designing and printing the Aquatic-themed case
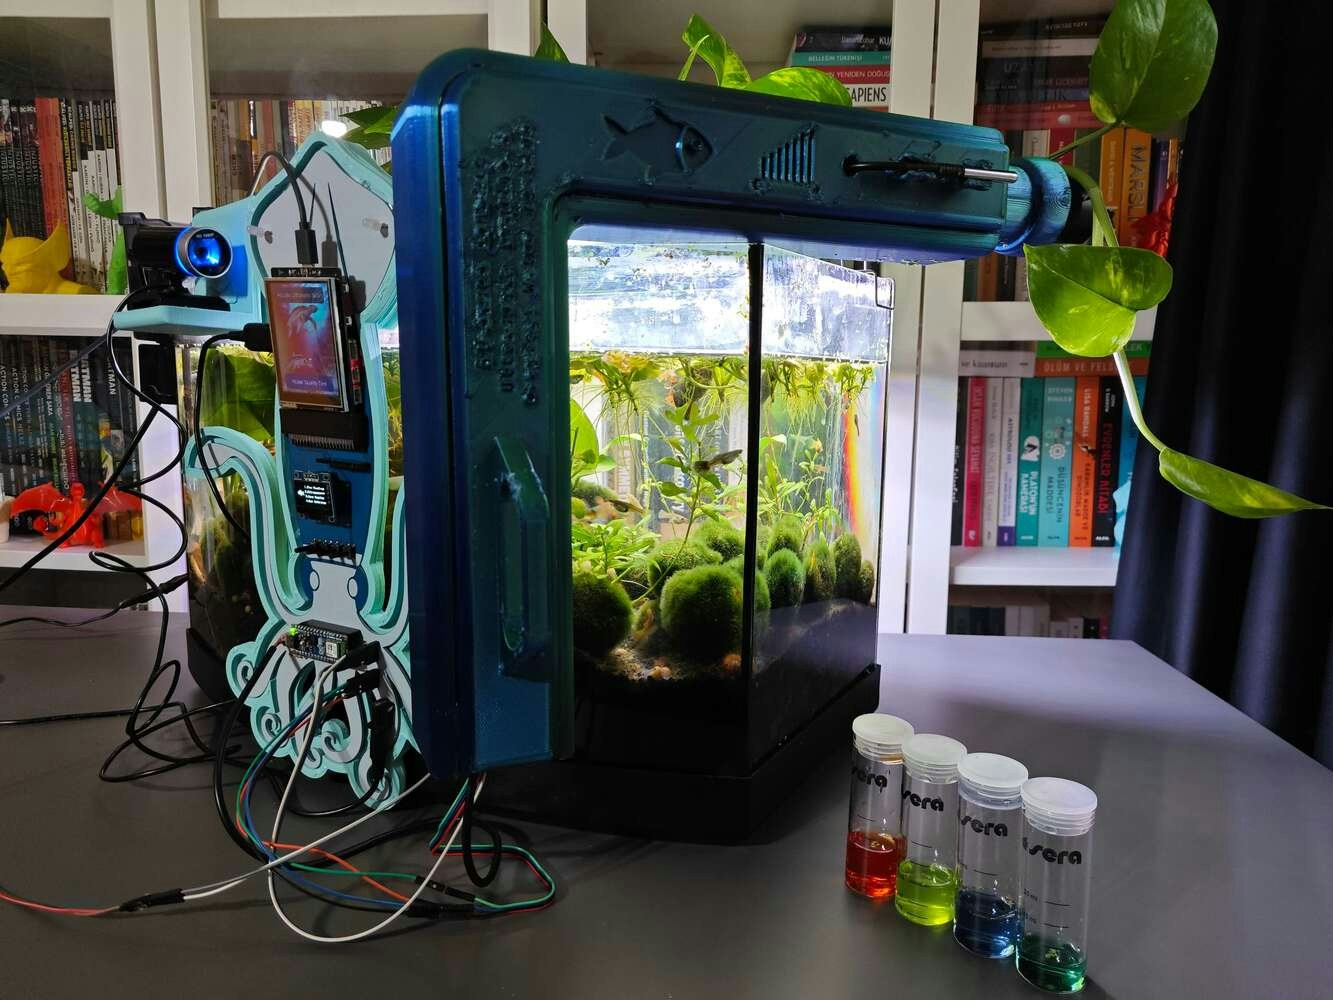
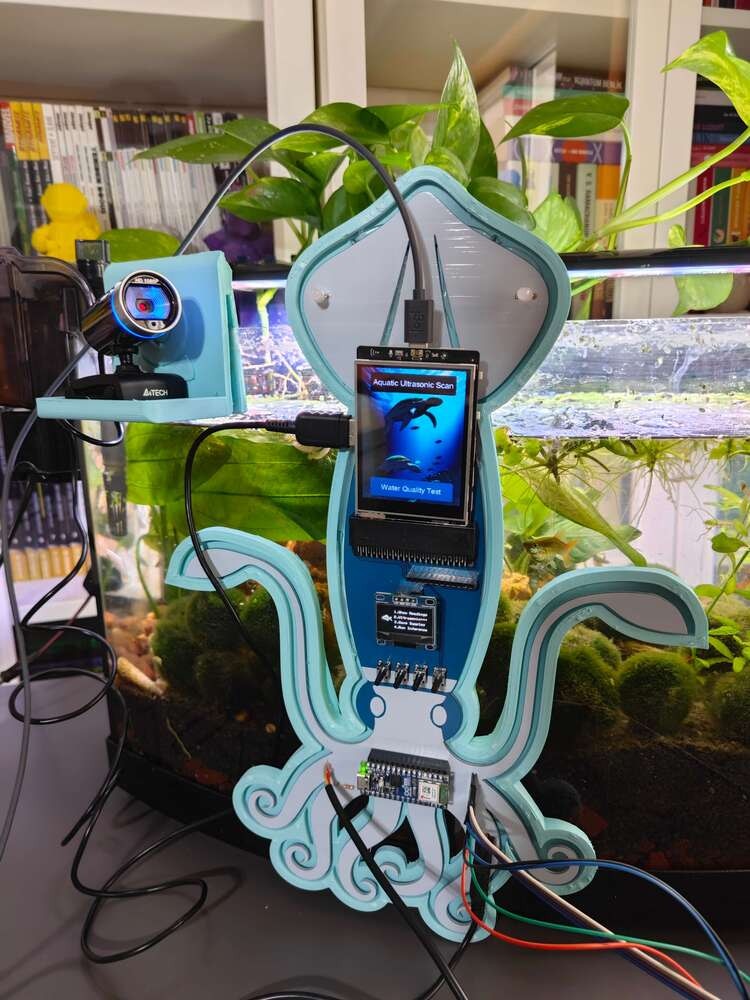
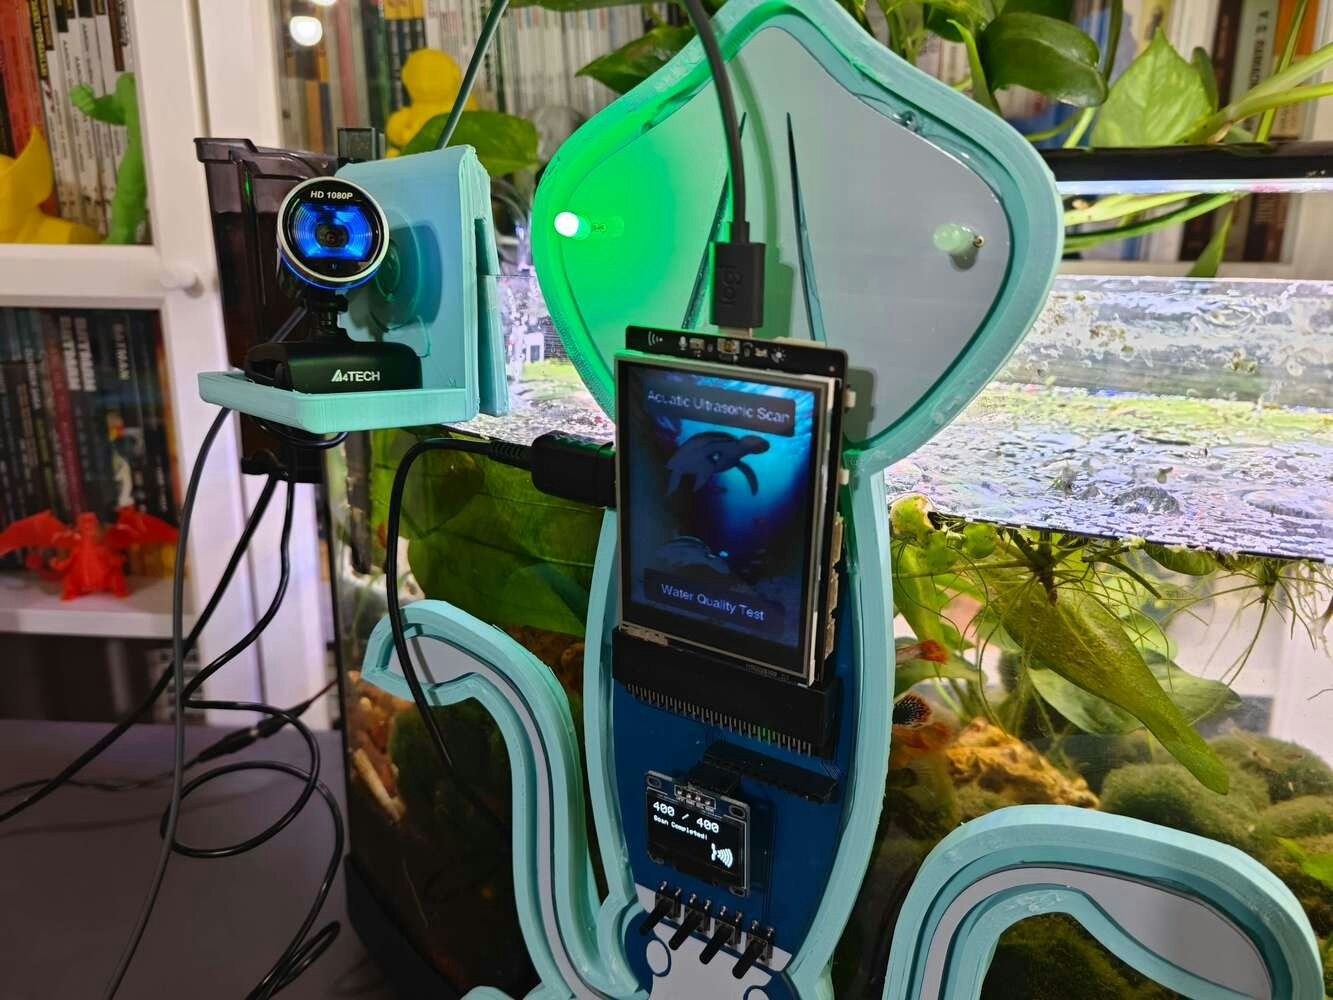
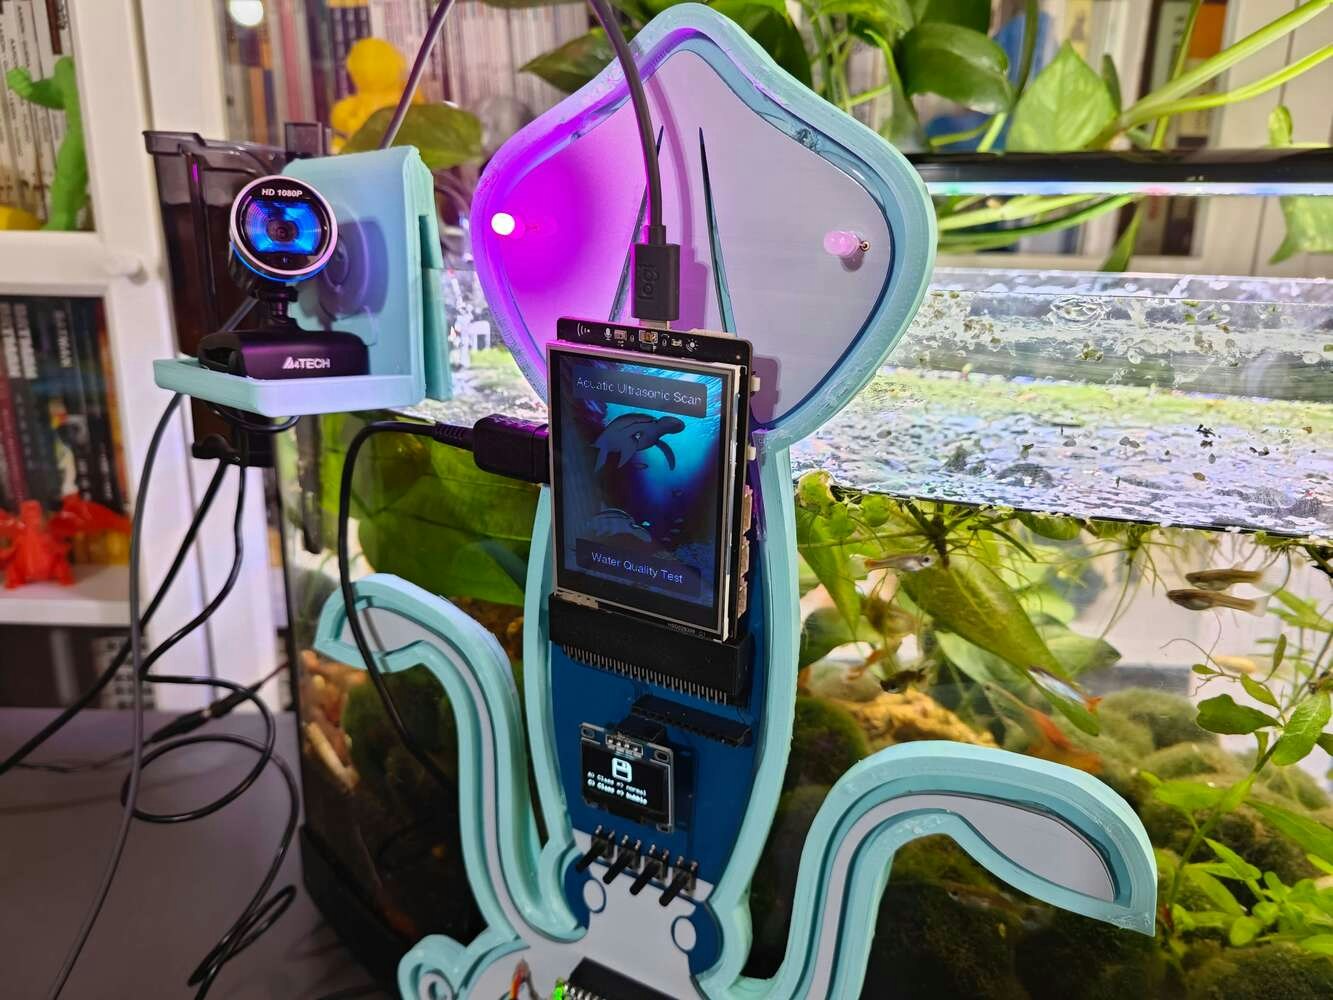
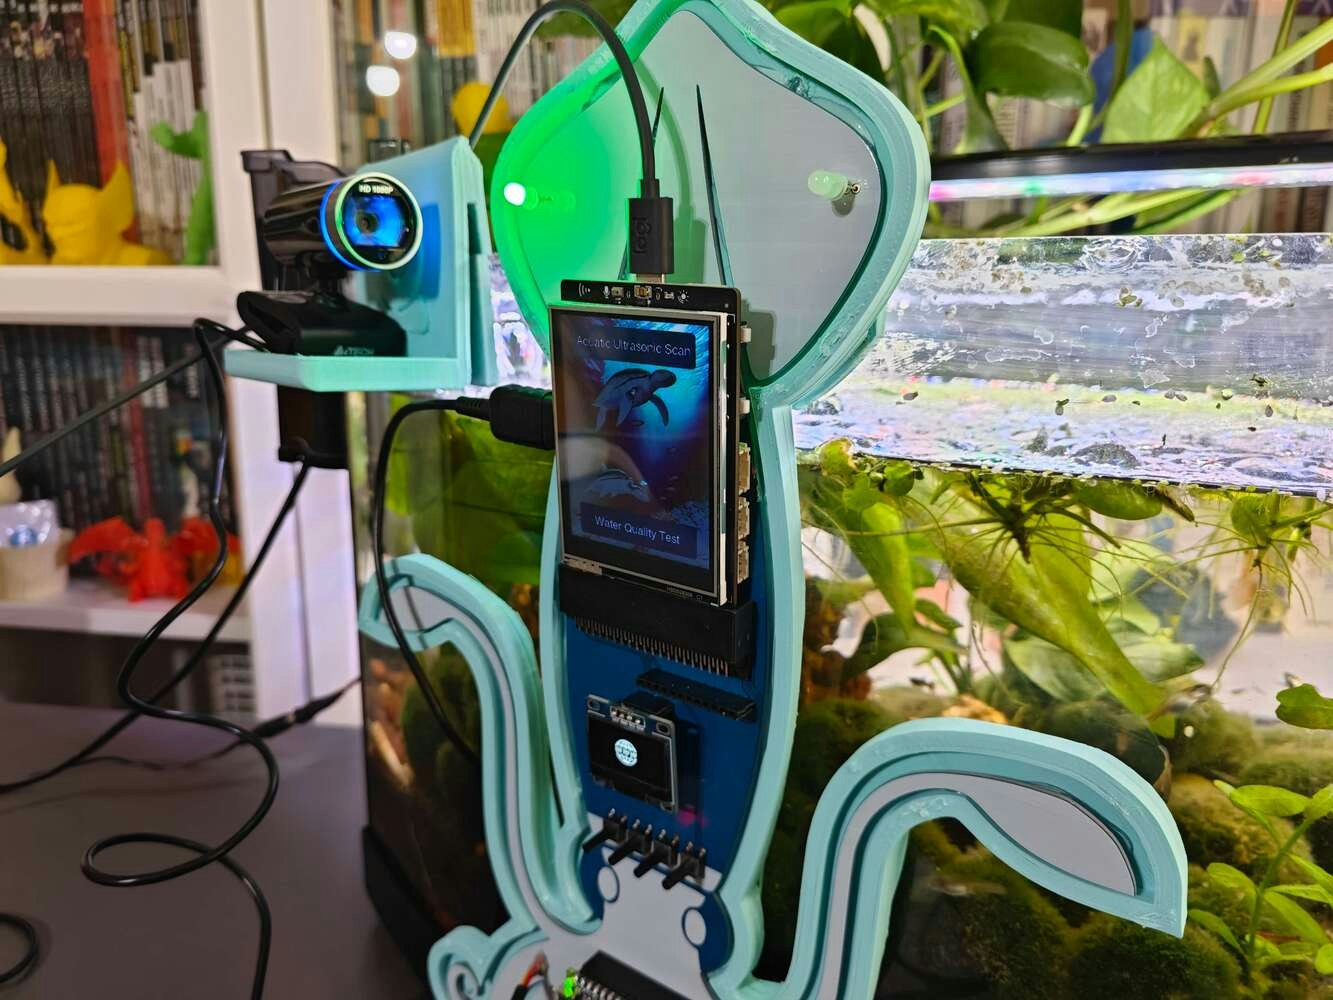
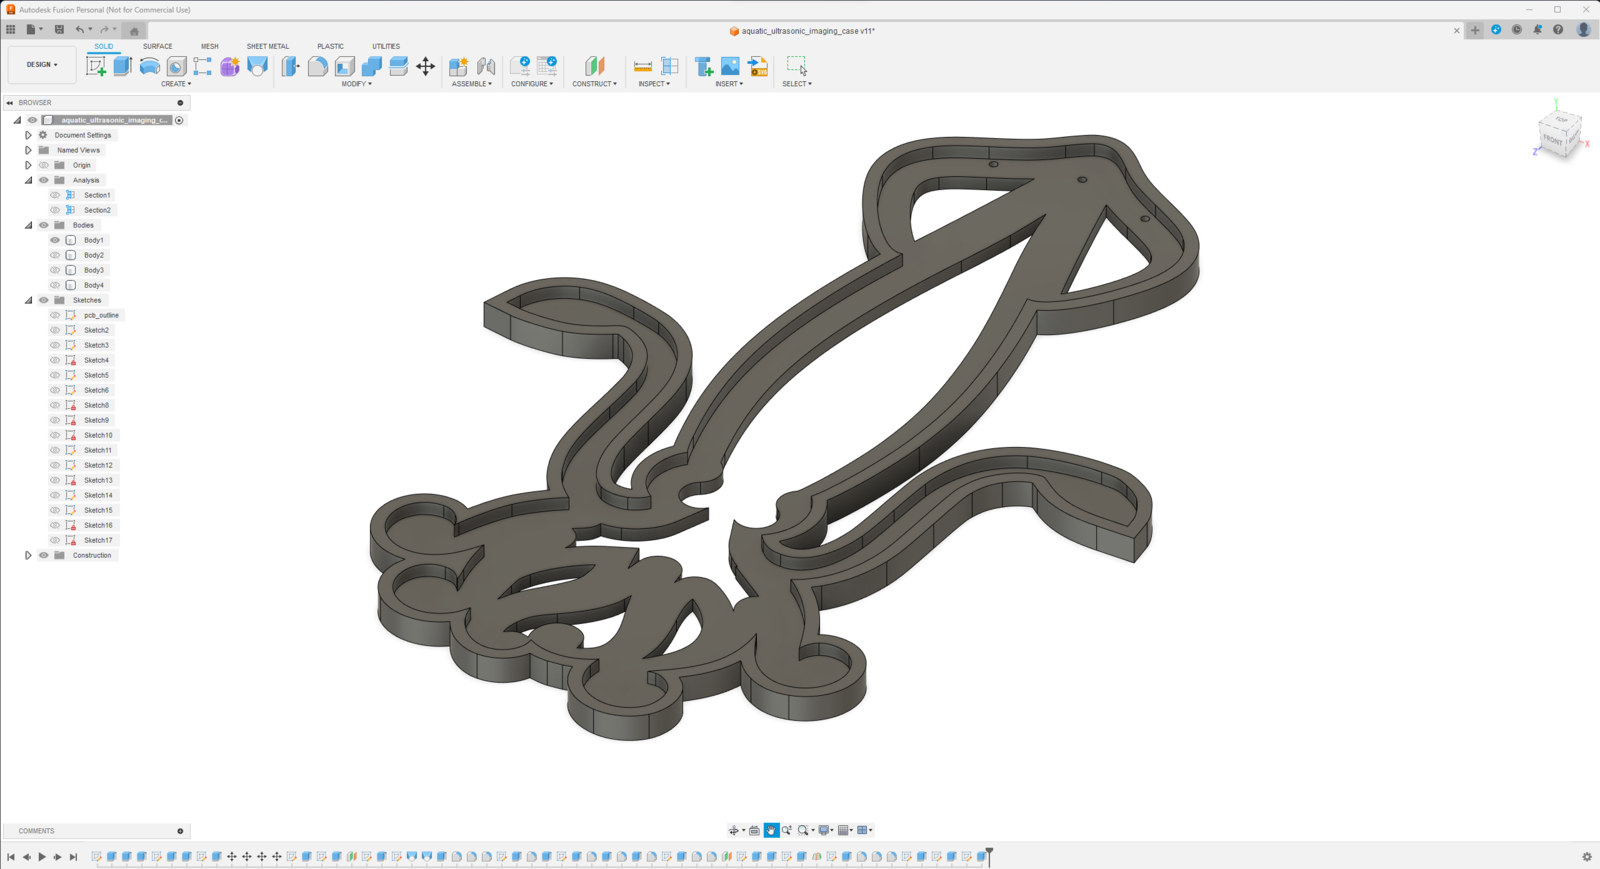
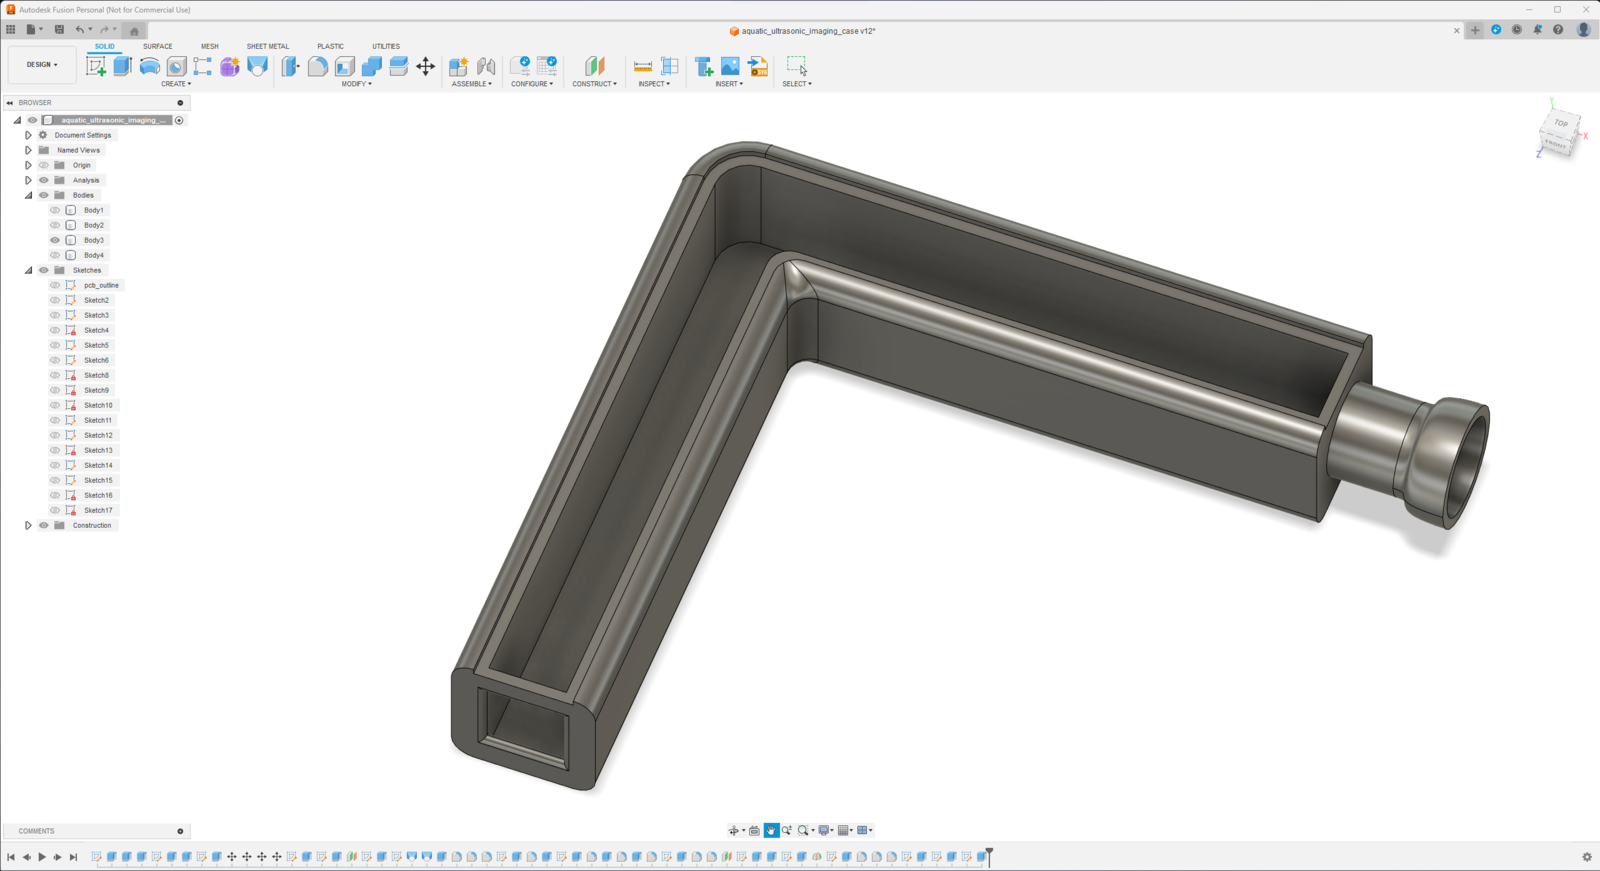
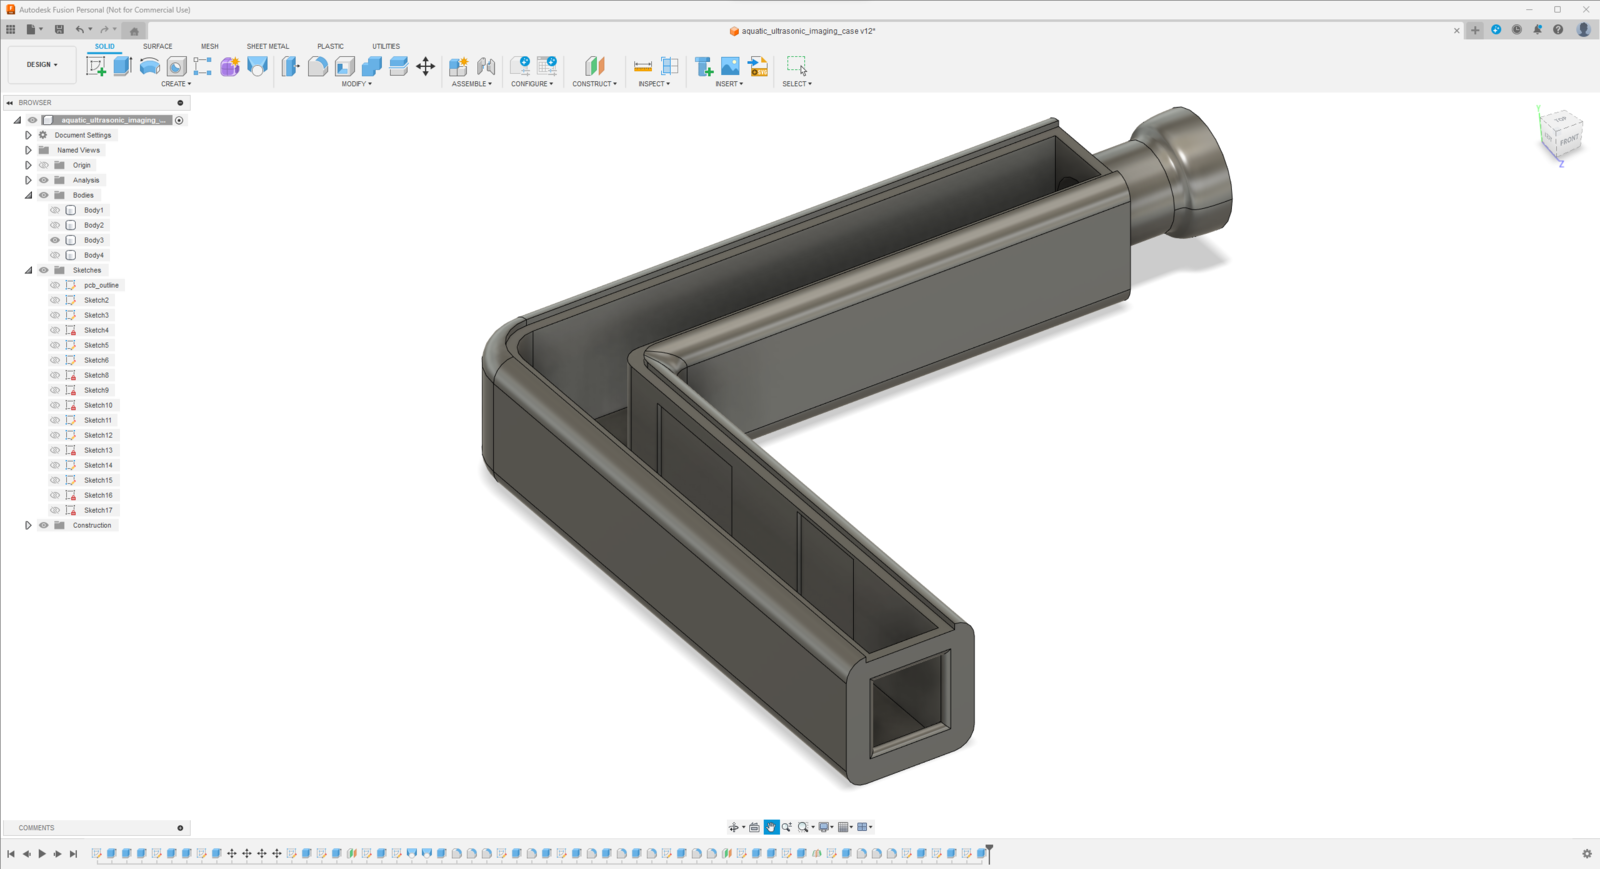
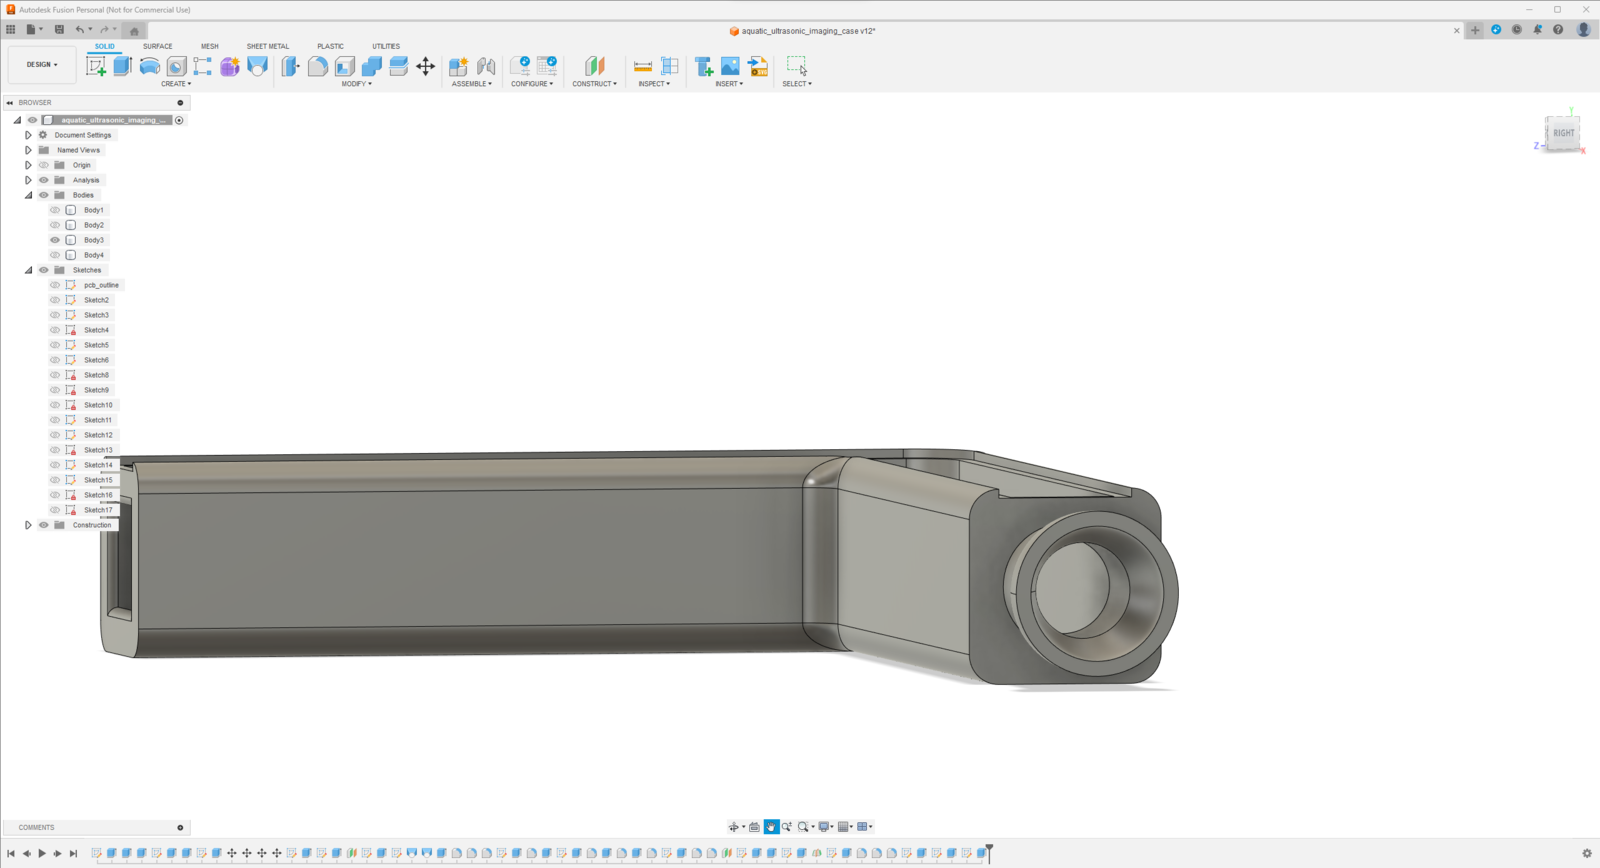
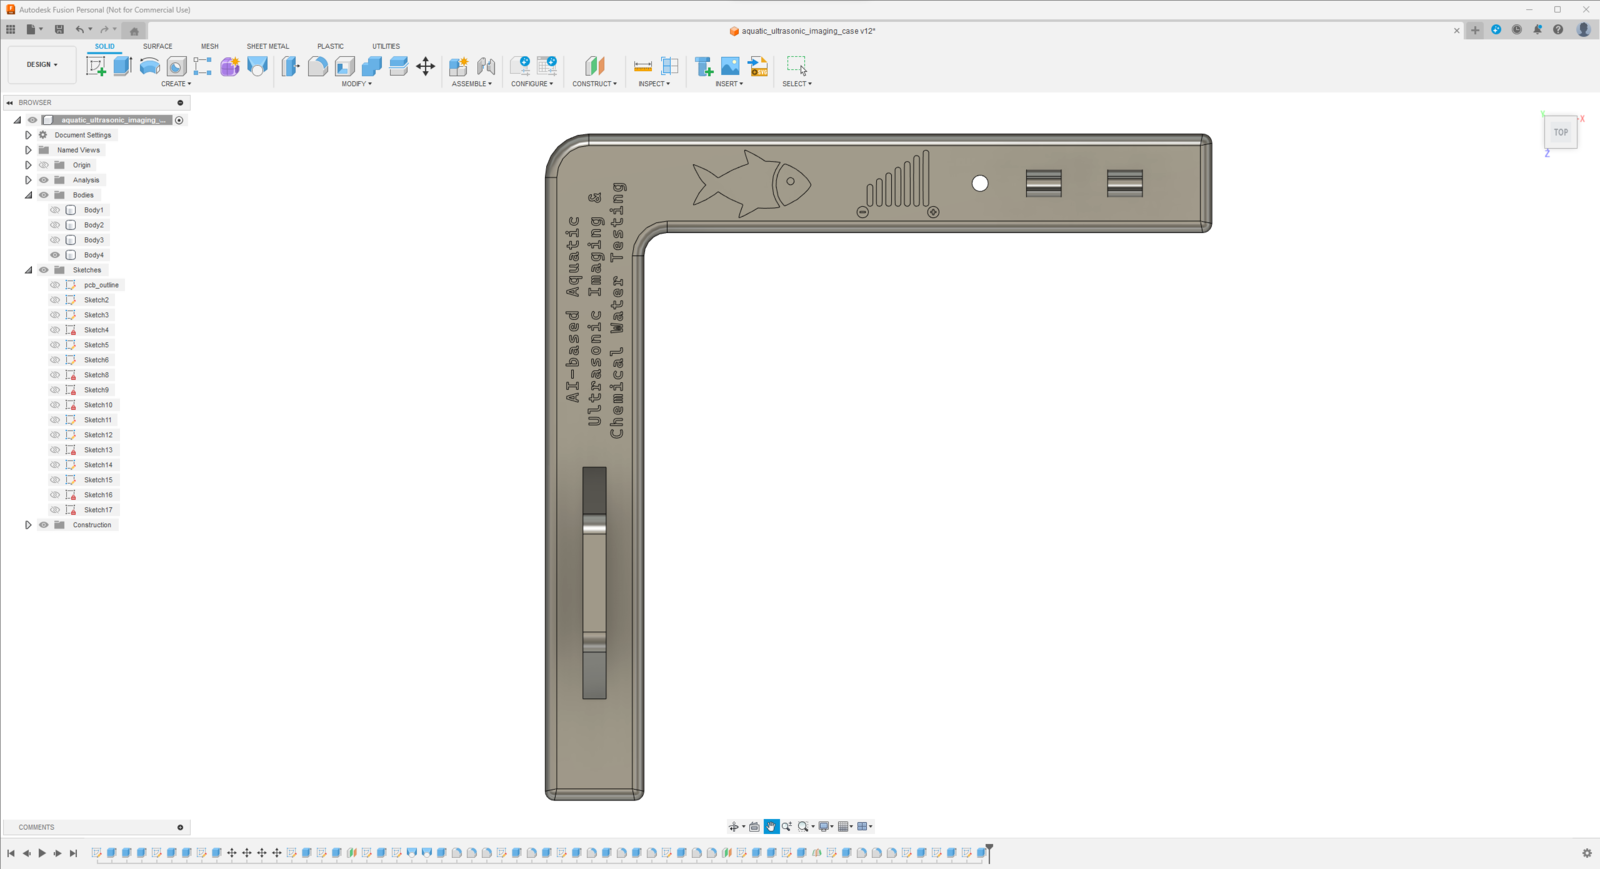
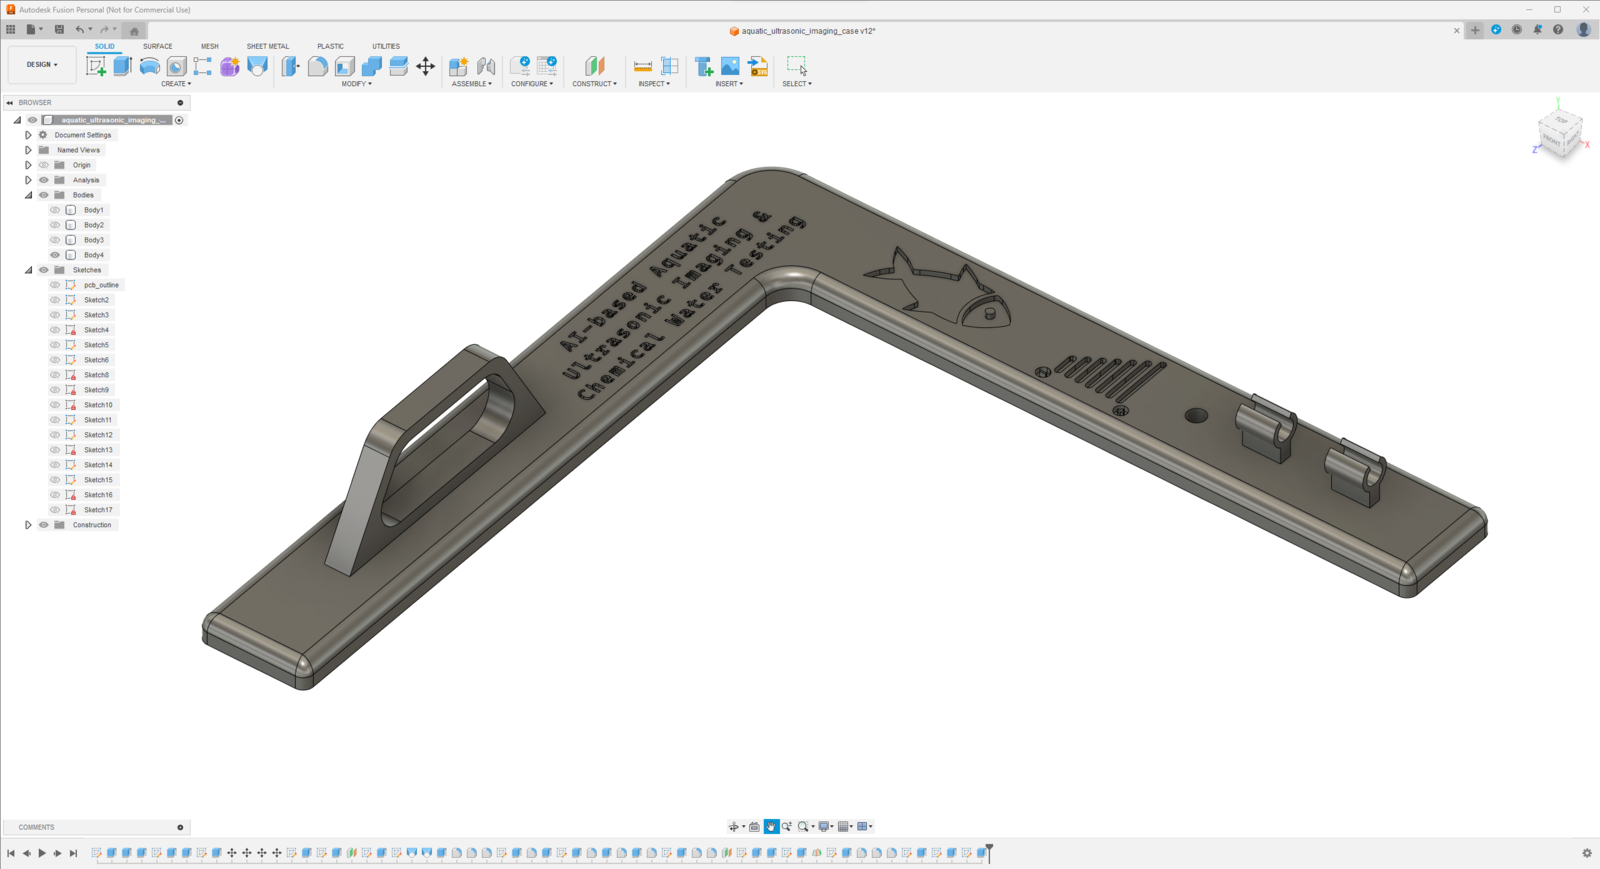
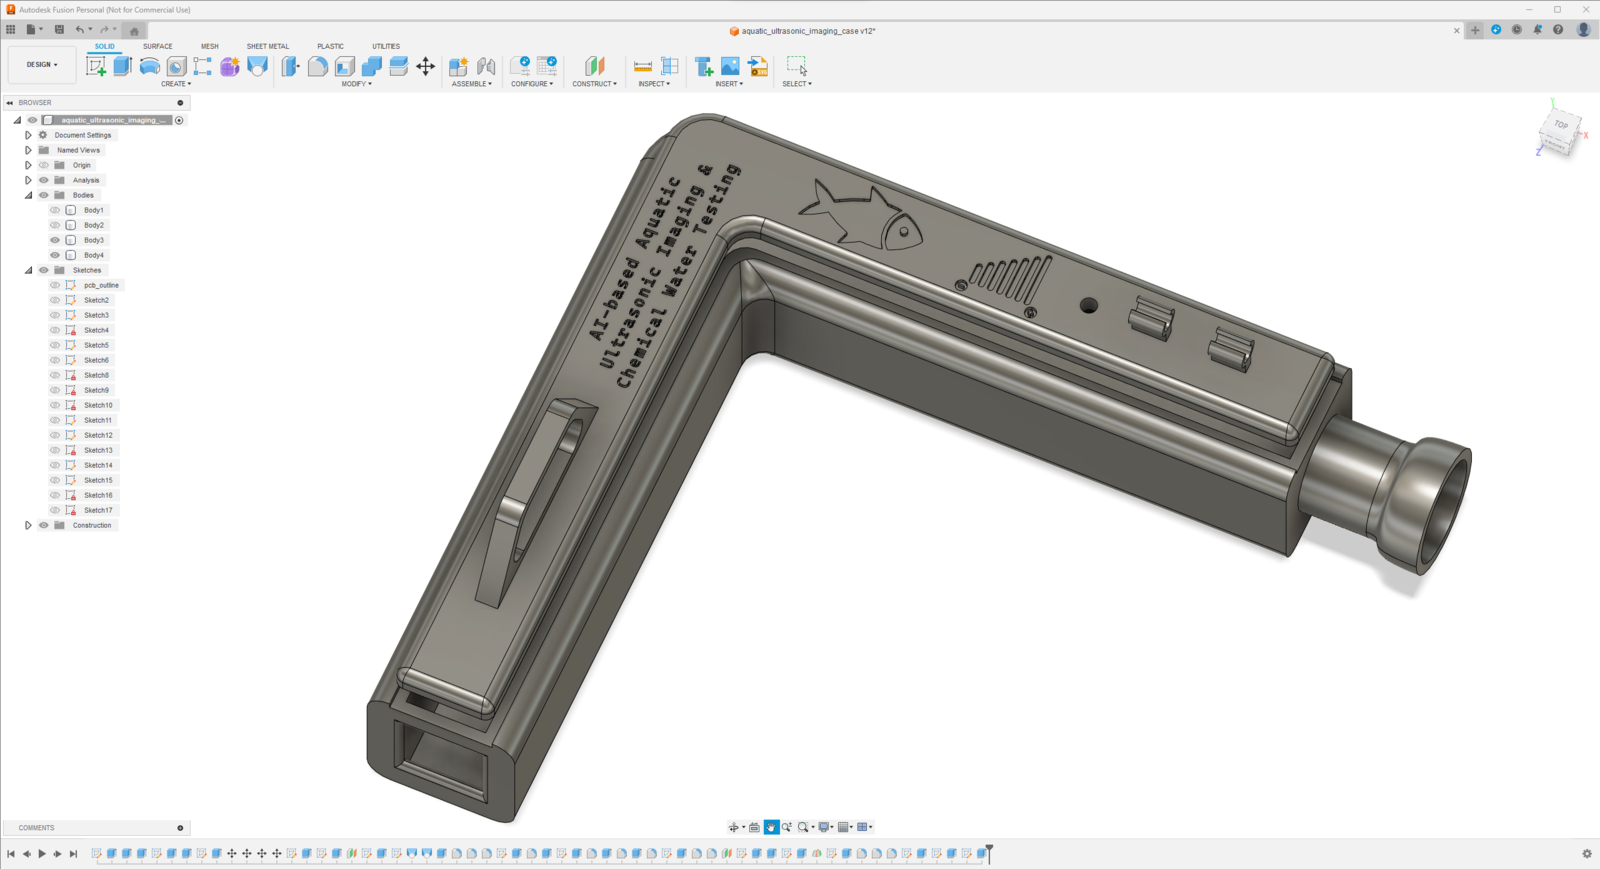
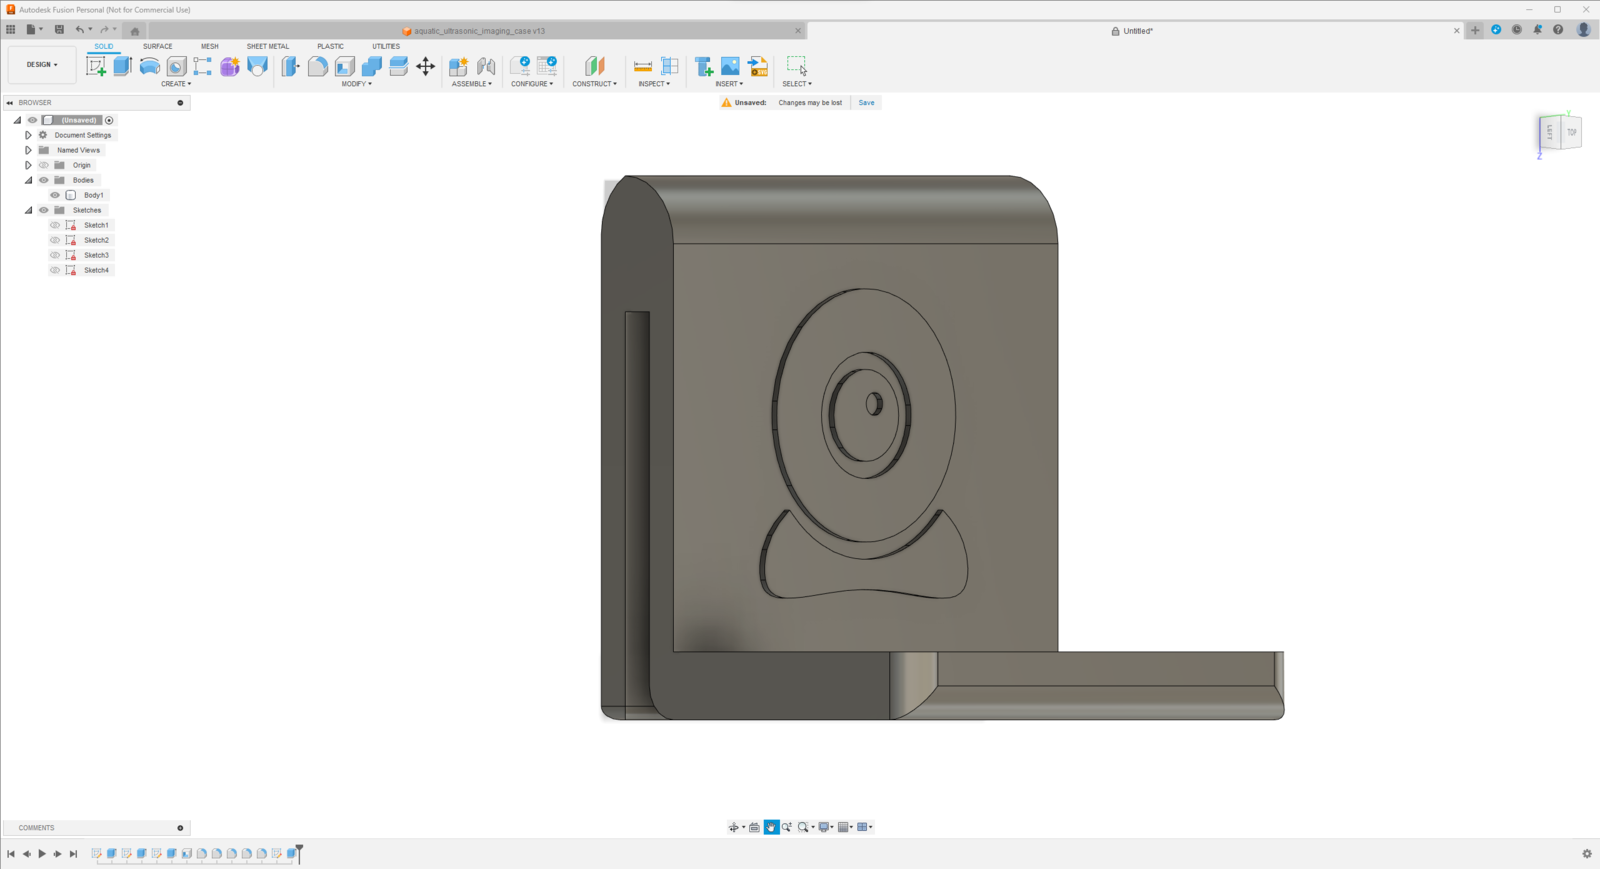
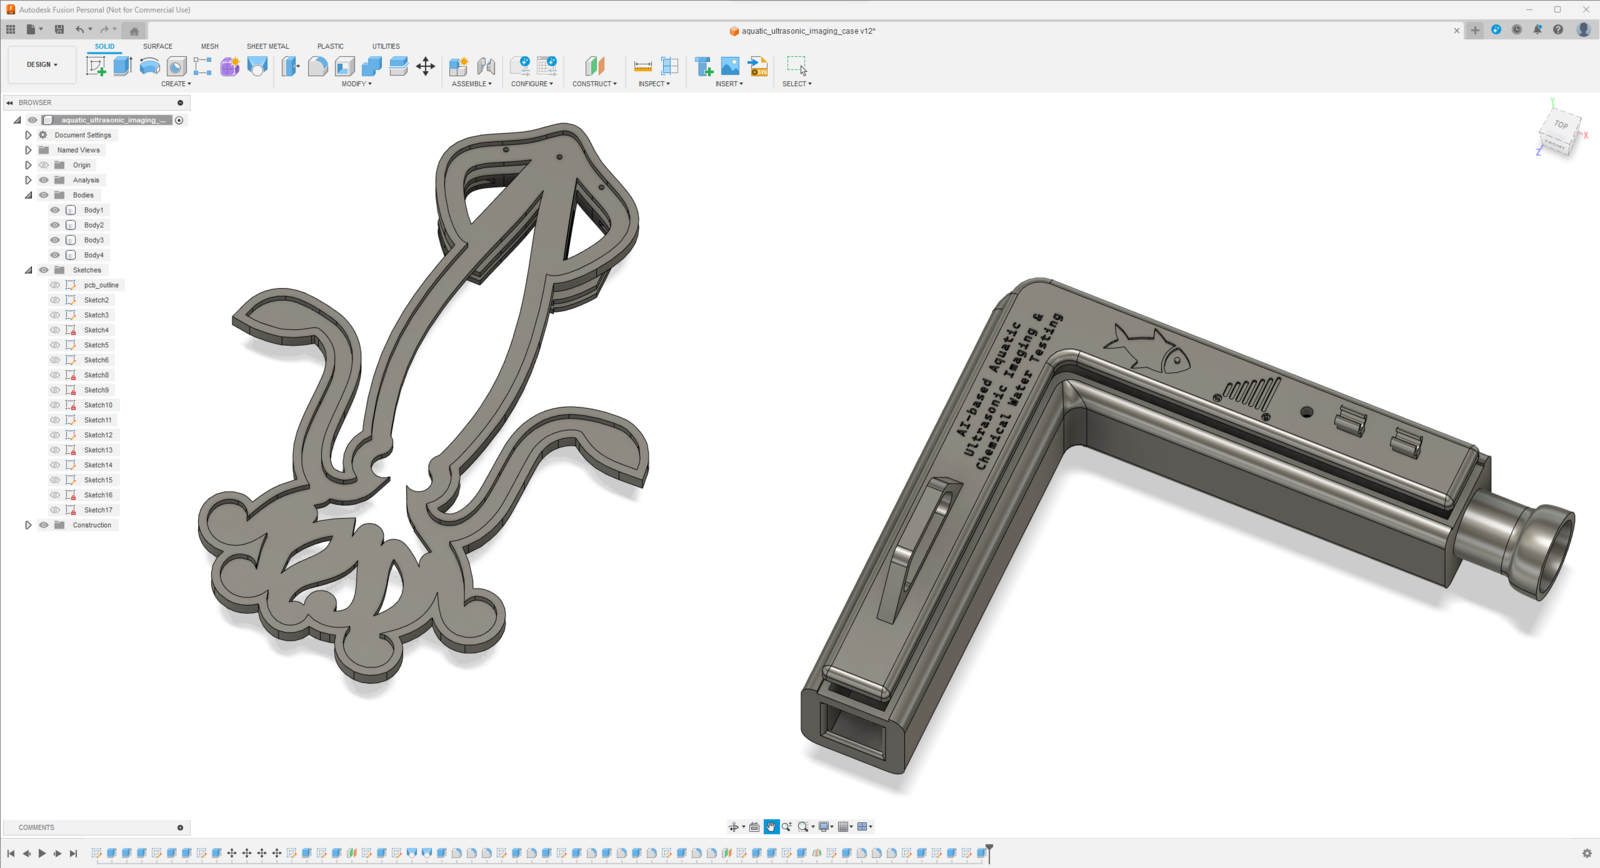
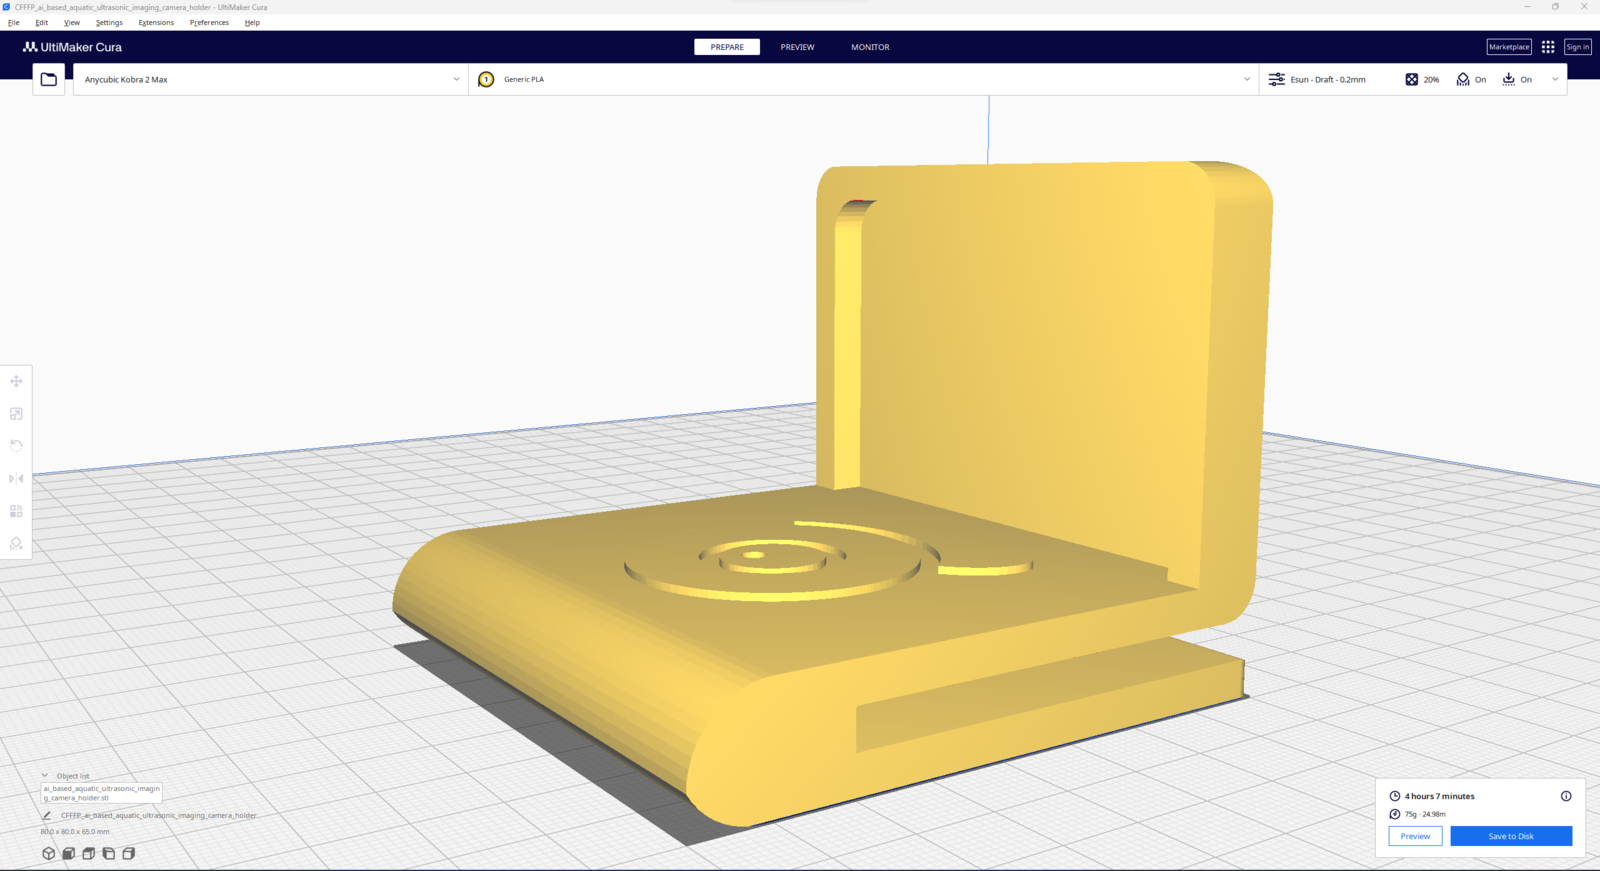
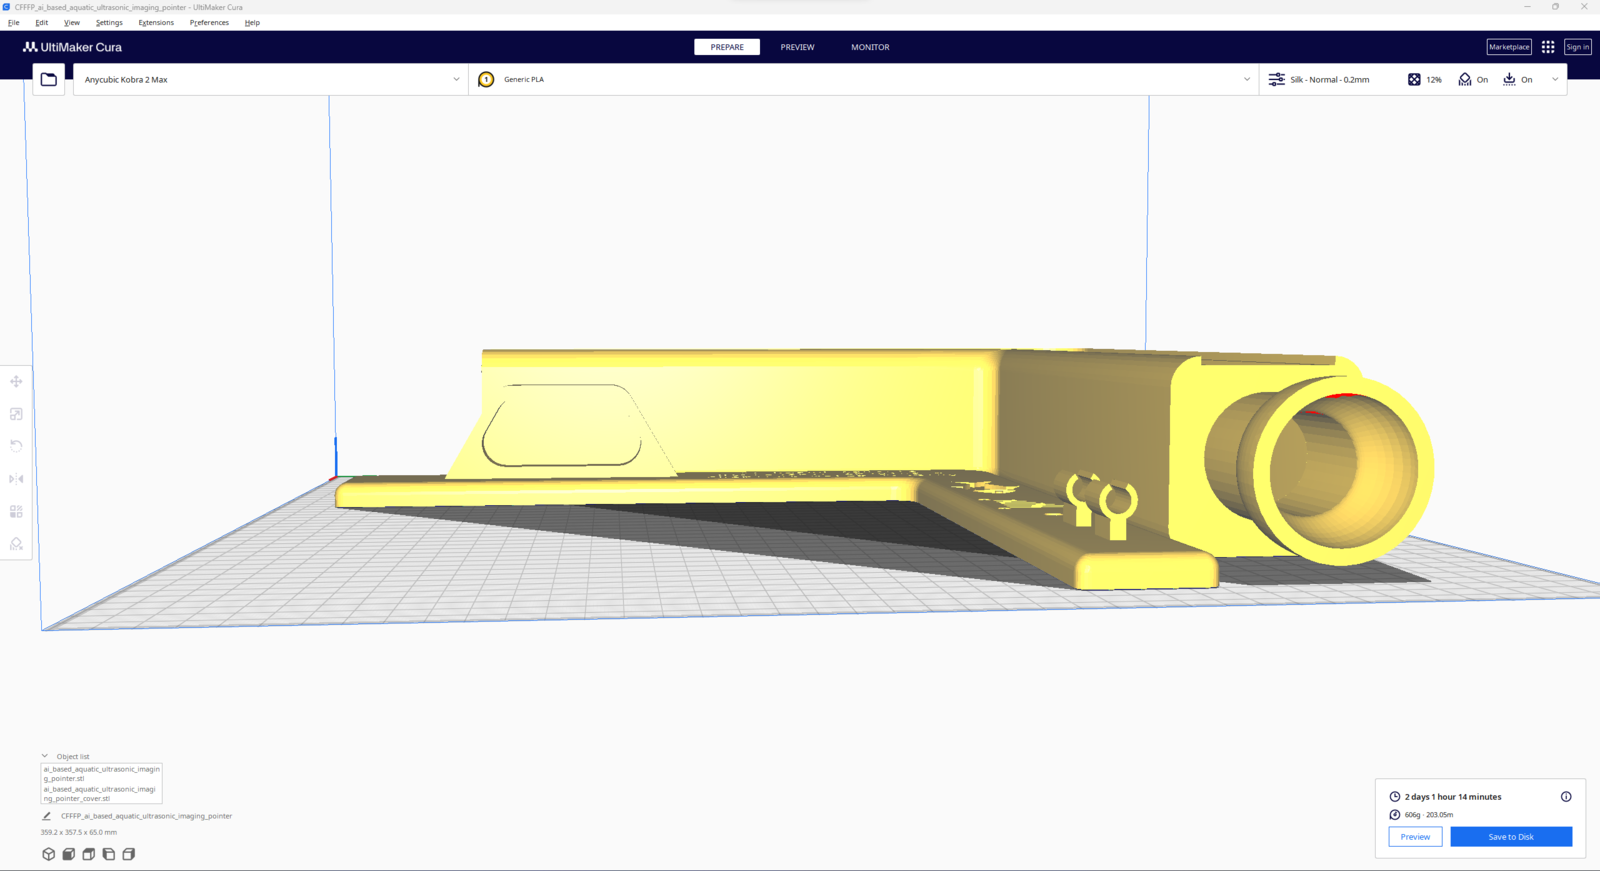
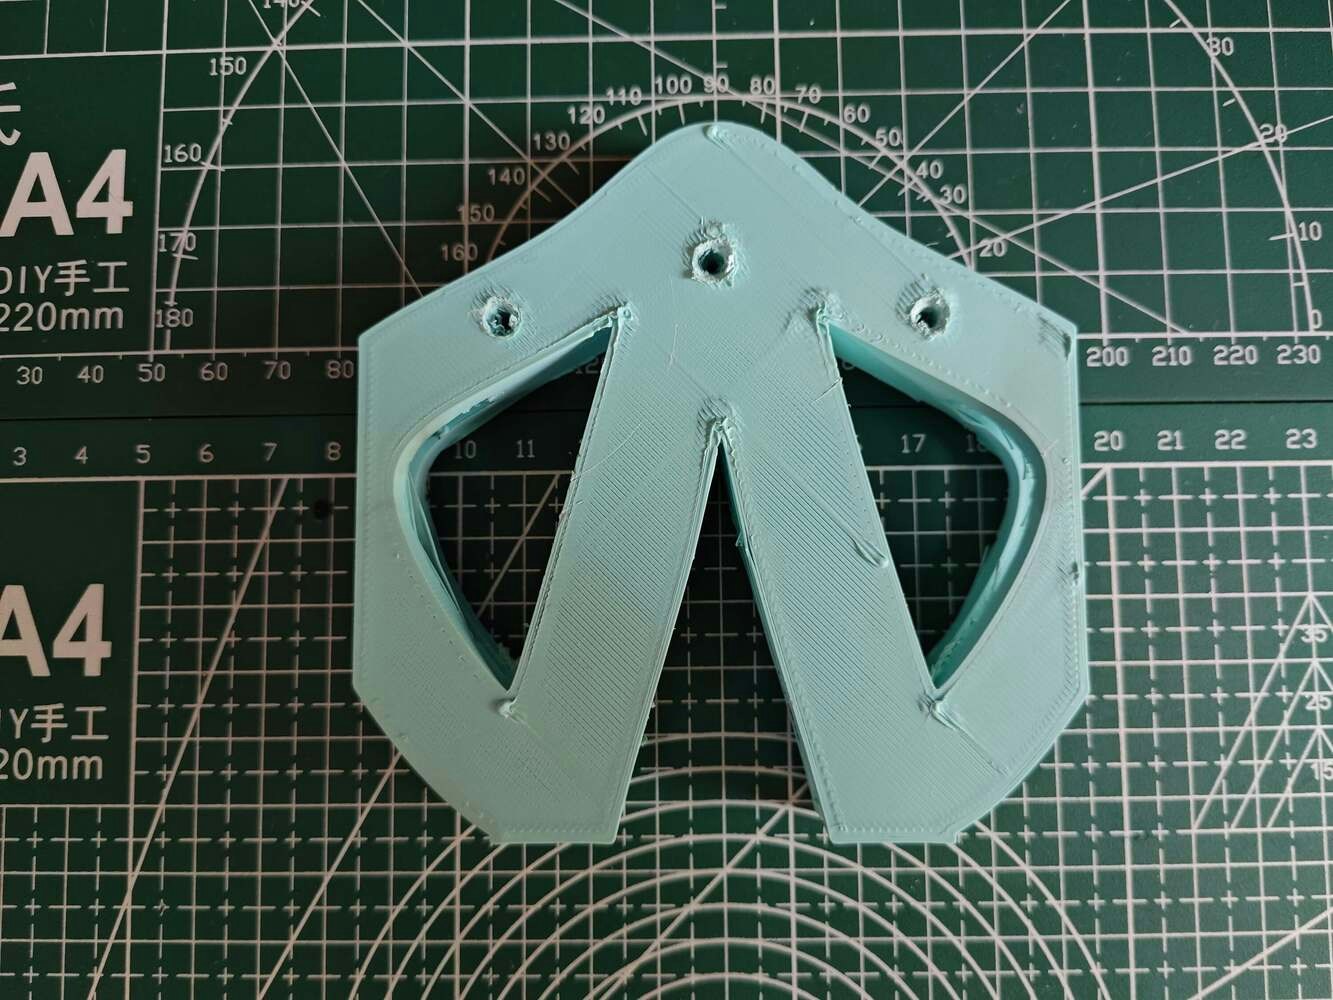
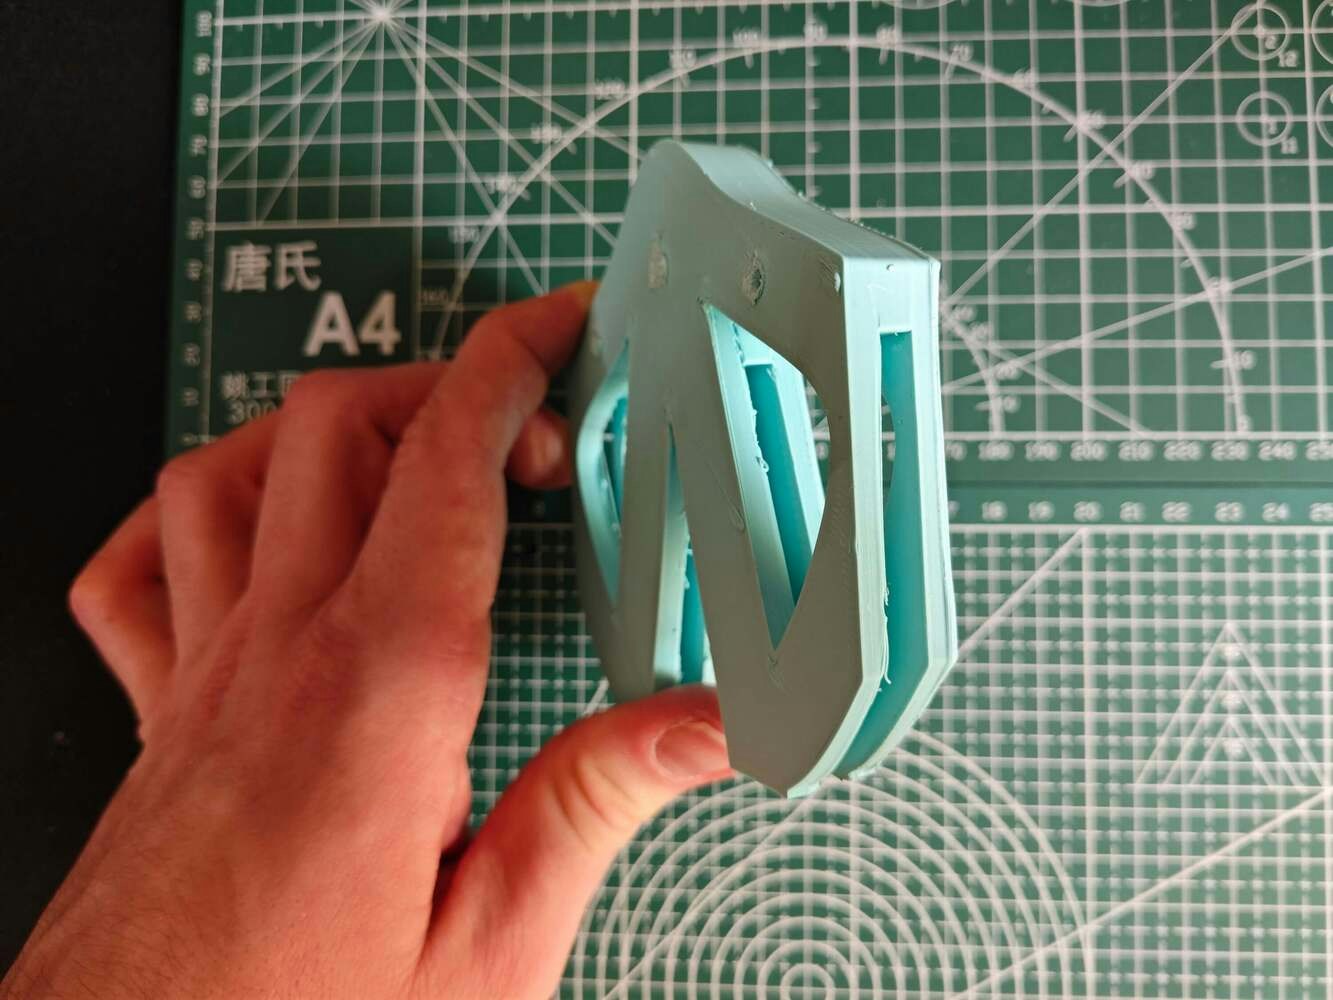
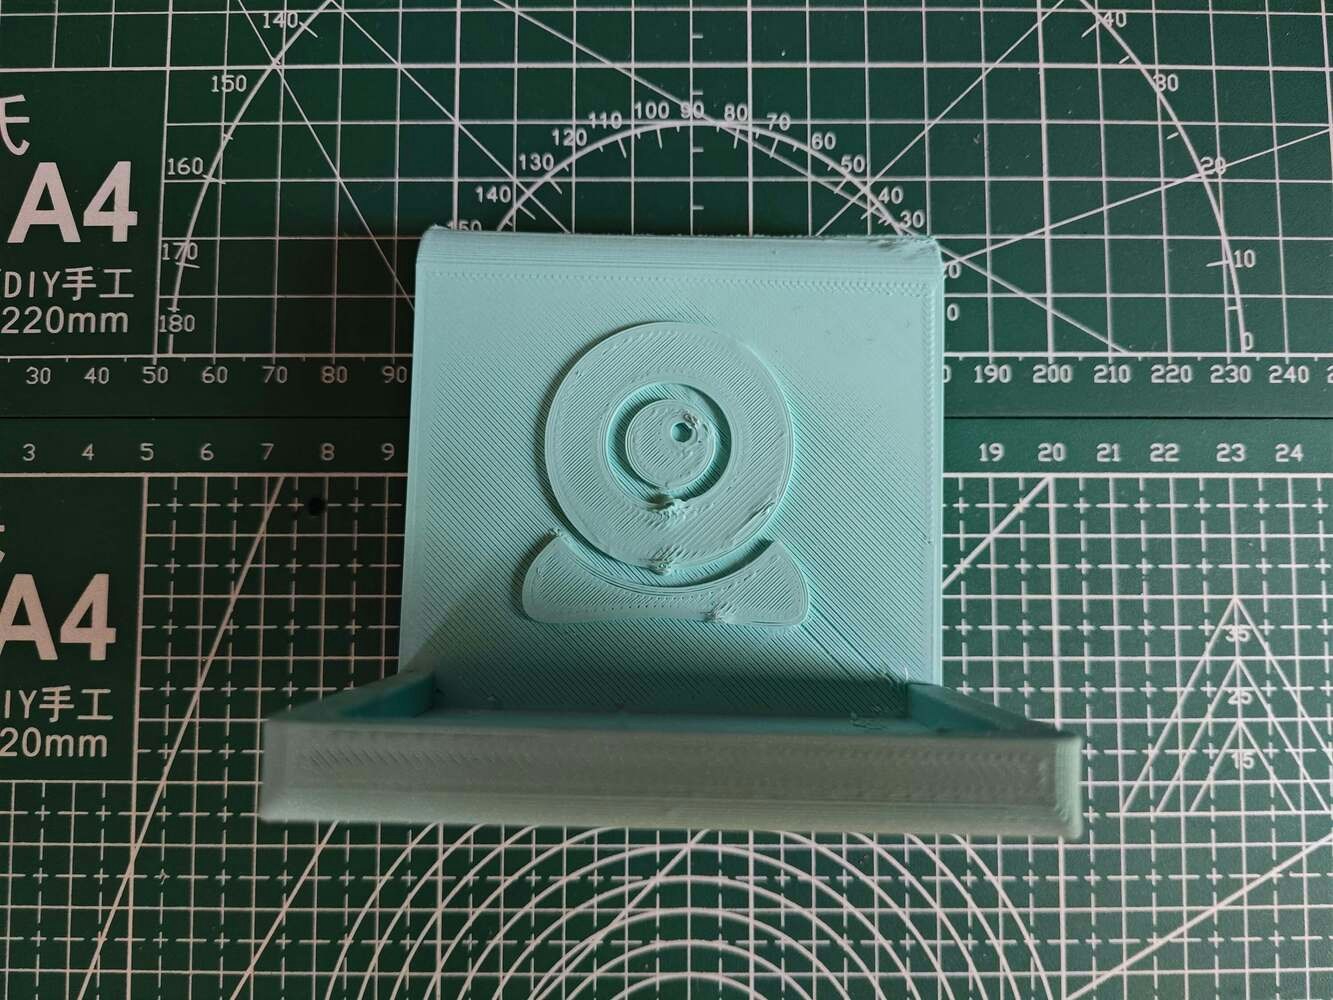
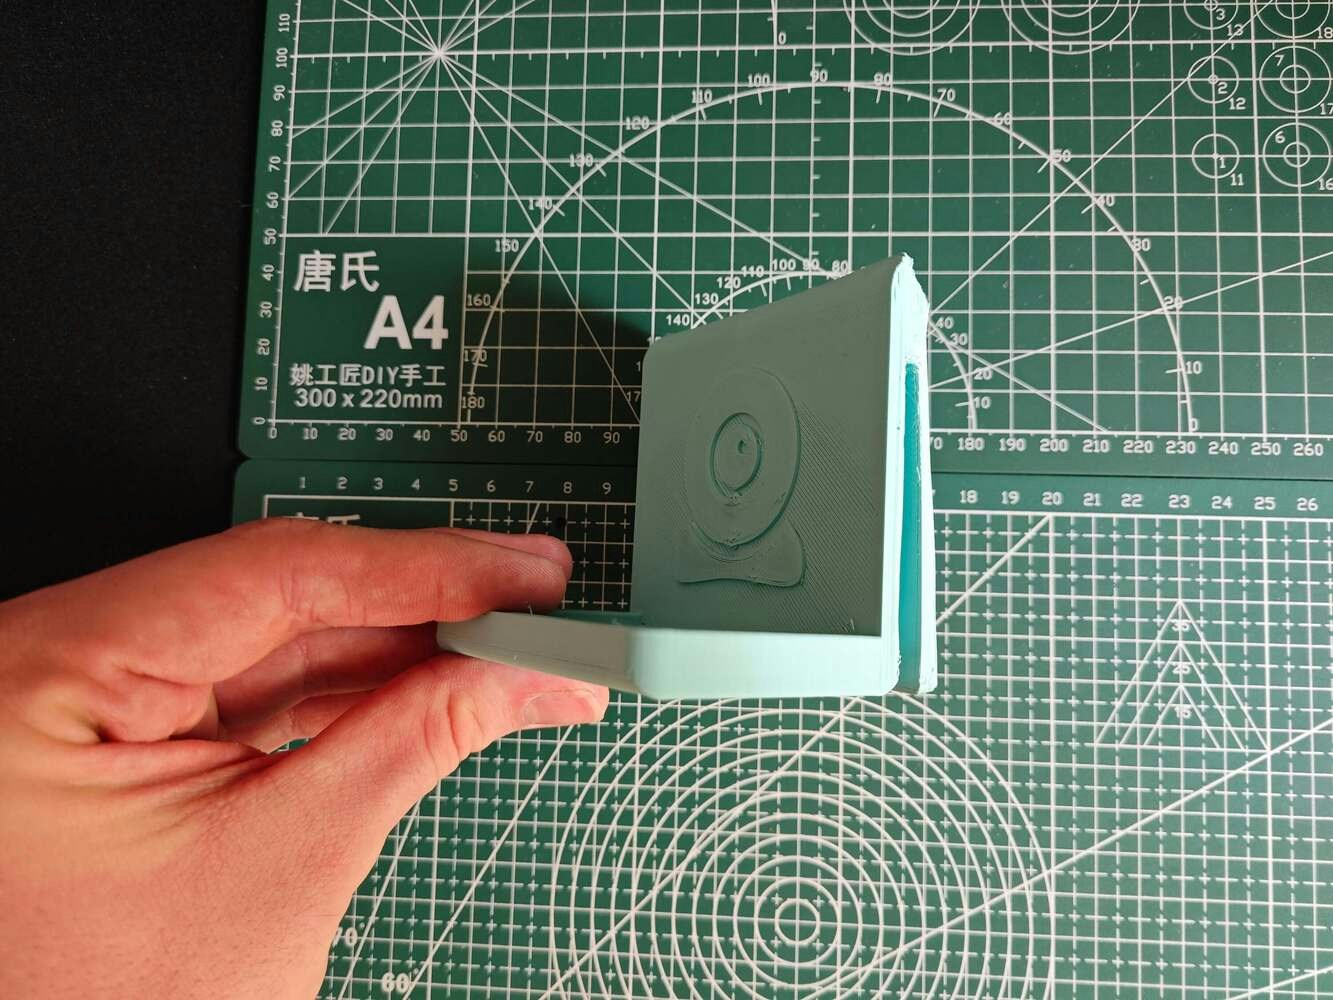
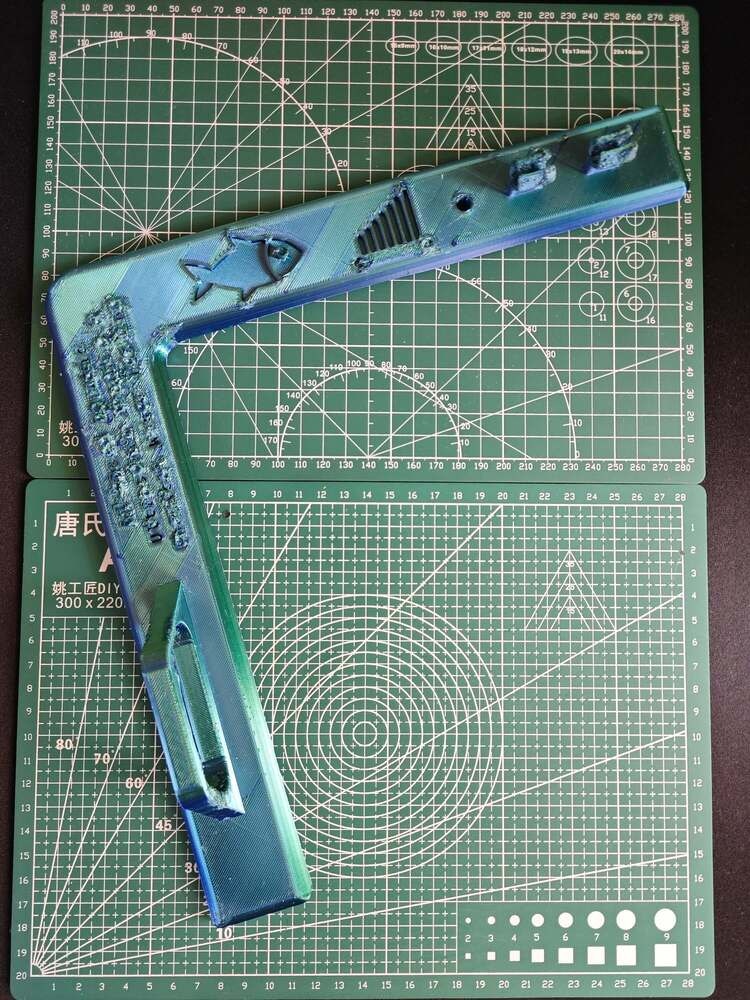
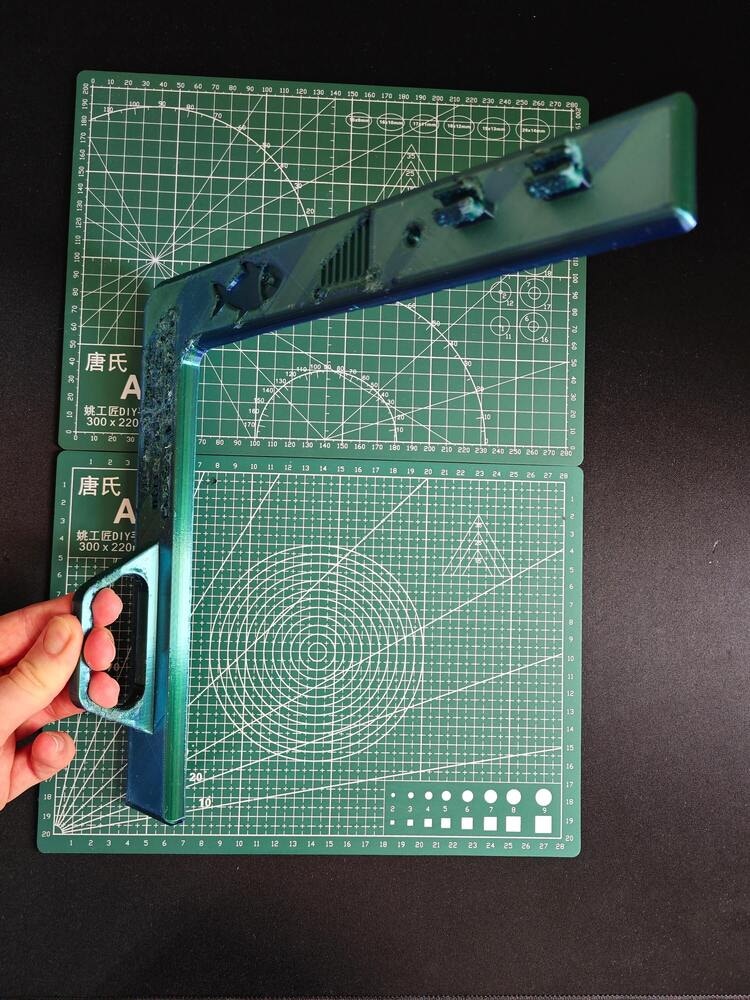
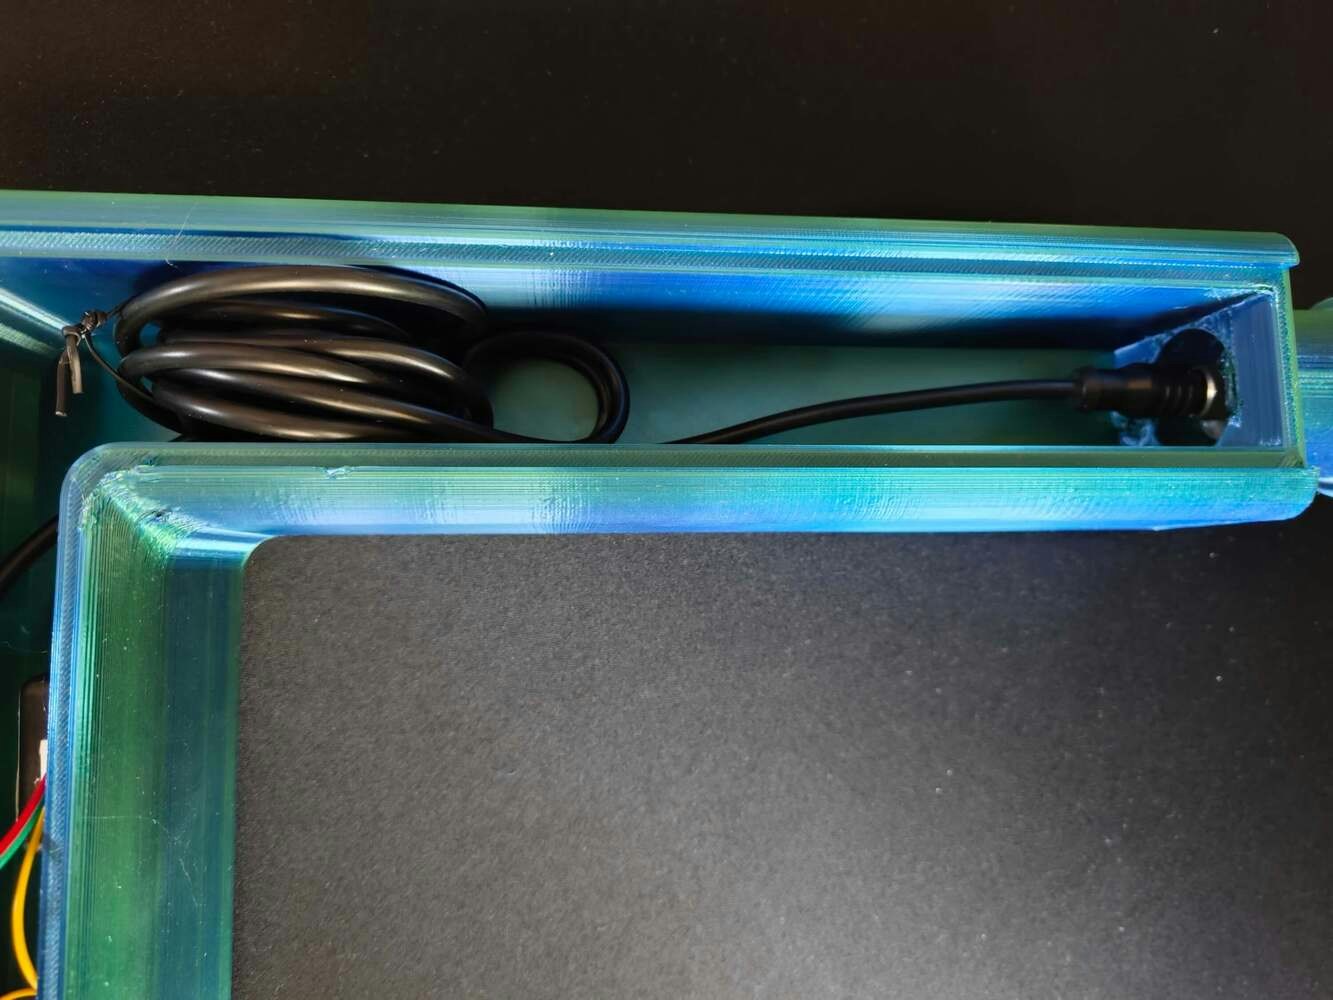
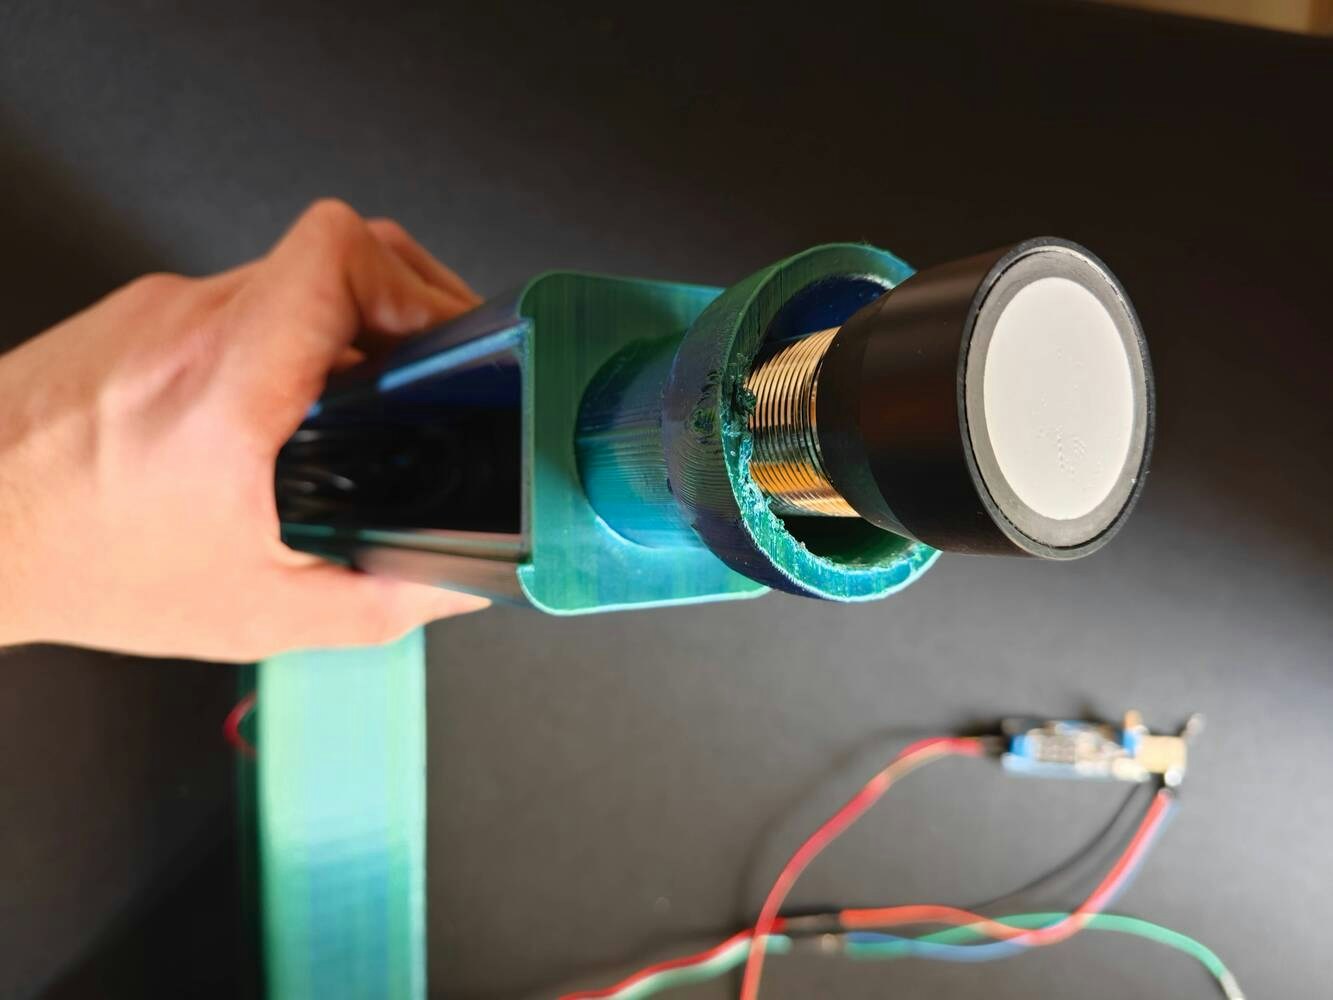
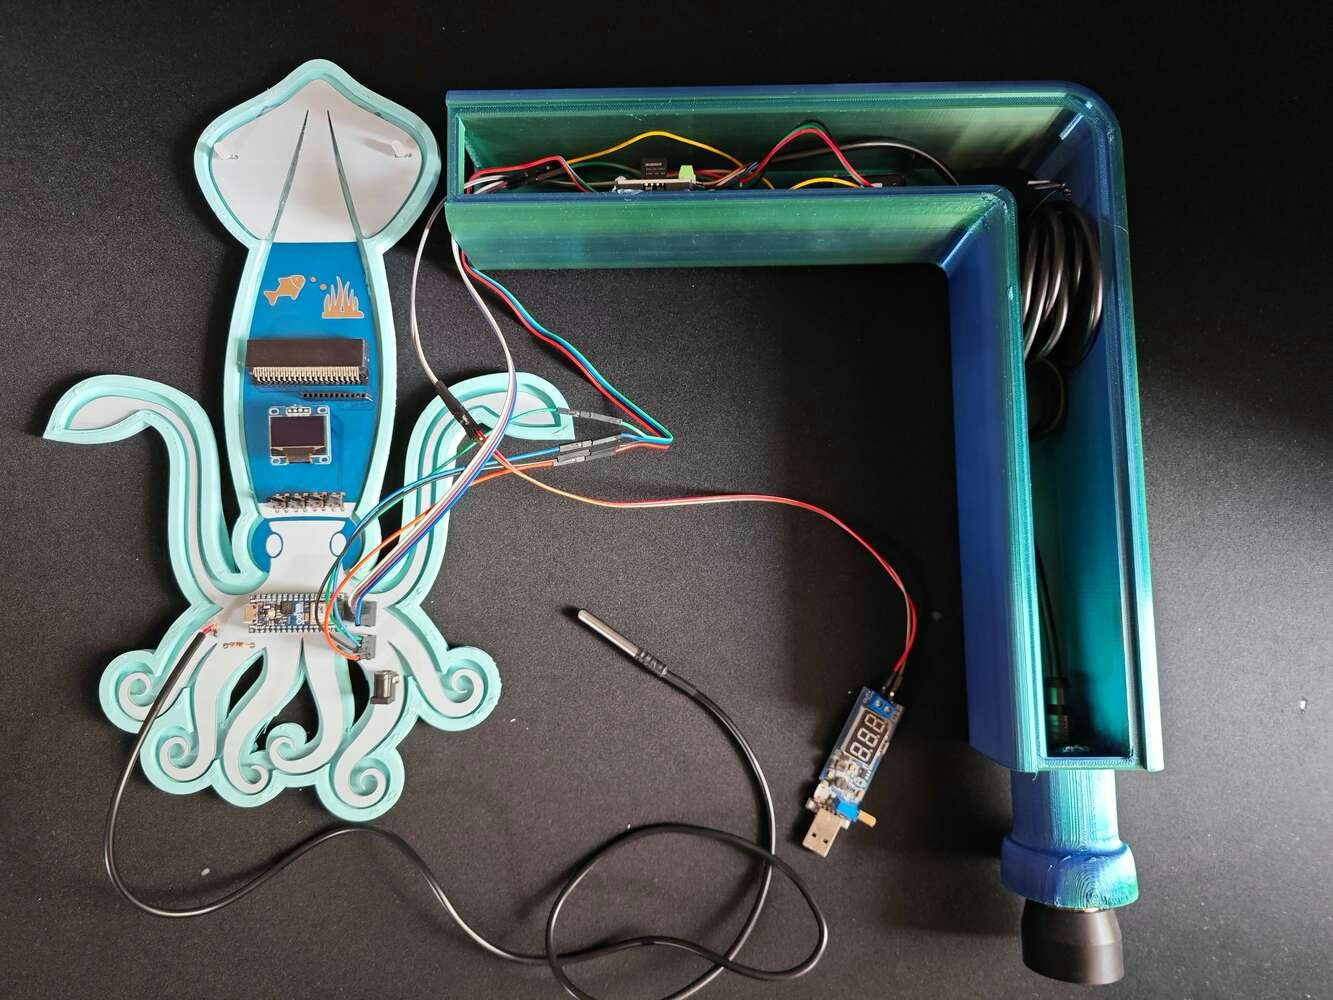
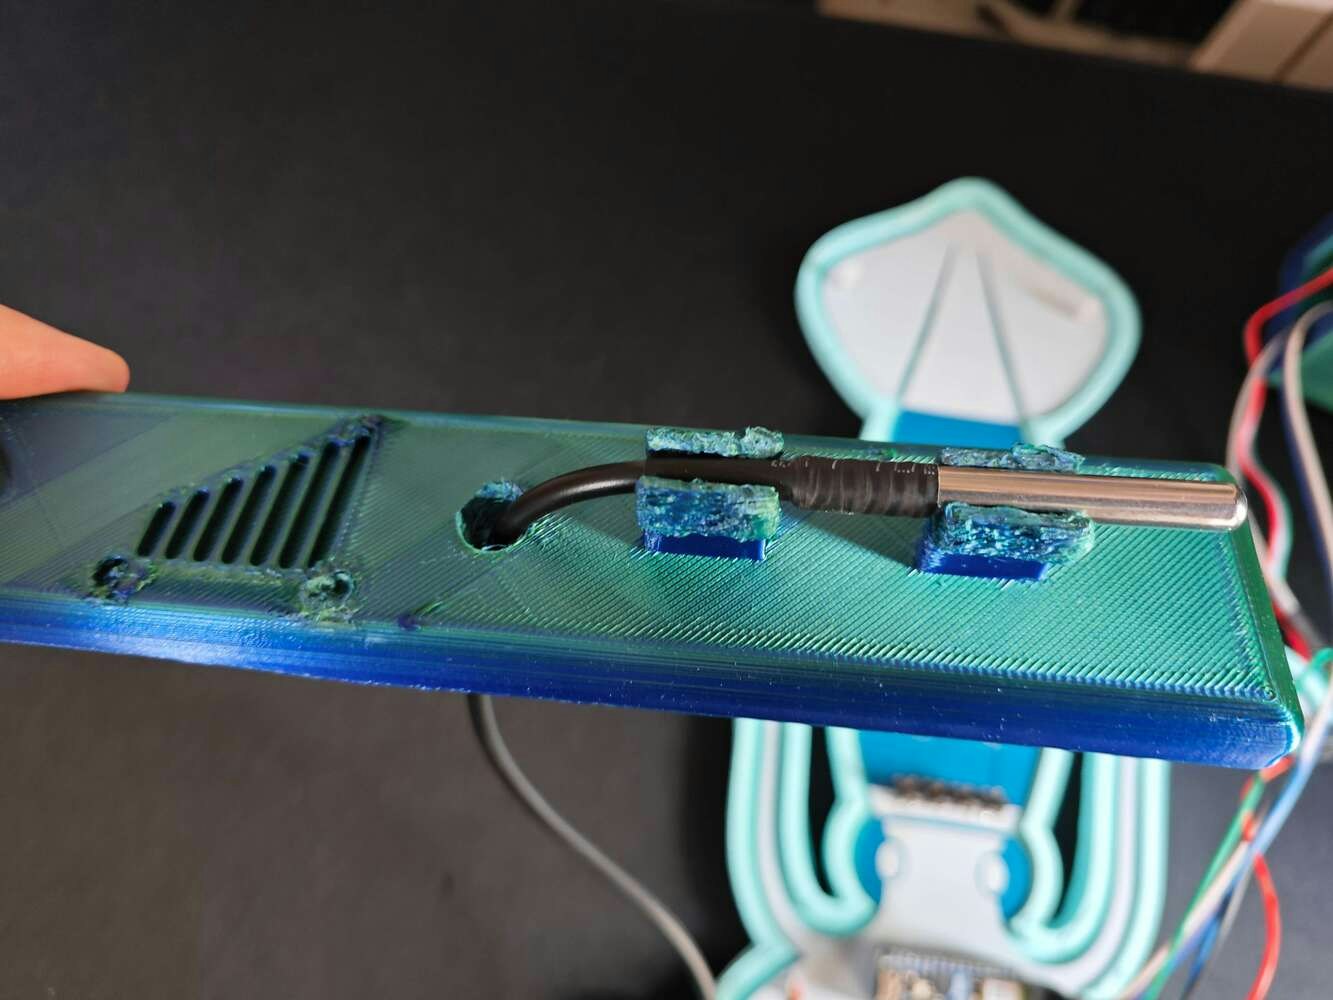
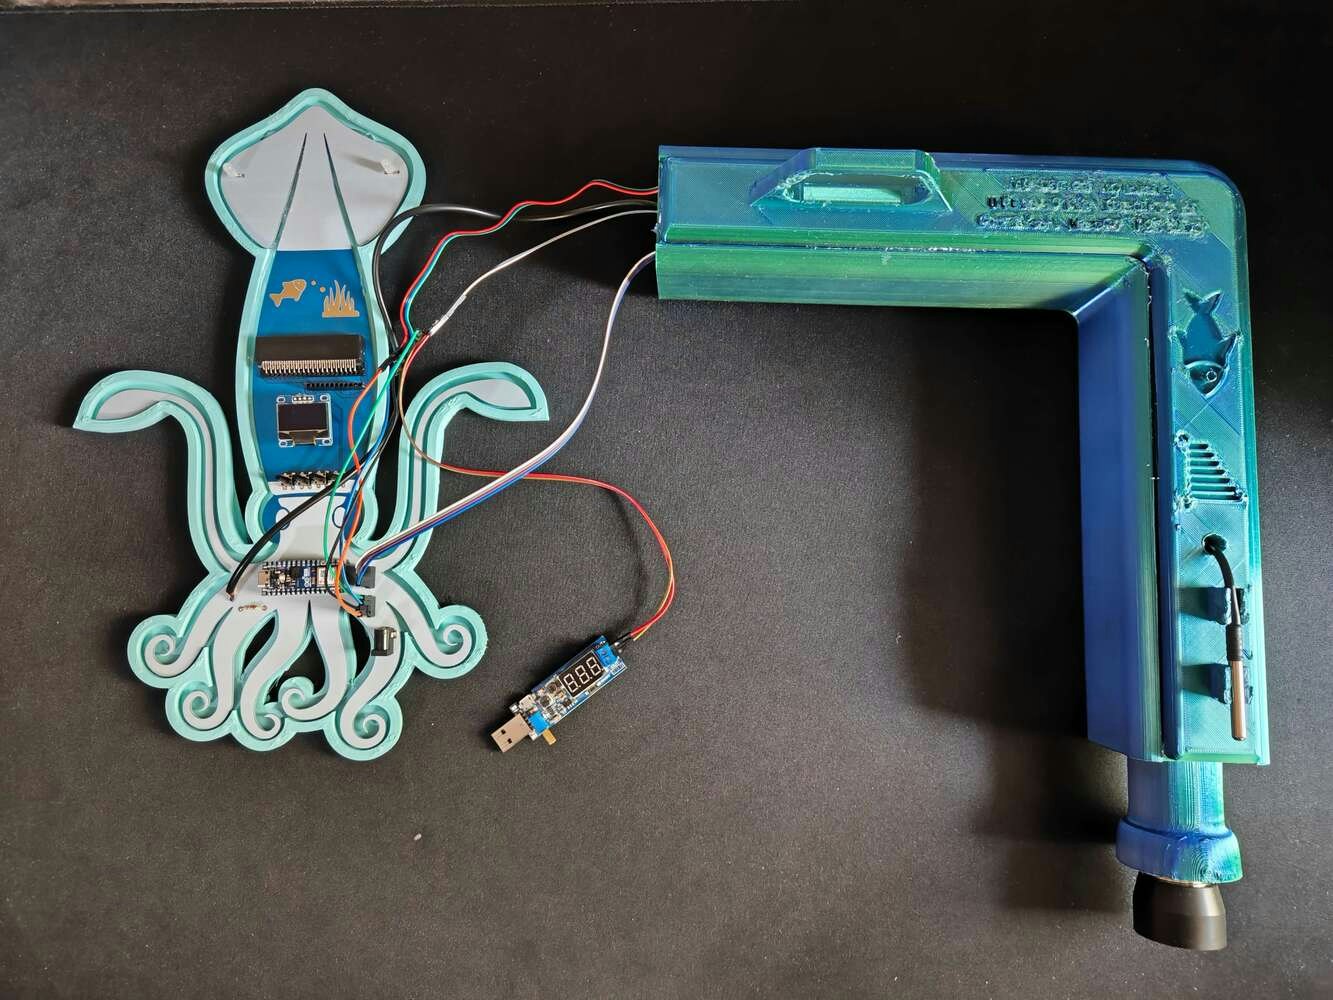
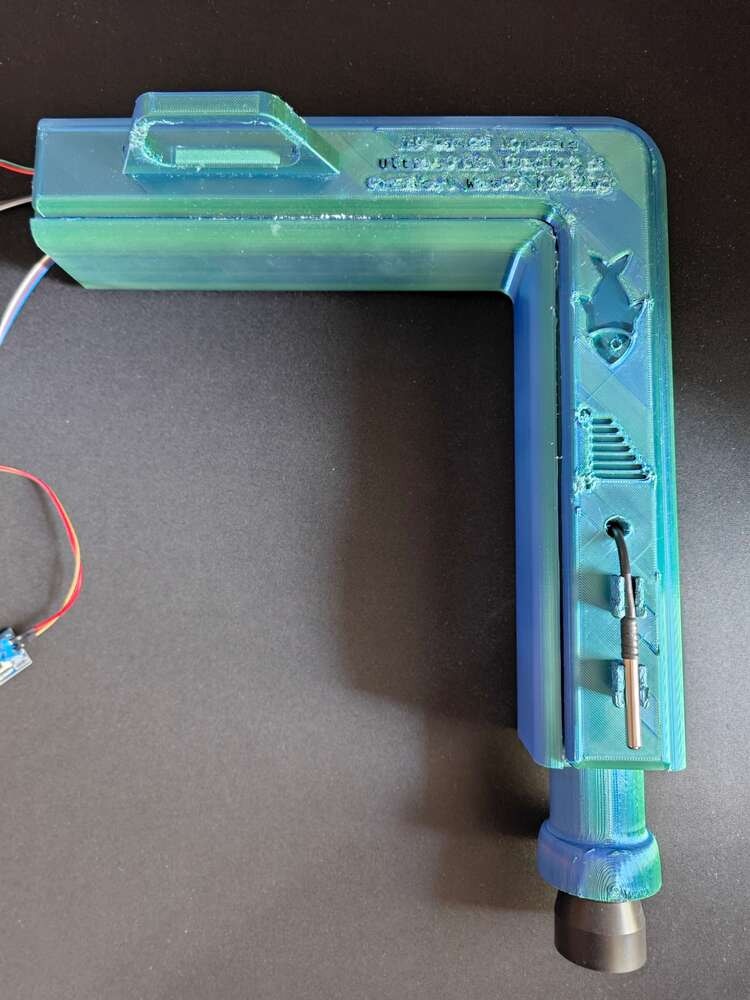
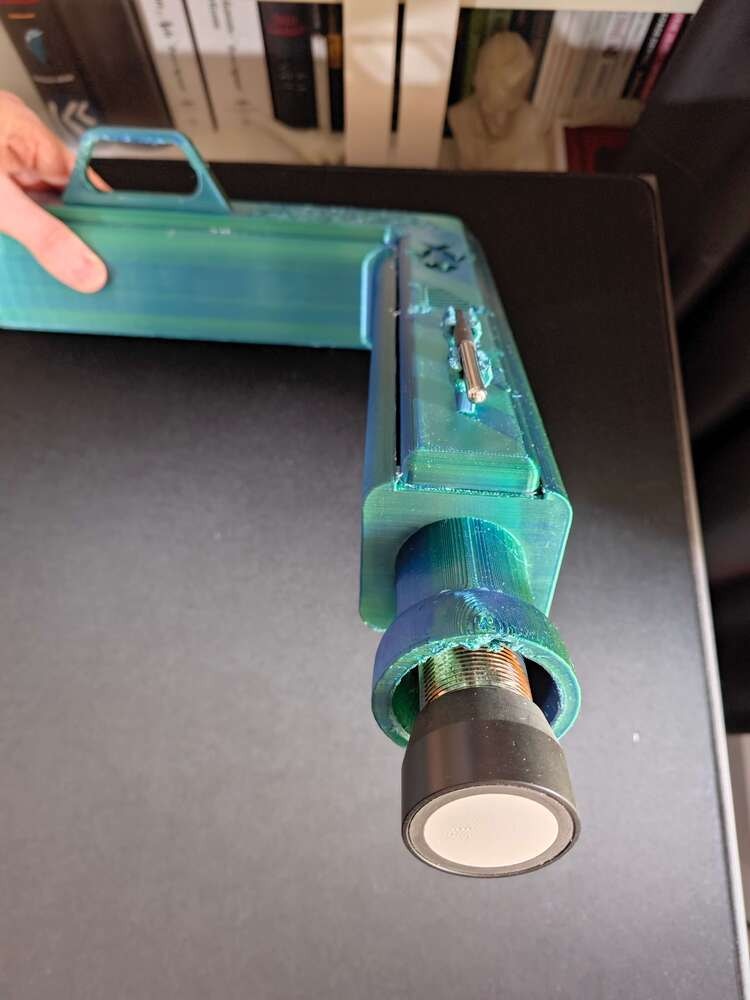
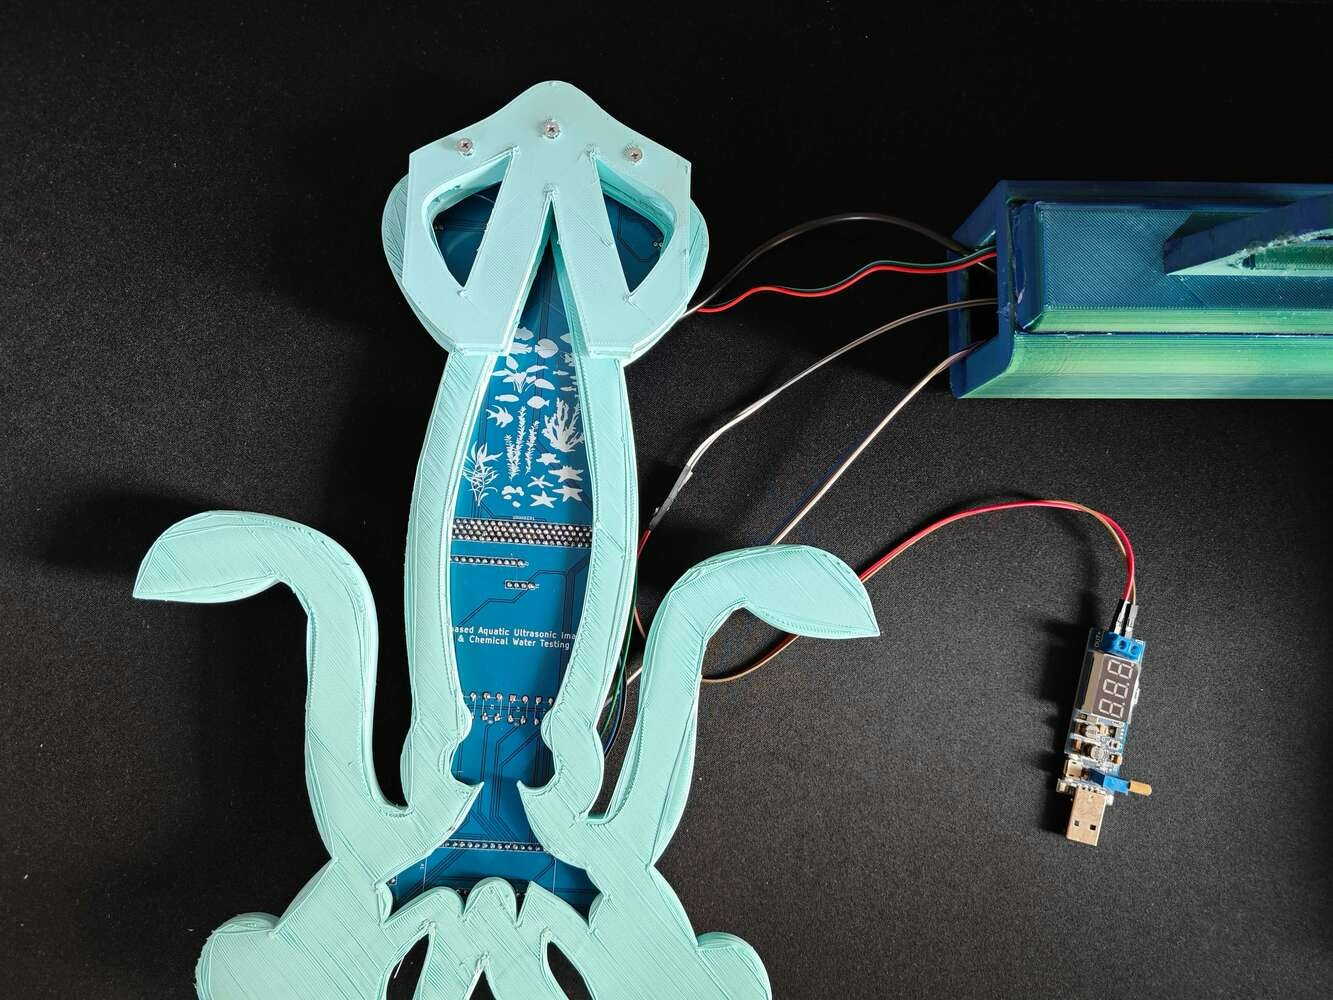
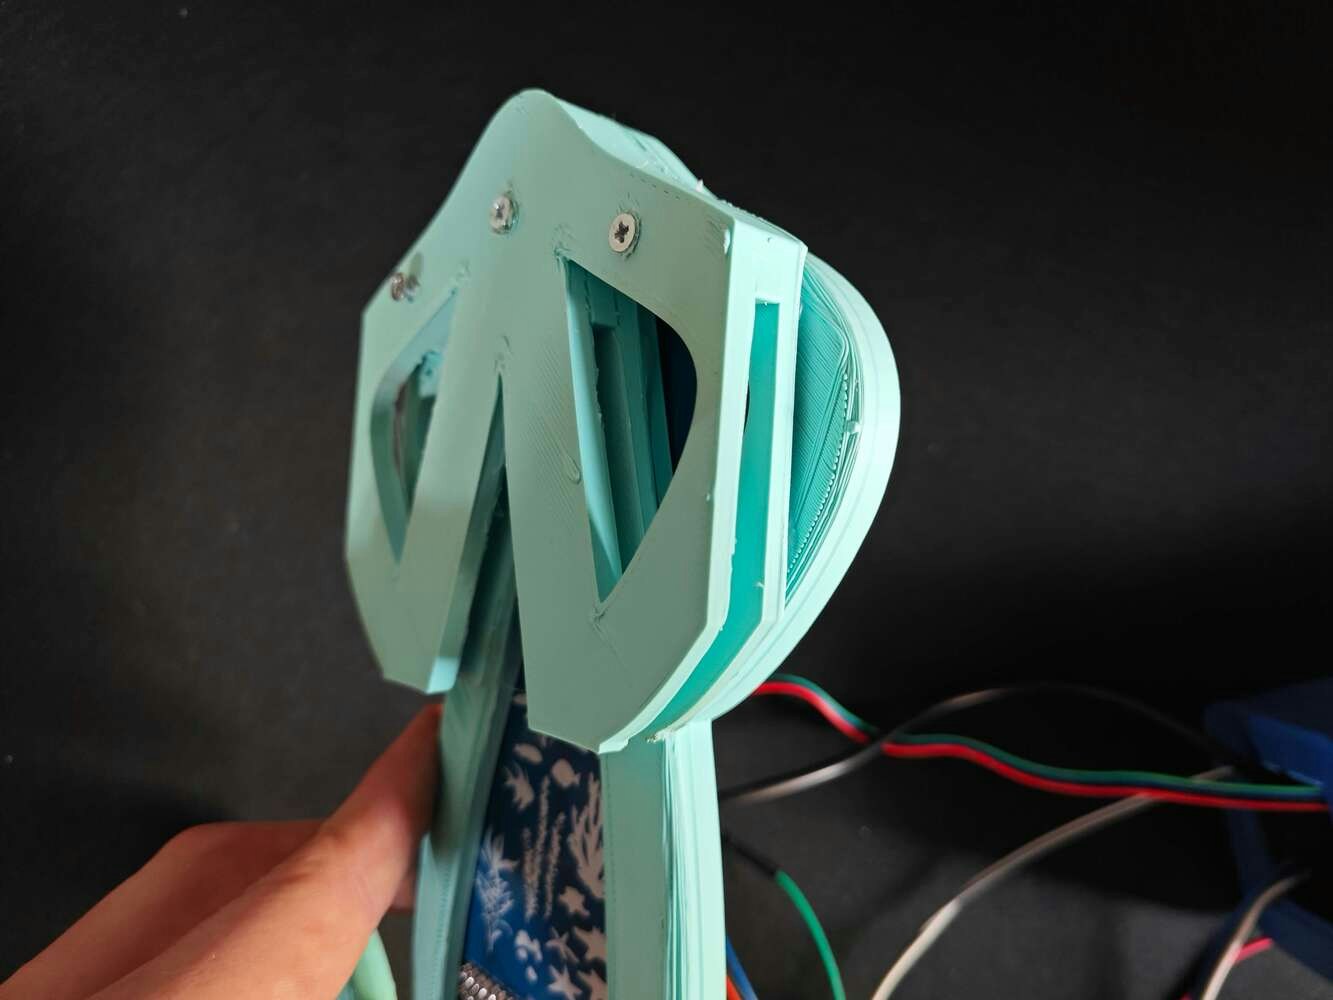
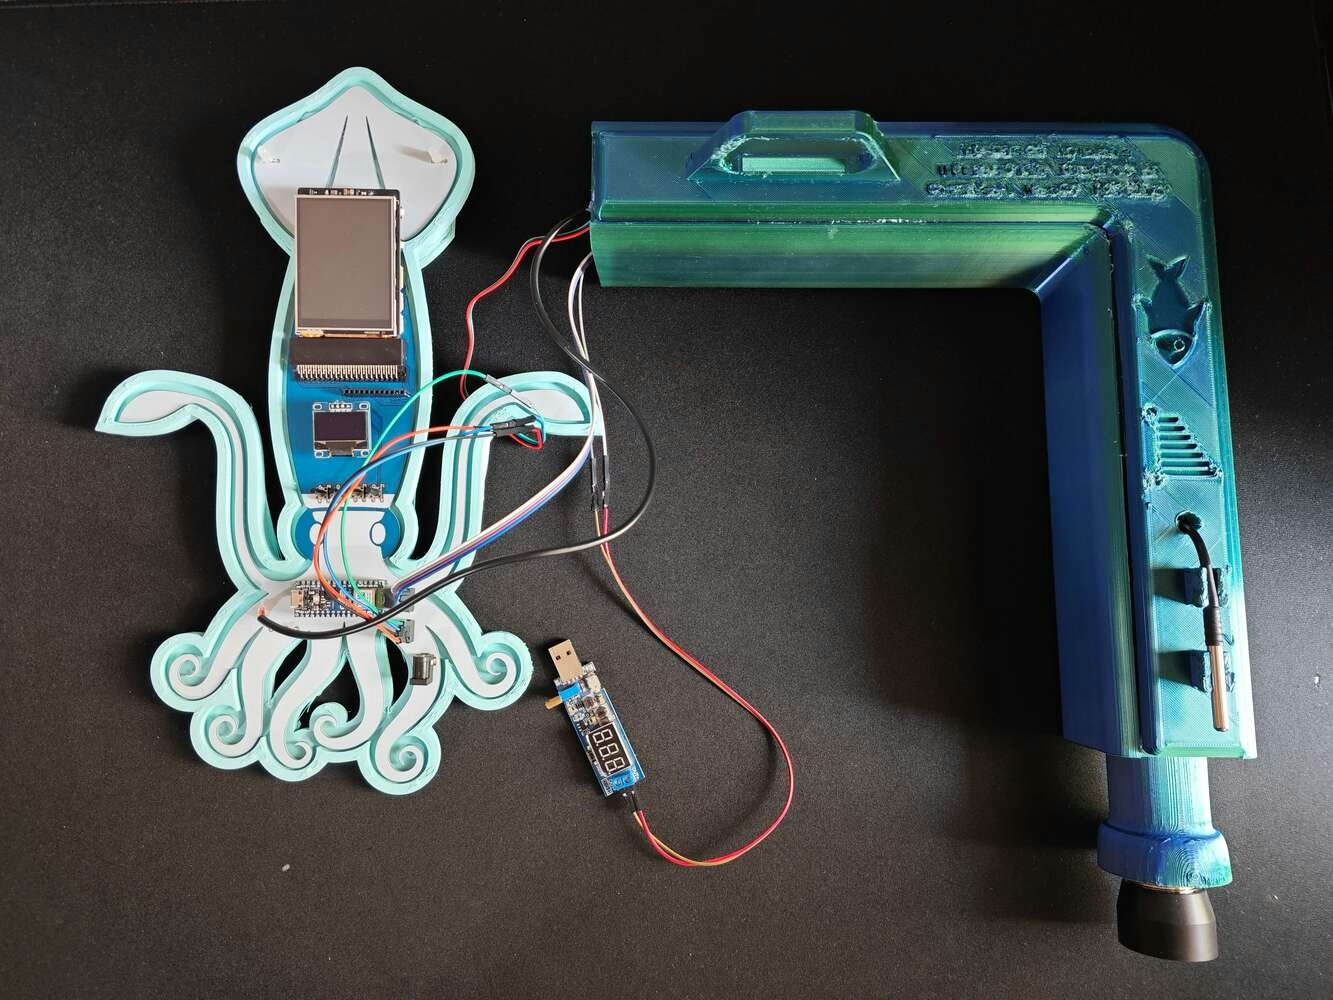
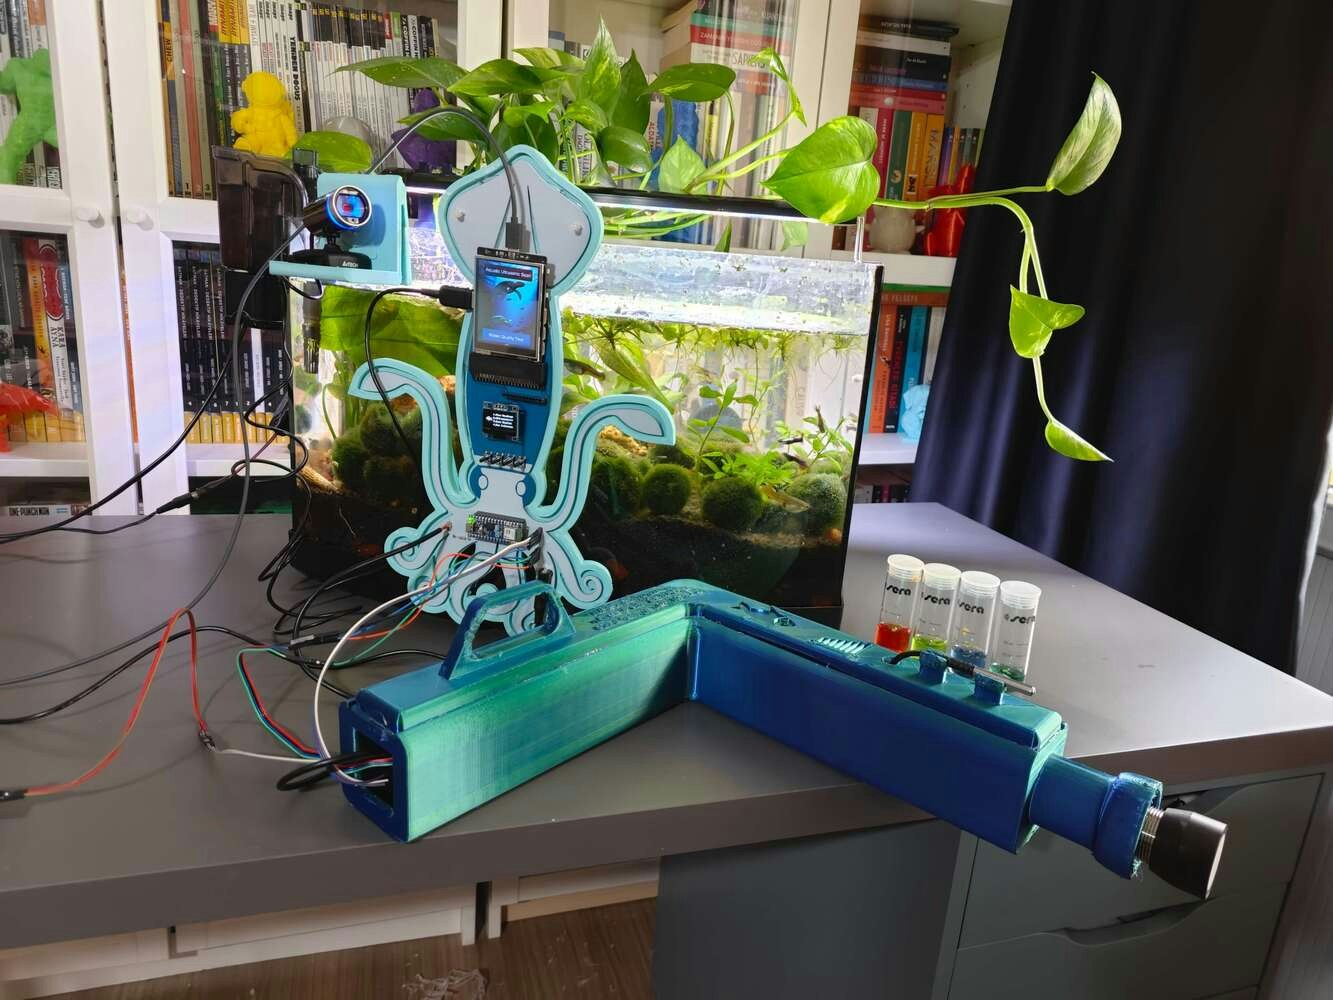
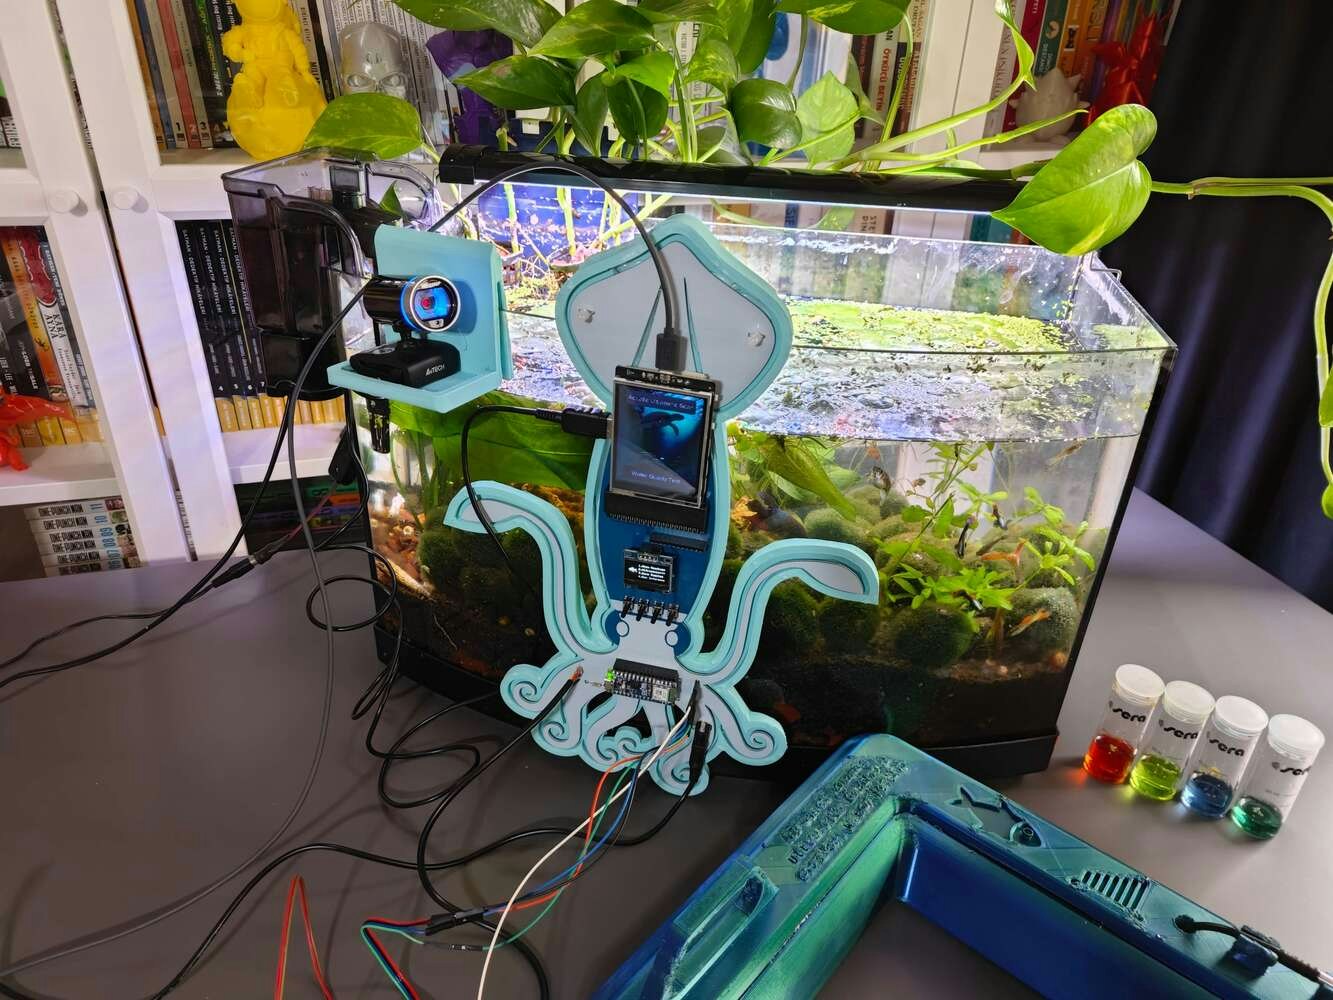
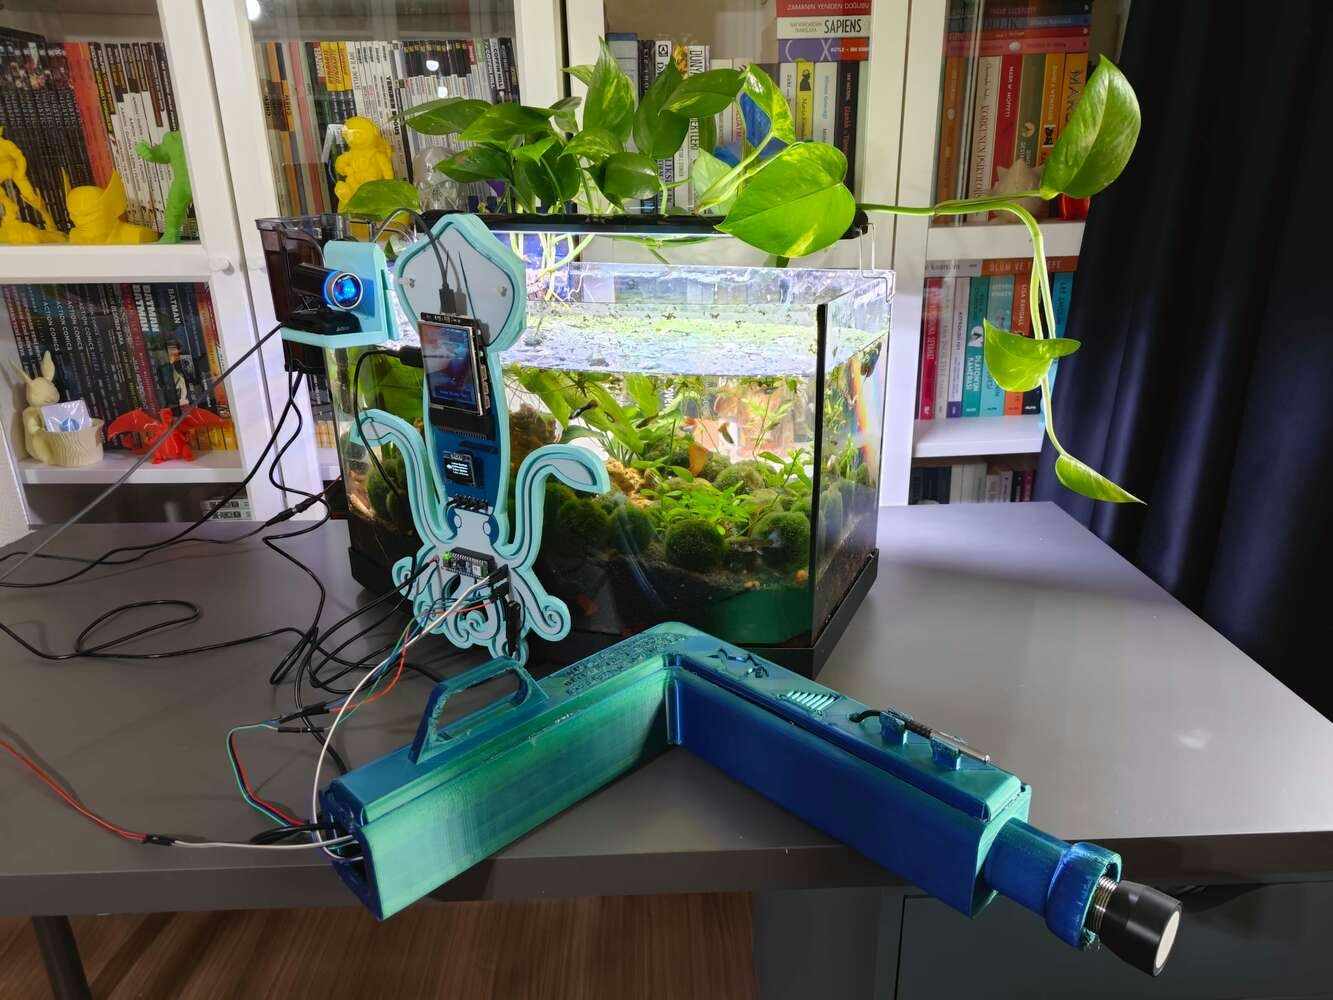
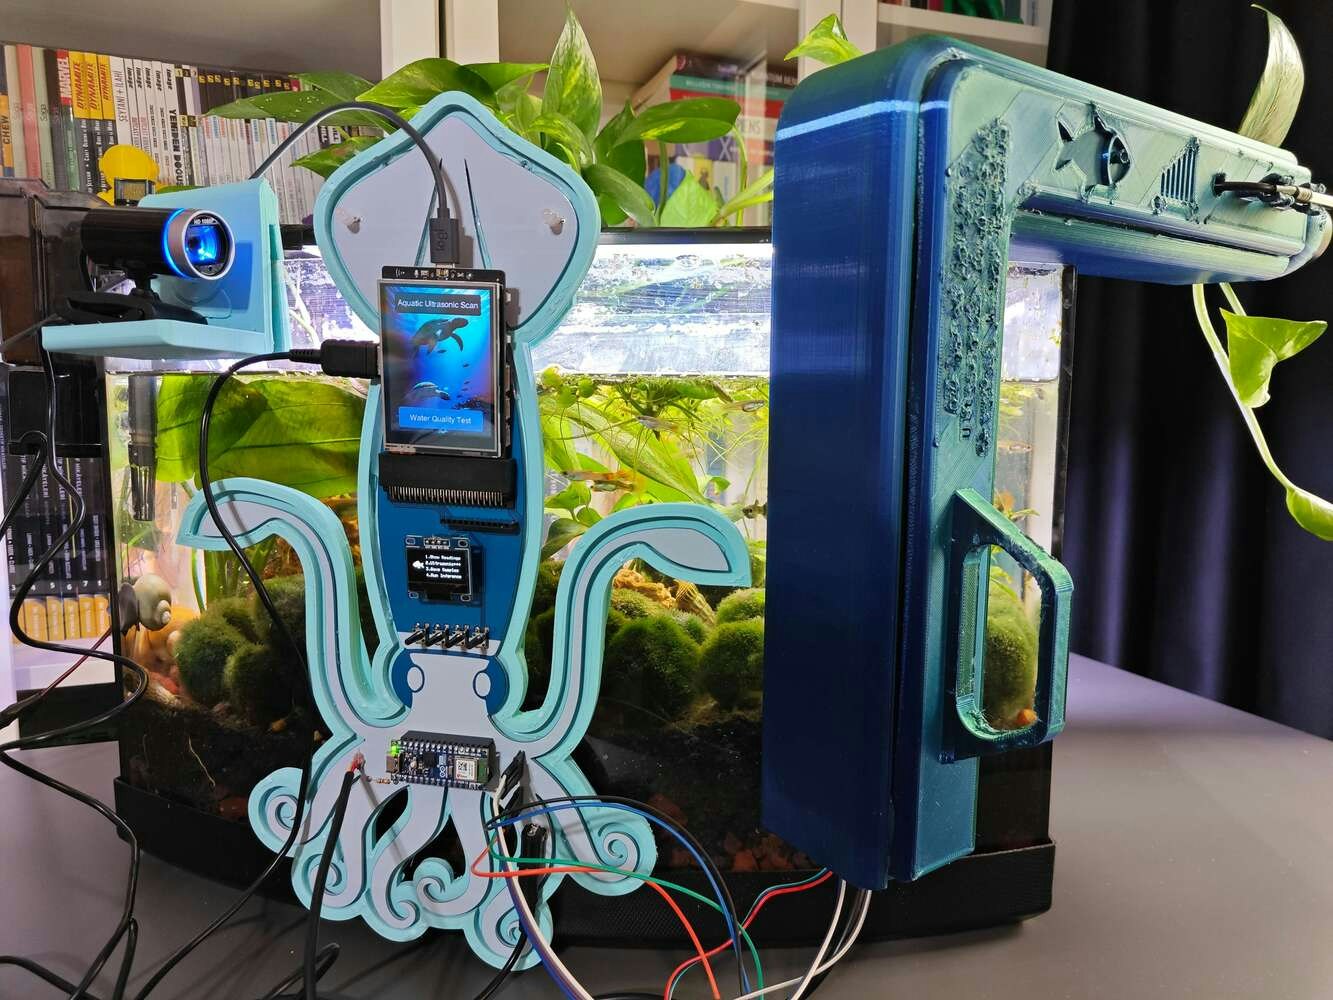
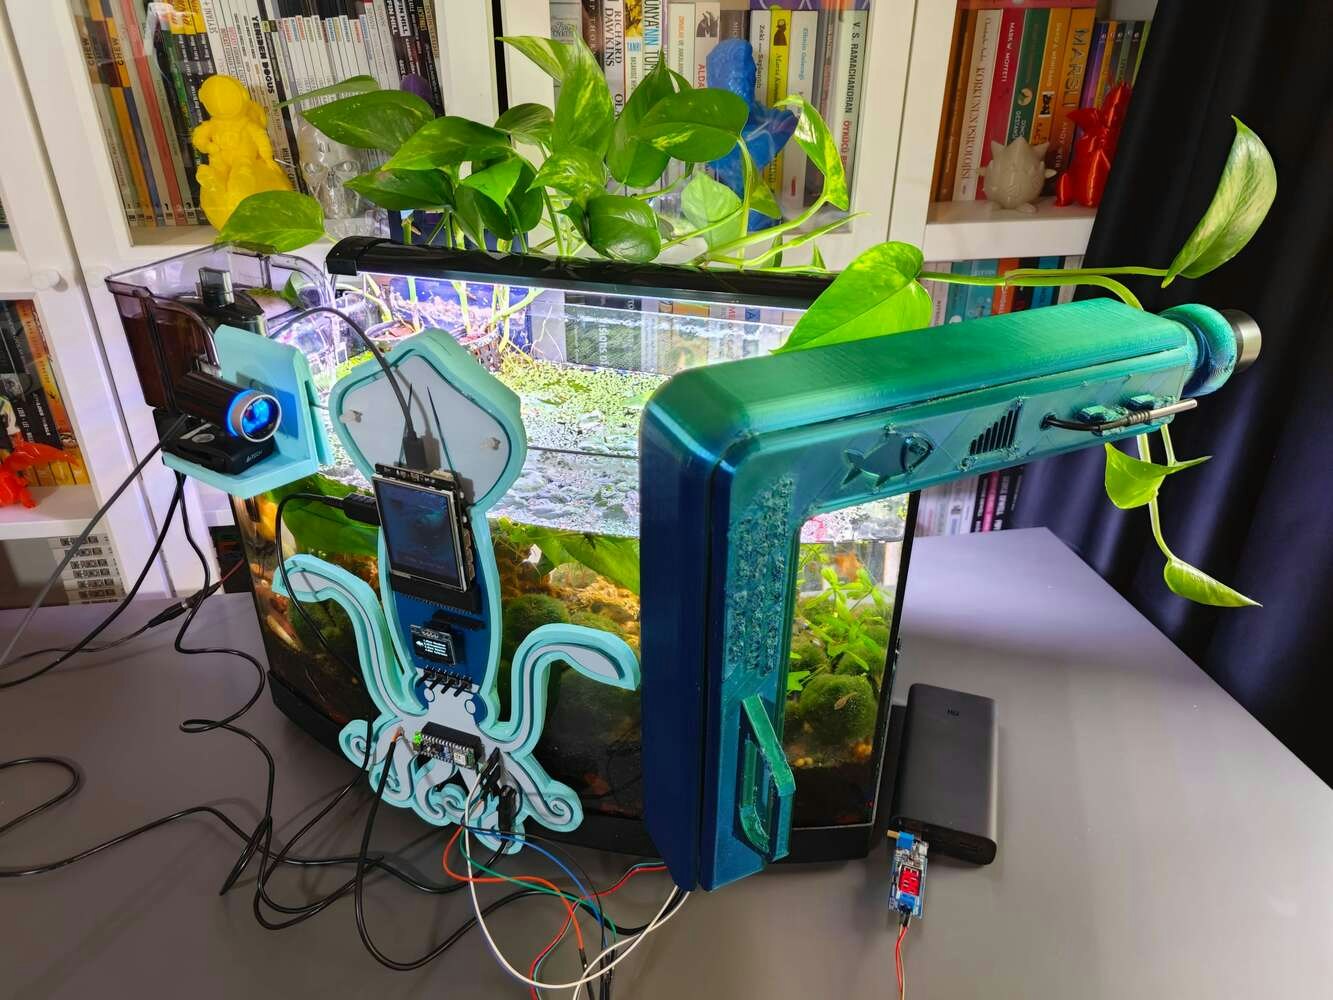
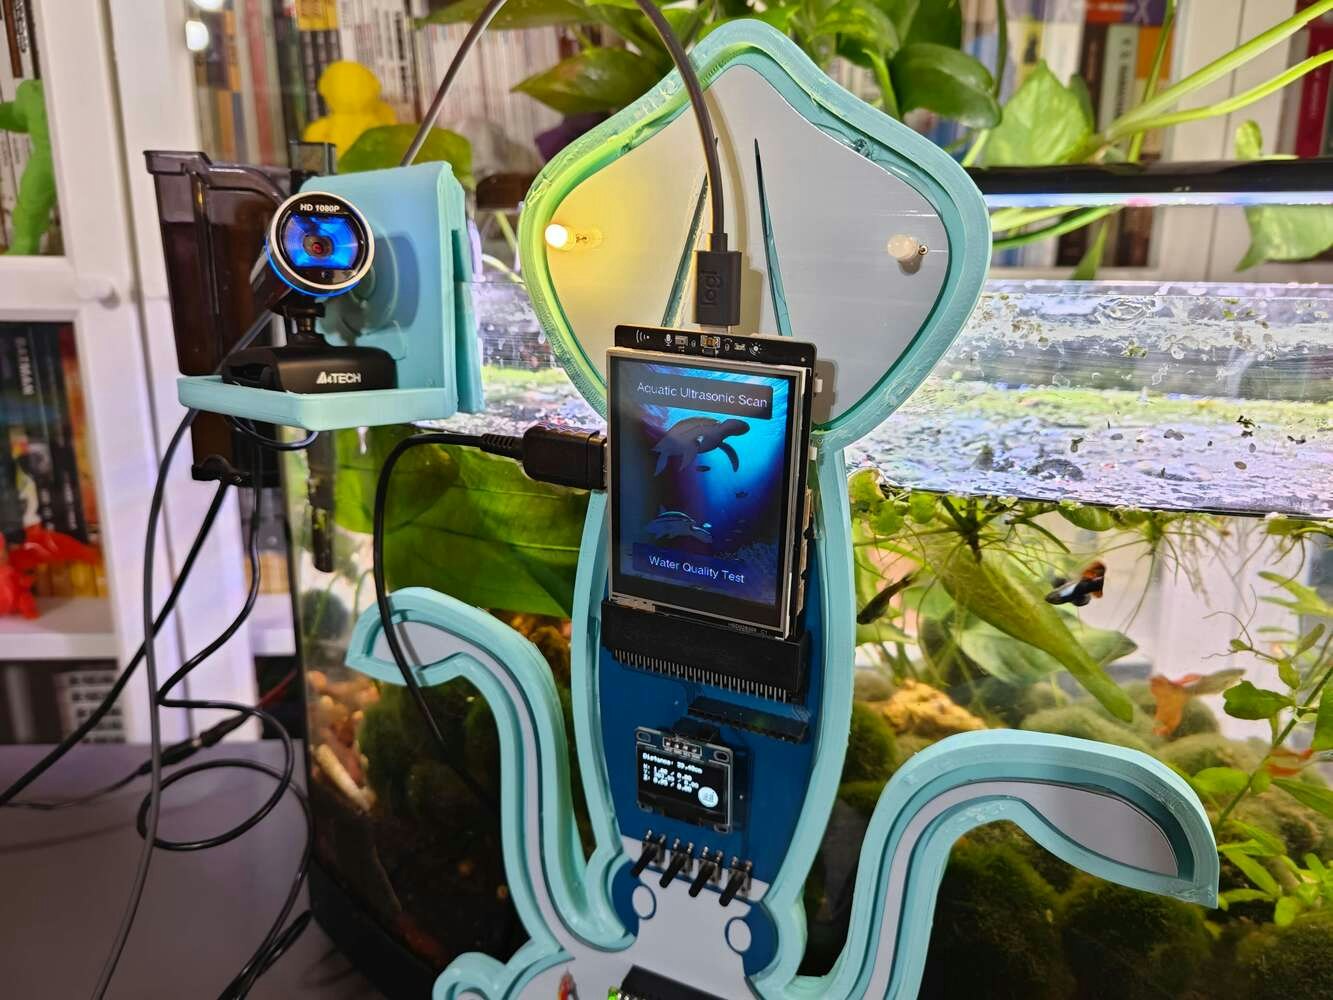
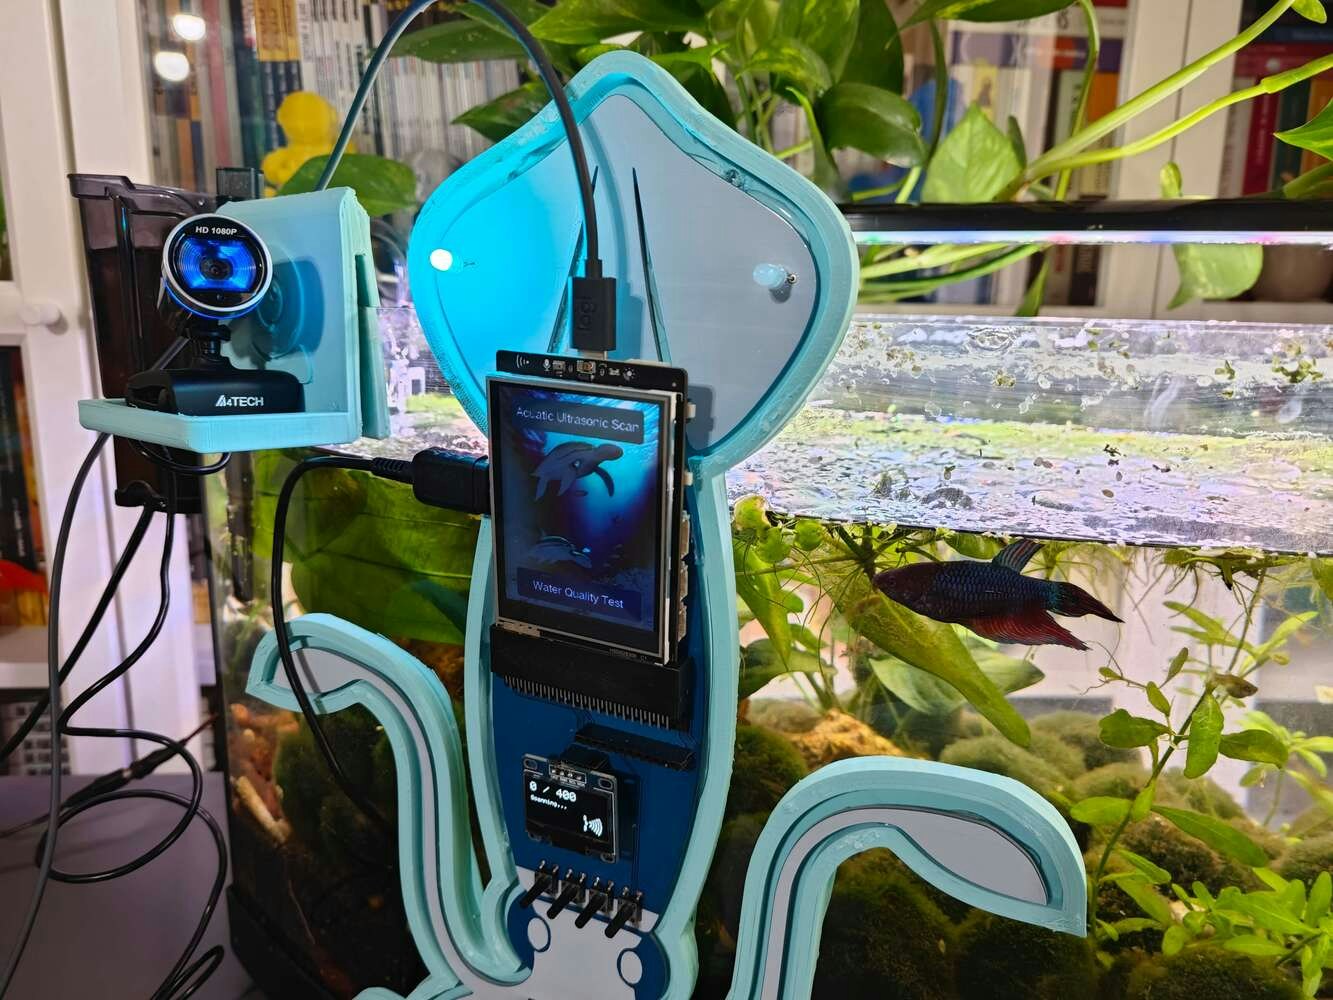
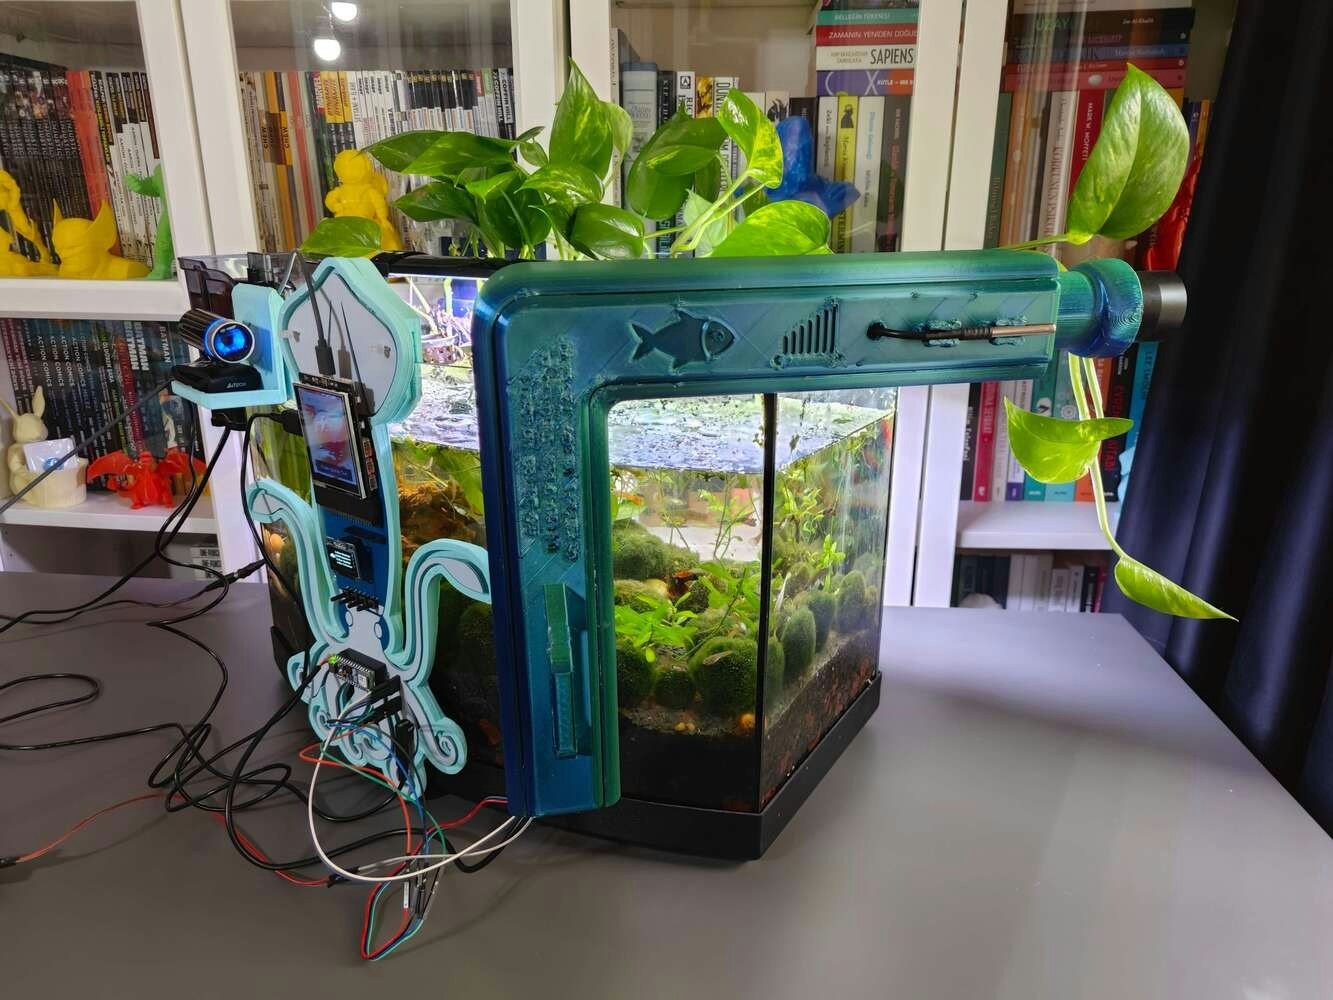
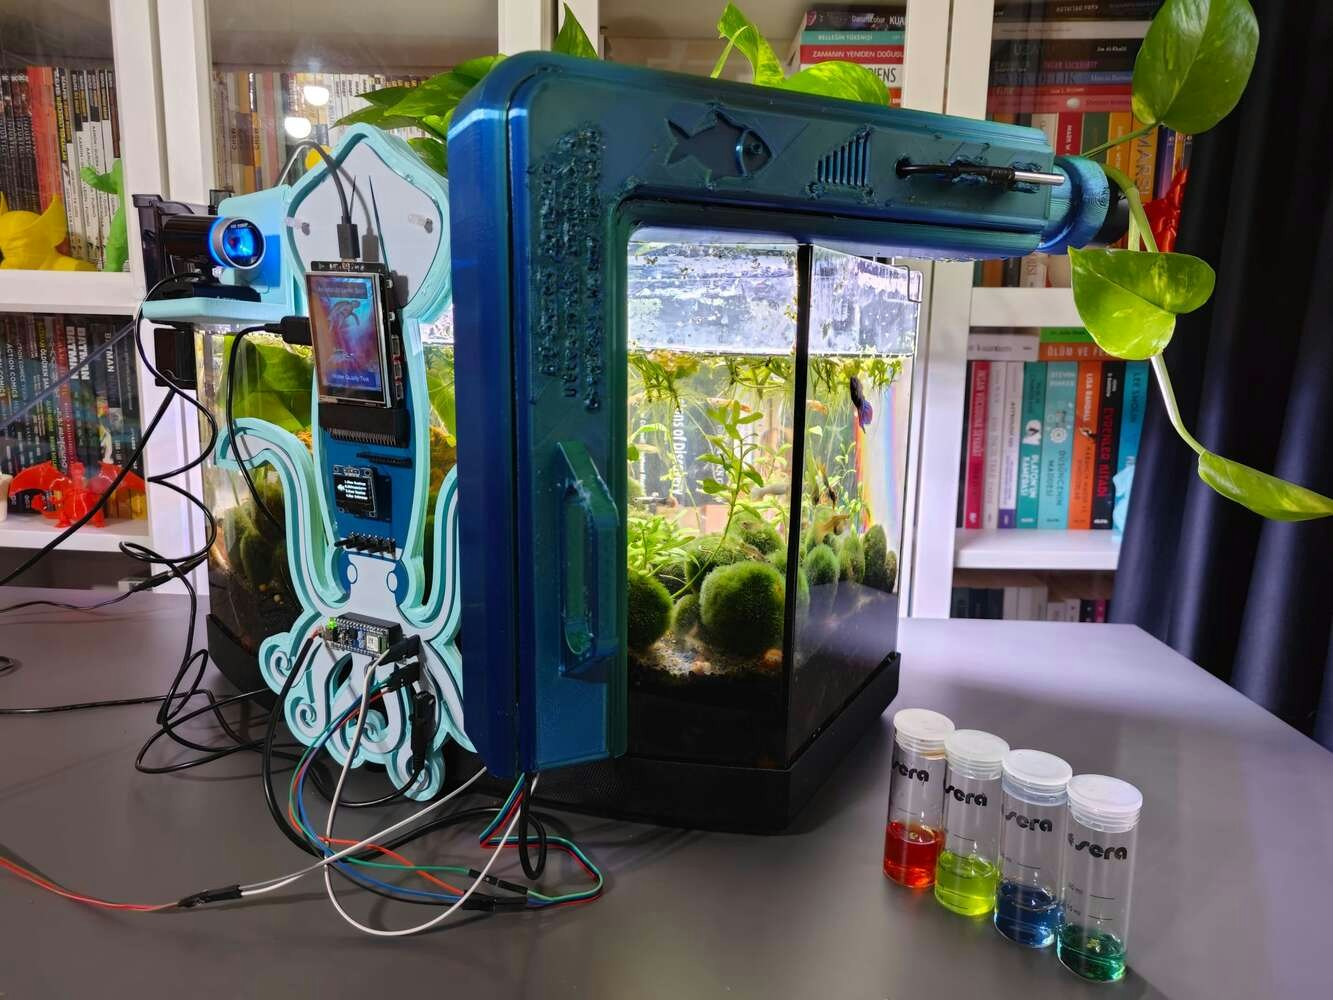
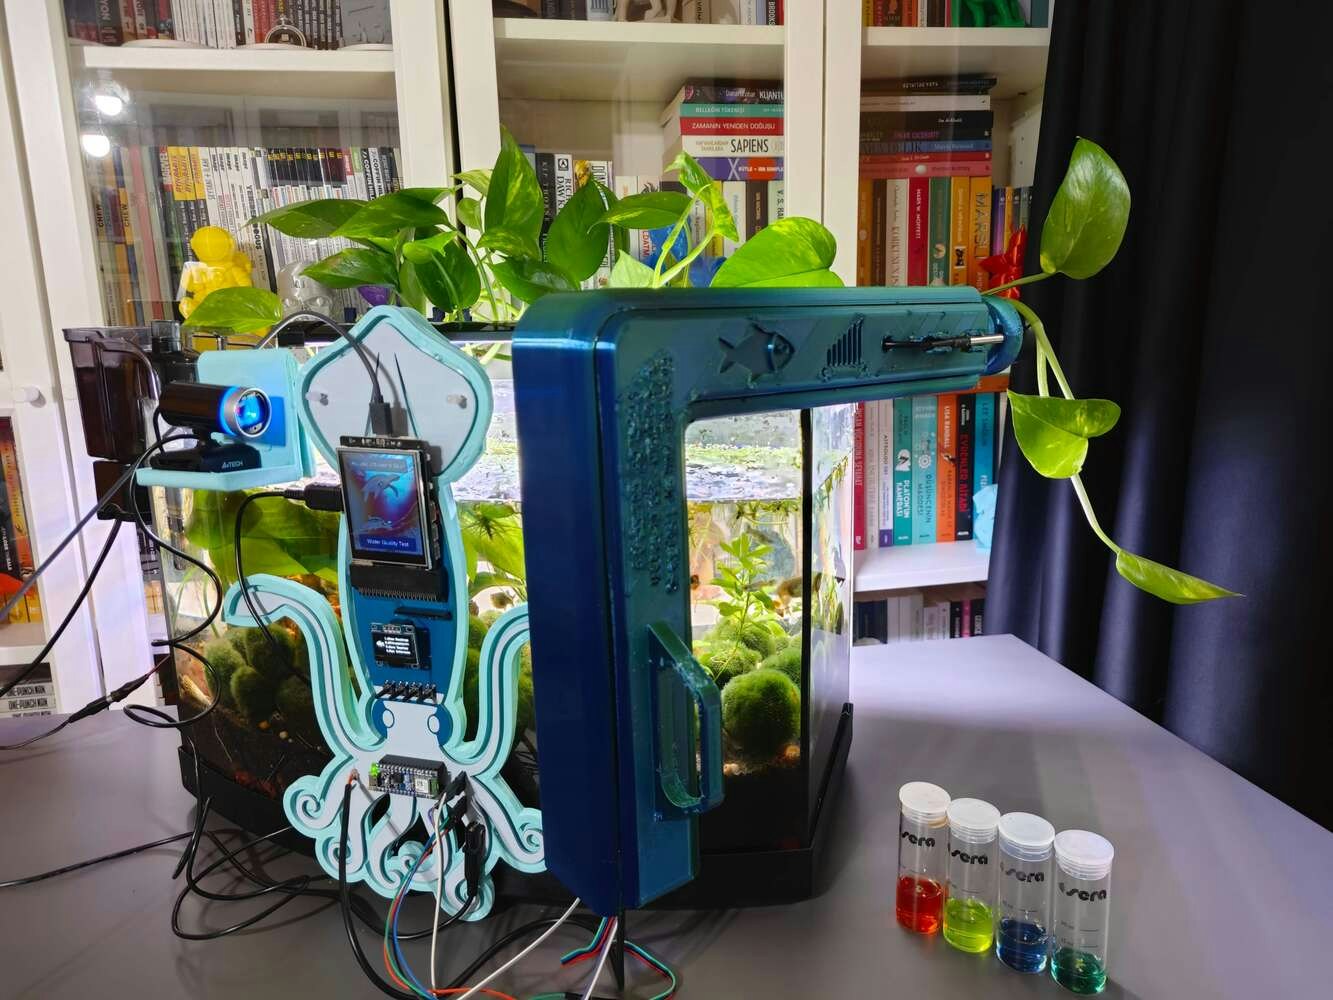
Since I focused on building a feature-rich and accessible AI-powered device that identifies noxious underwater air bubbles via aquatic ultrasonic scans and evaluates water pollution based on chemical water quality tests via object detection so as to inform the user via Telegram push notifications, I decided to design a robust and modular case allowing the user to hang the Squid PCB on the aquarium, place the high-quality USB webcam when standing idle, and position the ultrasonic sensor effortlessly while scanning underwater substrate. To avoid overexposure to water and prevent open wire connections from short circuits, I added a removable top cover mountable to the main case via snap-fit joints. The semicircular-shaped mounting brackets on the top cover let the user attach the DS18B20 waterproof temperature sensor effortlessly. Then, I designed a unique PCB holder encasing the Squid PCB outline and a hang-on aquarium connector mountable to the PCB holder via M3 screws and nuts. To place the high-quality USB webcam when standing idle, I also designed a hang-on camera holder attachable to the side of the aquarium. Furthermore, I decided to emboss aquatic life with sound-based graphic icons on the removable top cover and the camera symbol on the camera holder to highlight the qualifications of this AI-powered underwater air bubble detection device. Since I needed to position the URM15 ultrasonic sensor accurately while scanning the underwater substrate and generating data buffers, I added a special cylindrical slot to the end point of the L-shaped main case in order to fasten the ultrasonic sensor seamlessly. I designed the L-shaped main case, the removable top cover, the Squid PCB holder, the hang-on aquarium connector of the PCB holder, and the hang-on camera holder in Autodesk Fusion 360. You can download their STL files below.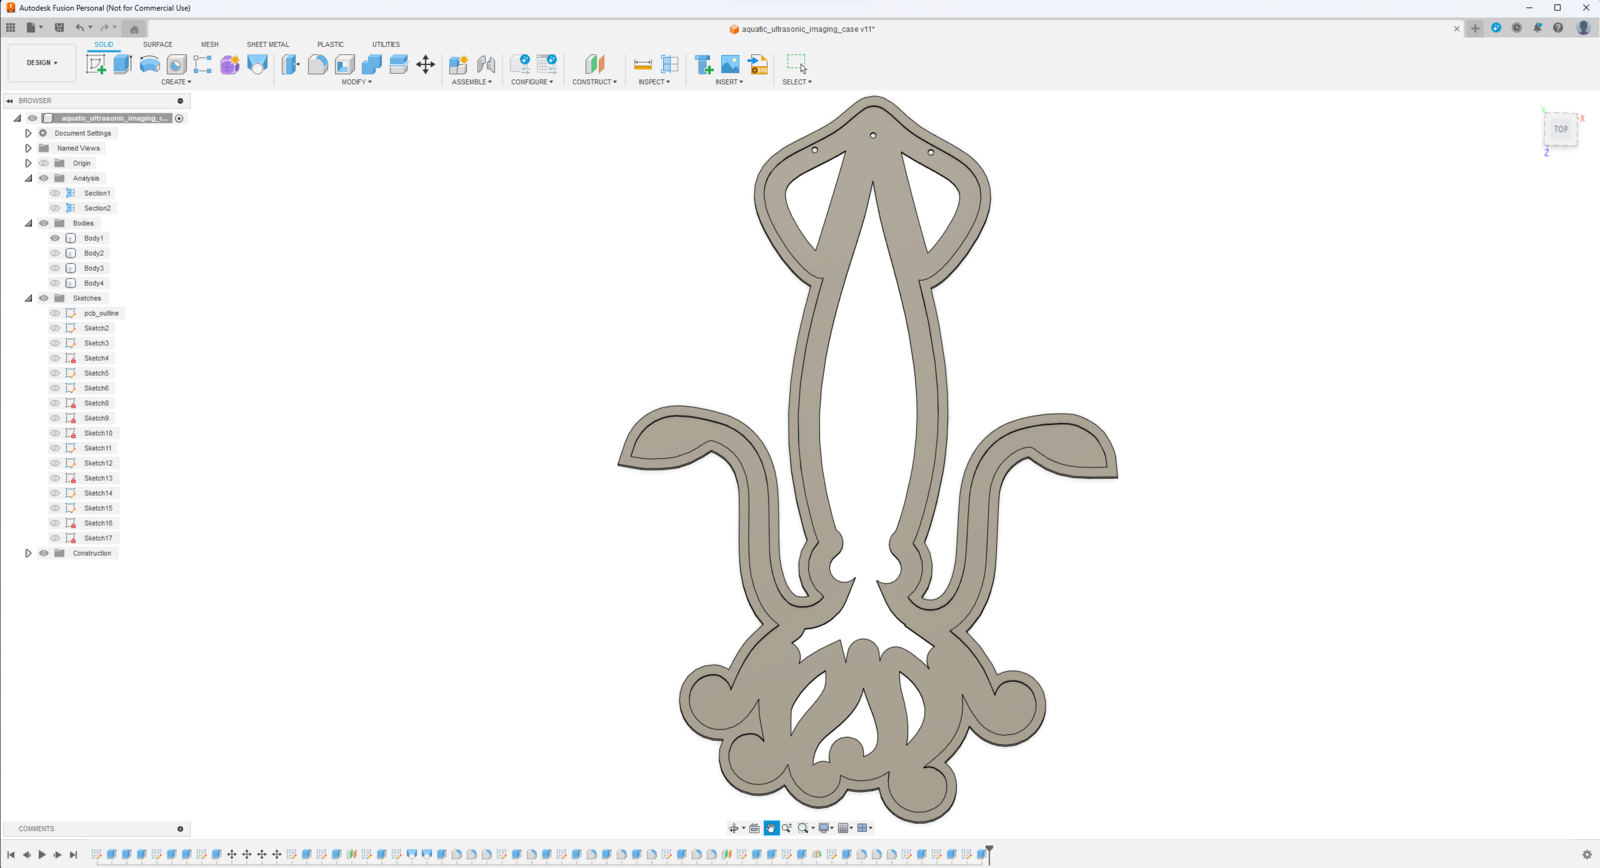
- ePLA-Silk Magic Green-Blue (main case and top cover)
- ePLA-Matte Light Blue (PCB holder and hang-on connectors)
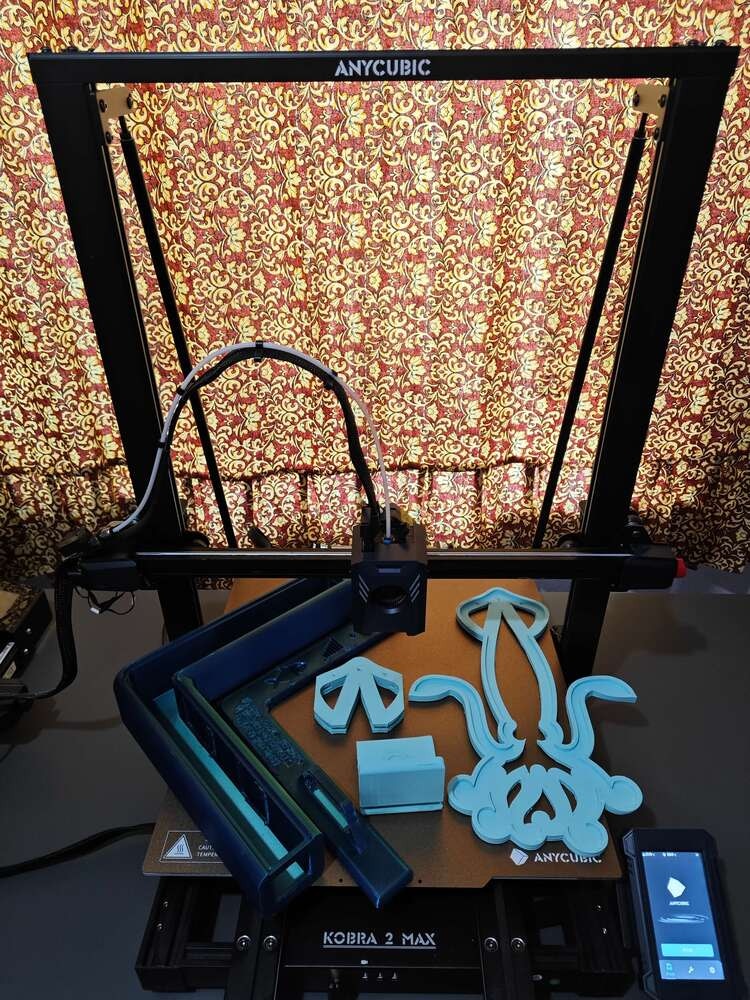
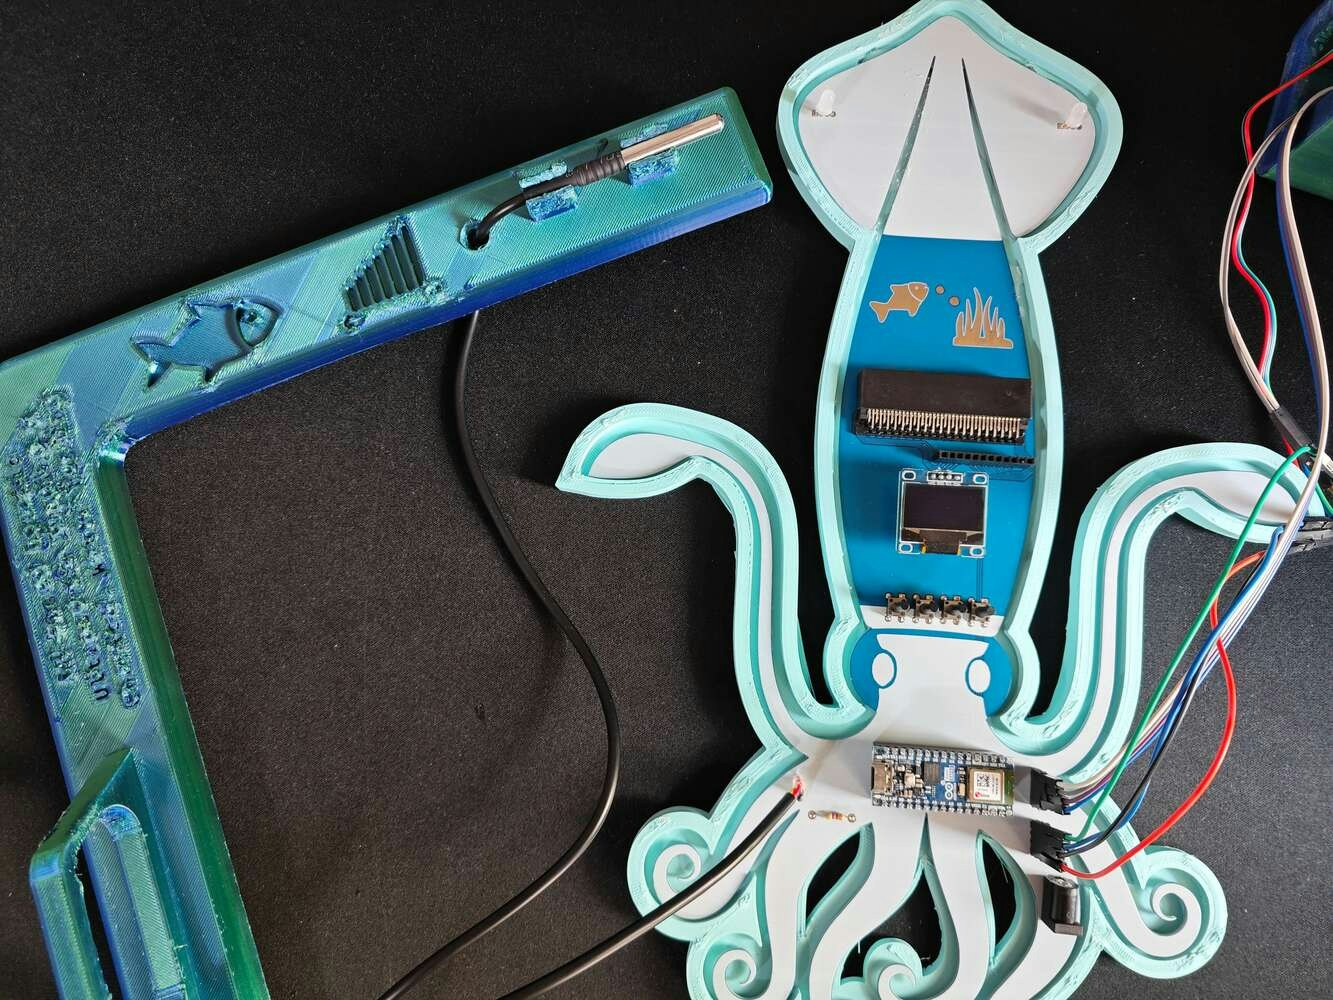
Step 2.1: Assembling the 3D-printed case
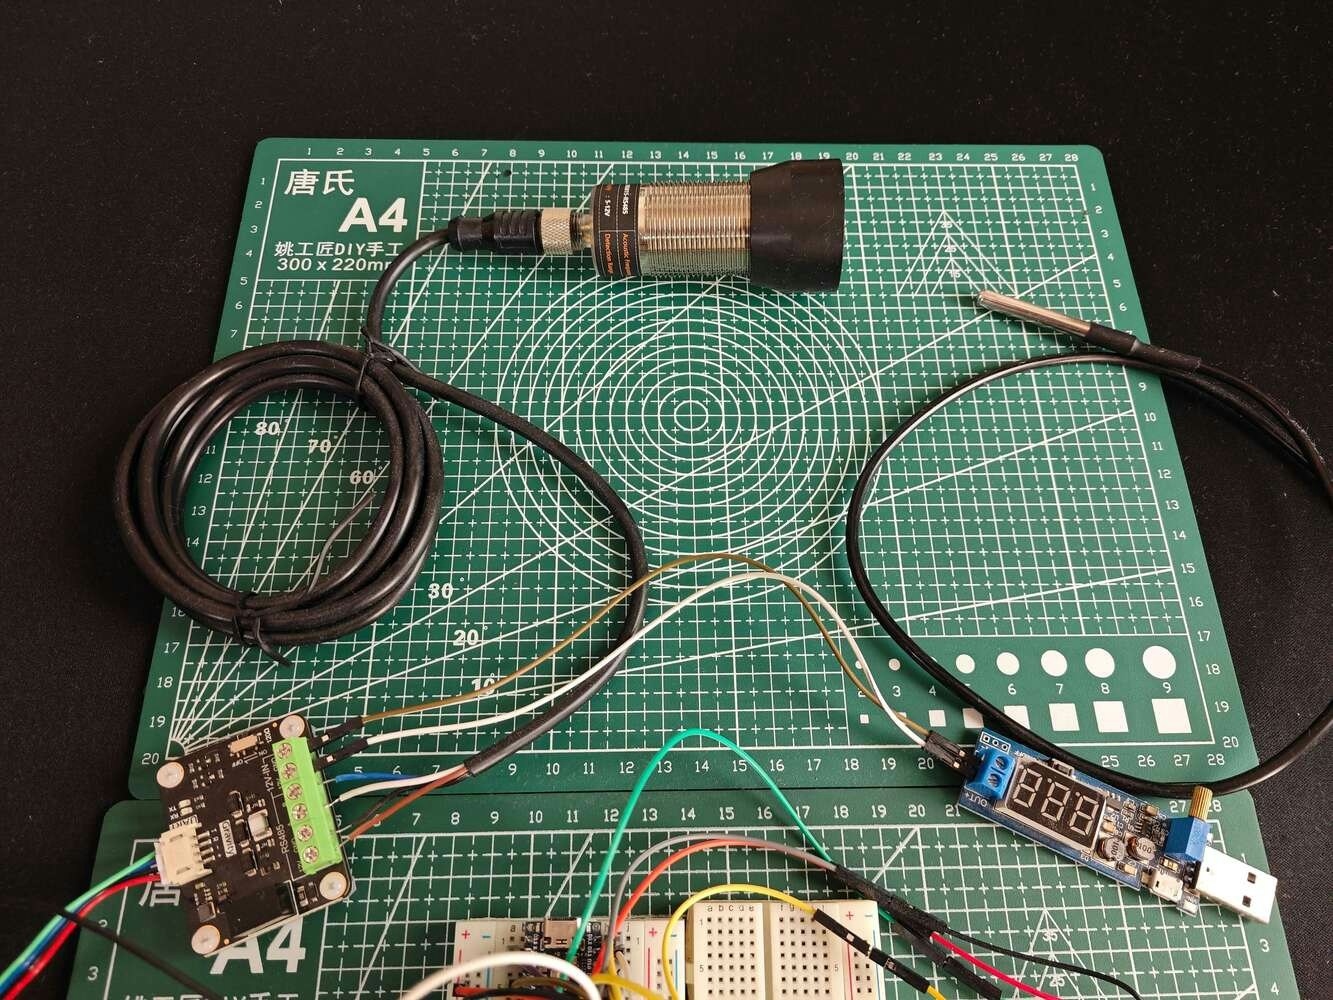
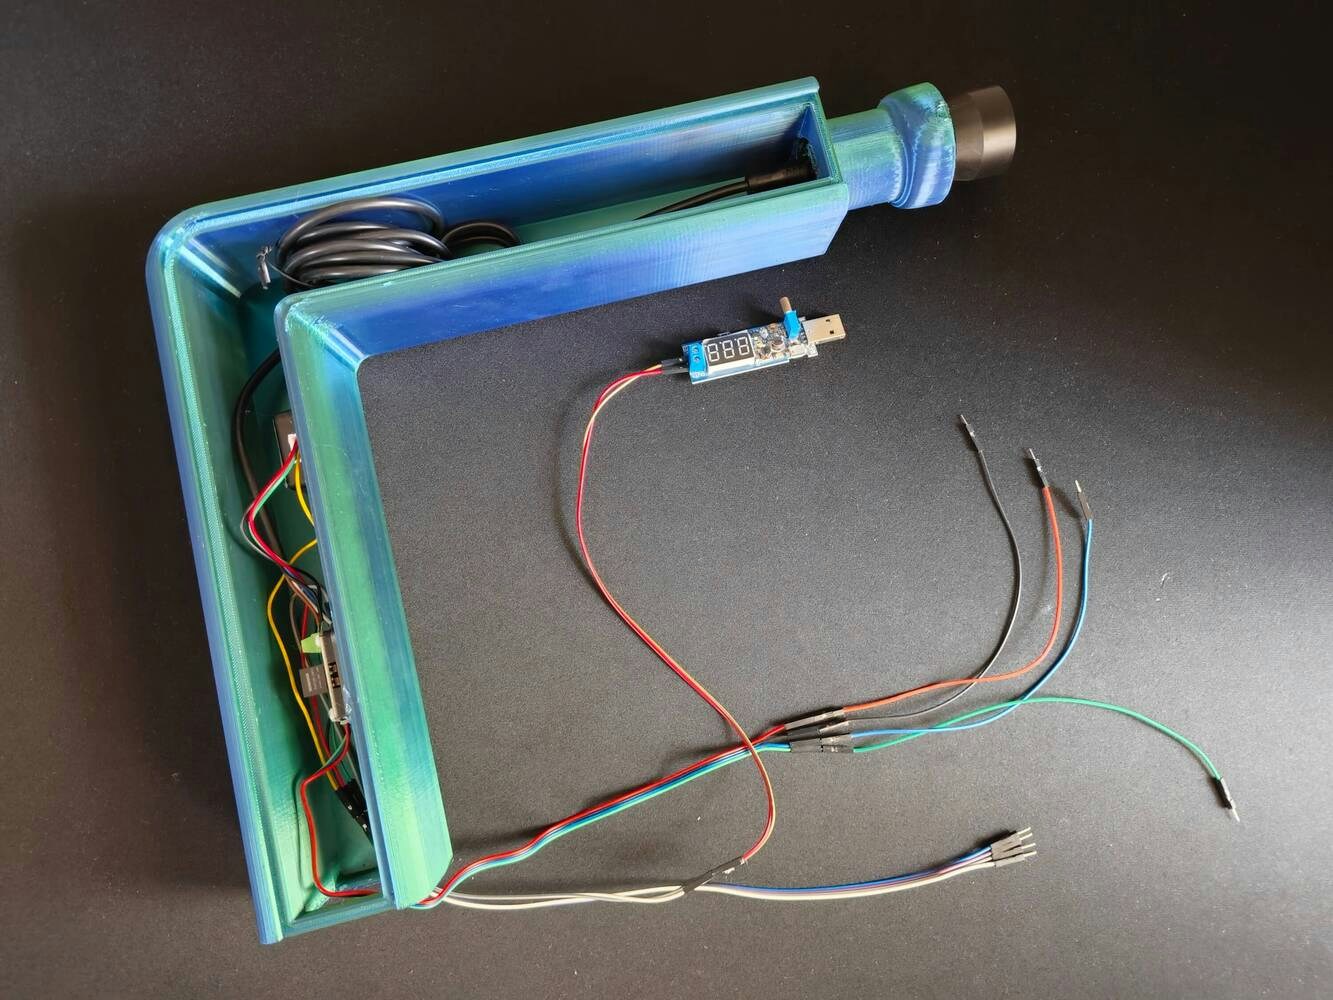
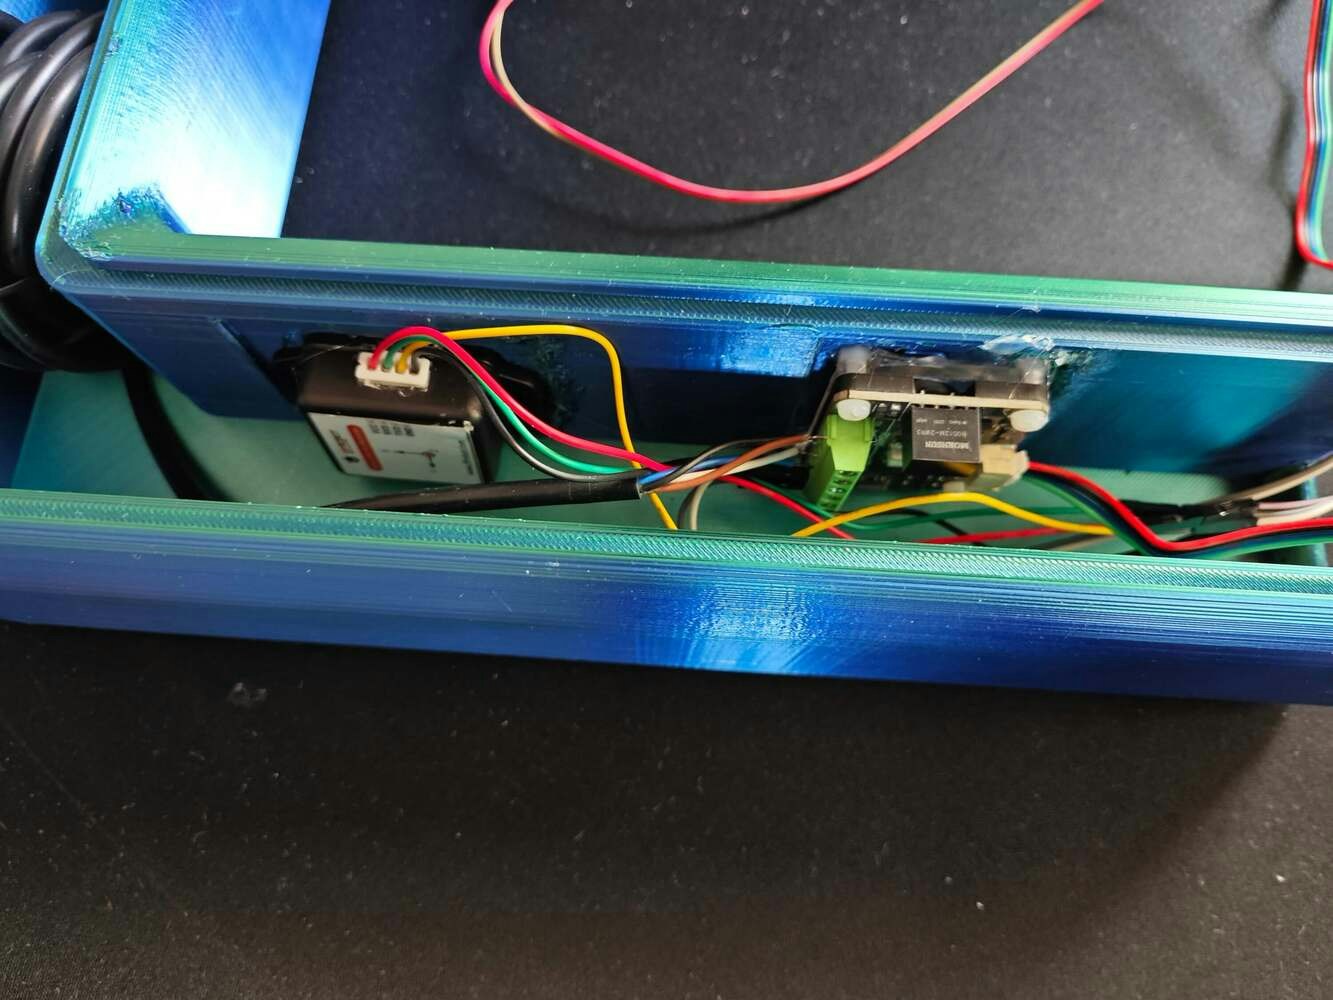
After printing all parts (models), I attached the URM15 ultrasonic sensor into its special cylindrical slot on the end point of the L-shaped main case and fastened the remaining components to their corresponding slots within the main case via a hot glue gun. Then, I fastened the Squid PCB to its unique PCB holder via the hot glue gun, encasing the PCB outline. After fastening the Squid PCB, I attached the hang-on aquarium connector to the back of the PCB holder via M3 screws and nuts. Since the removable top cover has special semicircular-shaped mounting brackets, the DS18B20 waterproof temperature sensor can externally be attached to the top cover. Finally, I affixed the top cover to the main case via its provided snap-fit joints.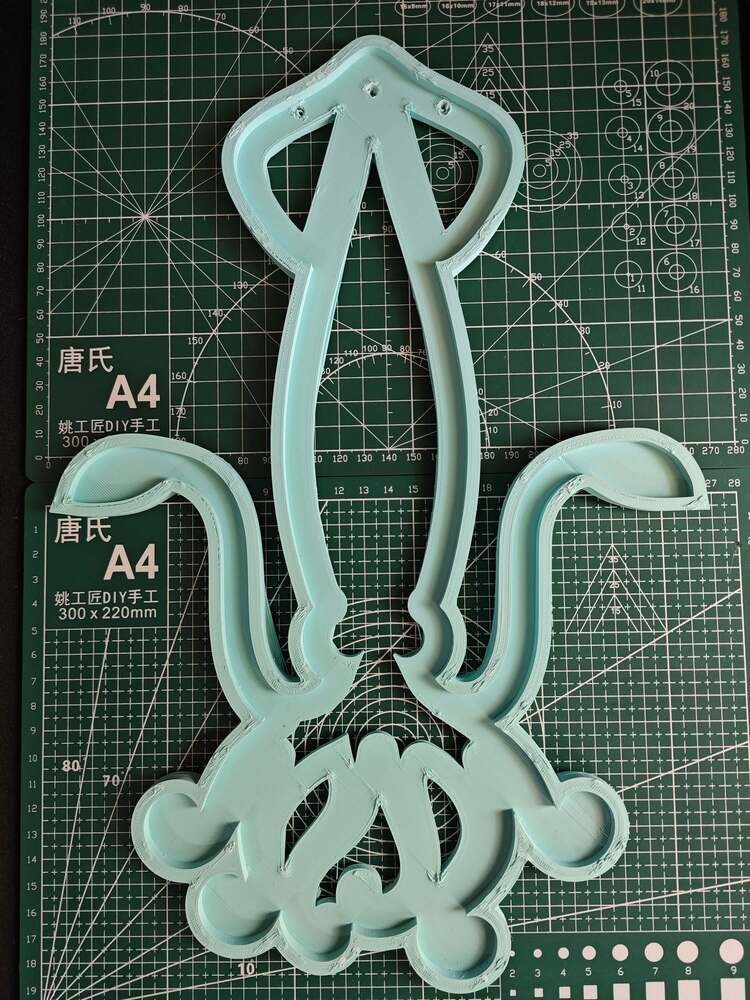
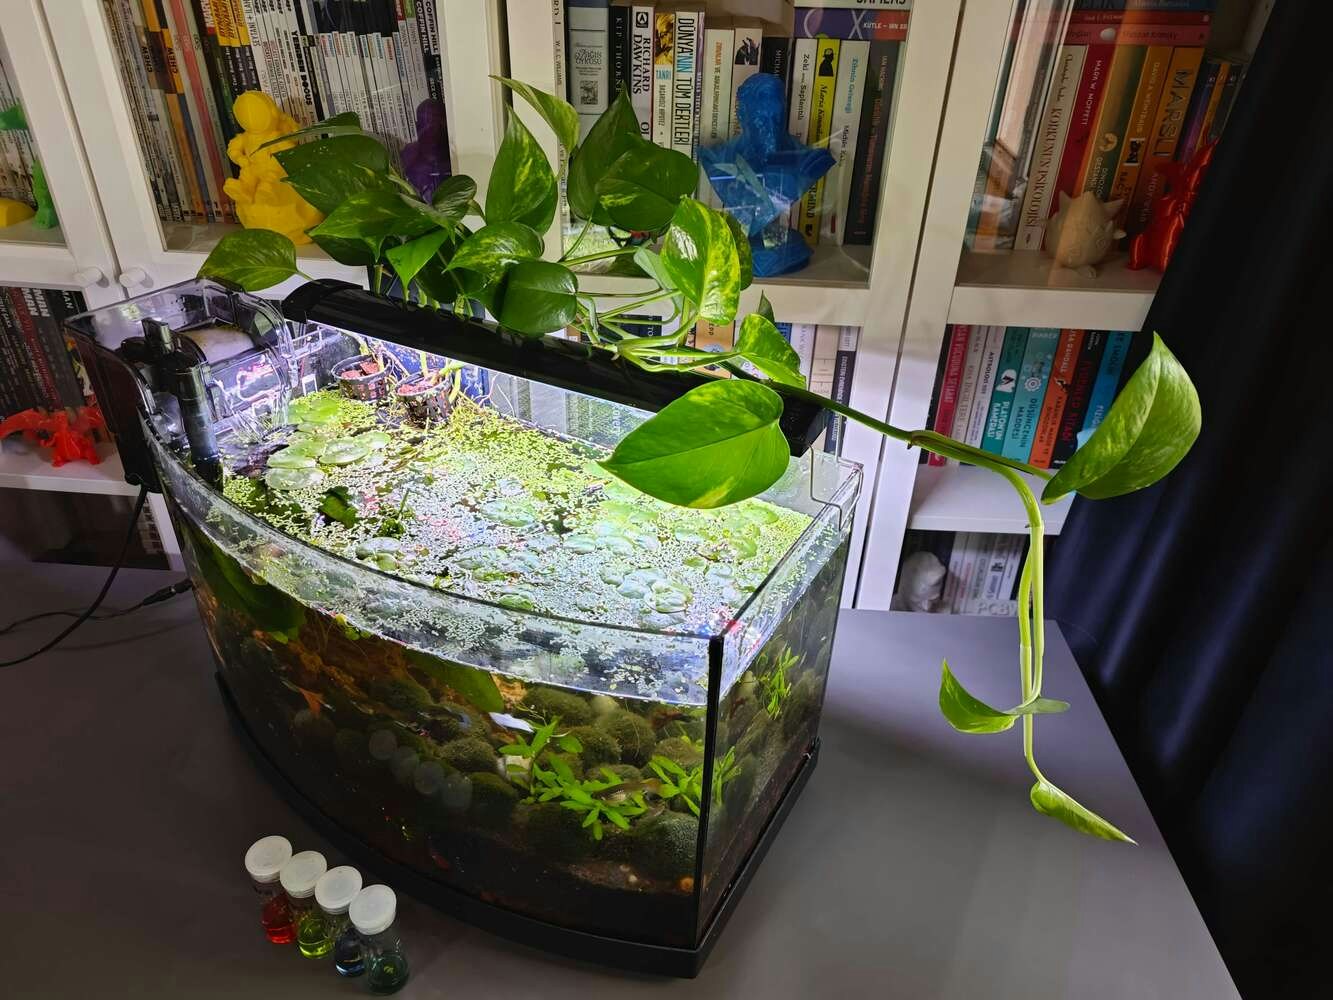
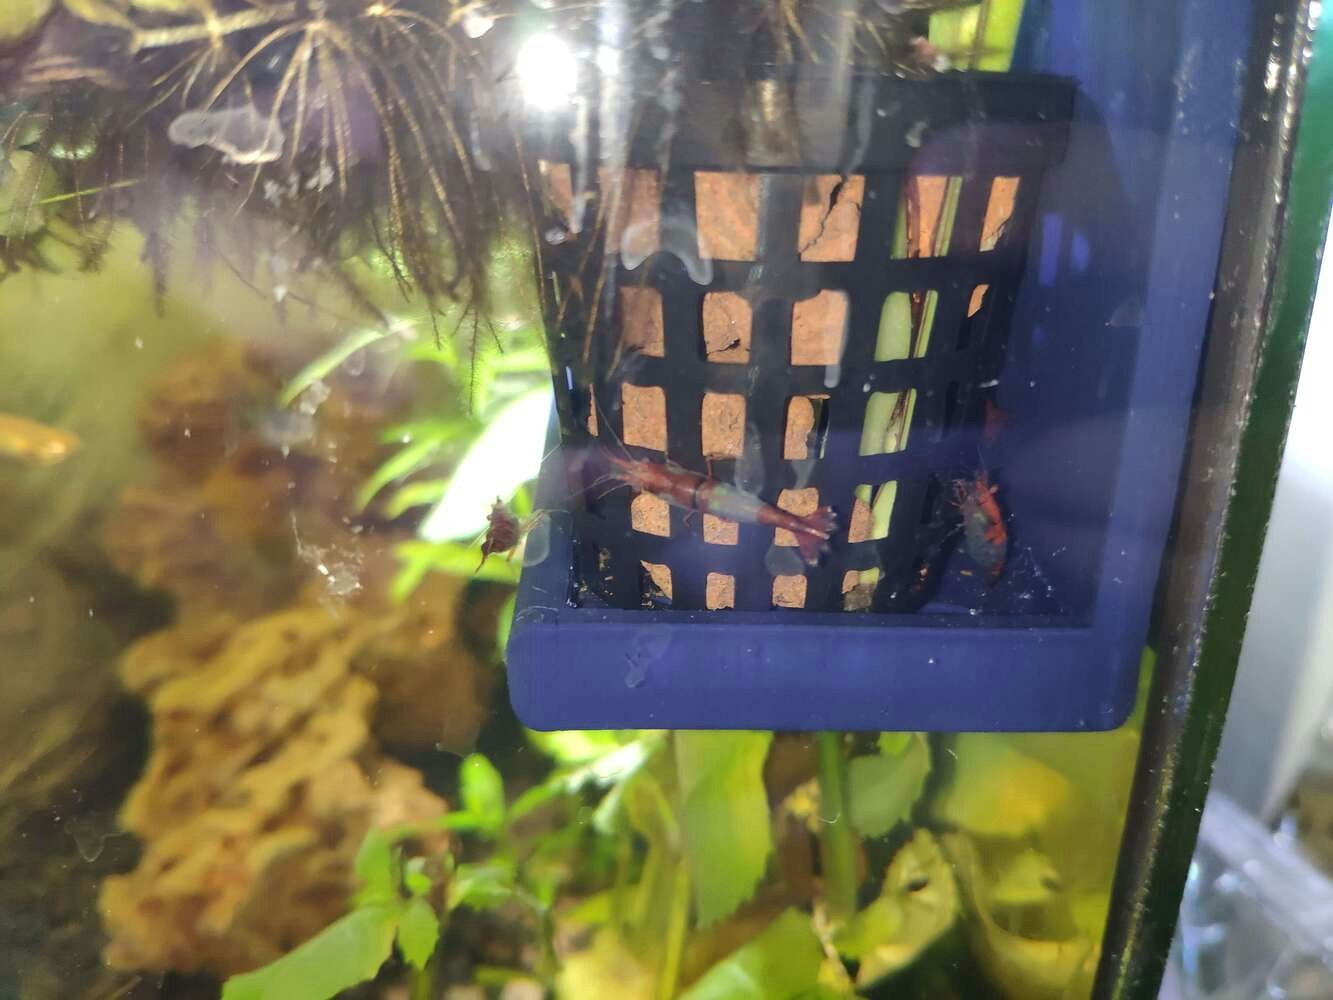
Step 3: Setting up an aquarium with prolific breeders to simulate harsh fish farm conditions
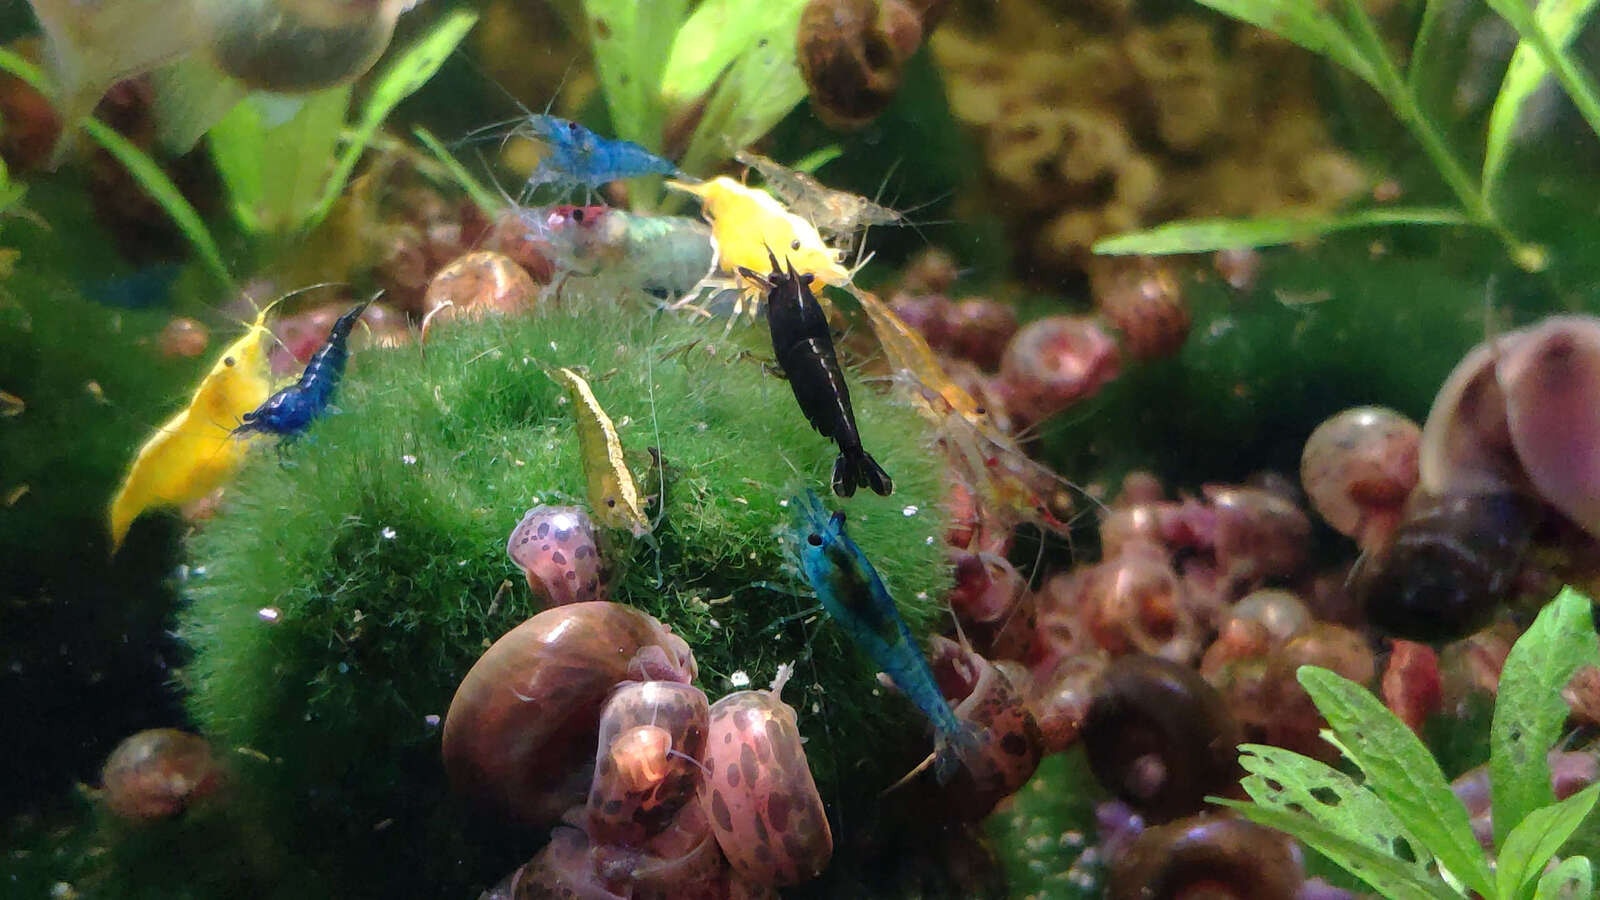
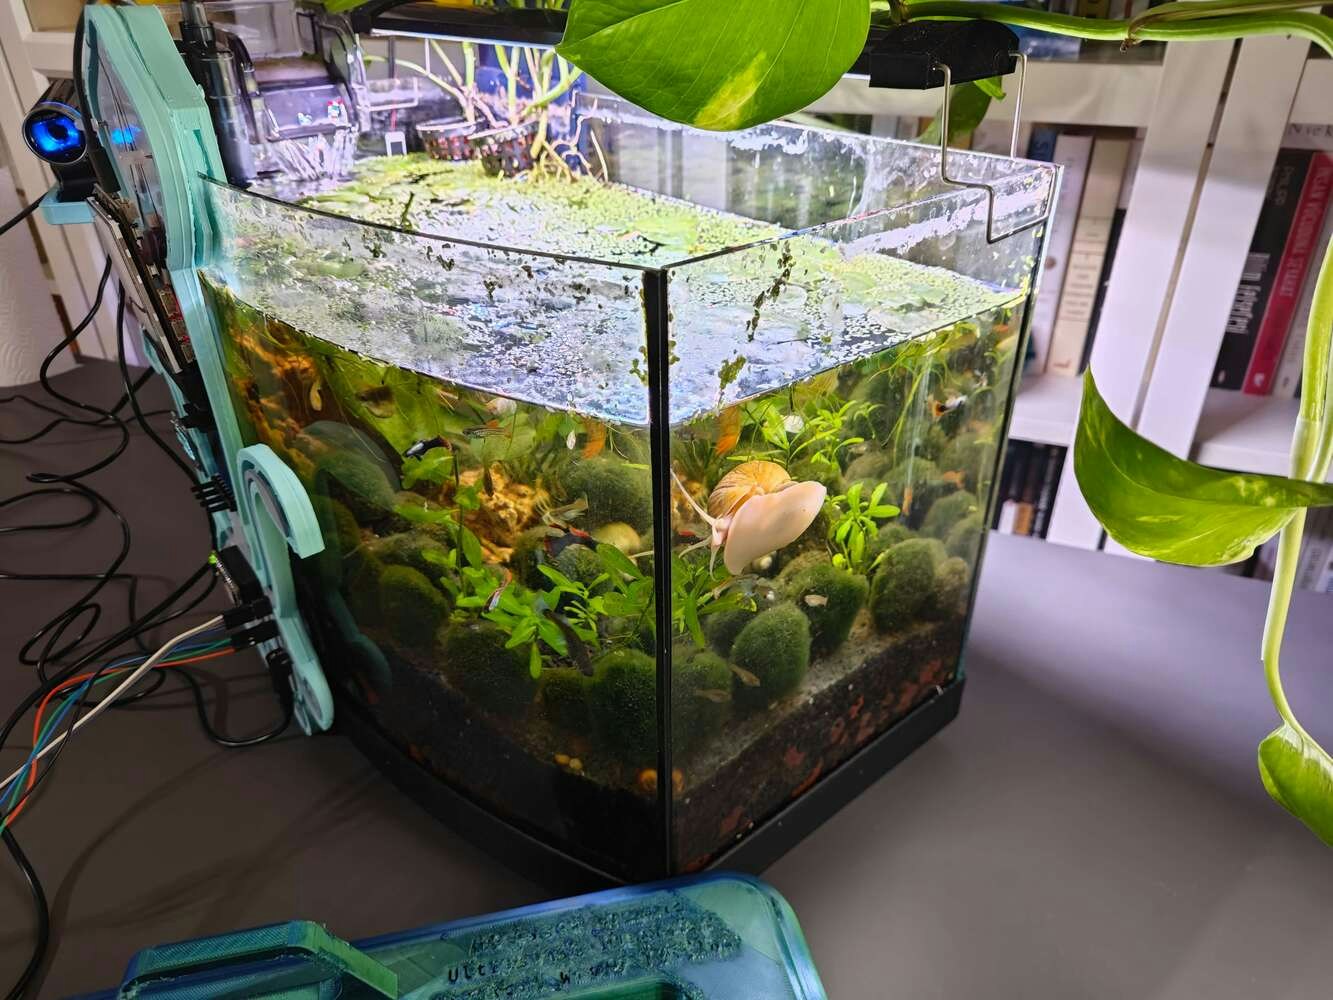
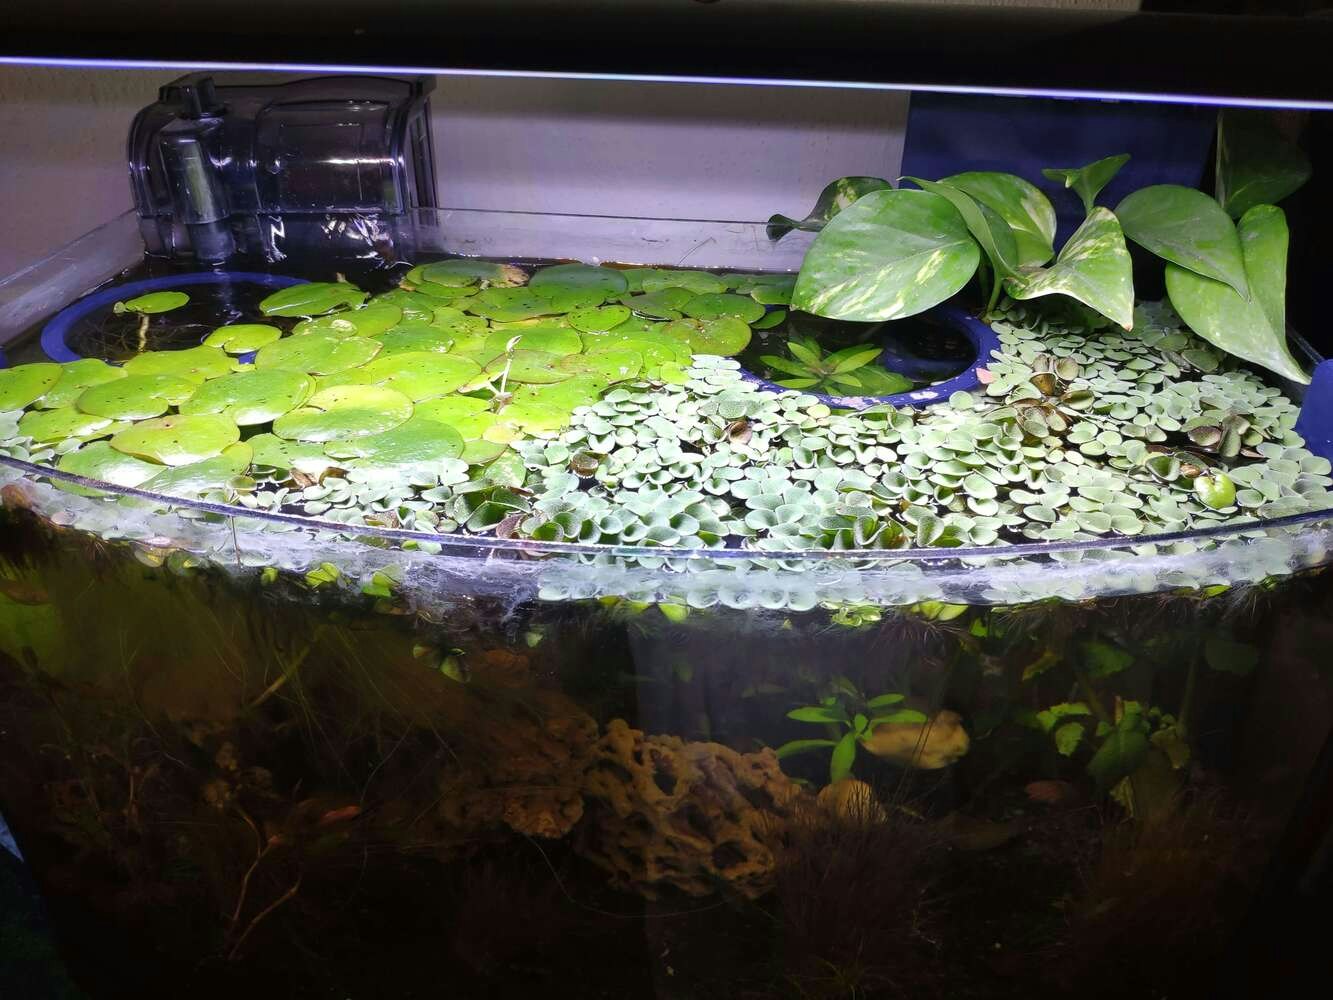
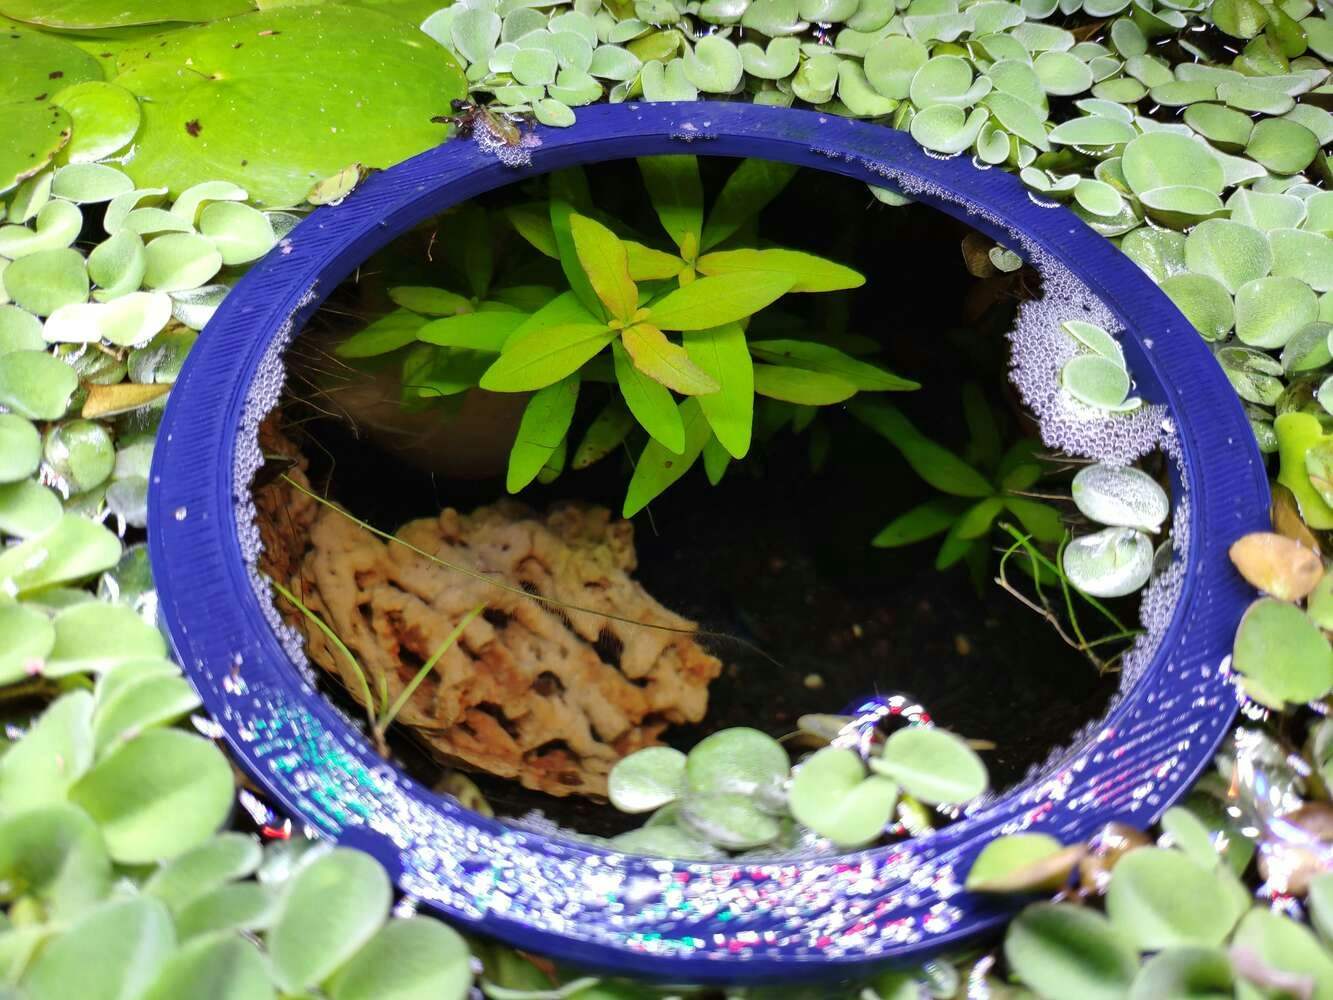
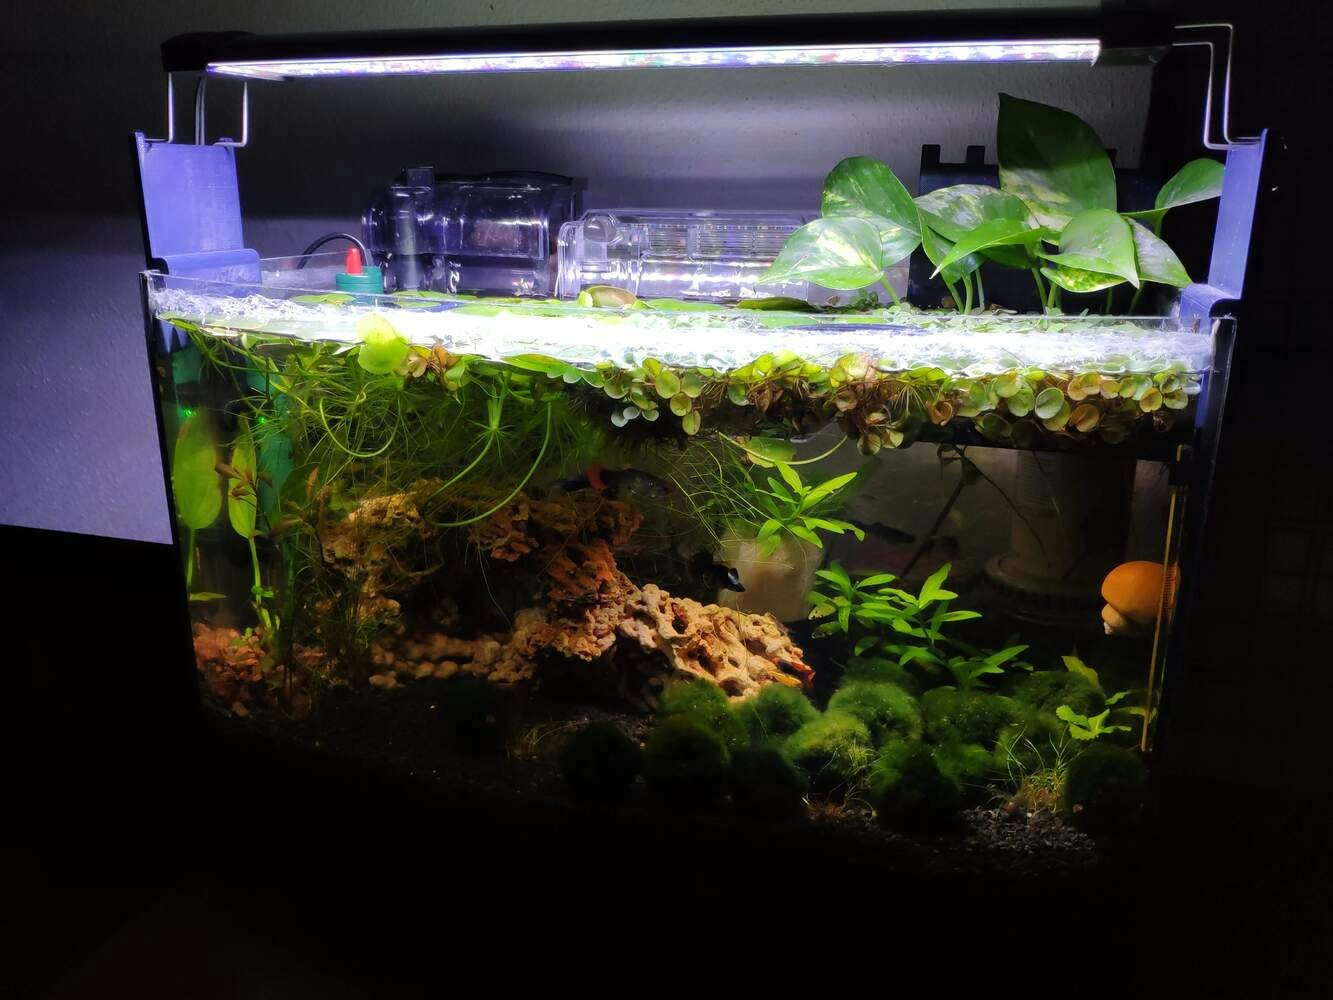
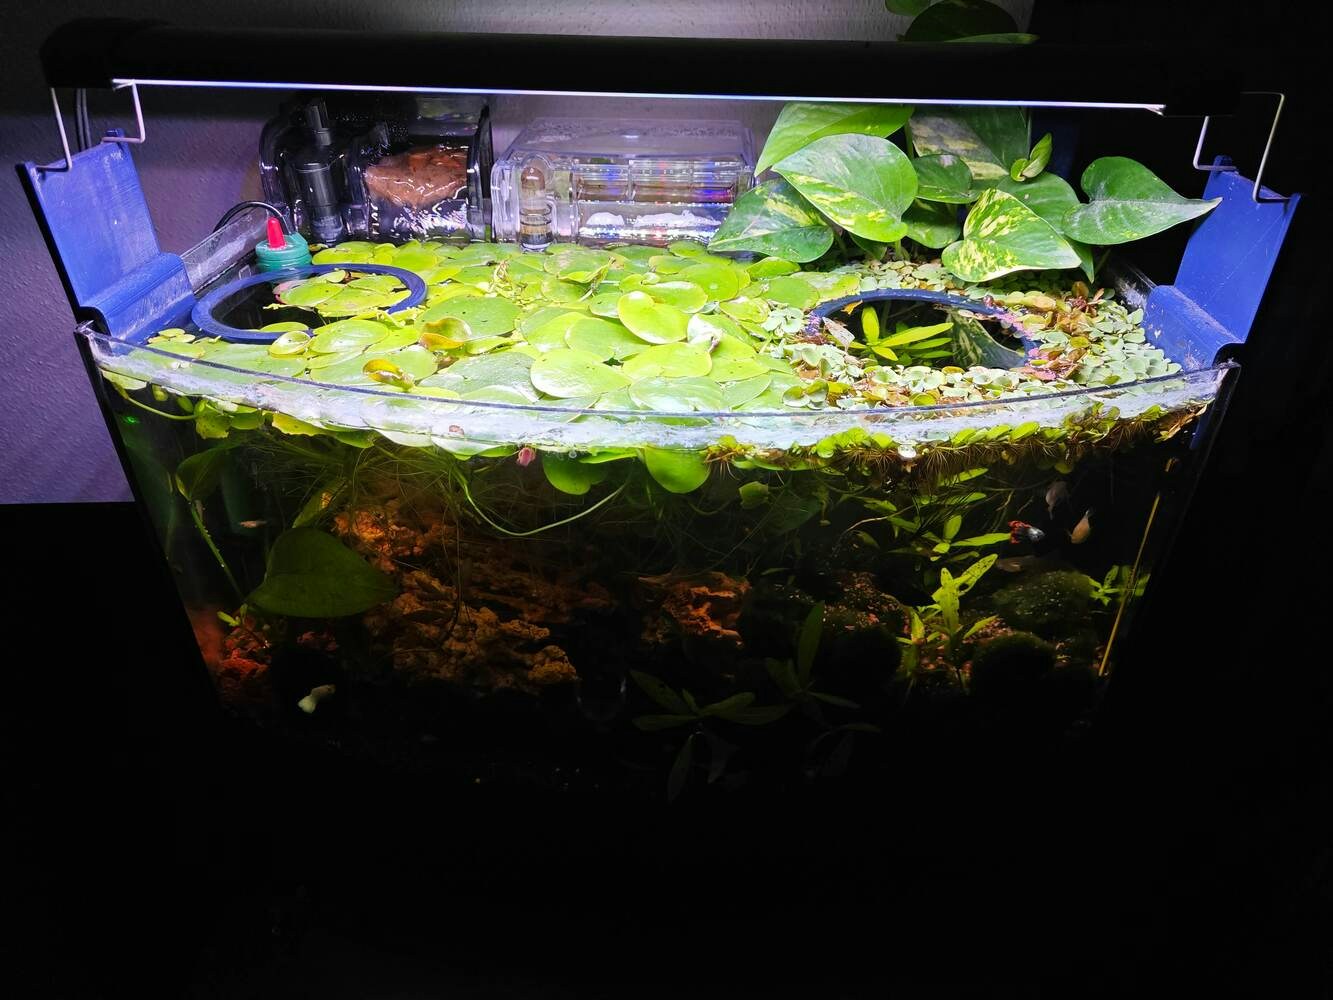
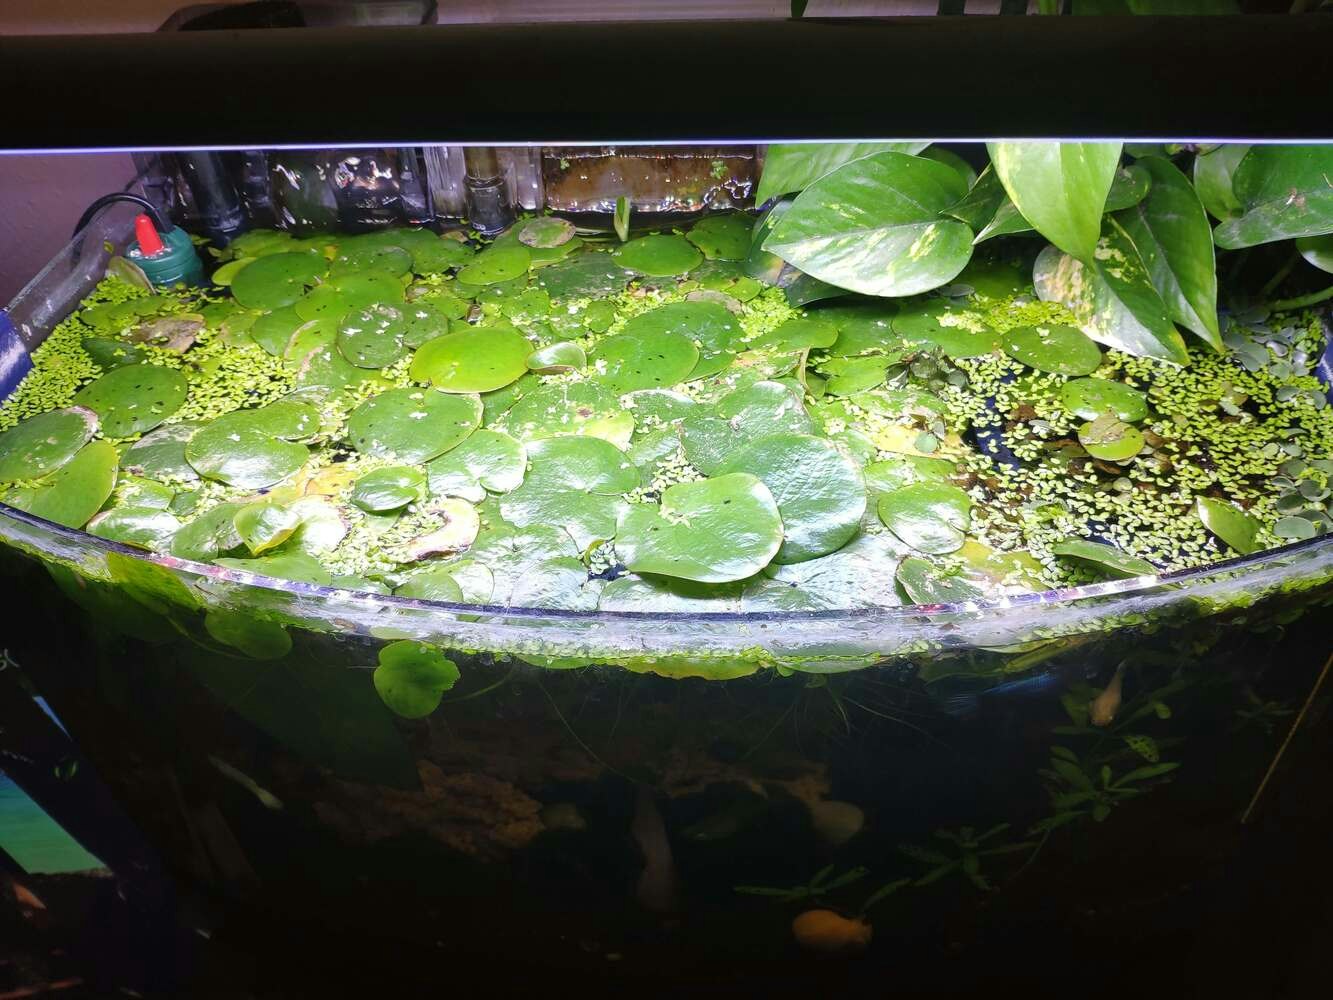
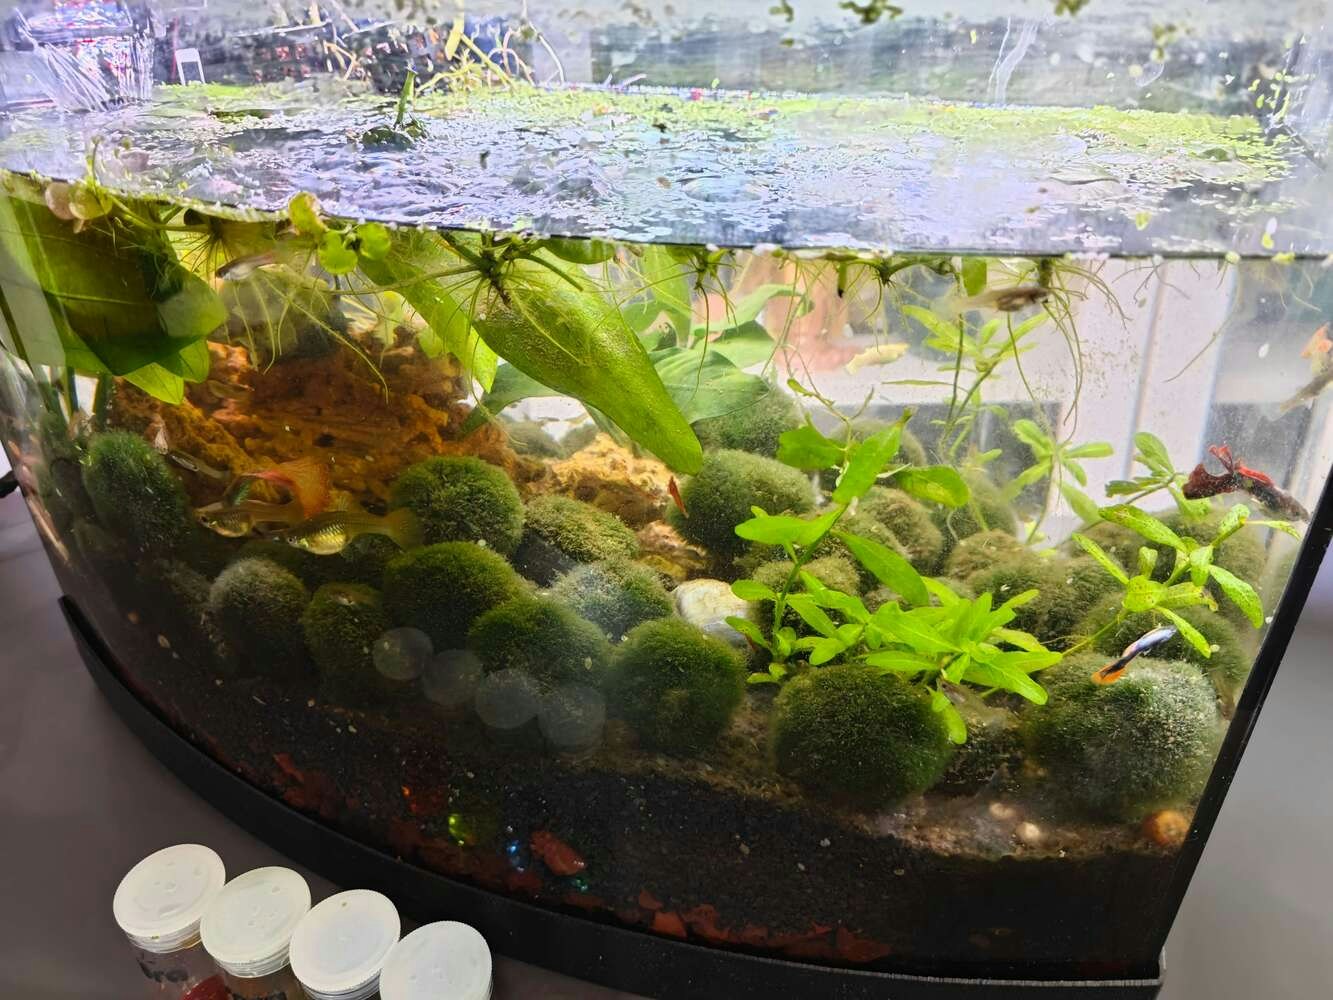
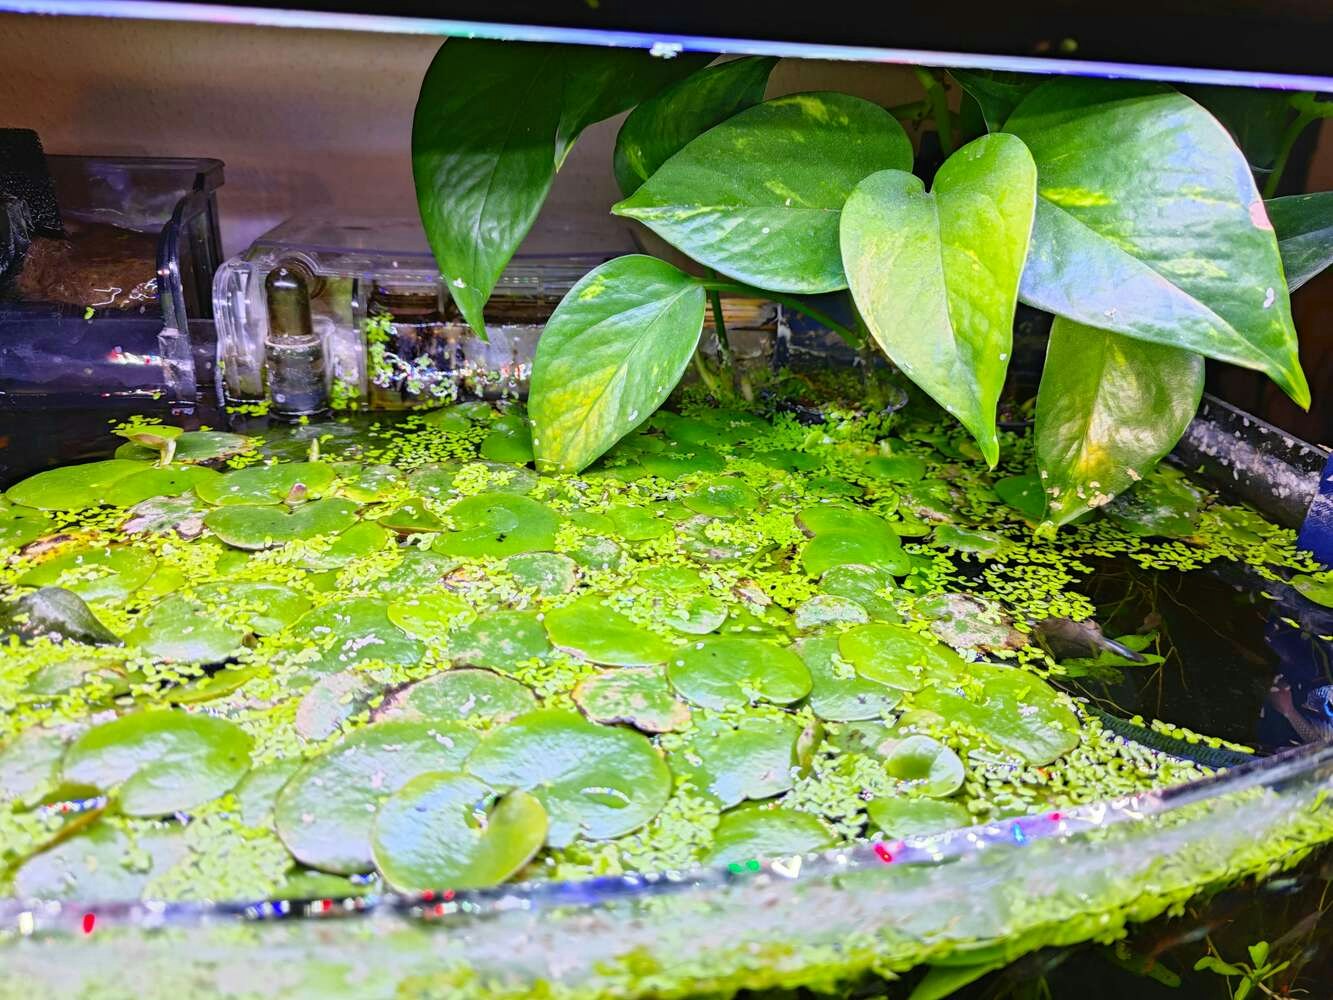
As explained earlier, before working on data collection procedures, I needed to find a natural or artificial environment demonstrating the ebb and flow of underwater substrate toxicity and water quality fluctuations due to overpopulation and decaying detritus. Unfortunately, I could not find a suitable natural environment near my hometown due to endangered aquatic life, unrelenting habitat destruction, and disposal of chemical waste mostly caused by human-led activities. Since I did not have access to an aquaculture facility to observe underwater substrate toxicity because of commercial aquatic animal breeding or plant harvesting, I decided to set up an artificial aquatic environment simulating noxious air bubbles in the underwater substrate and potential water pollution risk. Instead of setting up a small artificial garden pond for the commercial breeding of profitable fish (mostly for food), I decided to utilize a medium-sized aquarium (10 gallons) to replicate fish farm (or pisciculture) conditions. Since this aquarium setting let me inspect the abrupt changes in the lower underwater substrate, I was able to conduct precise experiments to collect aquatic ultrasonic scan data for air bubble identification with ultrasonic imaging and capture chemical water quality test result (color-coded) images for water pollution detection. After conducting a painstaking analysis of prolific aquatic life with which I can observe commercial fish farm conditions affecting the lower underwater substrate with noxious air bubbles and exacerbating the decreasing water quality due to decaying detritus, I decided to set up a planted freshwater aquarium for harmonious and proliferating species that can thrive in a small freshwater aquarium — livebearers (guppies), Neocaridina shrimp, dwarf (or least) crayfish (Cambarellus Diminutus), etc. To set up a self-sustaining aquarium manifesting harsh fish farm conditions, I added these aquatic species:- 🐠 Mosaic Dumbo Ear Guppies
- 🐠 Snow White Guppies
- 🐠 Half Black Guppies
- 🐠 Green Snakeskin Cobra Guppies
- 🐠 Red Rose Guppies
- 🦐 Red Sakura Neocaridina Shrimps
- 🦐 Black Rose Neocaridina Shrimps
- 🦐 Vietnam Leopard Neocaridina Shrimps
- 🦐 Blue Angel Neocaridina Shrimps
- 🦐 Sakura Orange Neocaridina Shrimps
- 🦐 Red Rili Neocaridina Shrimps
- 🦐 Carbon Rili Neocaridina Shrimps
- 🦐 Green Jelly Neocaridina Shrimps
- 🦐 Yellow Fire Neon Neocaridina Shrimps
- 🦞 Cambarellus Diminutus — Dwarf (or least) Crayfish
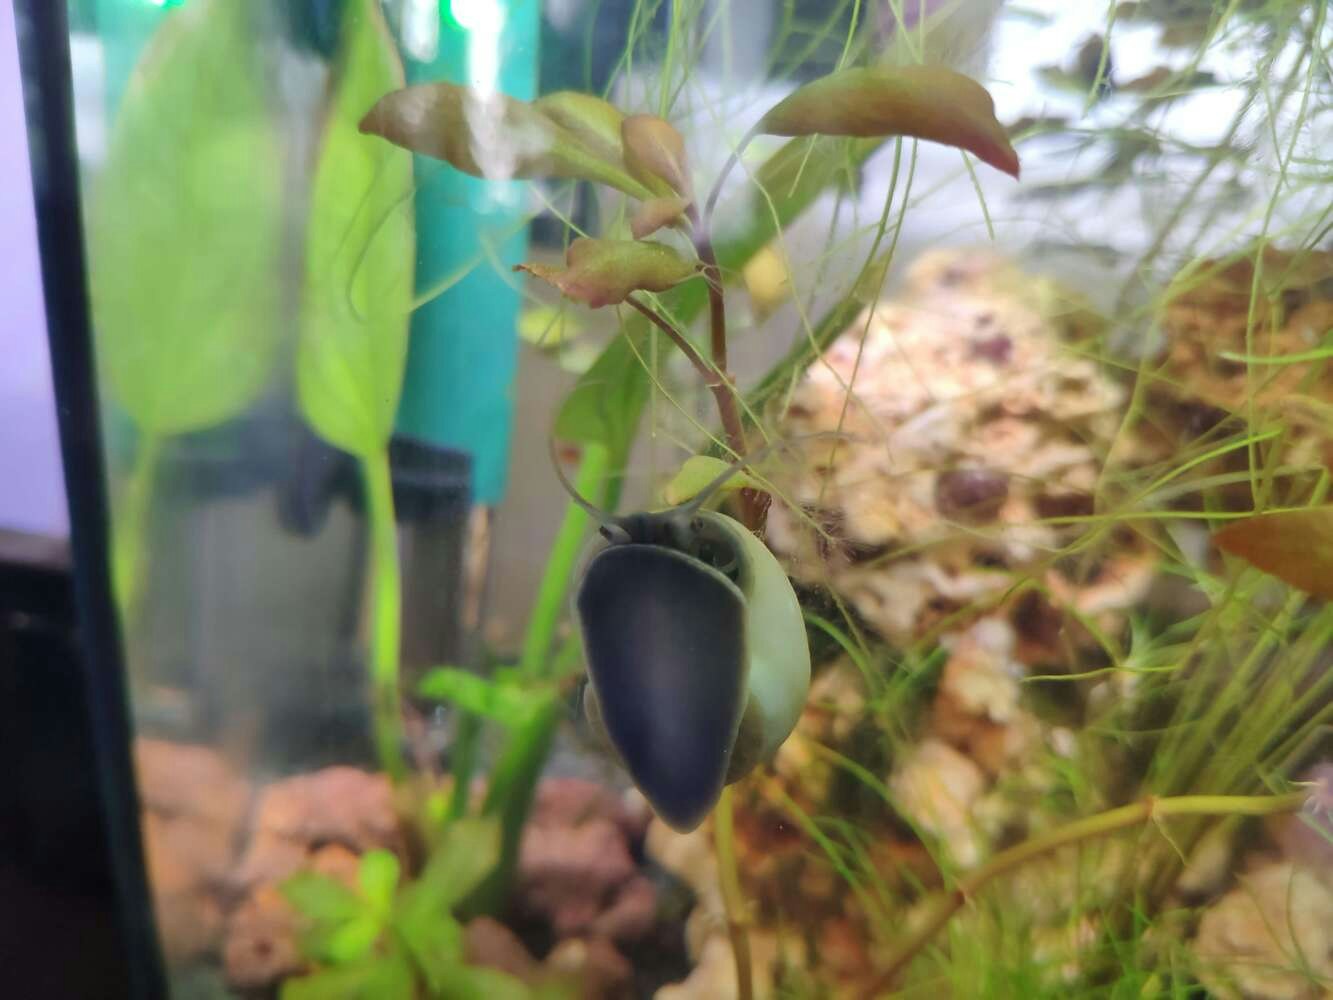
- 🐌 Yellow Mystery (Apple) Snails
- 🐌 Blue Mystery (Apple) Snails
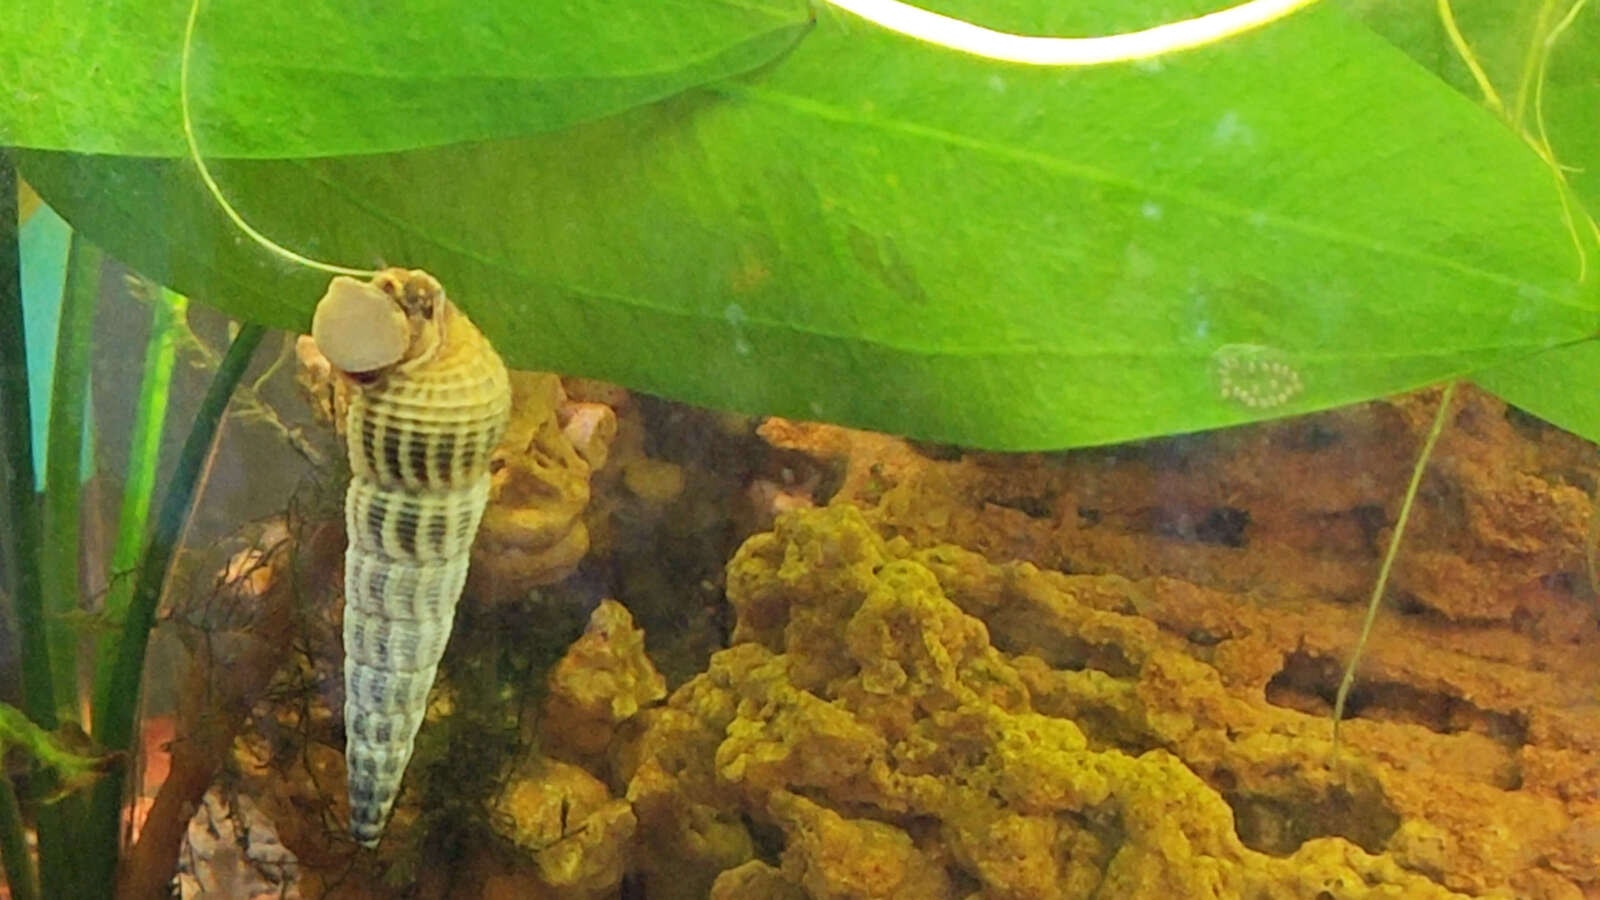
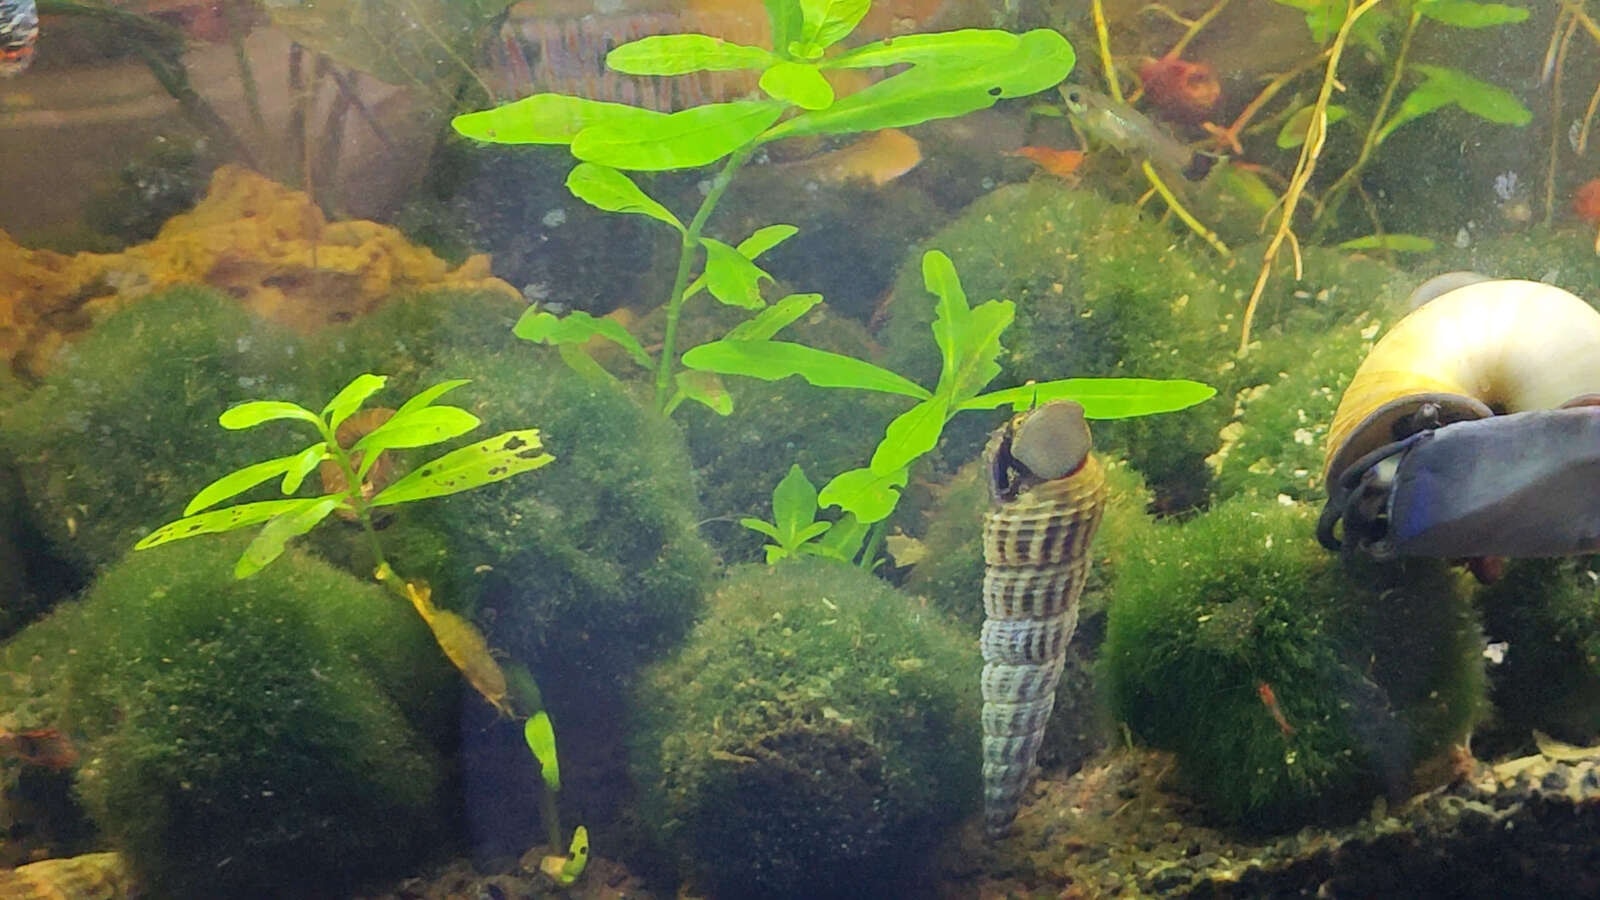
- 🐌 Black Poso Rabbit Snails
- 🐌 Bumblebee Horn (Nerite) Snails
- 🐌 Ramshorn Snails (removed due to overpopulation)
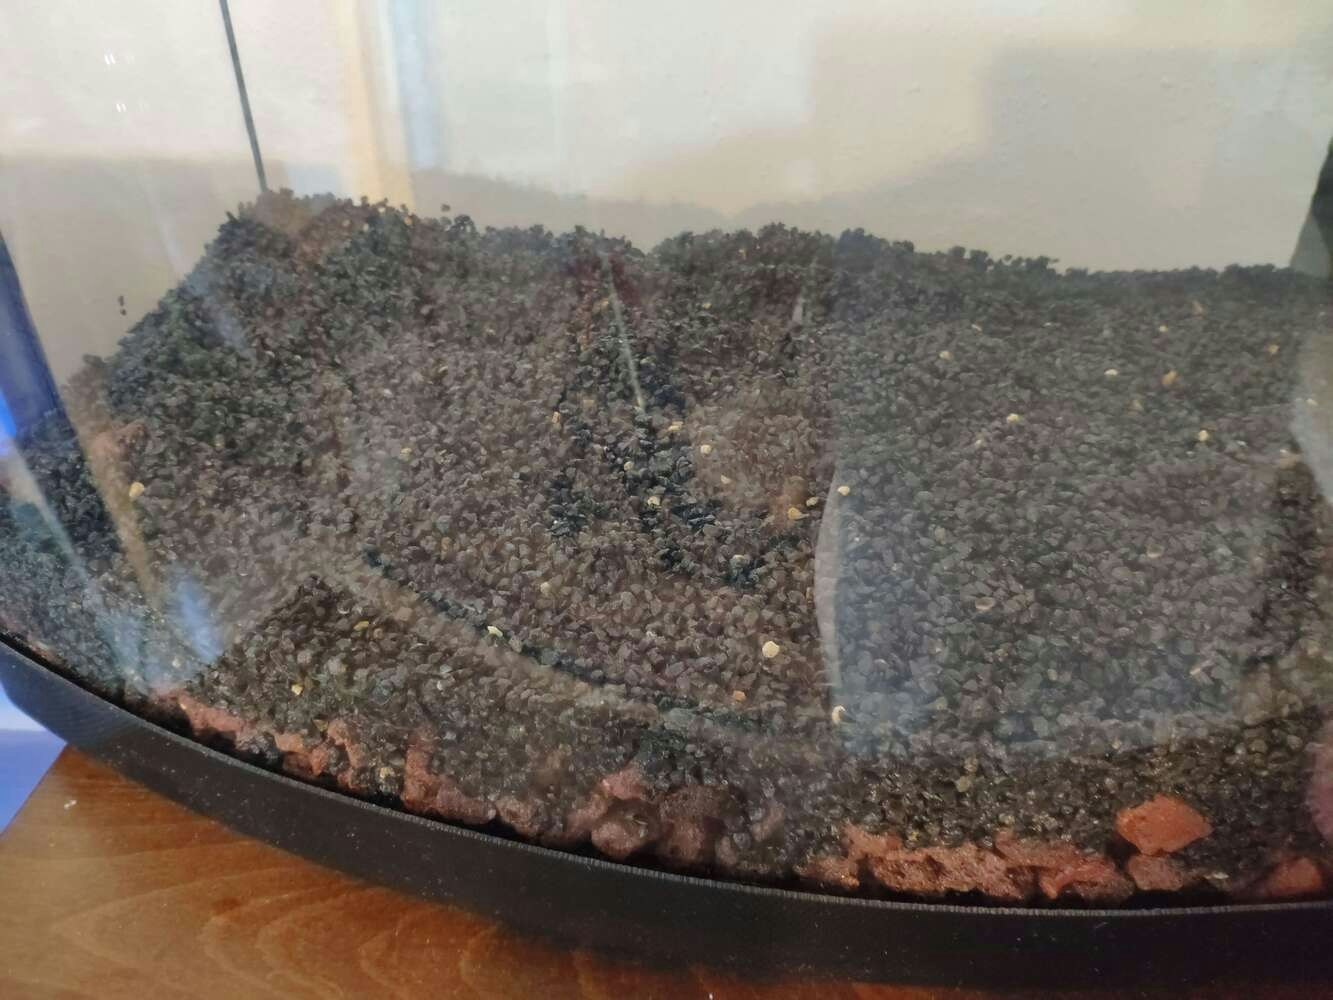
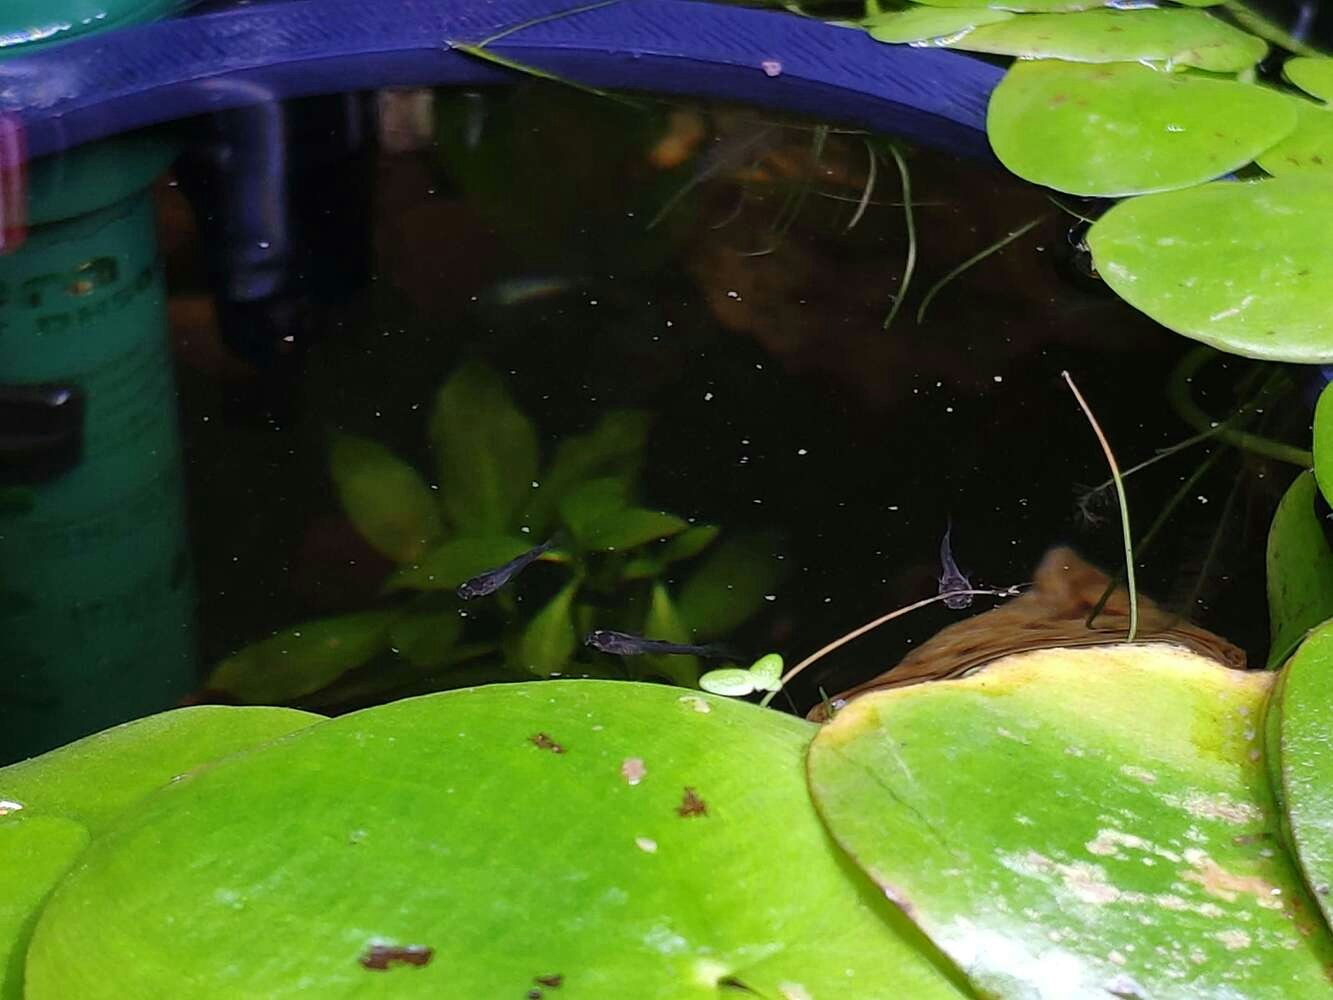
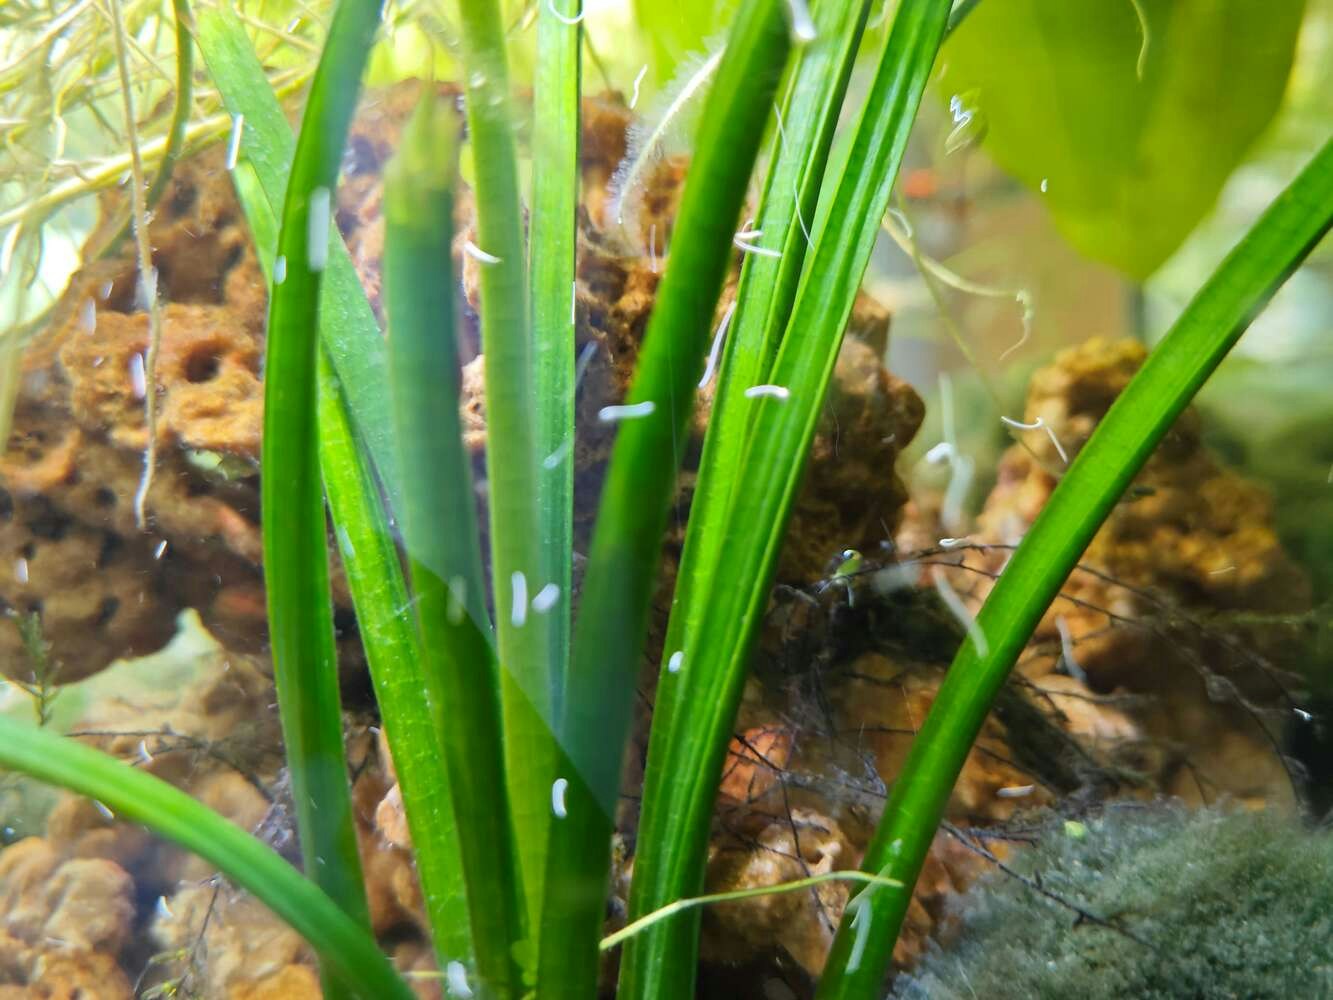
Step 3.1: Observing the changing conditions due to overbreeding and decaying detritus
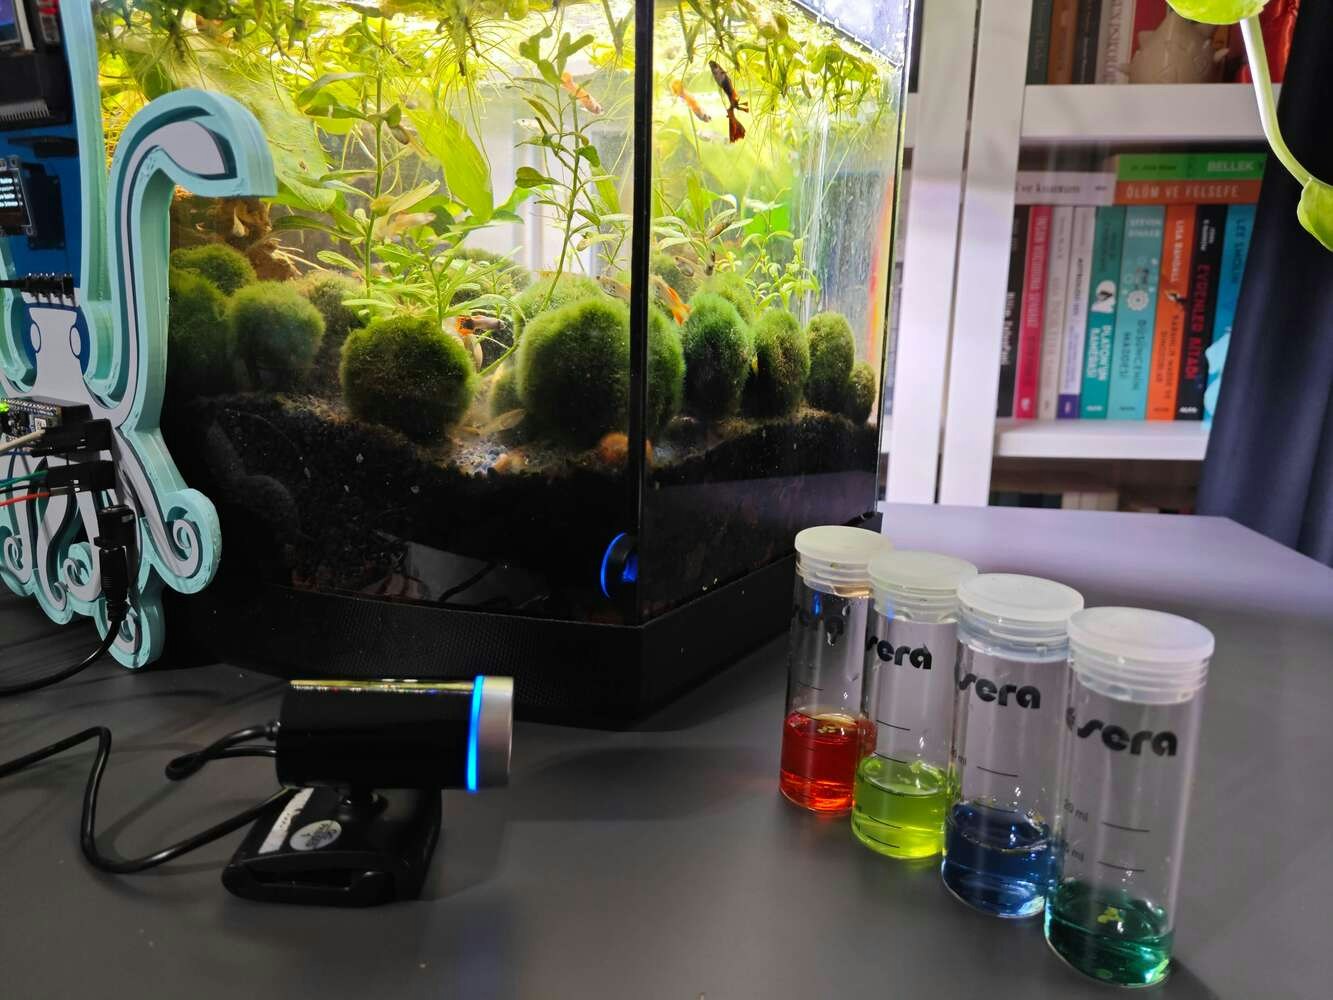
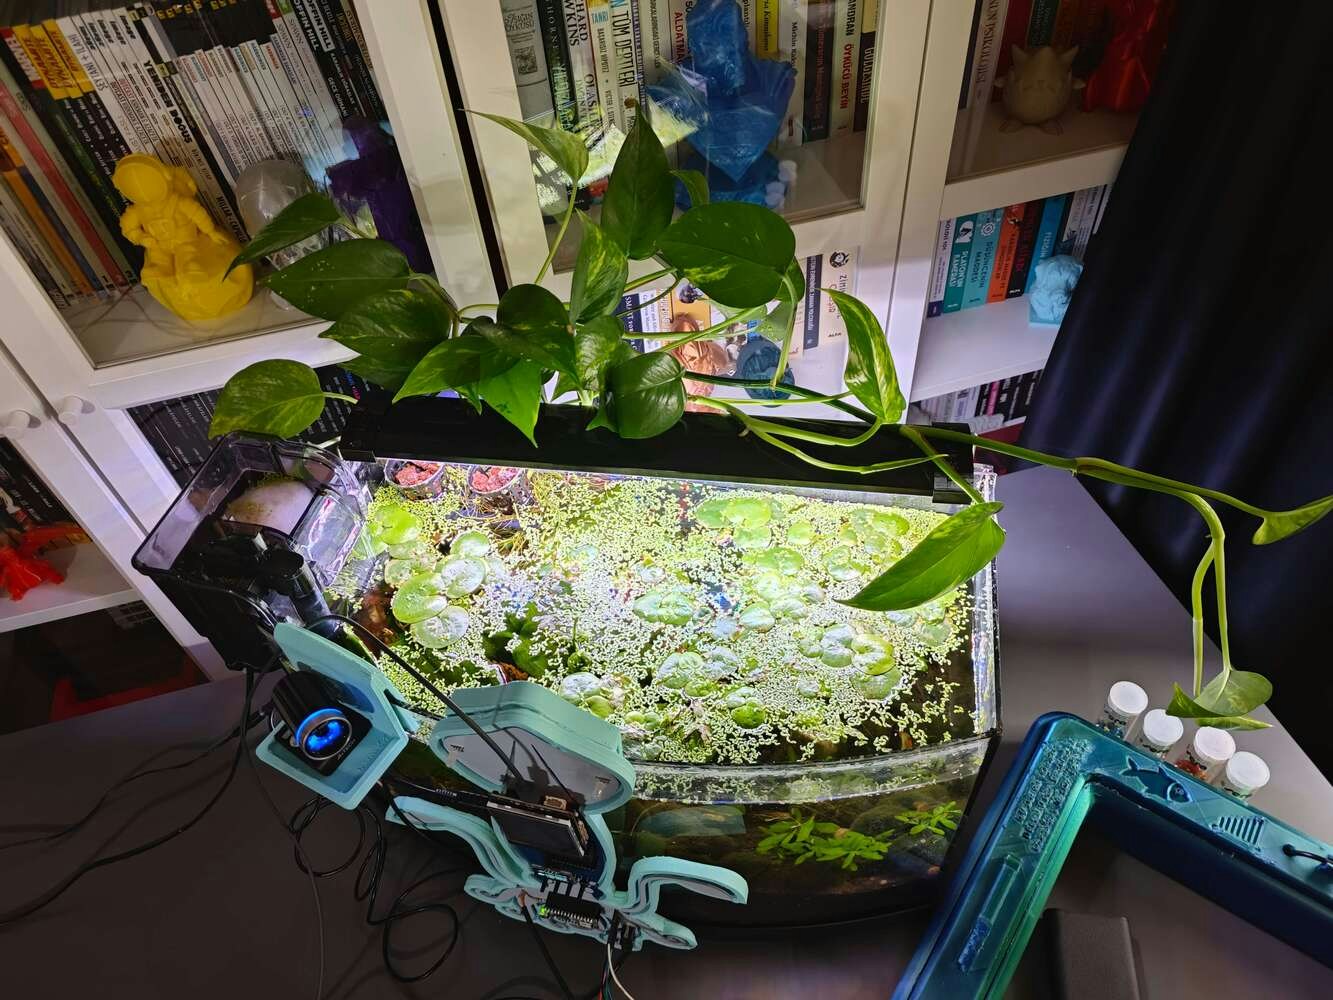
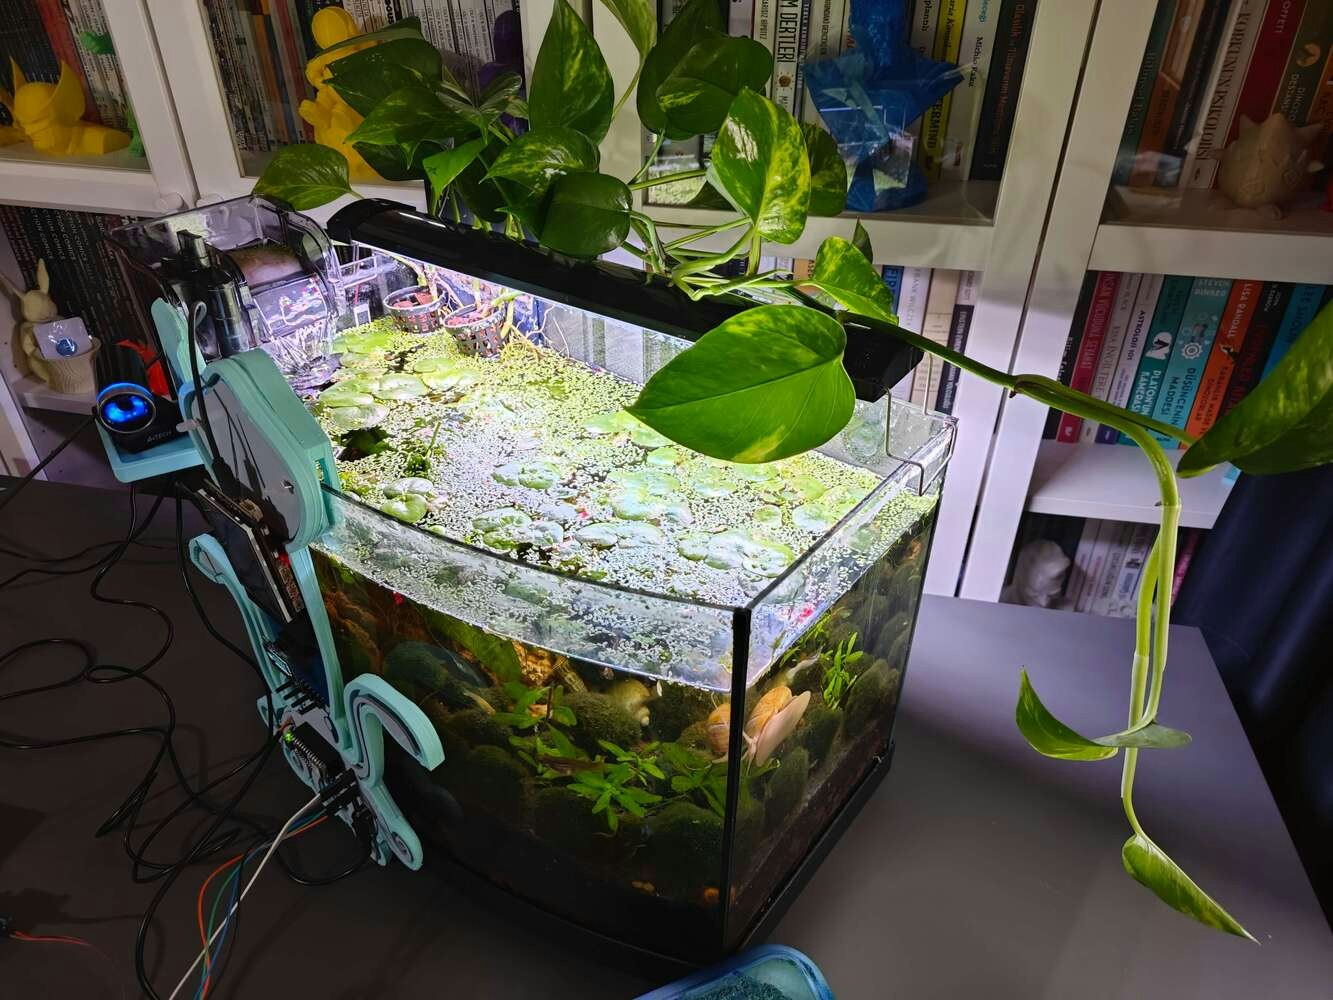
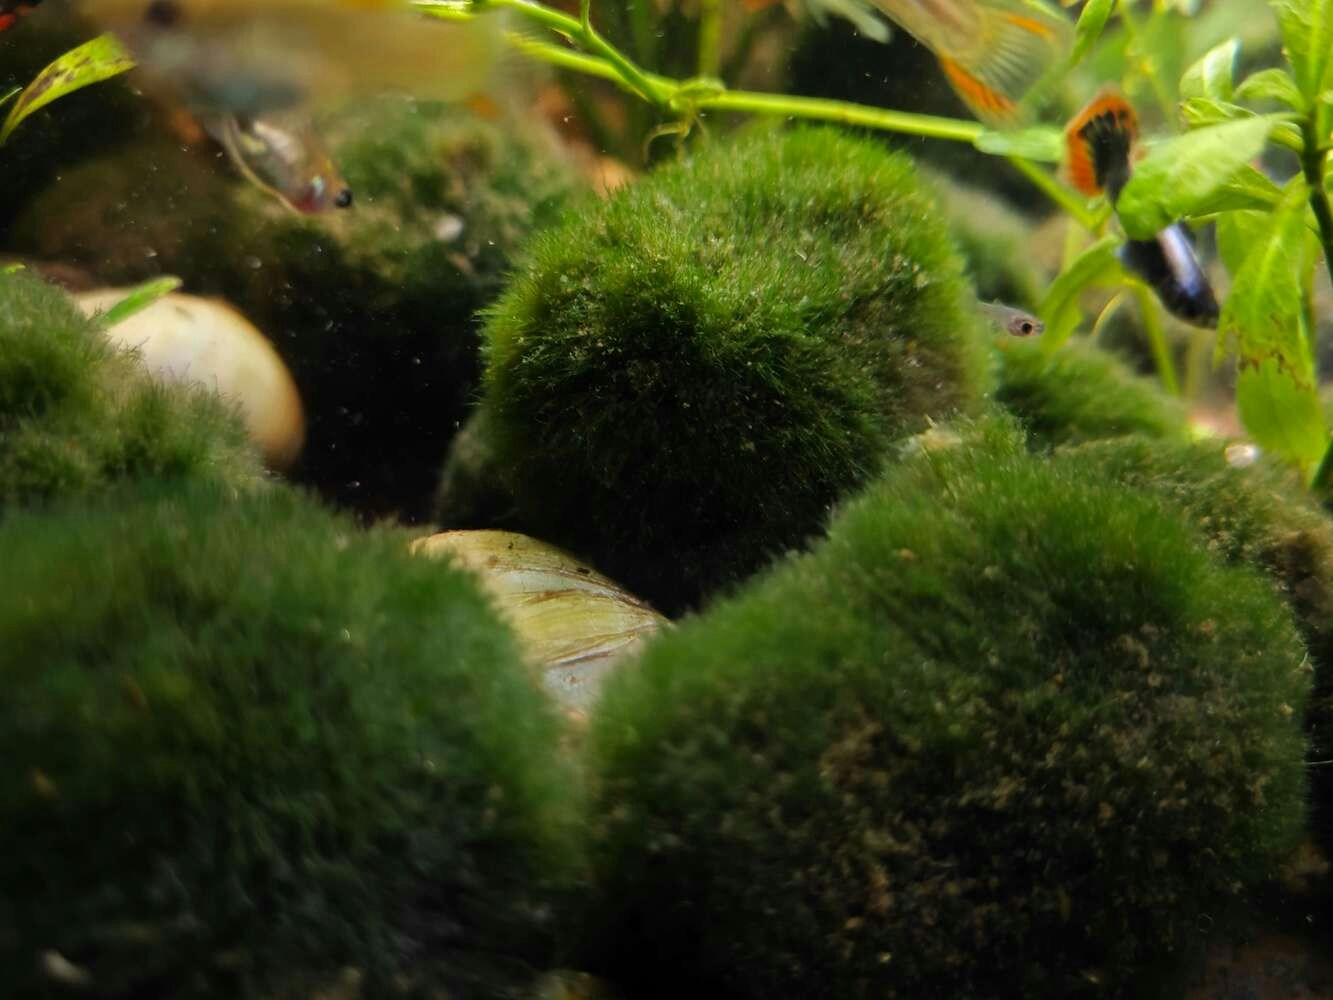
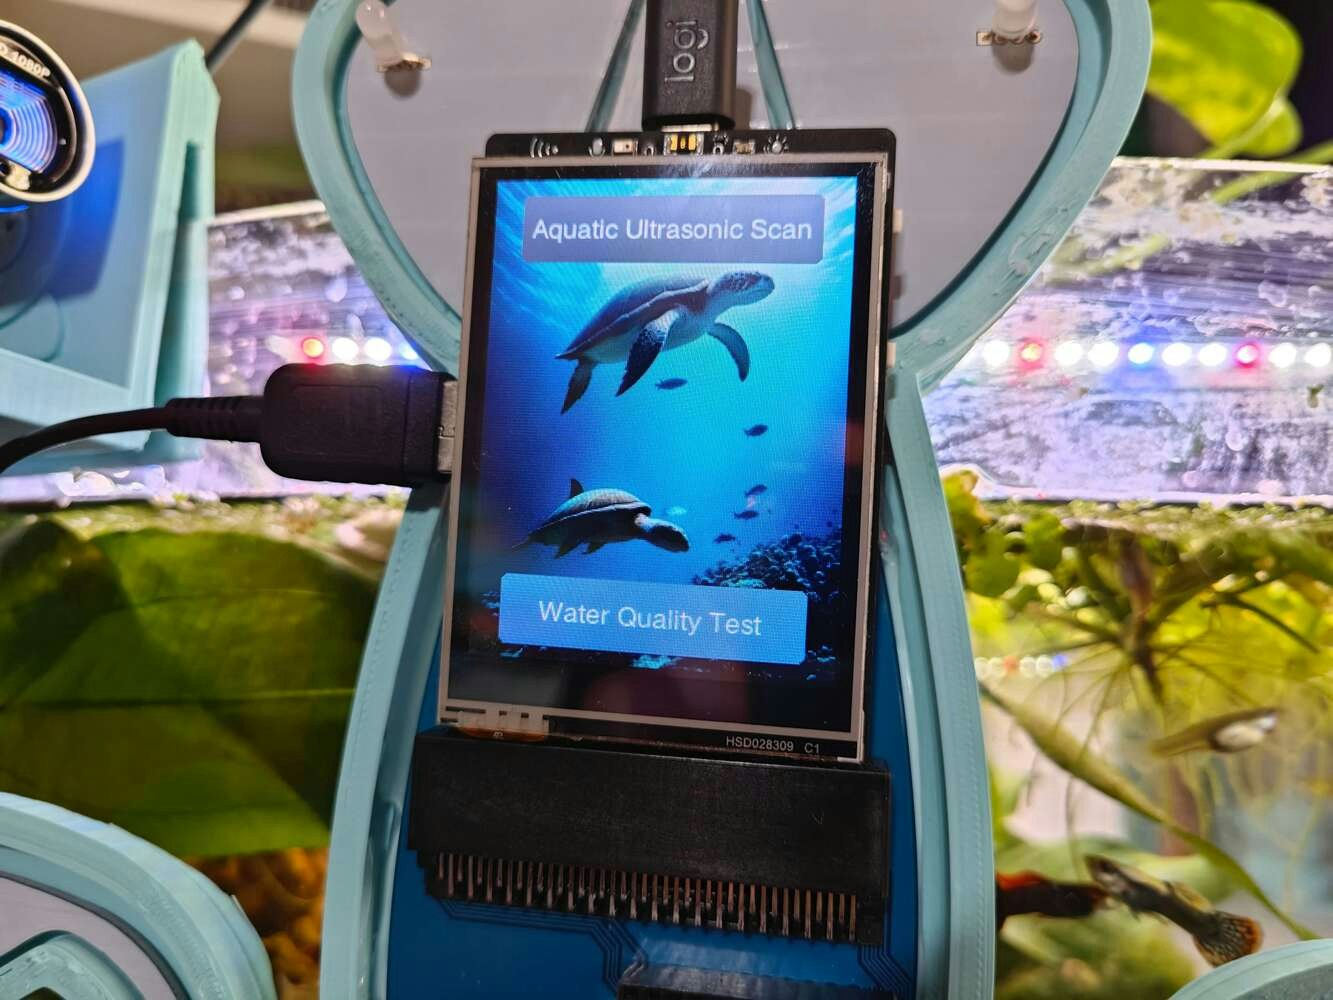
After concluding the device assembly, I hung the Squid PCB holder and the camera holder on the front side of the aquarium while collecting ultrasonic scan data buffers and capturing chemical water quality test result images. In this regard, I was able to place the high-quality USB webcam on the hang-on camera holder when standing idle and position the URM15 ultrasonic sensor precisely while scanning the underwater substrate to produce accurate ultrasonic images. Since I designed a single-unit device structure, I did not encounter any issues while conducting extended experiments. To increase the bottom surface area and observe abundant noxious air bubbles while collecting ultrasonic scan data, I added umpteen marimo moss balls covering the bottom of the tank. In this regard, I was able to provide plentiful underwater substrate gaps for incipient air bubbles to accumulate.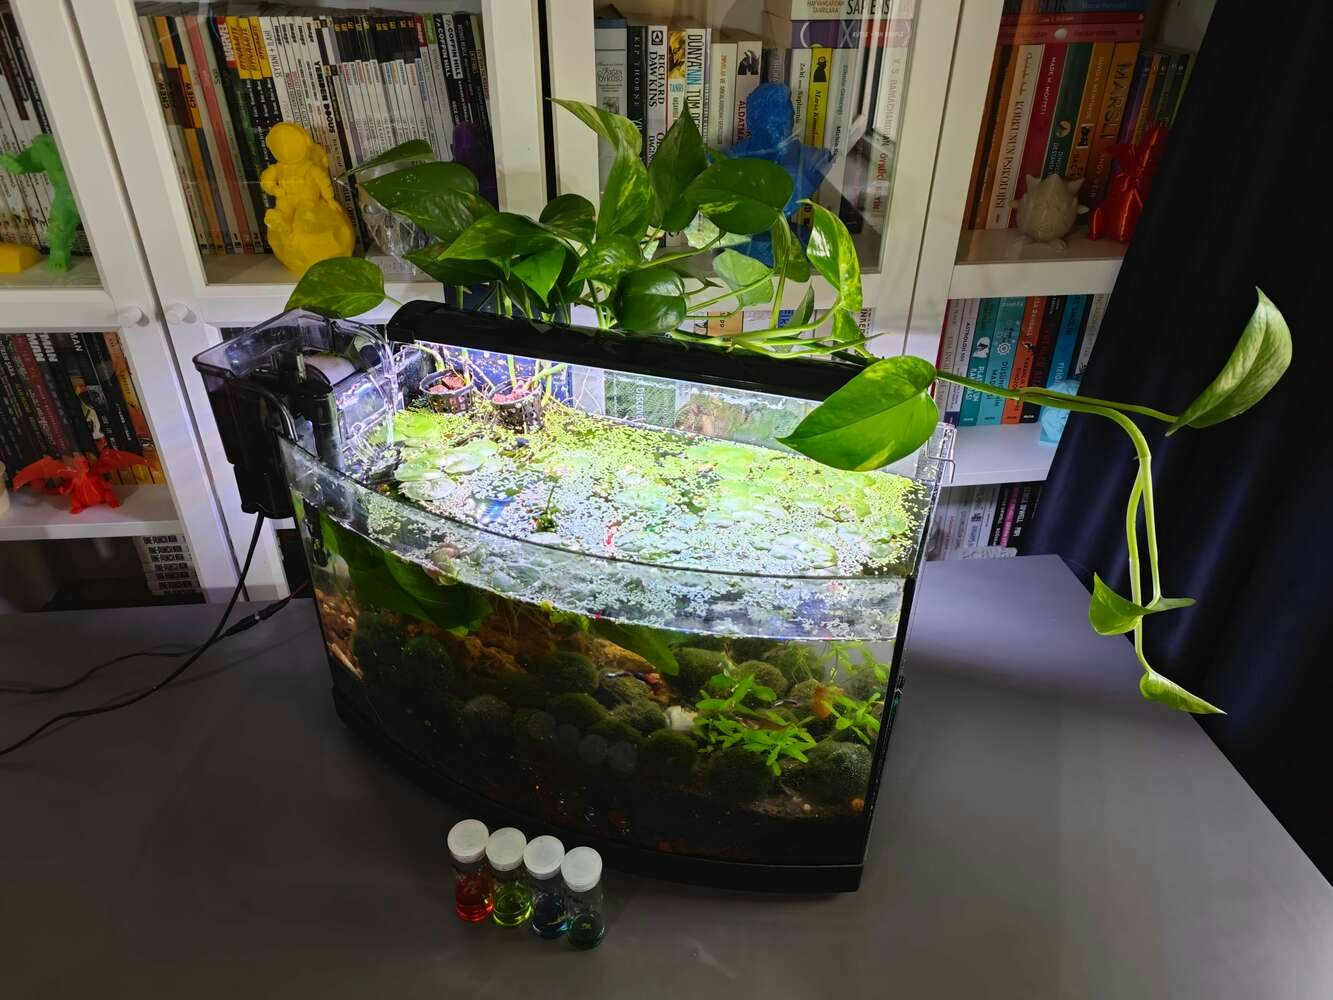
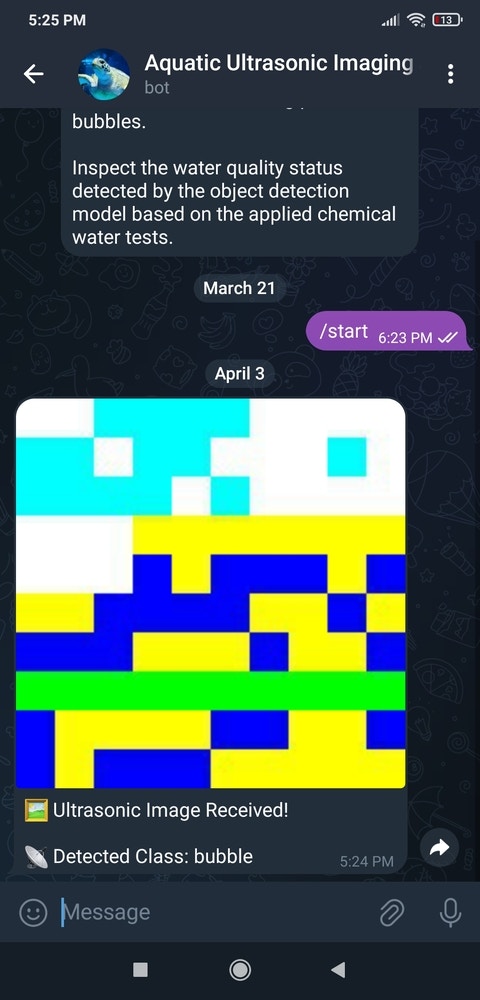
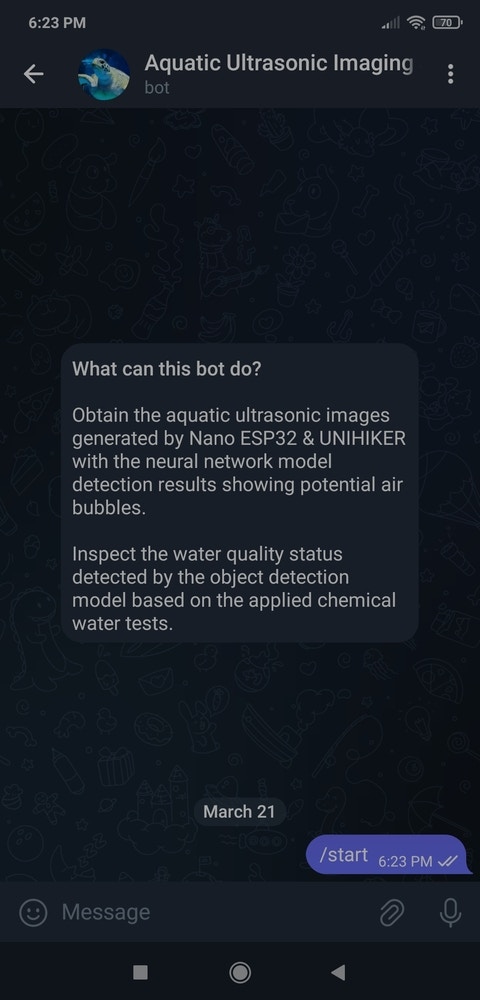
Step 4: Building a Telegram bot with BotFather to send push notifications
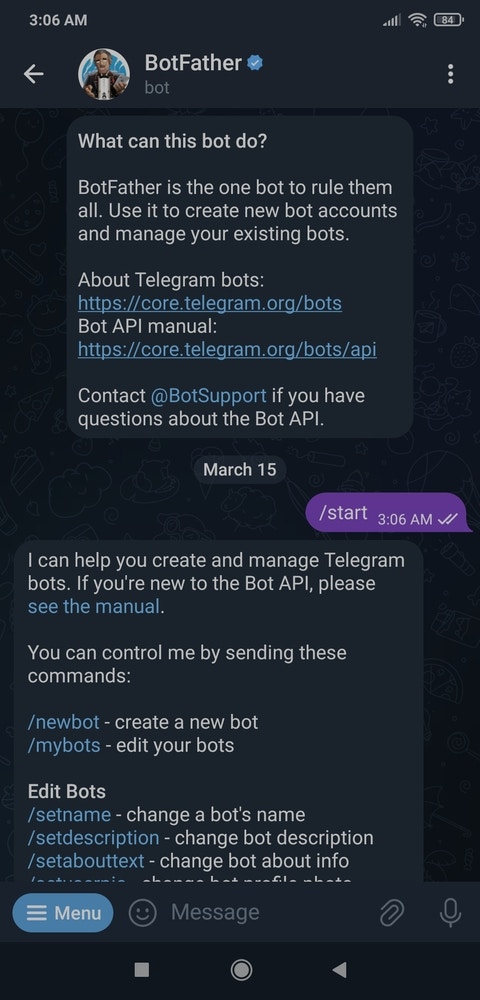
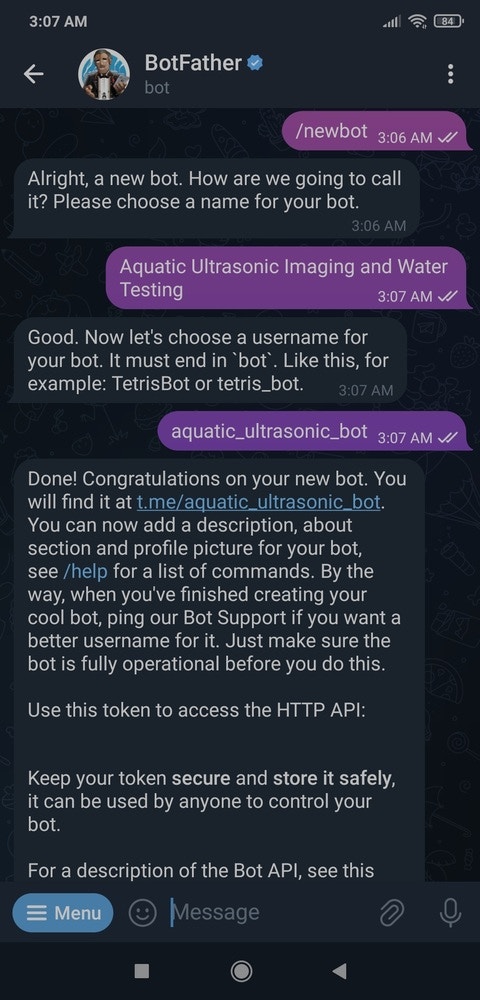
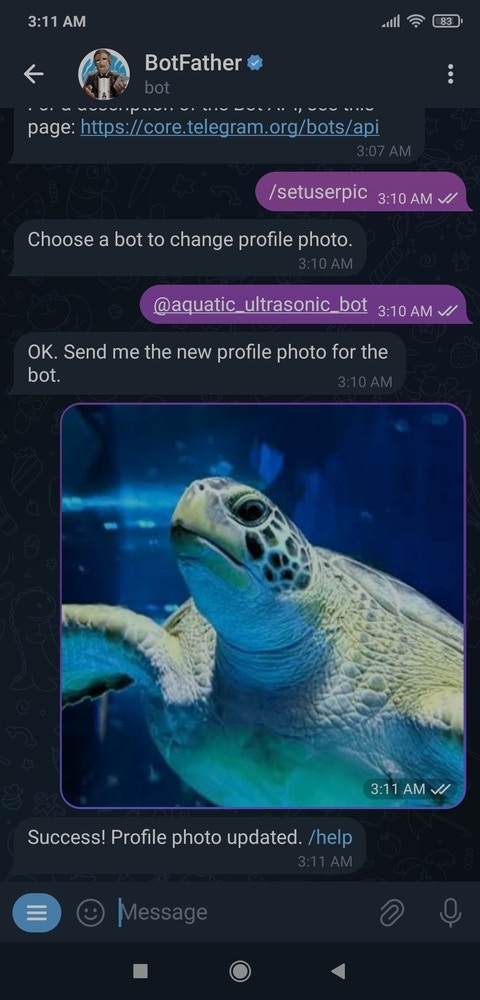
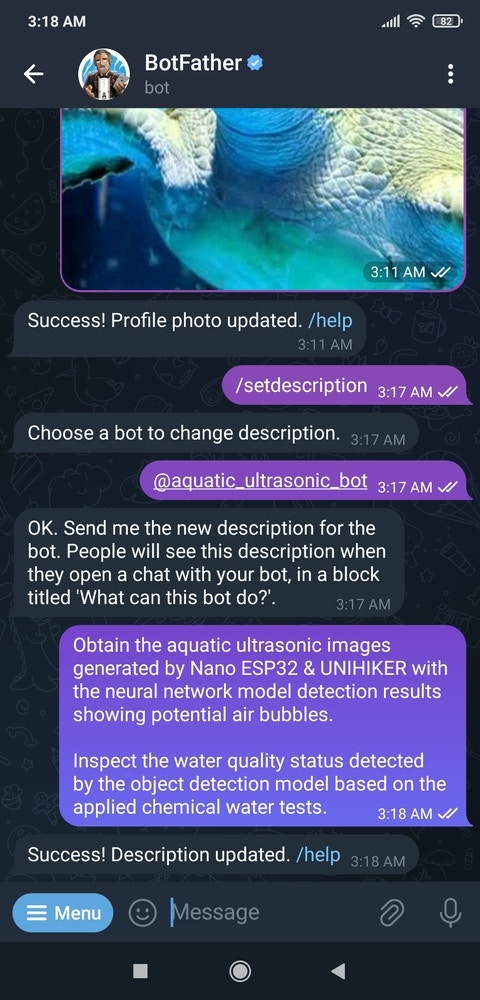
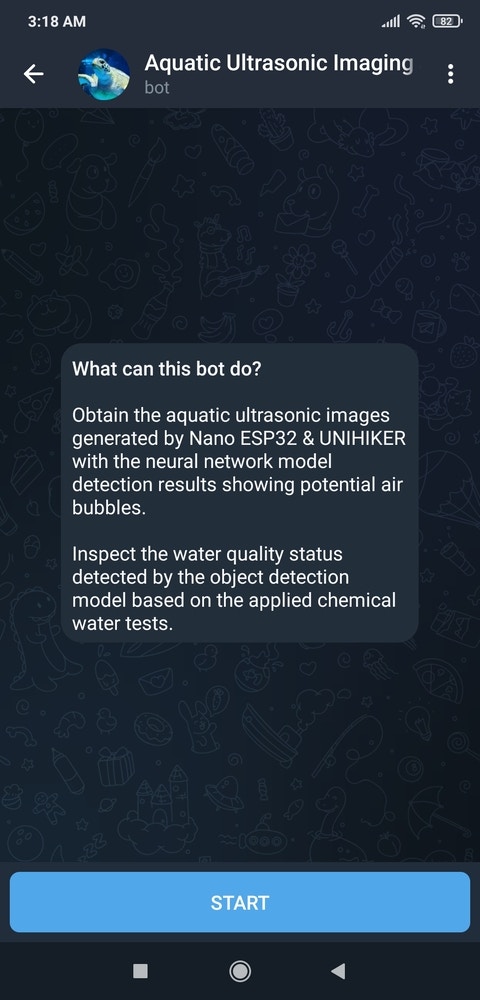
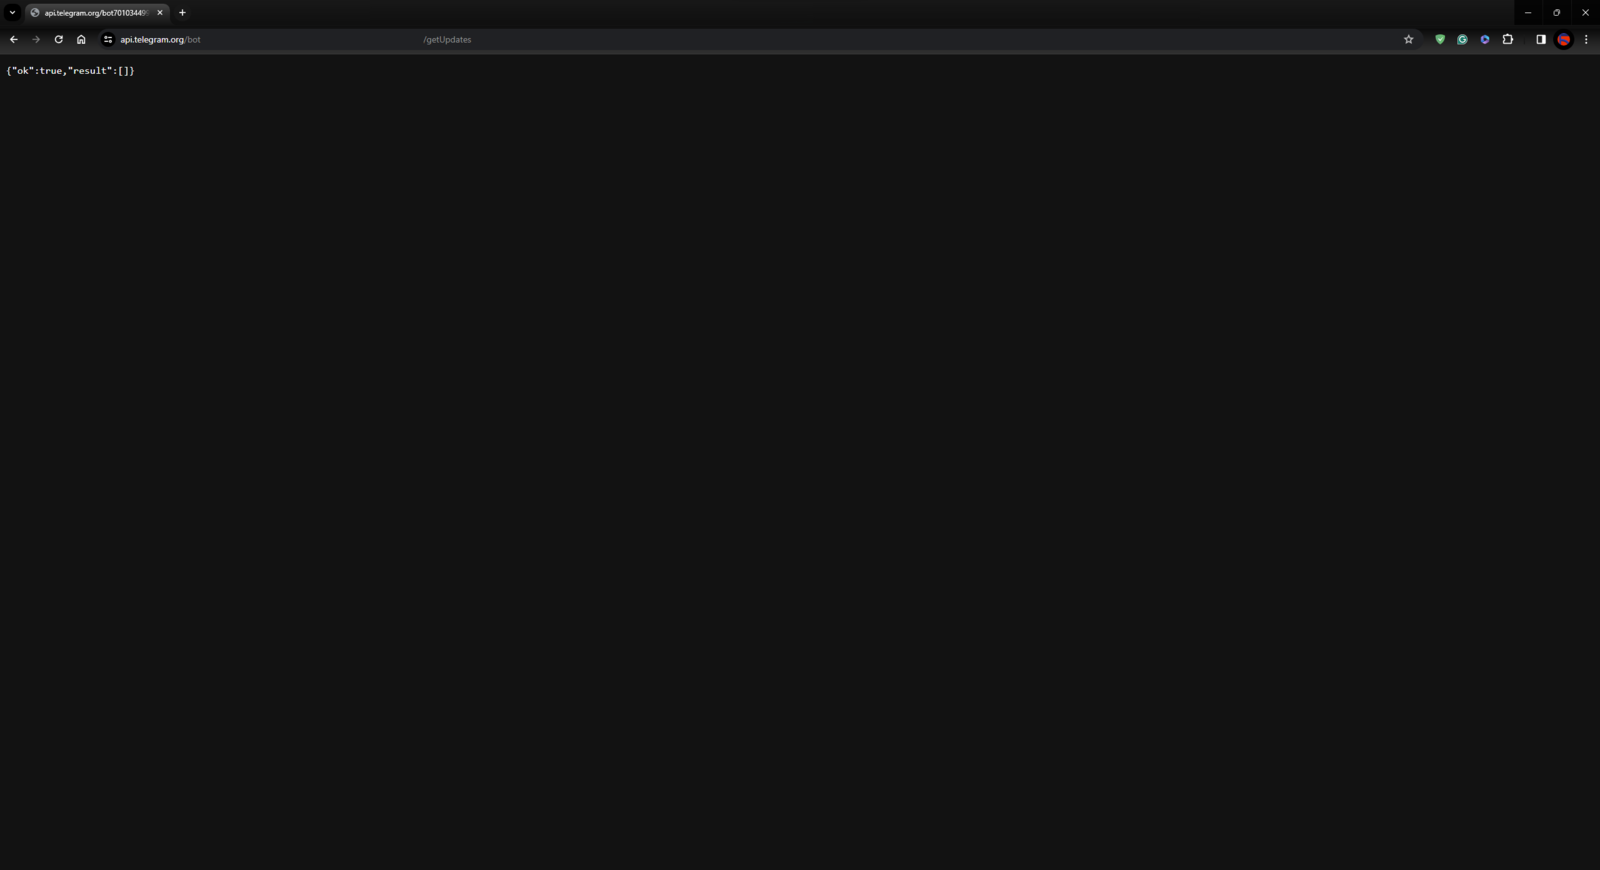
BotFather is an official Telegram bot that lets the user build and manage bots within the Telegram app without any coding or subscription required. I utilized BotFather to create a simple Telegram bot to inform the user via push notifications. :hash: First of all, open BotFather on Telegram and enter /start to view the available command list and instructions.
https://api.telegram.org/bot<_token_>/getUpdates
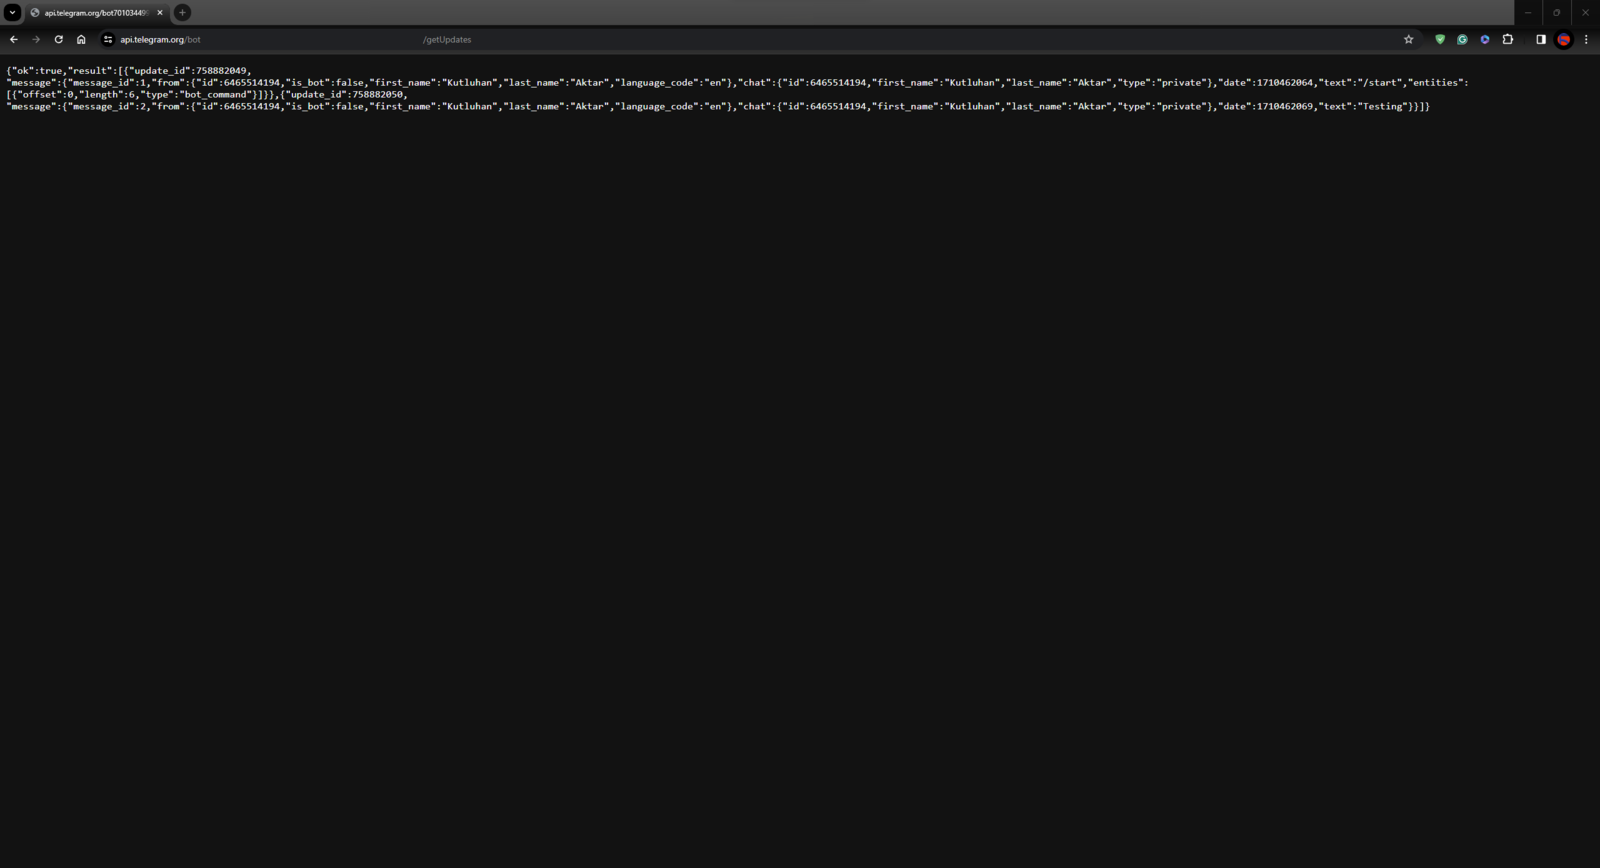
:hash: Then, initiate a new chat and send a message to the given Telegram bot. After refreshing the page, it should display the Update object list, including the chat id:
- message ➡ chat ➡ id ➡ 6465514194
Step 5: Developing a web application to communicate w/ UNIHIKER and process requests from Nano ESP32
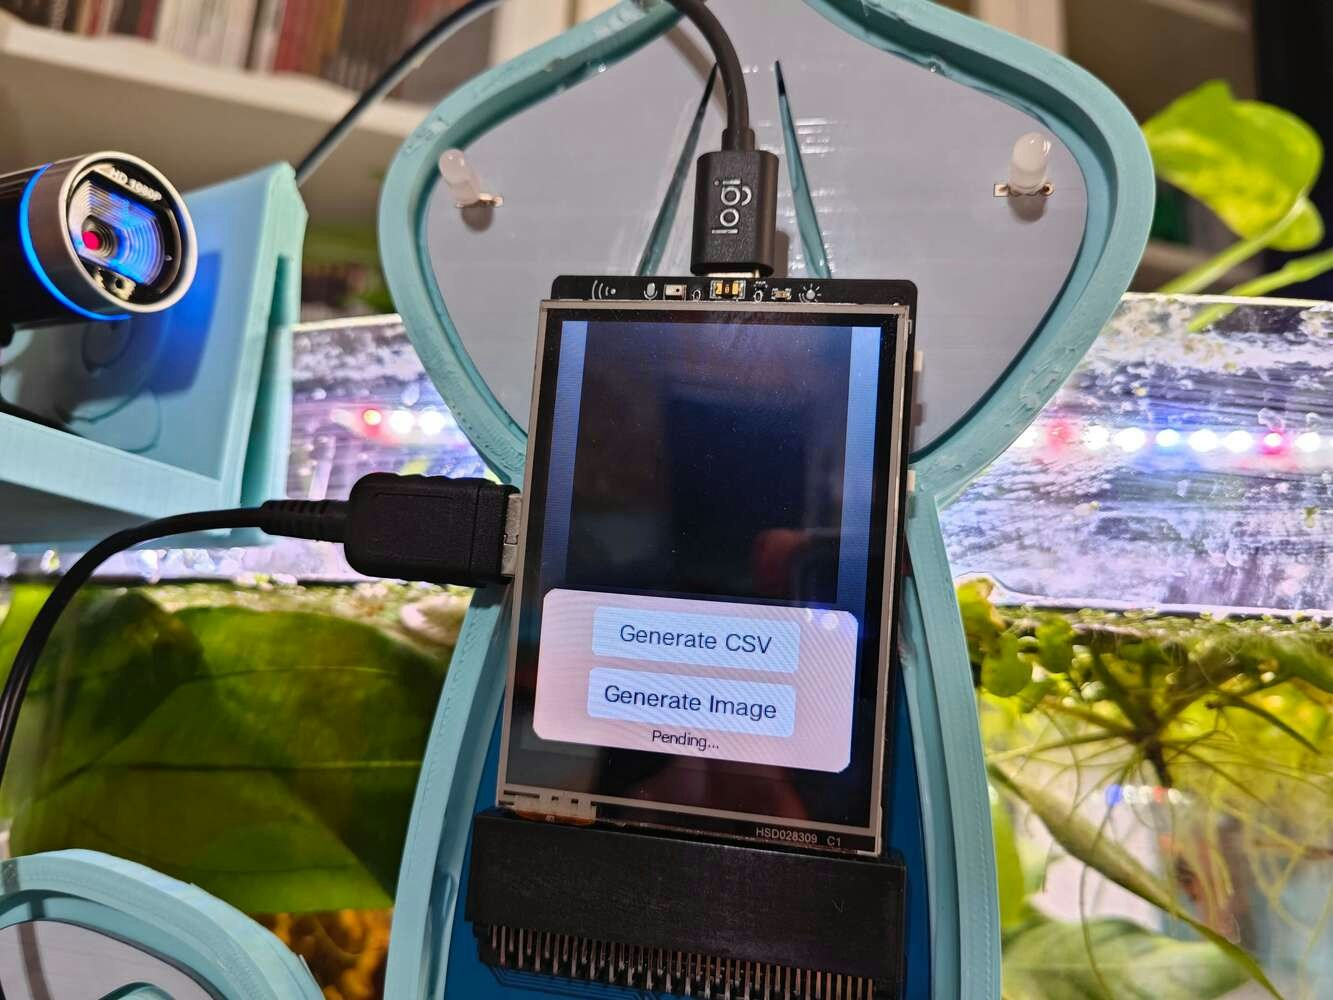
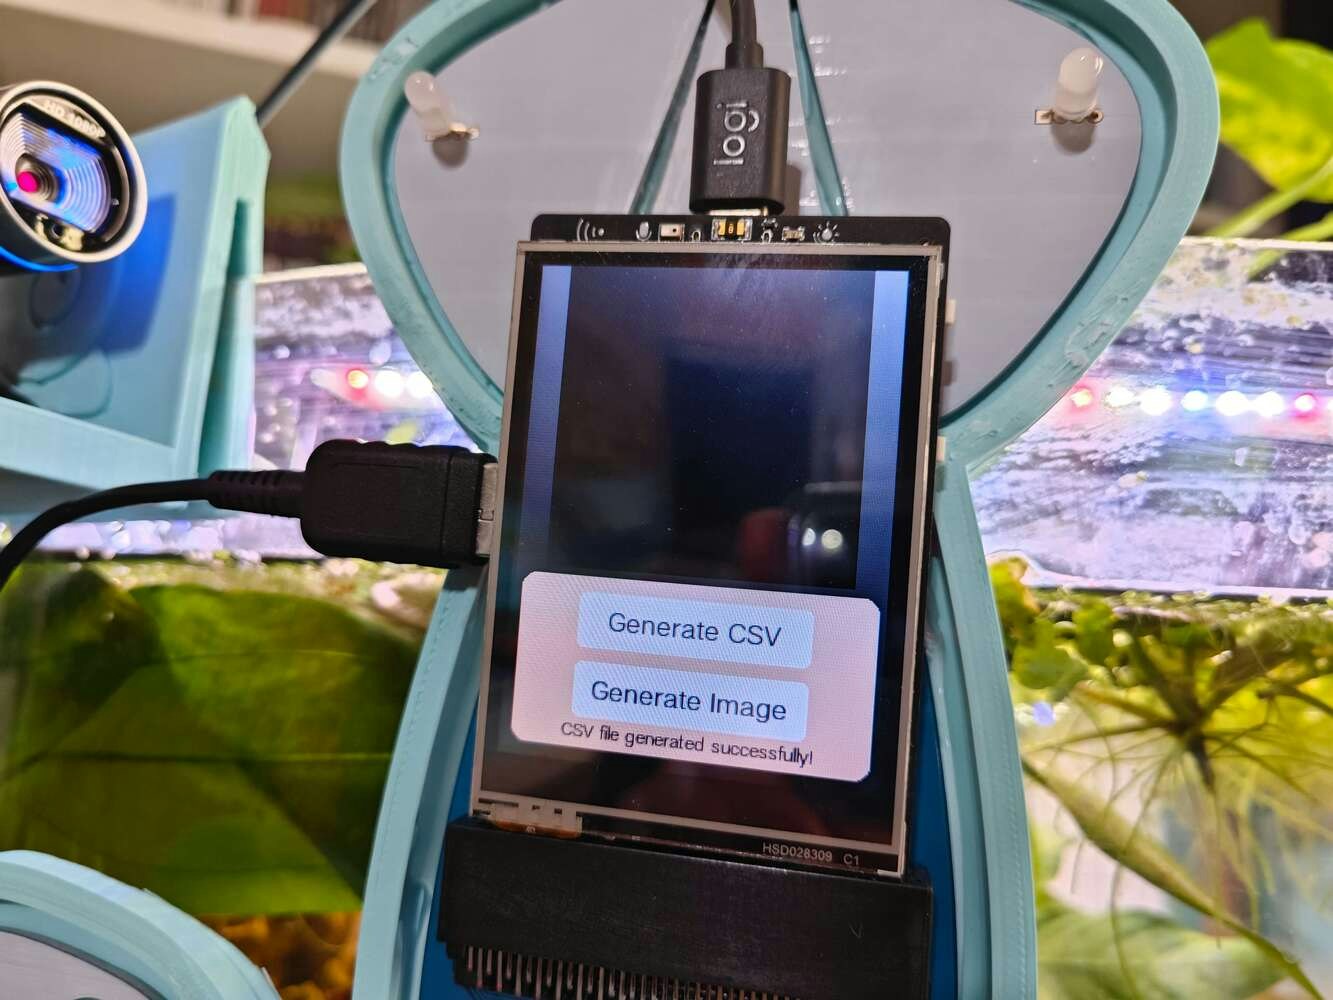
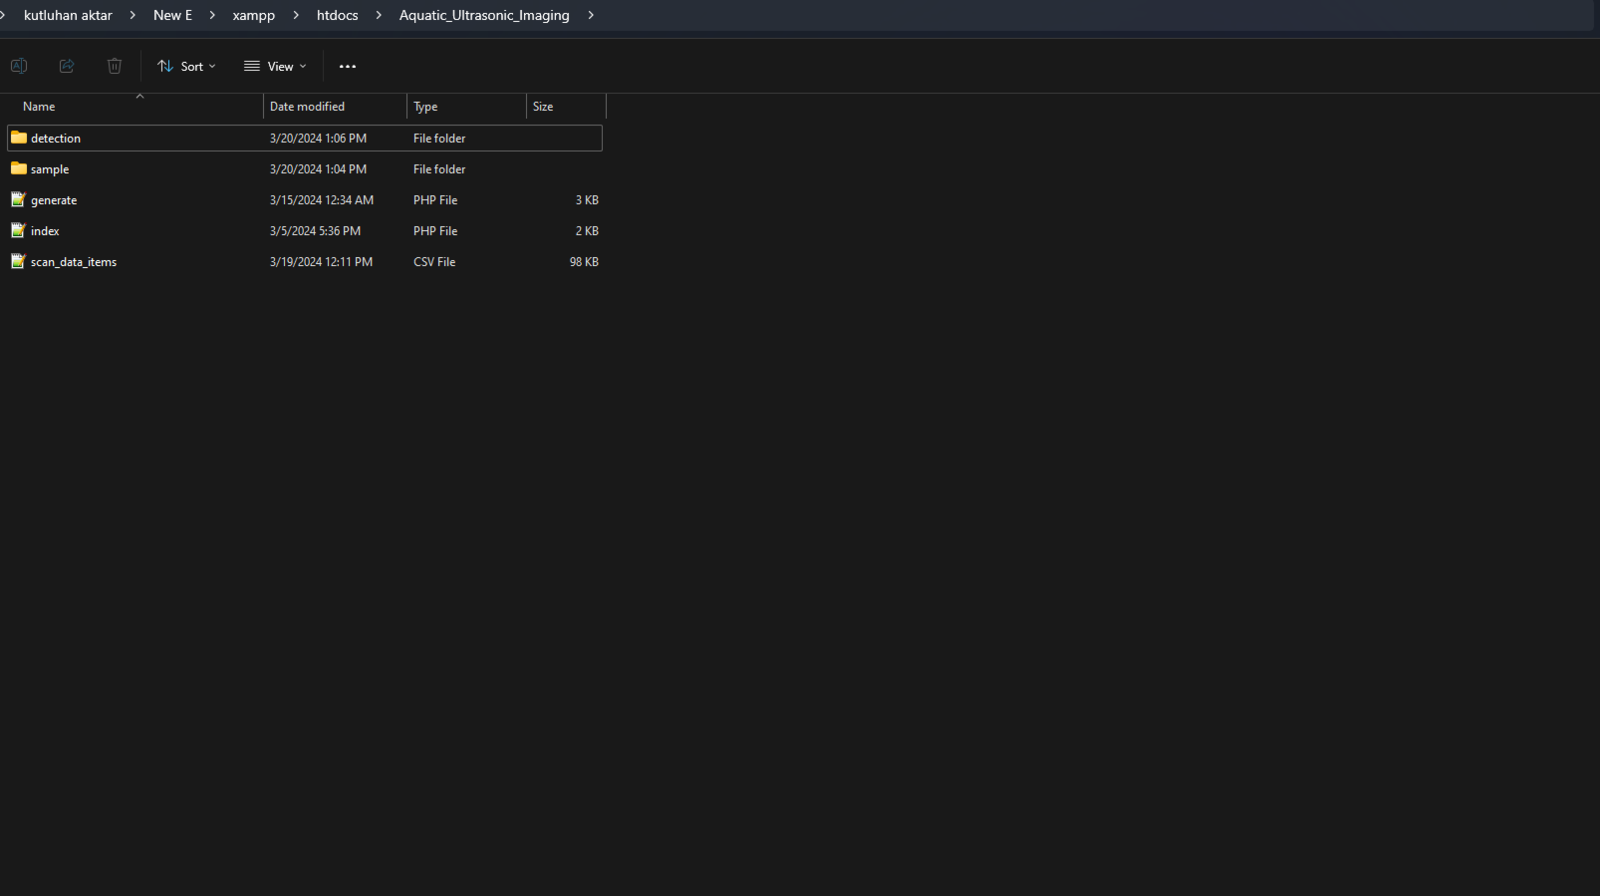
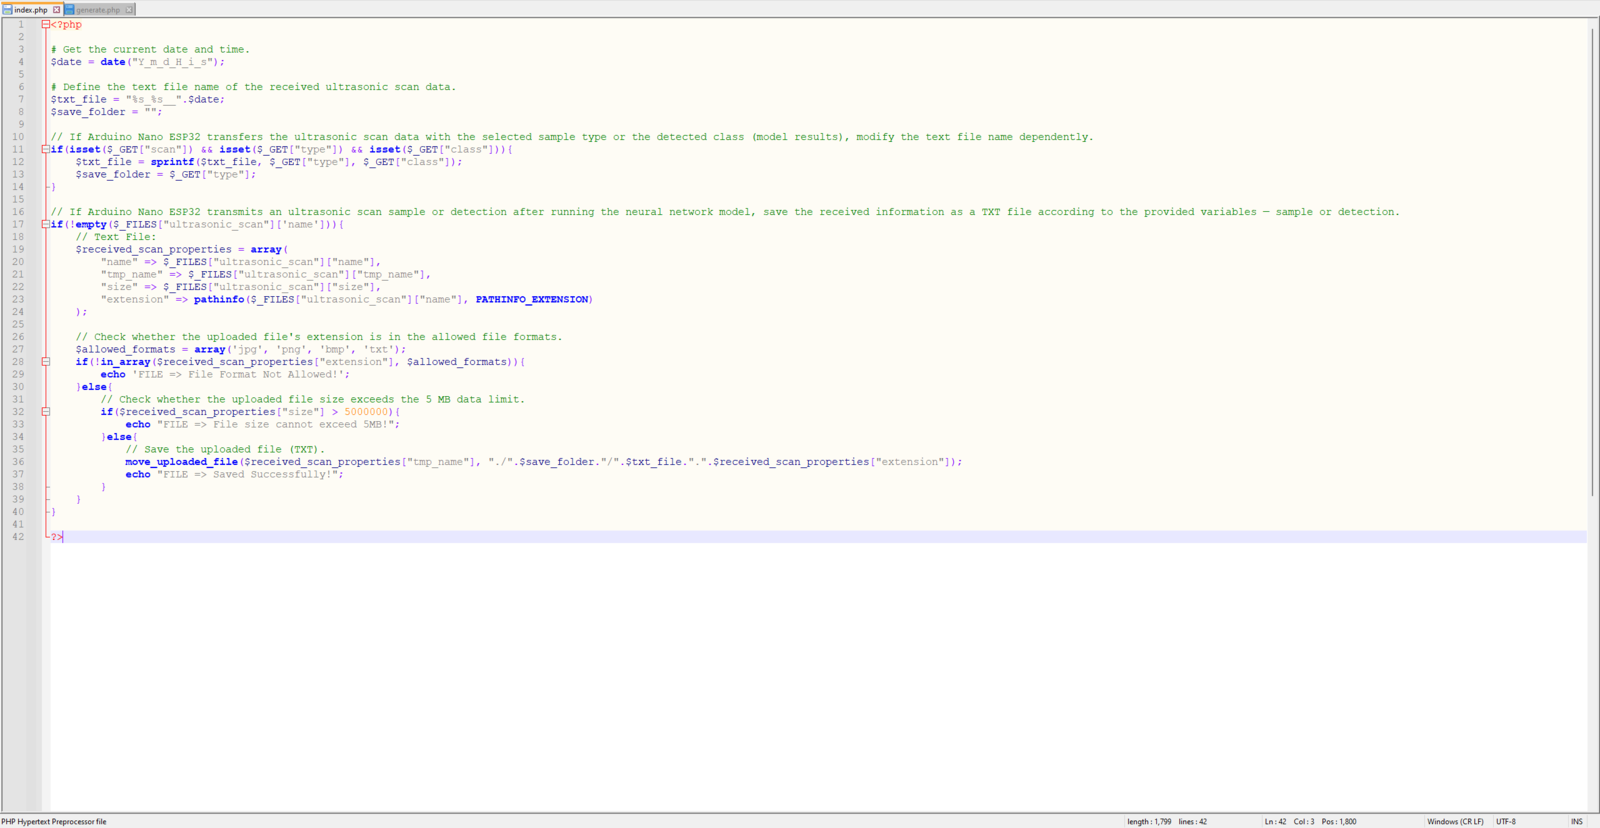
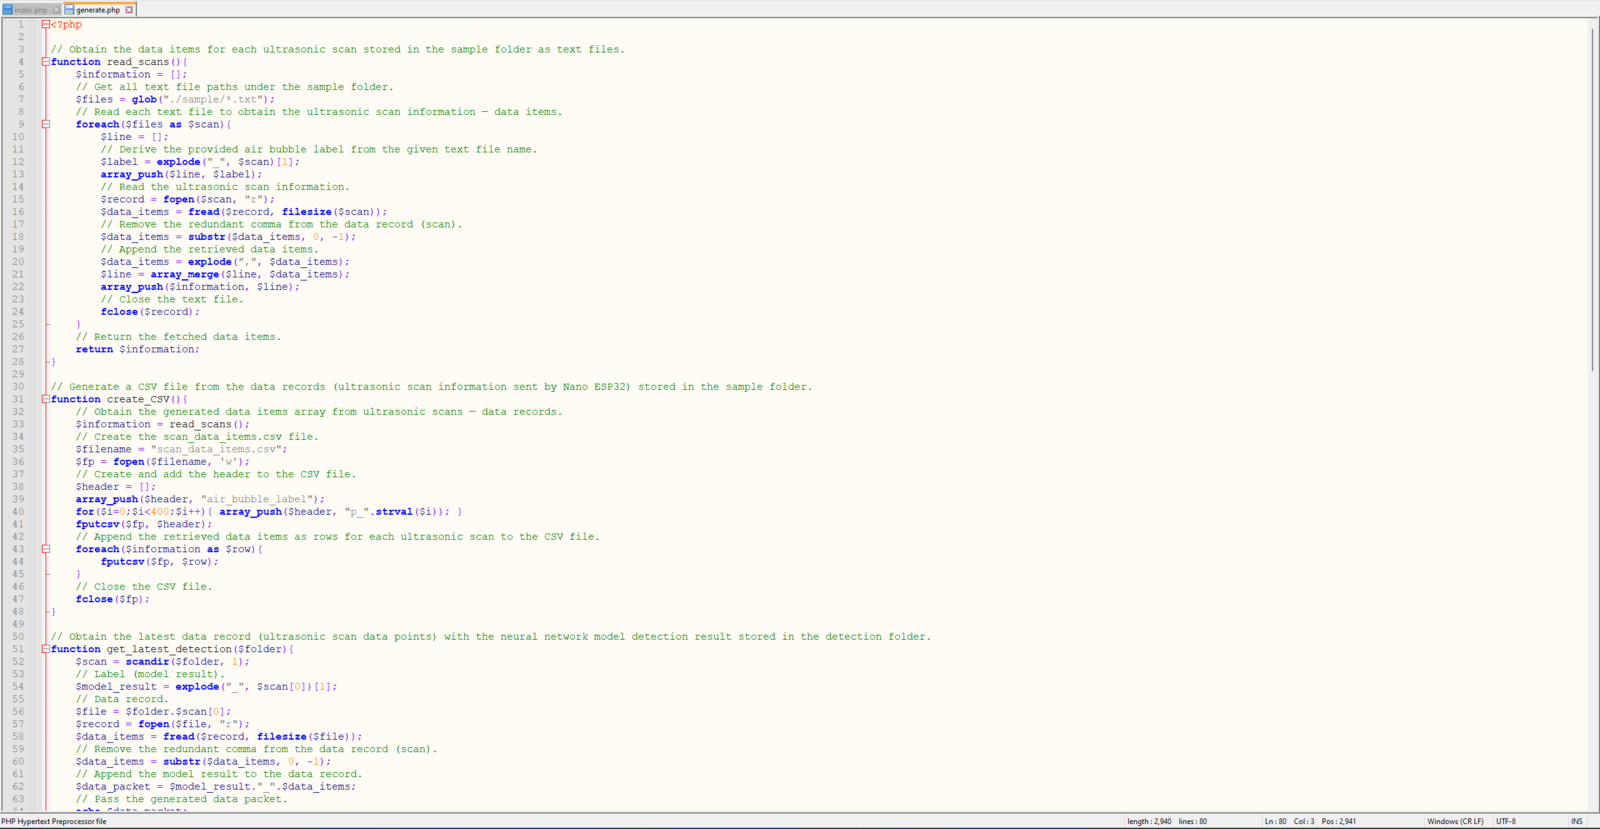
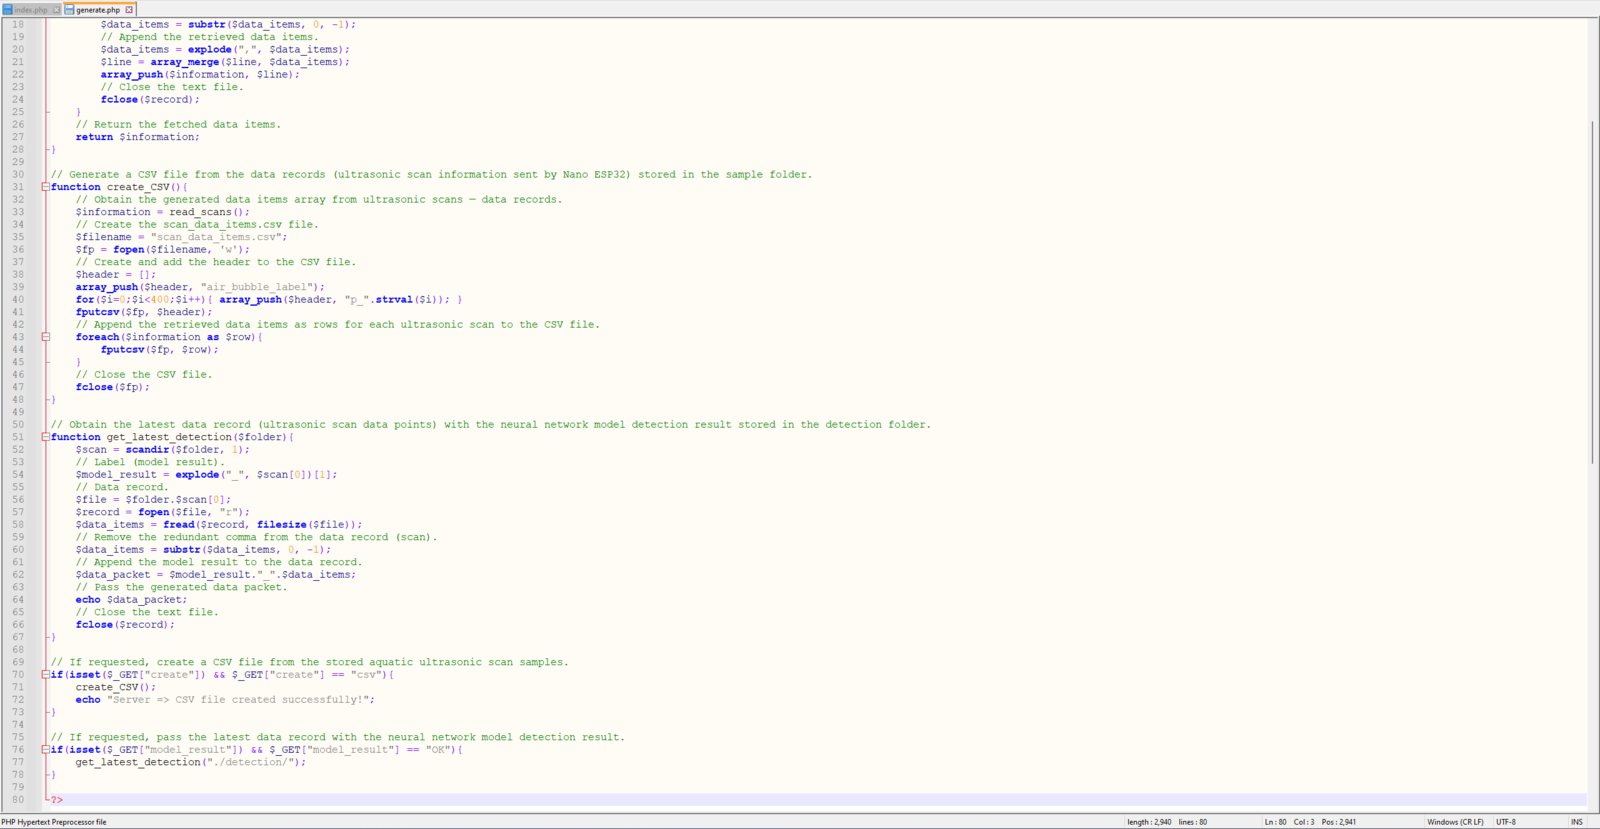
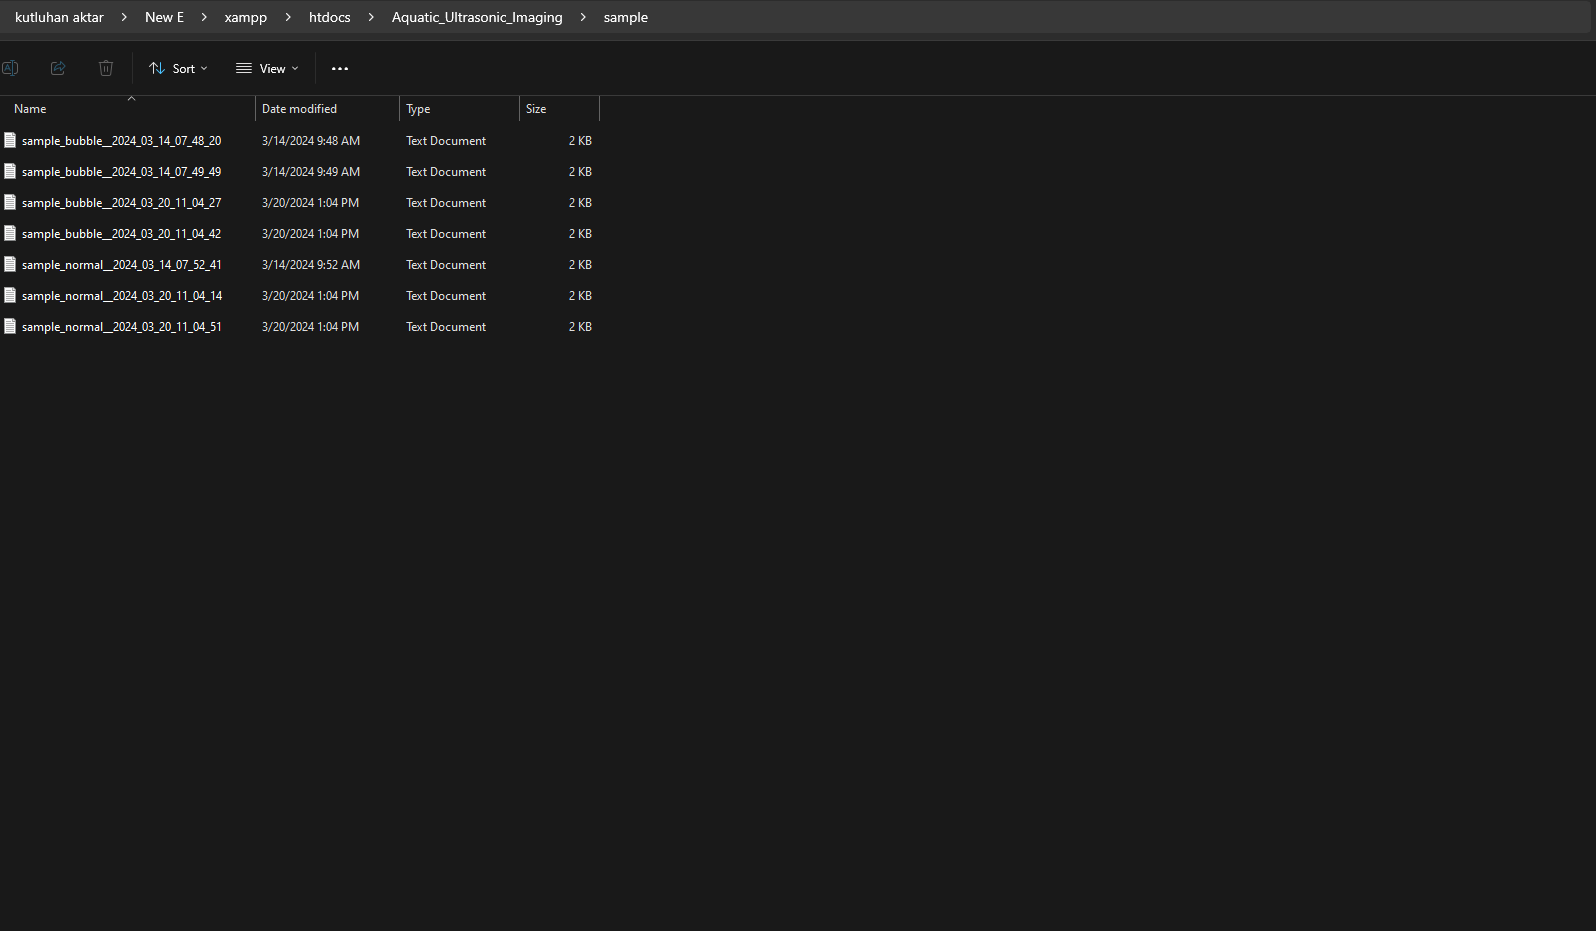
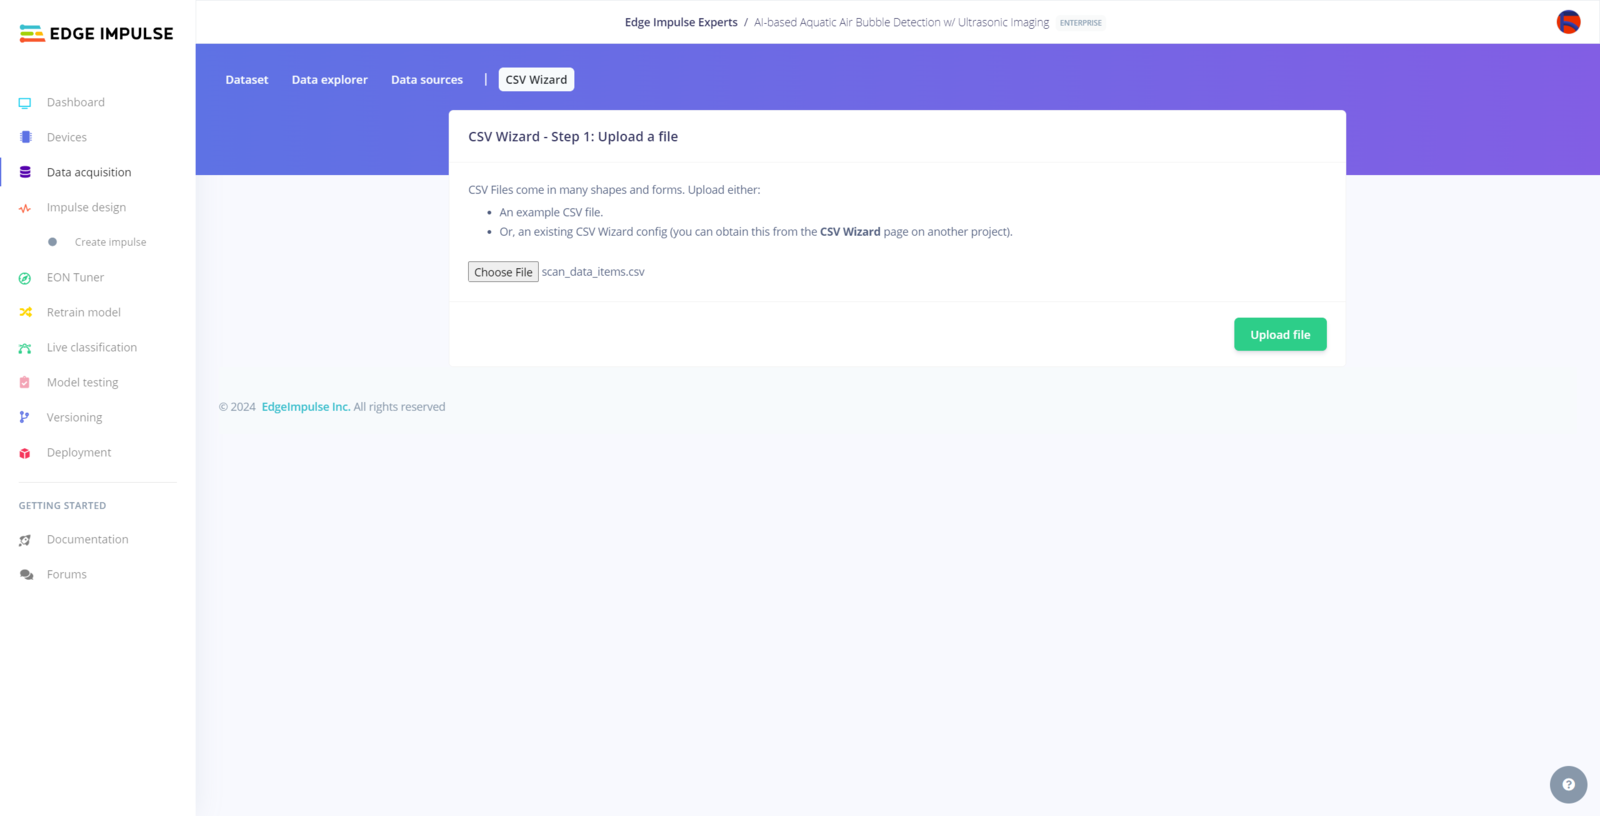
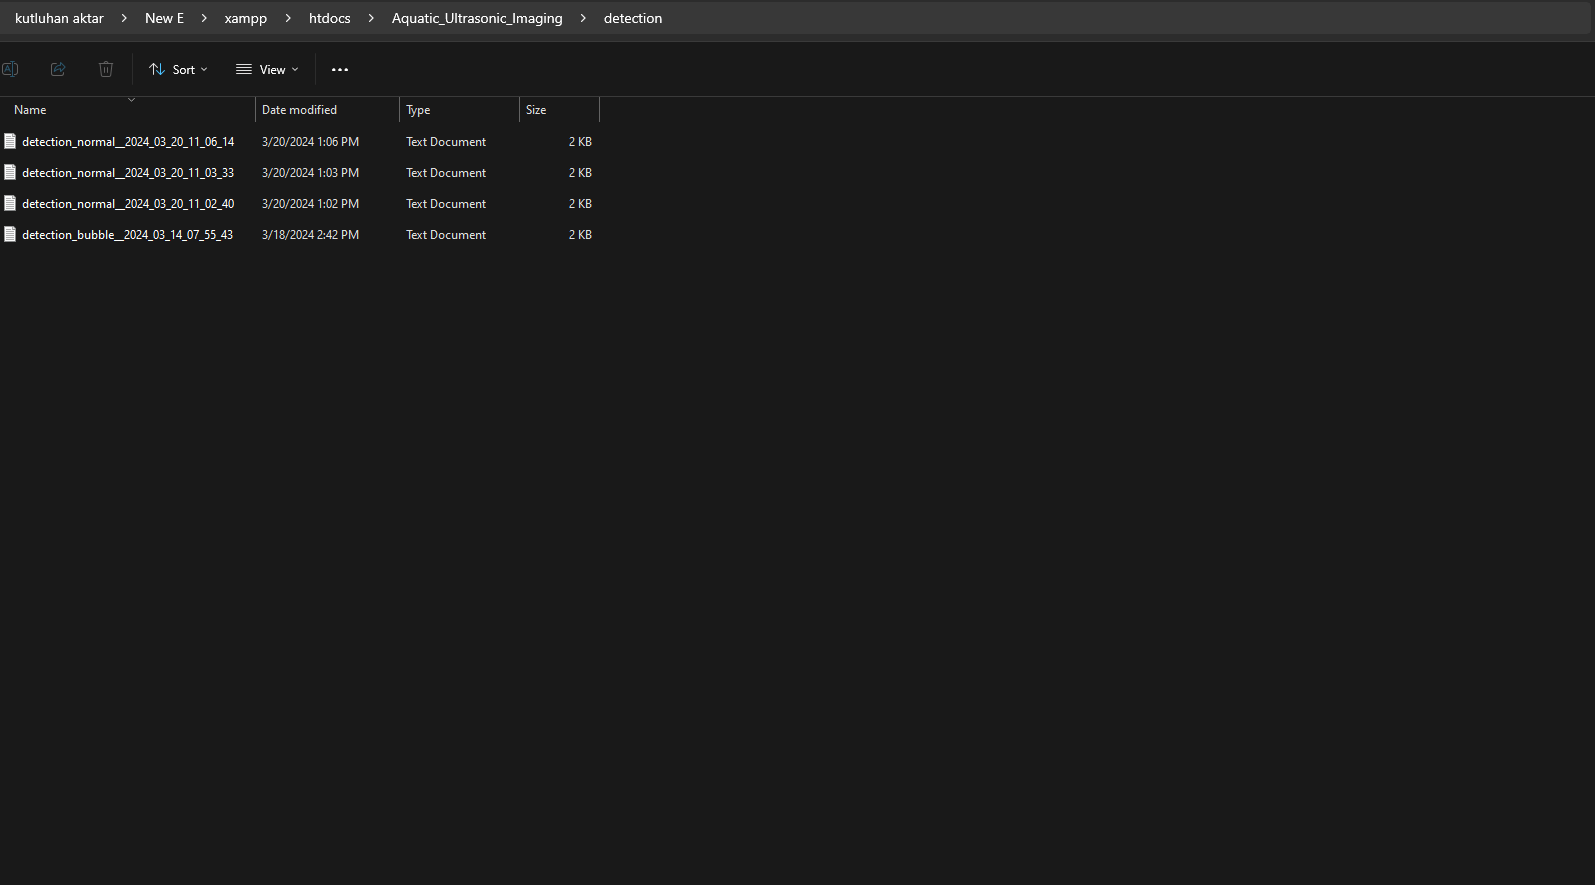
Since I needed to obtain the ultrasonic scan data buffers and the given air bubble class from Nano ESP32 so as to save the data records as text (TXT) files, I decided to develop a basic web application. Also, the web application can generate a pre-formatted CSV file from the stored data records (text files) when requested via an HTTP GET request to construct a data set effortlessly. In addition to the data collection features, similar to the ultrasonic scan samples, the web application can save model detection results transferred by Nano ESP32 via an HTTP POST request — buffer passed to the neural network model and the detected air bubble label — as text files in a separate folder. As shown below, the web application consists of two folders and two code files:- /detection
- /sample
- generate.php
- index.php
- scan_data_items.csv
Step 5.1: Setting and running the web application on LattePanda 3 Delta
Since I wanted to build a feasible and accessible AIoT underwater air bubble and water pollution detection device not dependent on cloud or hosting services, I decided to host my web application on LattePanda 3 Delta 864. Therefore, I needed to set up a LAMP web server. LattePanda 3 Delta is a pocket-sized hackable computer that provides ultra performance with the Intel 11th-generation Celeron N5105 processor. Plausibly, LattePanda 3 Delta can run the XAMPP application. So, it is effortless to create a server with a MariaDB database on LattePanda 3 Delta. :hash: Install and set up the XAMPP development environment.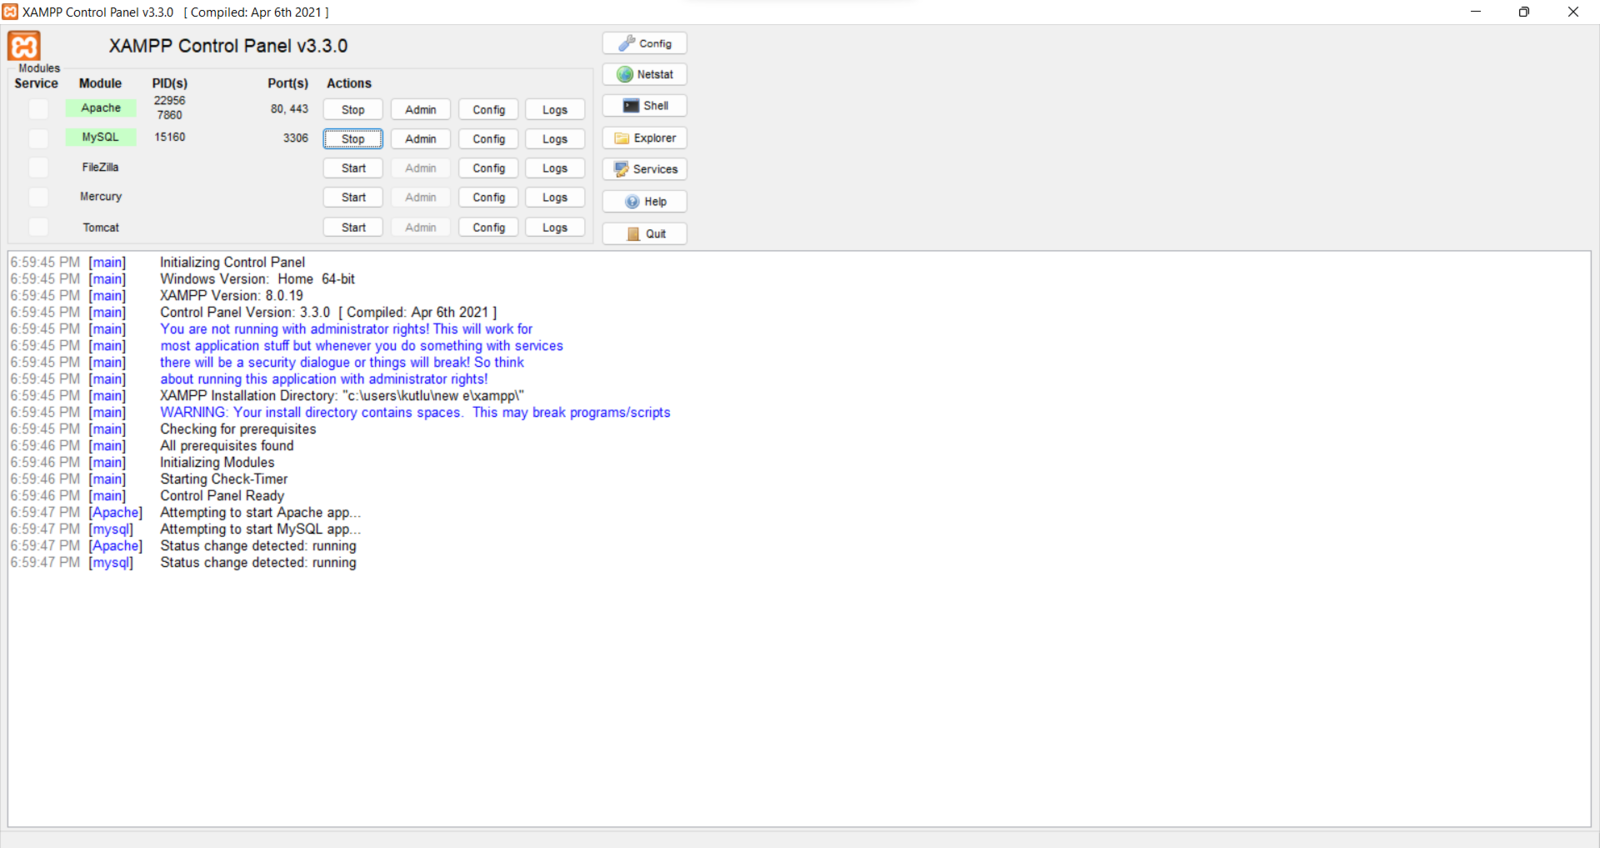
Step 6: Setting up Nano ESP32 on Arduino IDE
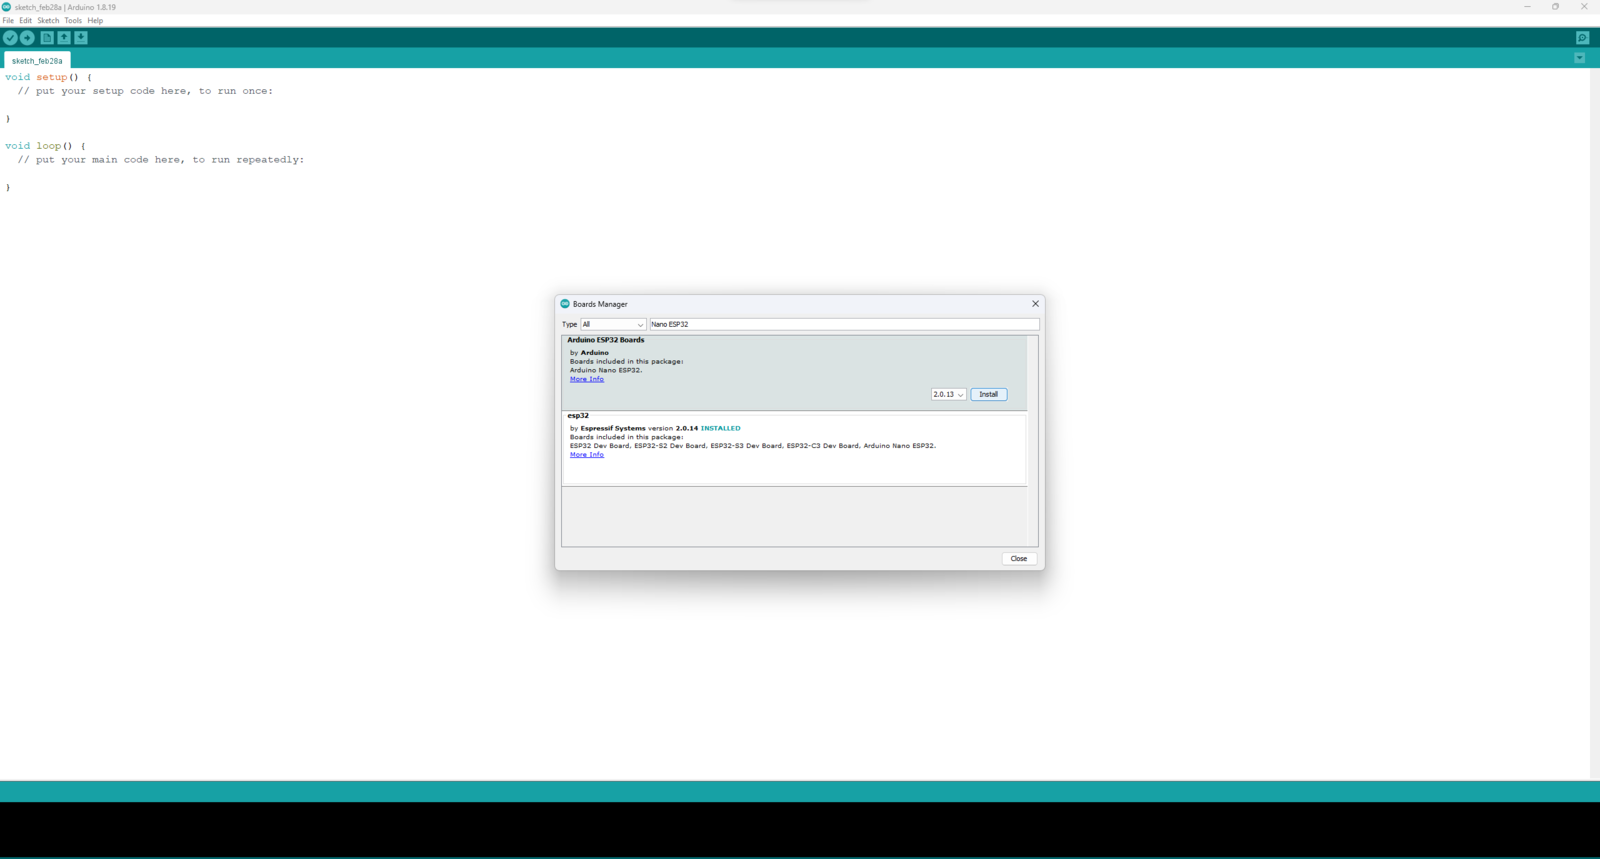
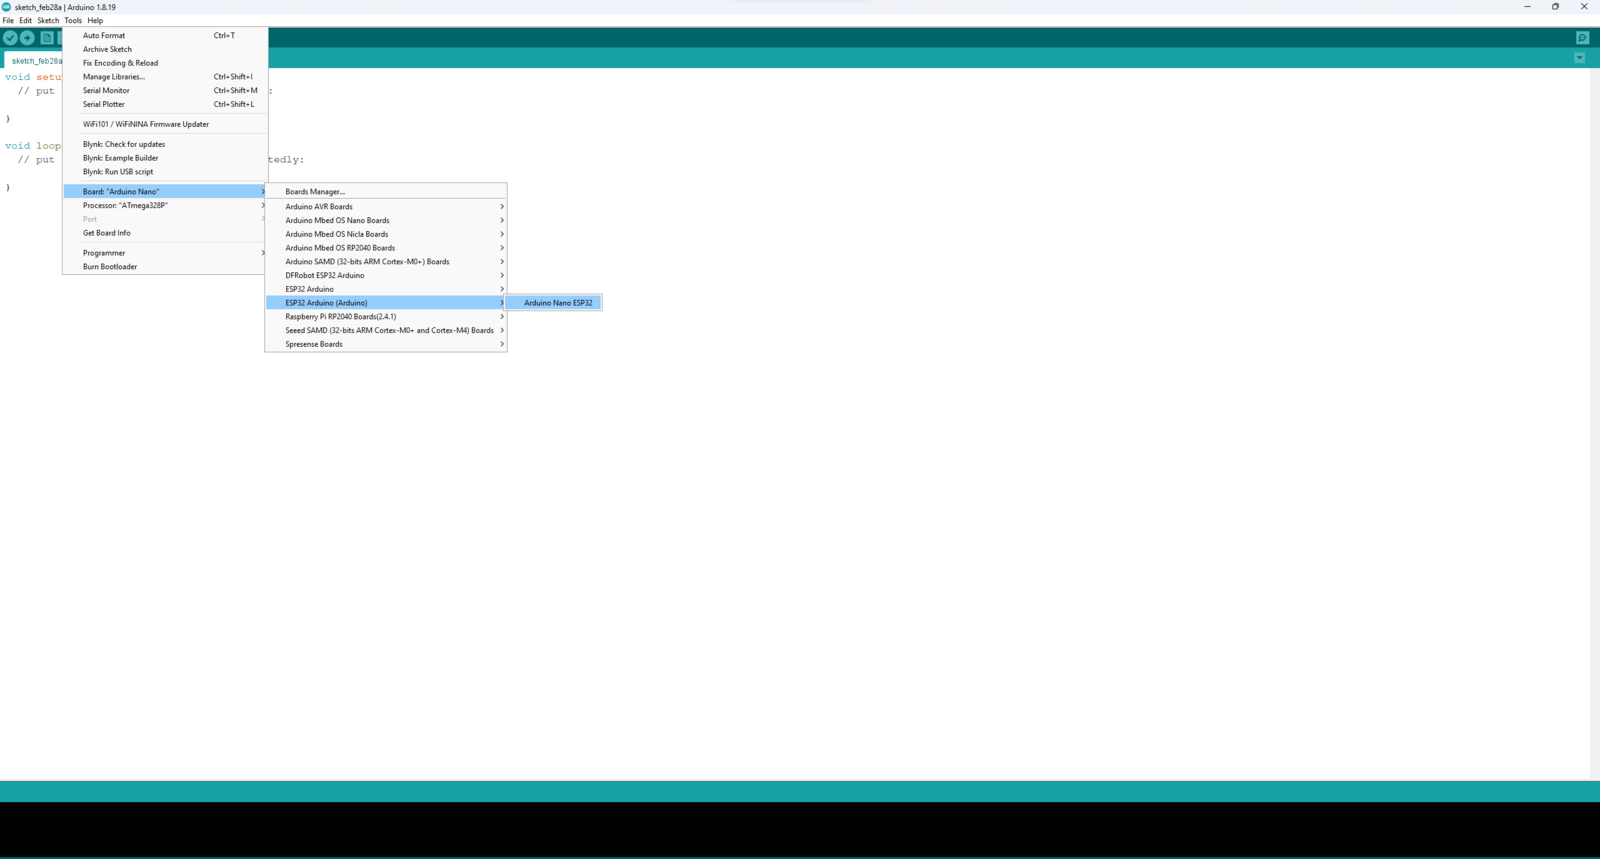
Since Nano ESP32 has the well-known Nano form and provides Wi-Fi connectivity via the u-blox® NORA-W106 (ESP32-S3) module, I decided to employ Nano ESP32 to transfer data packets directly to the web application, including the produced aquatic ultrasonic scan buffer, the selected air bubble class for samples, and the detected air bubble label after running the neural network model. Nevertheless, before proceeding with the following steps, I needed to set Nano ESP32 on the Arduino IDE, install the required libraries, and configure some default settings. :hash: To install the required core, navigate to Tools ➡ Board ➡ Boards Manager and search for Arduino ESP32 Boards.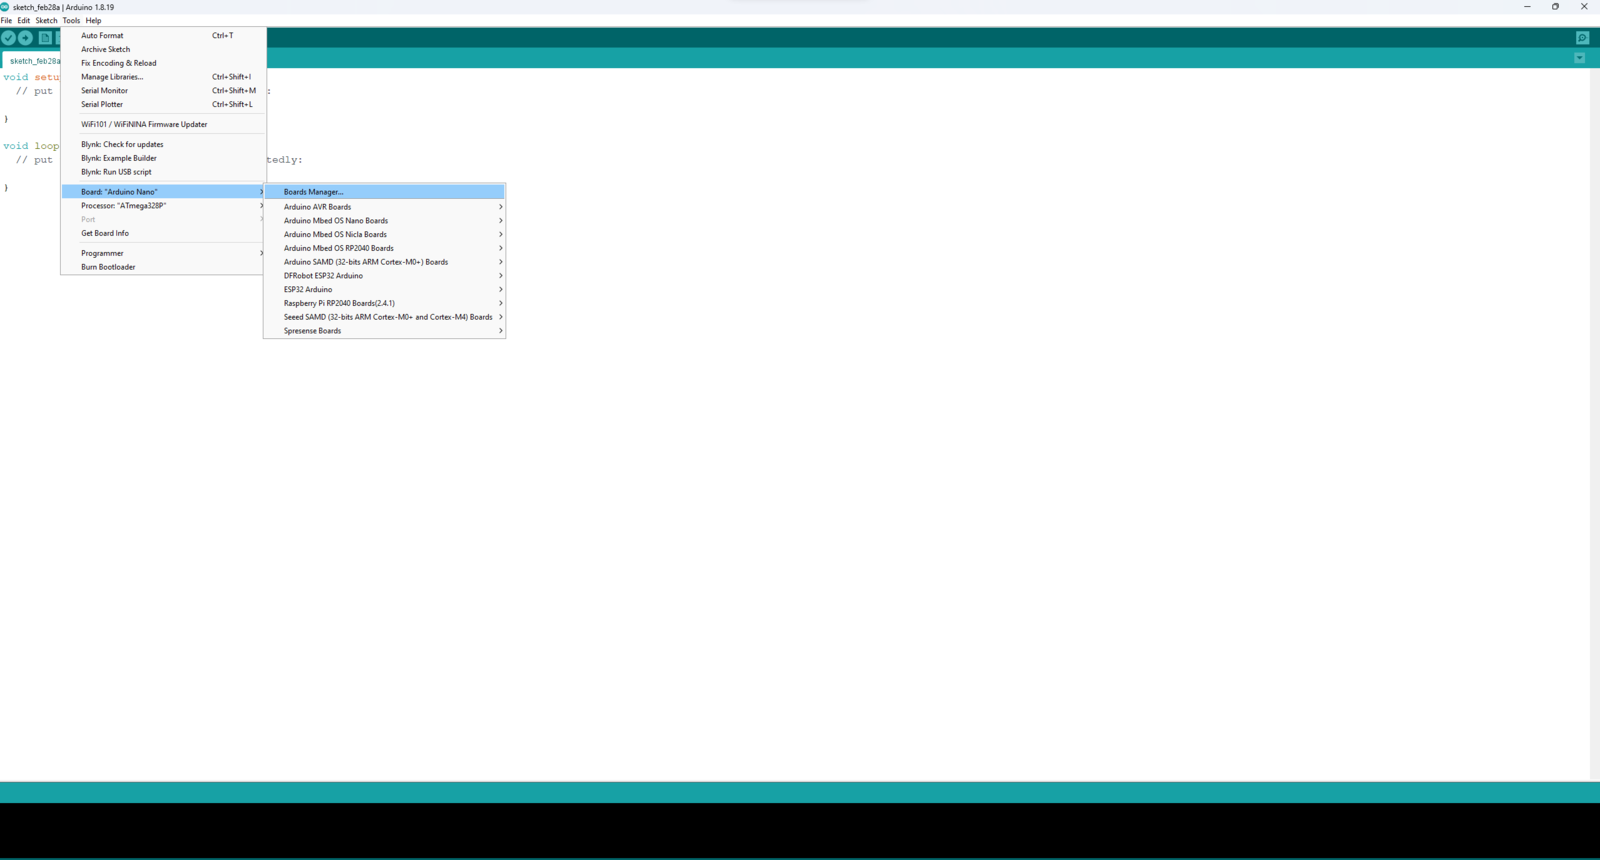
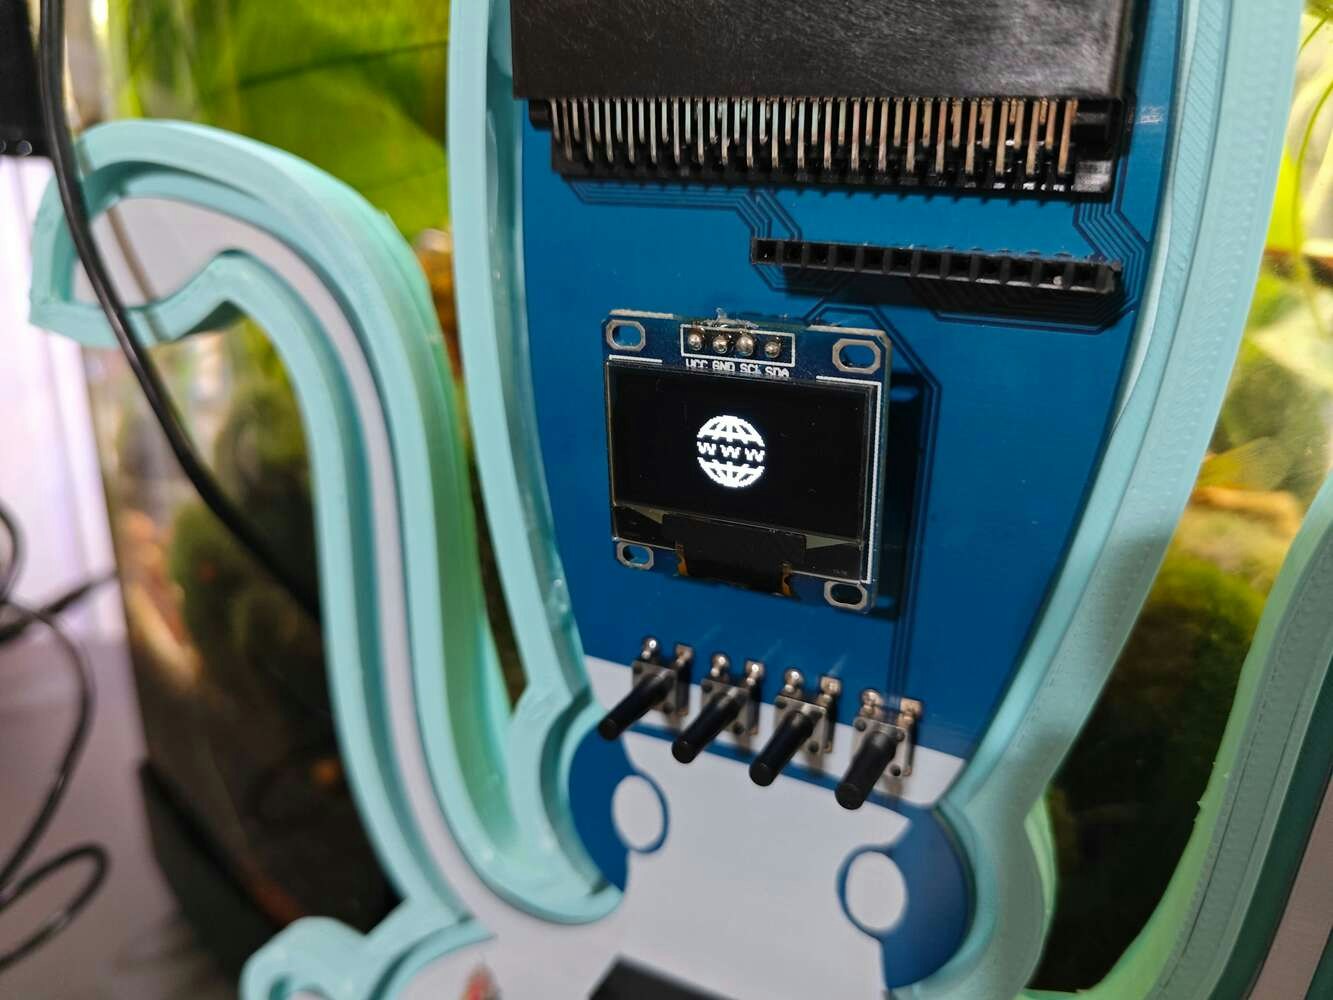
Step 6.1: Displaying images on the SSD1306 OLED screen
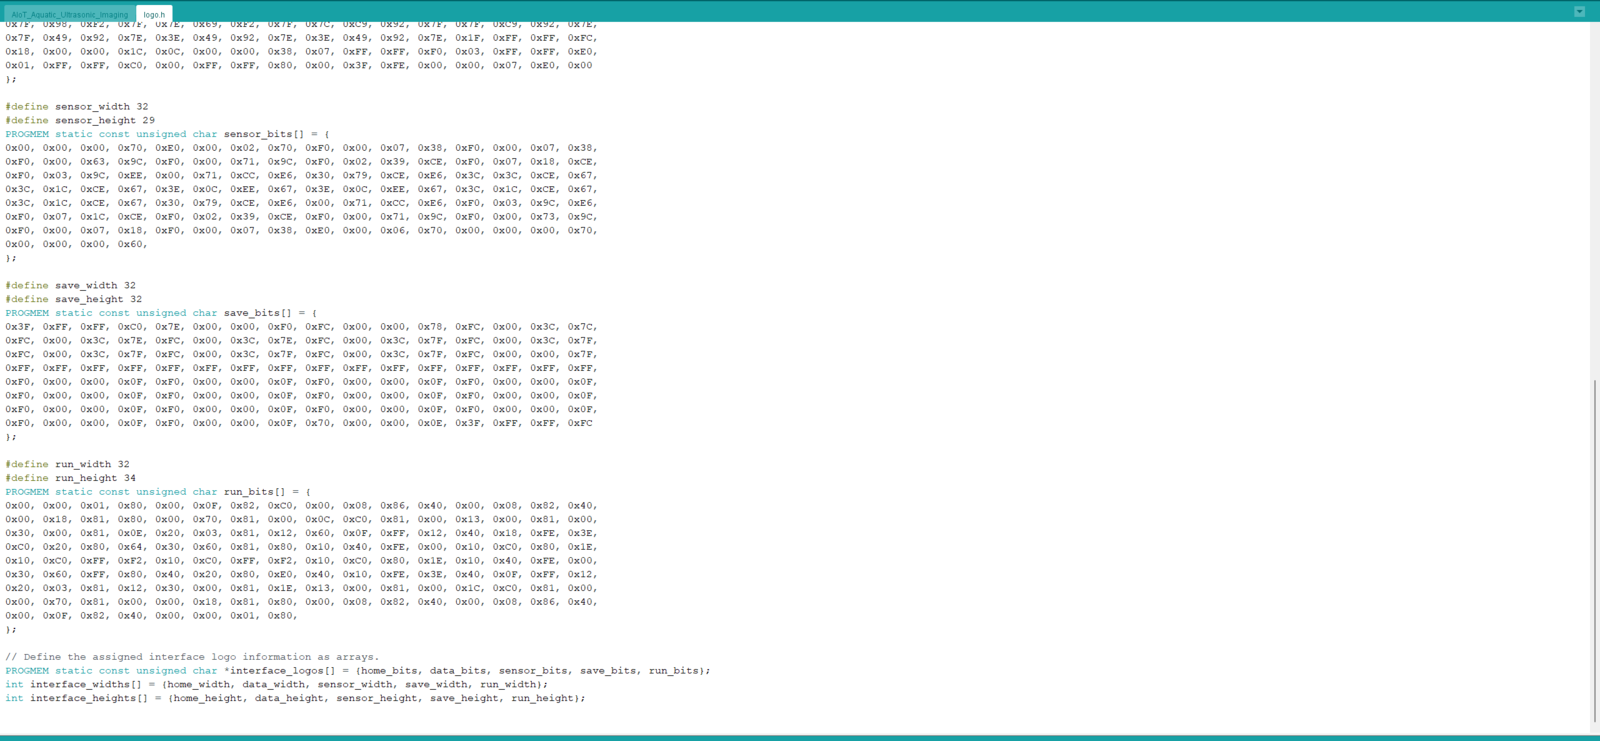
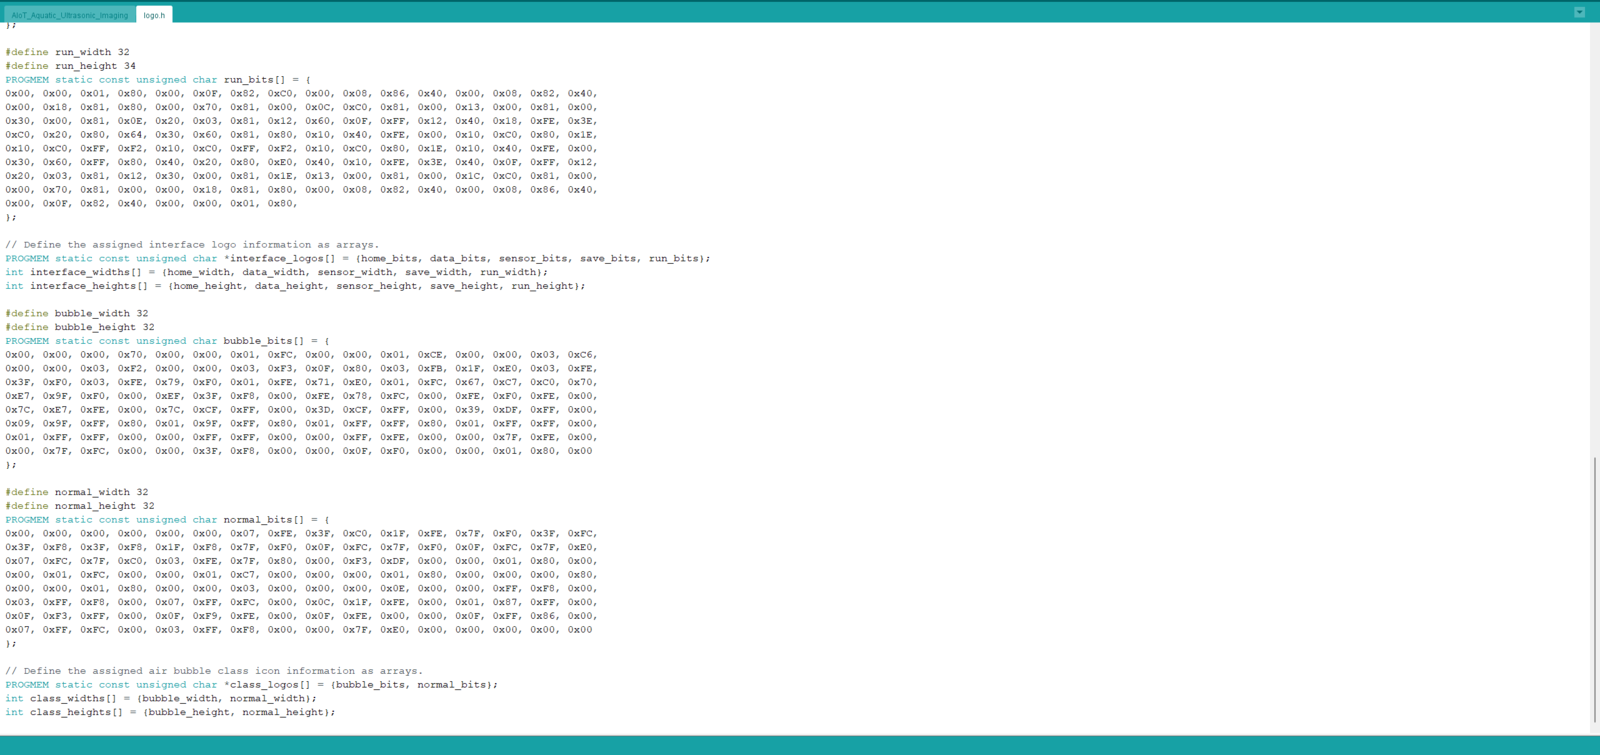
:hash: To be able to display images (icons) on the SSD1306 OLED screen, first convert image files (PNG or JPG) to monochromatic bitmaps. Then, convert the generated bitmaps to compatible C data arrays. I decided to utilize LCD Assistant to create C data arrays. :hash: After installing LCD Assistant, upload a monochromatic bitmap and select Vertical or Horizontal, depending on the screen type. :hash: Then, save all the converted C data arrays to the logo.h file. ⭐ In the logo.h file, I defined multi-dimensional arrays to group the assigned logos (interface and class) and their sizes — width and height.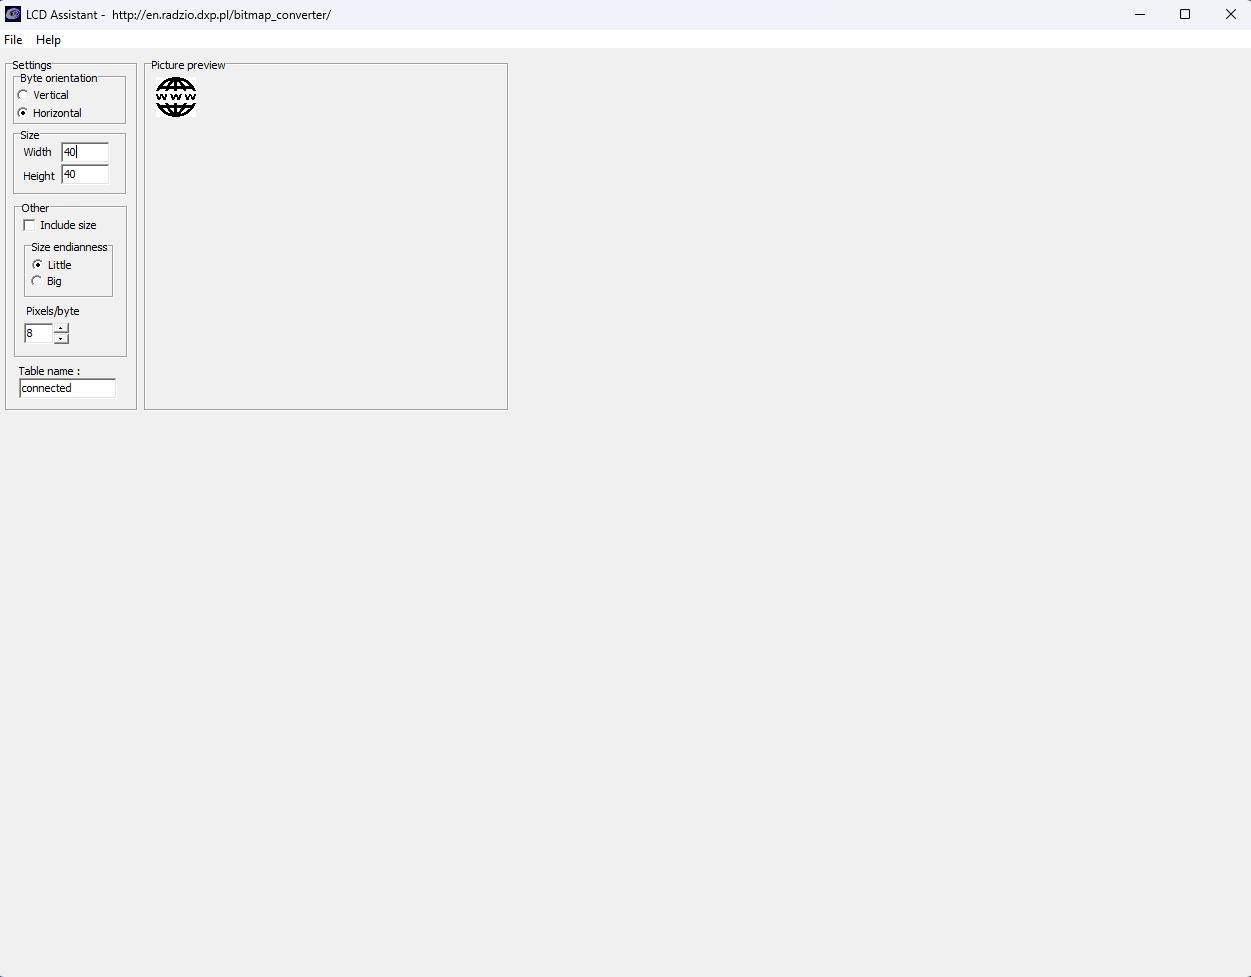
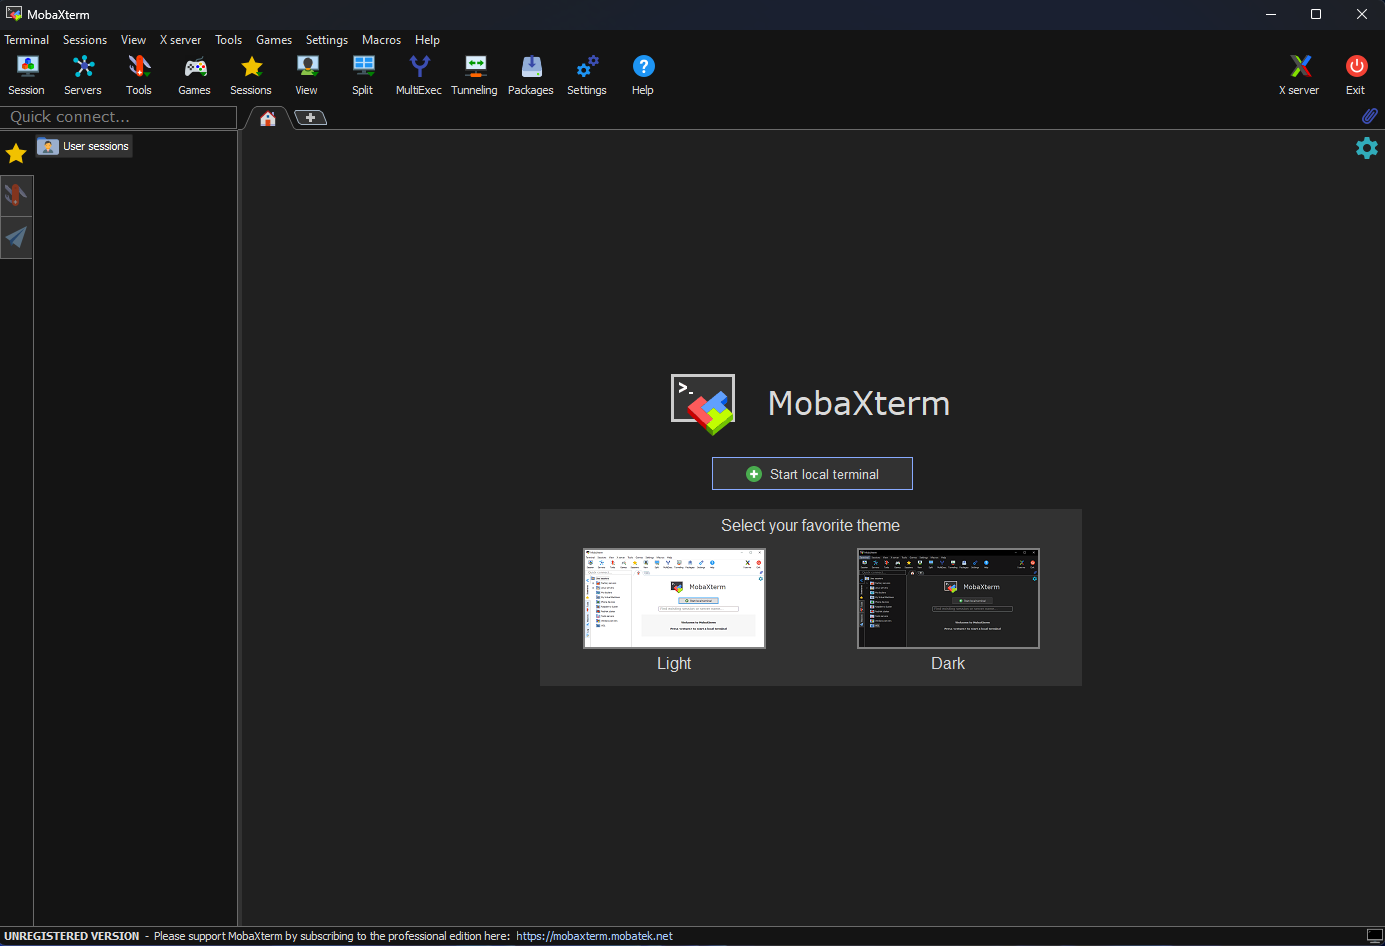
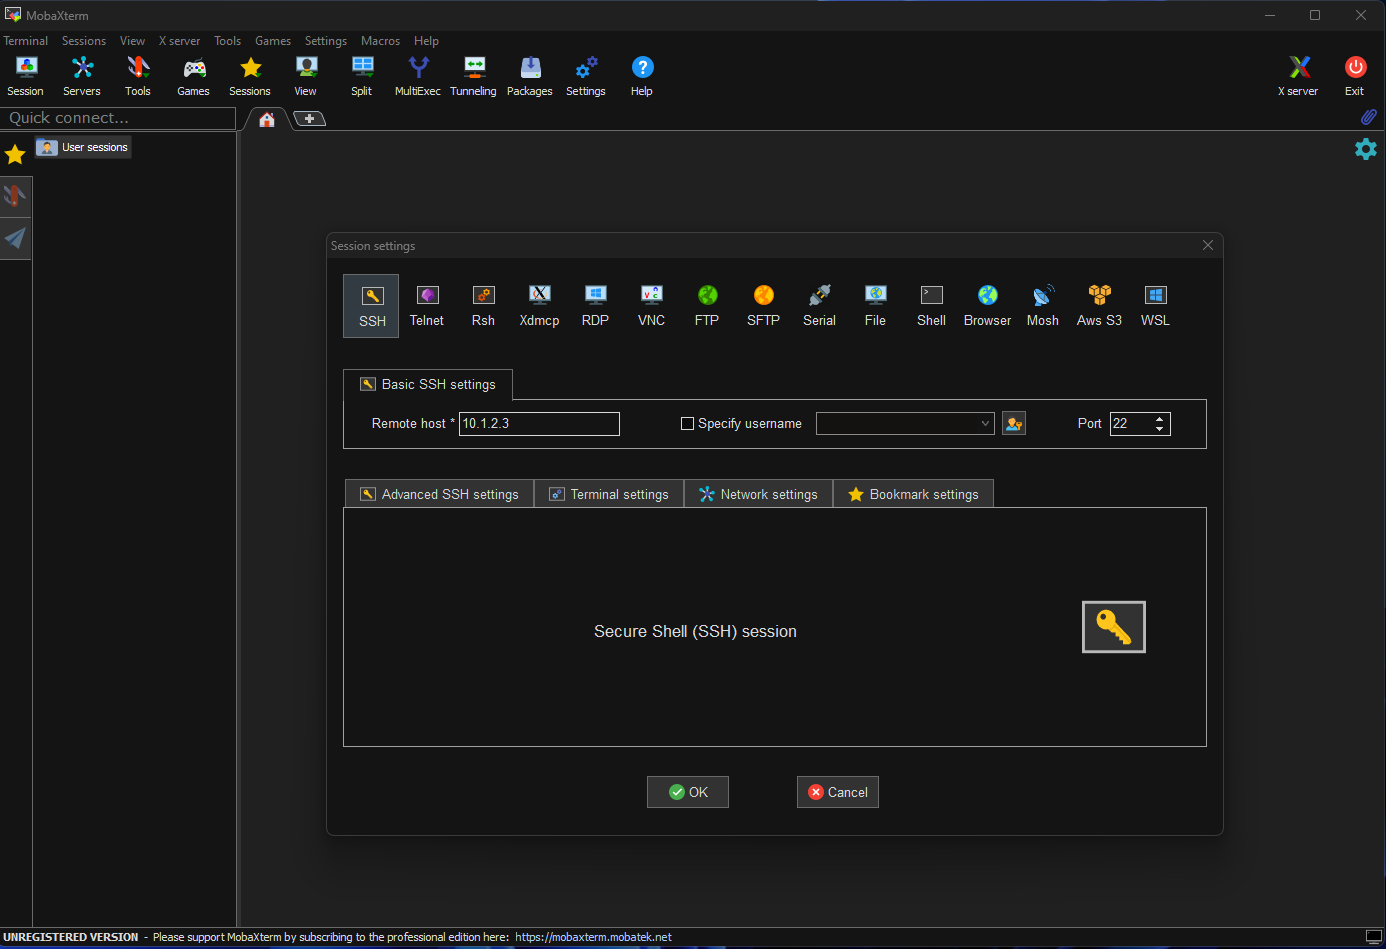
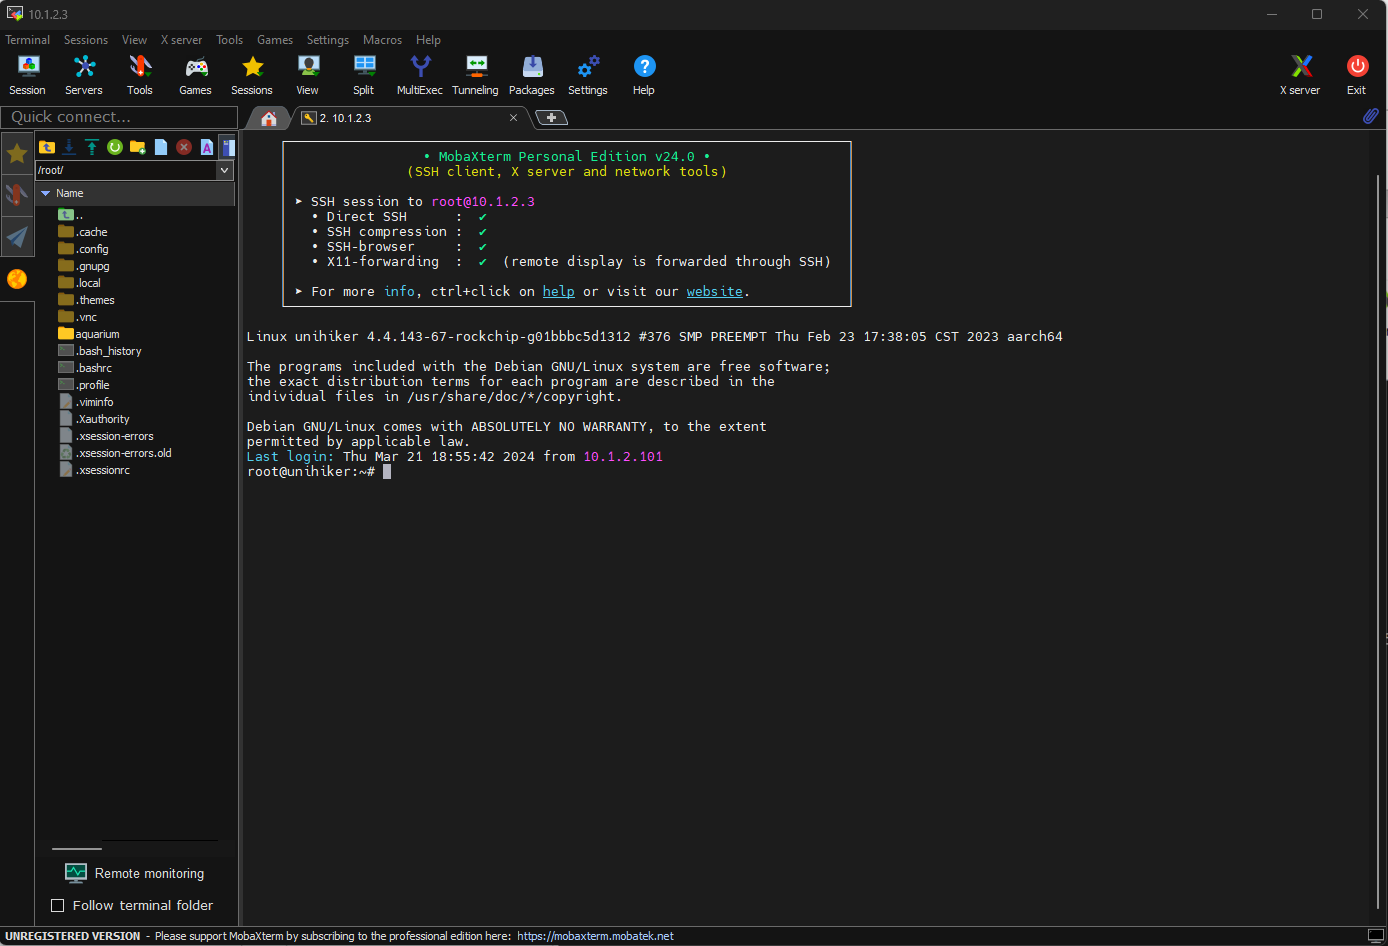
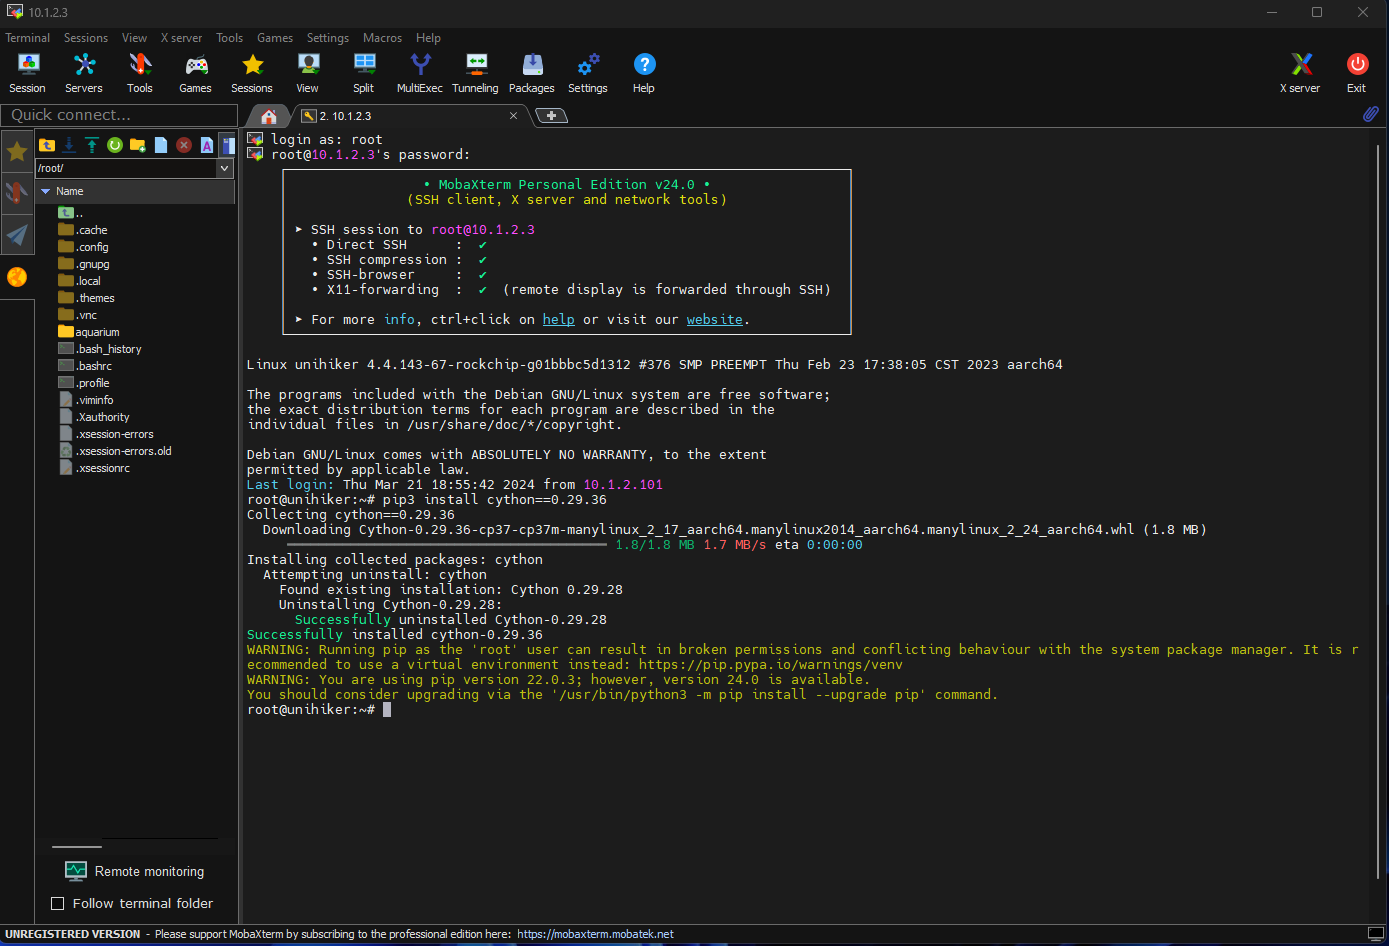
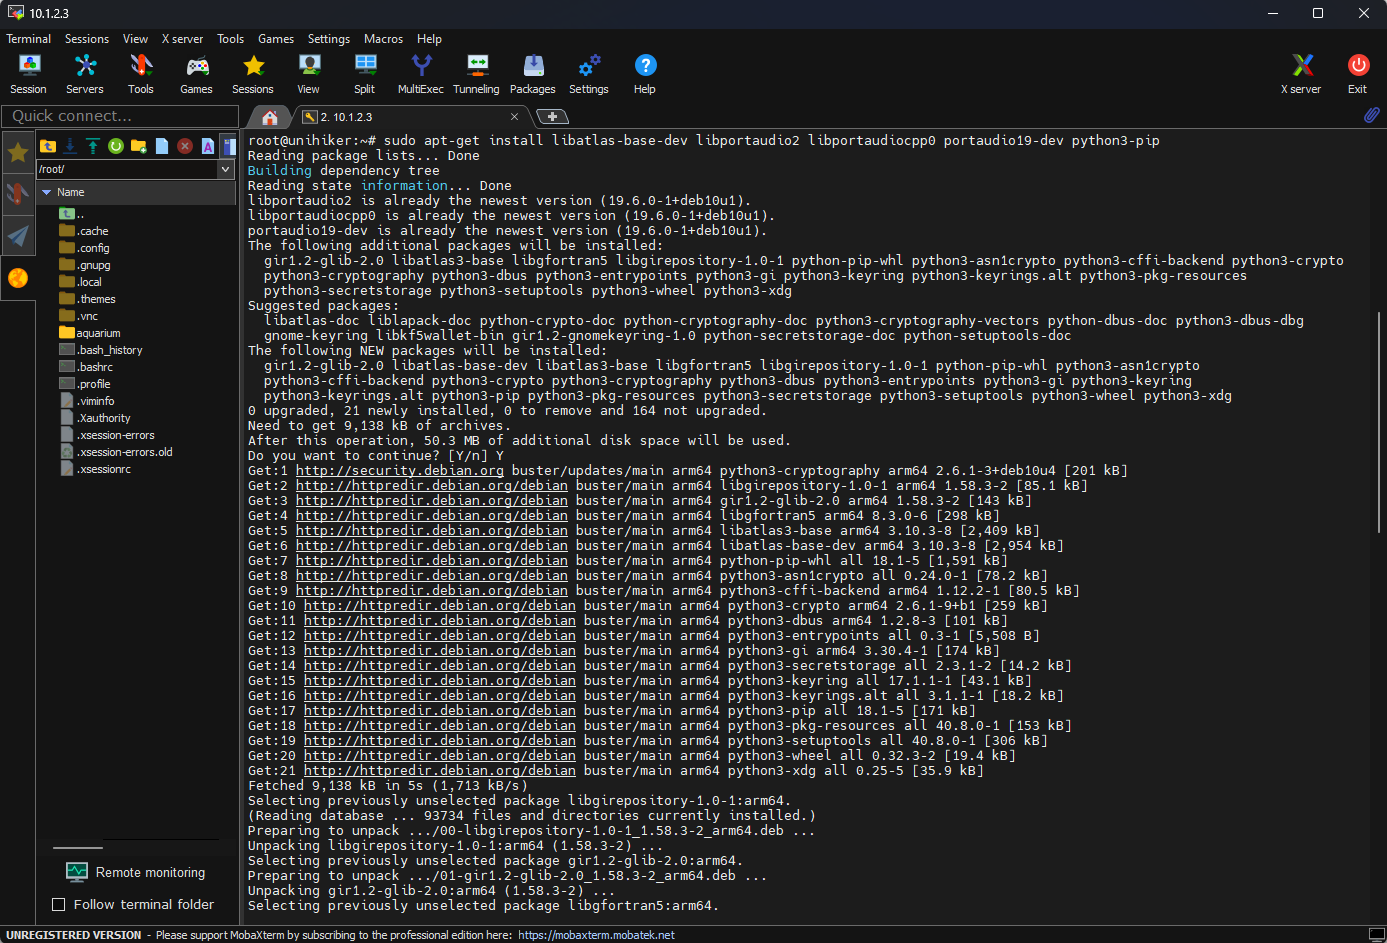
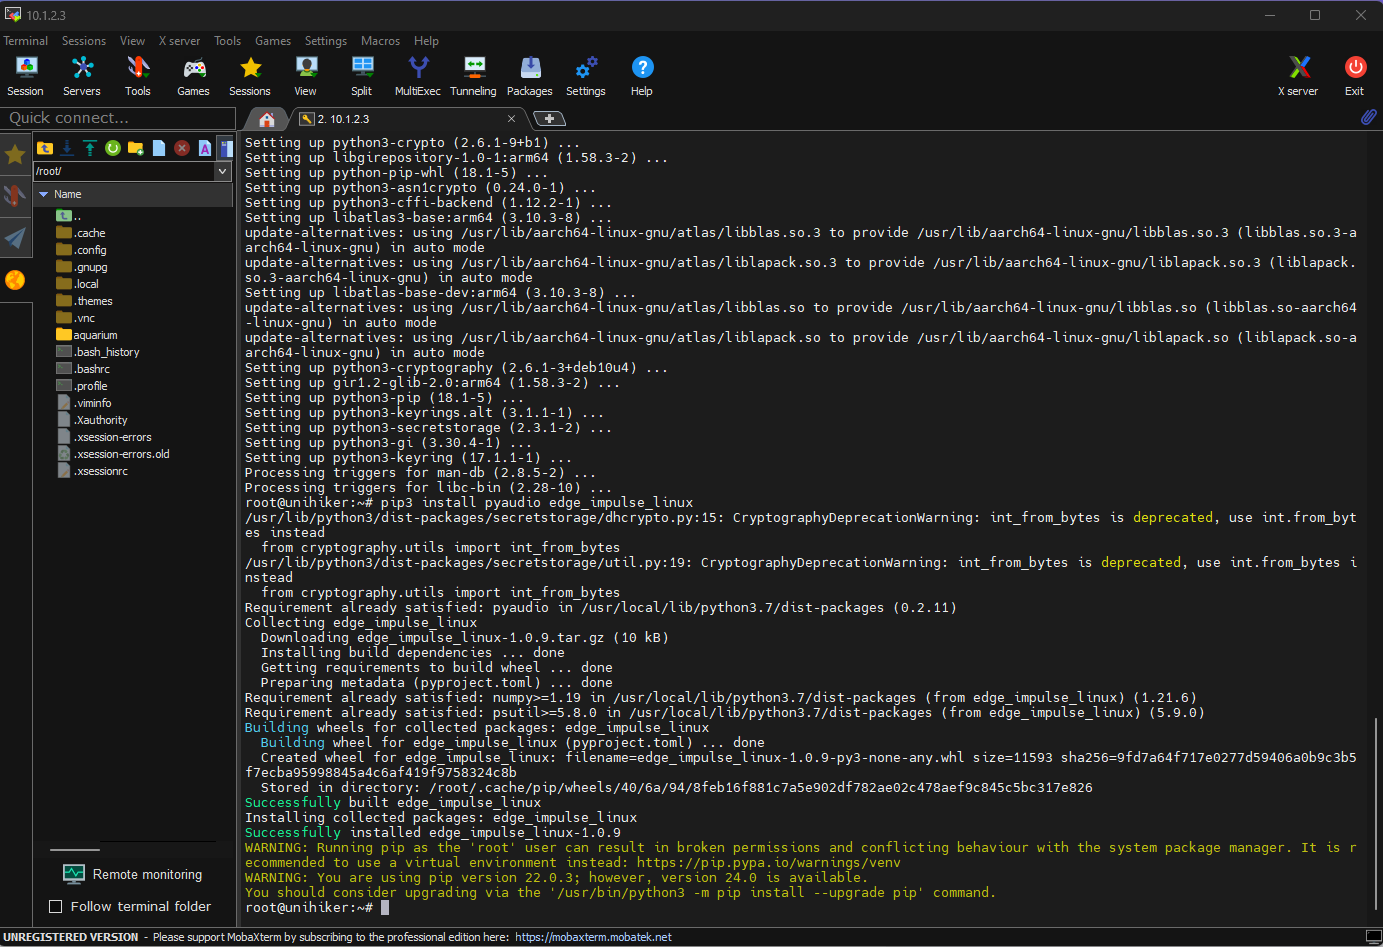
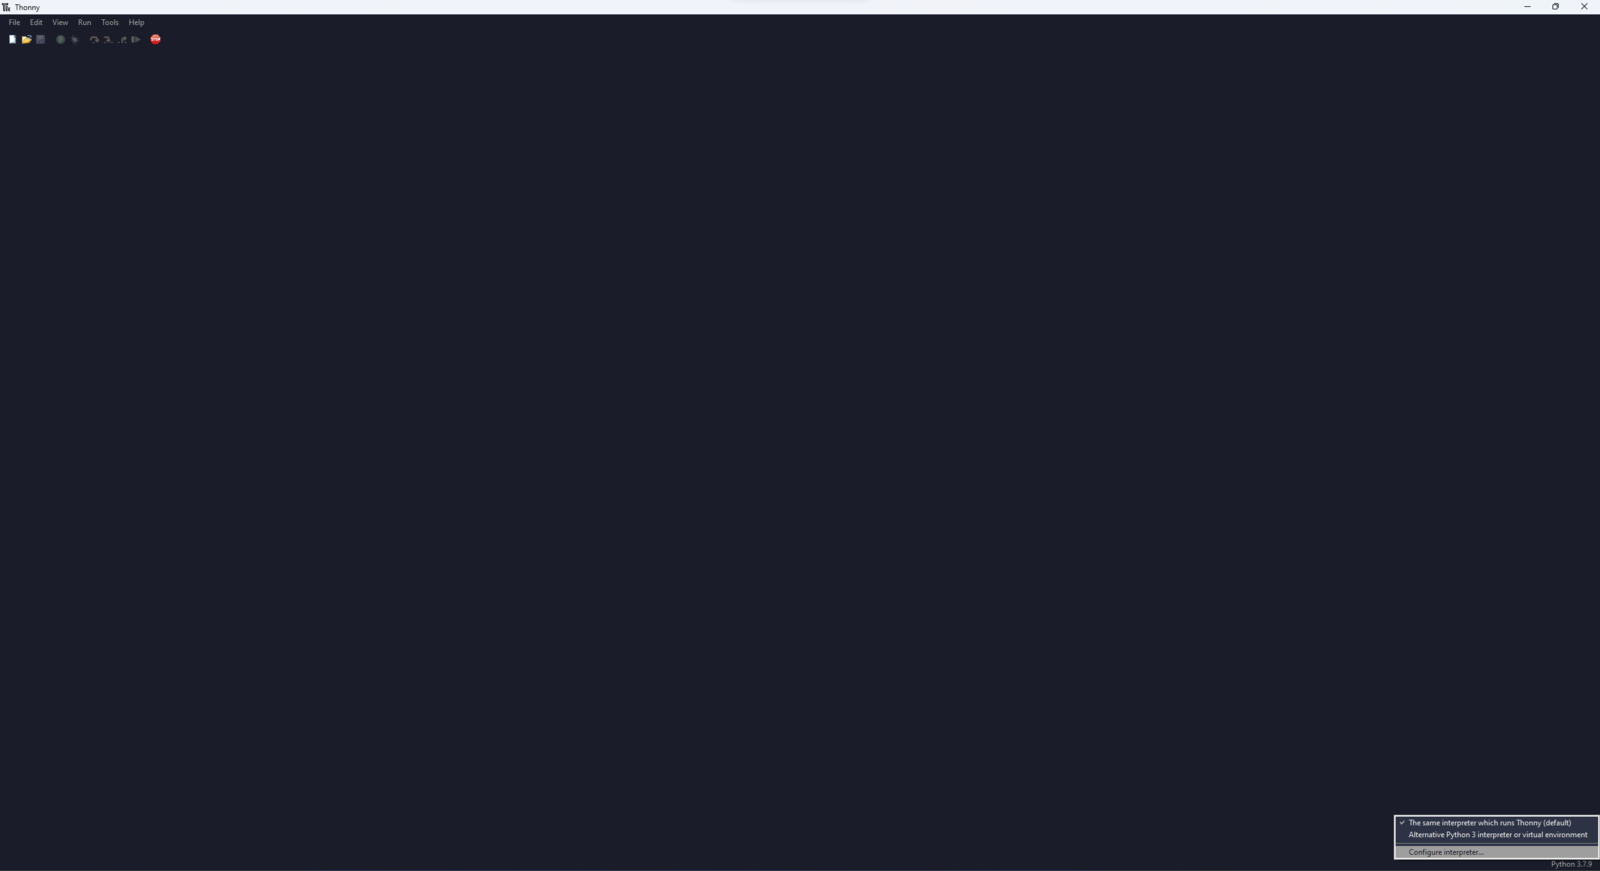
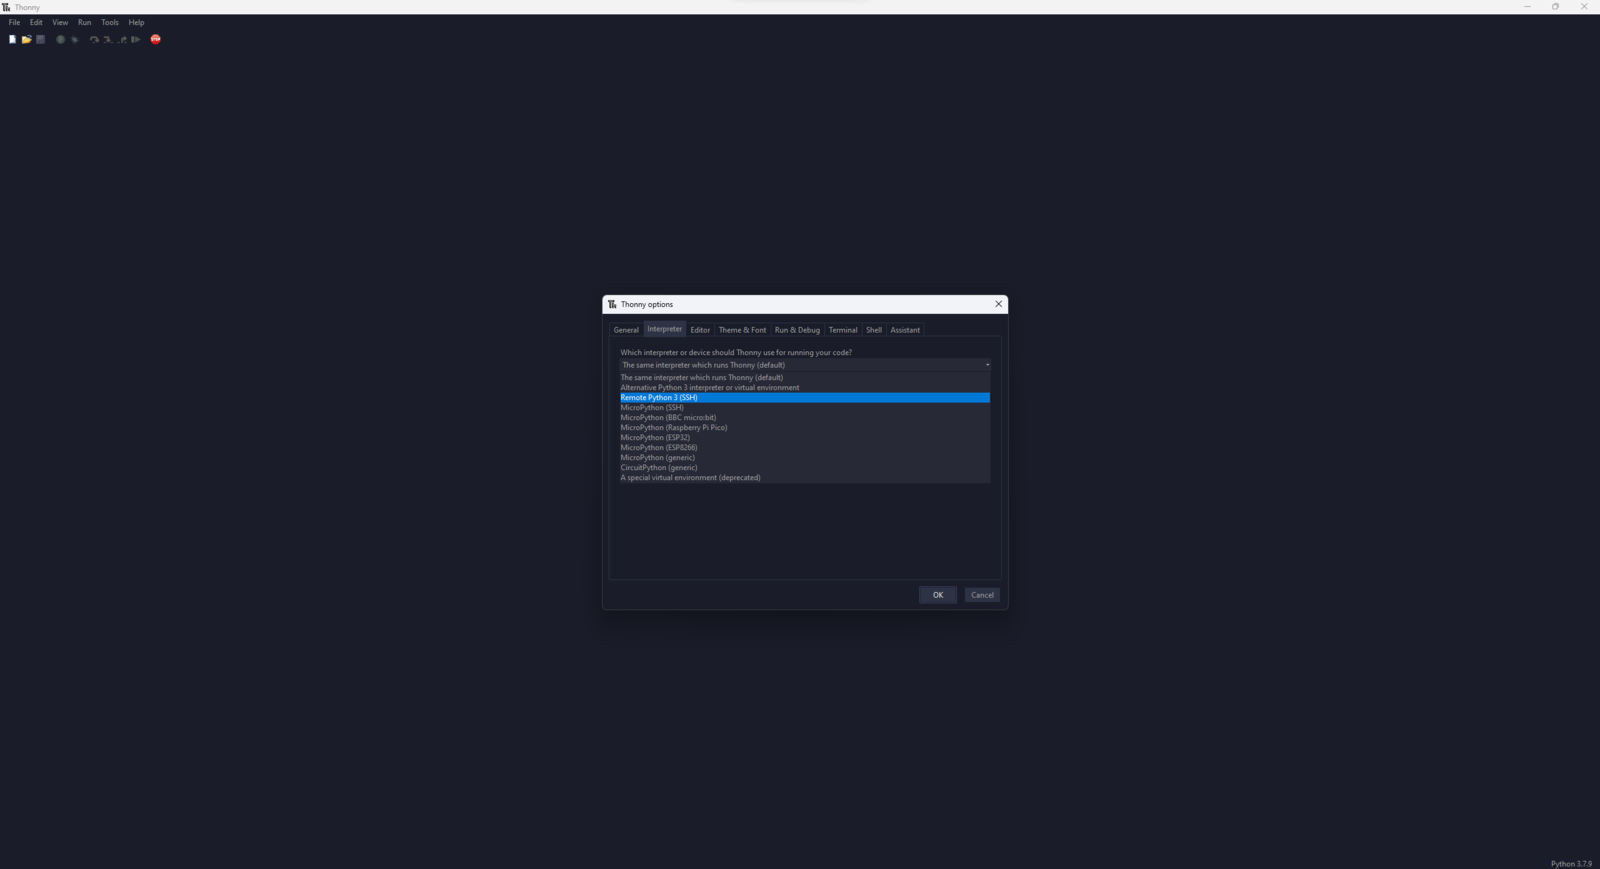
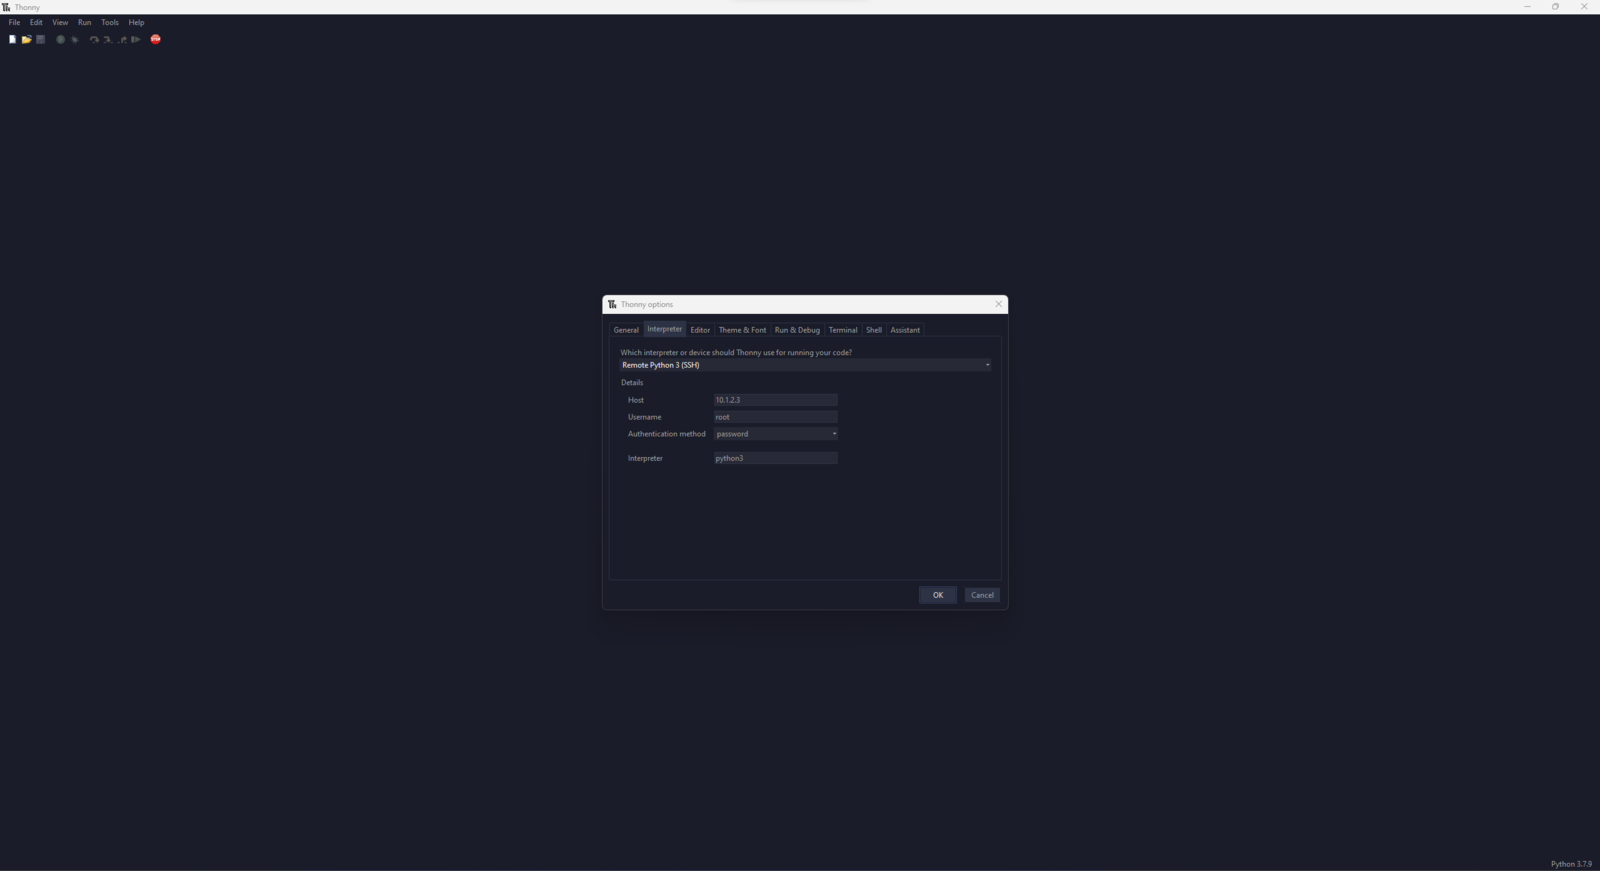
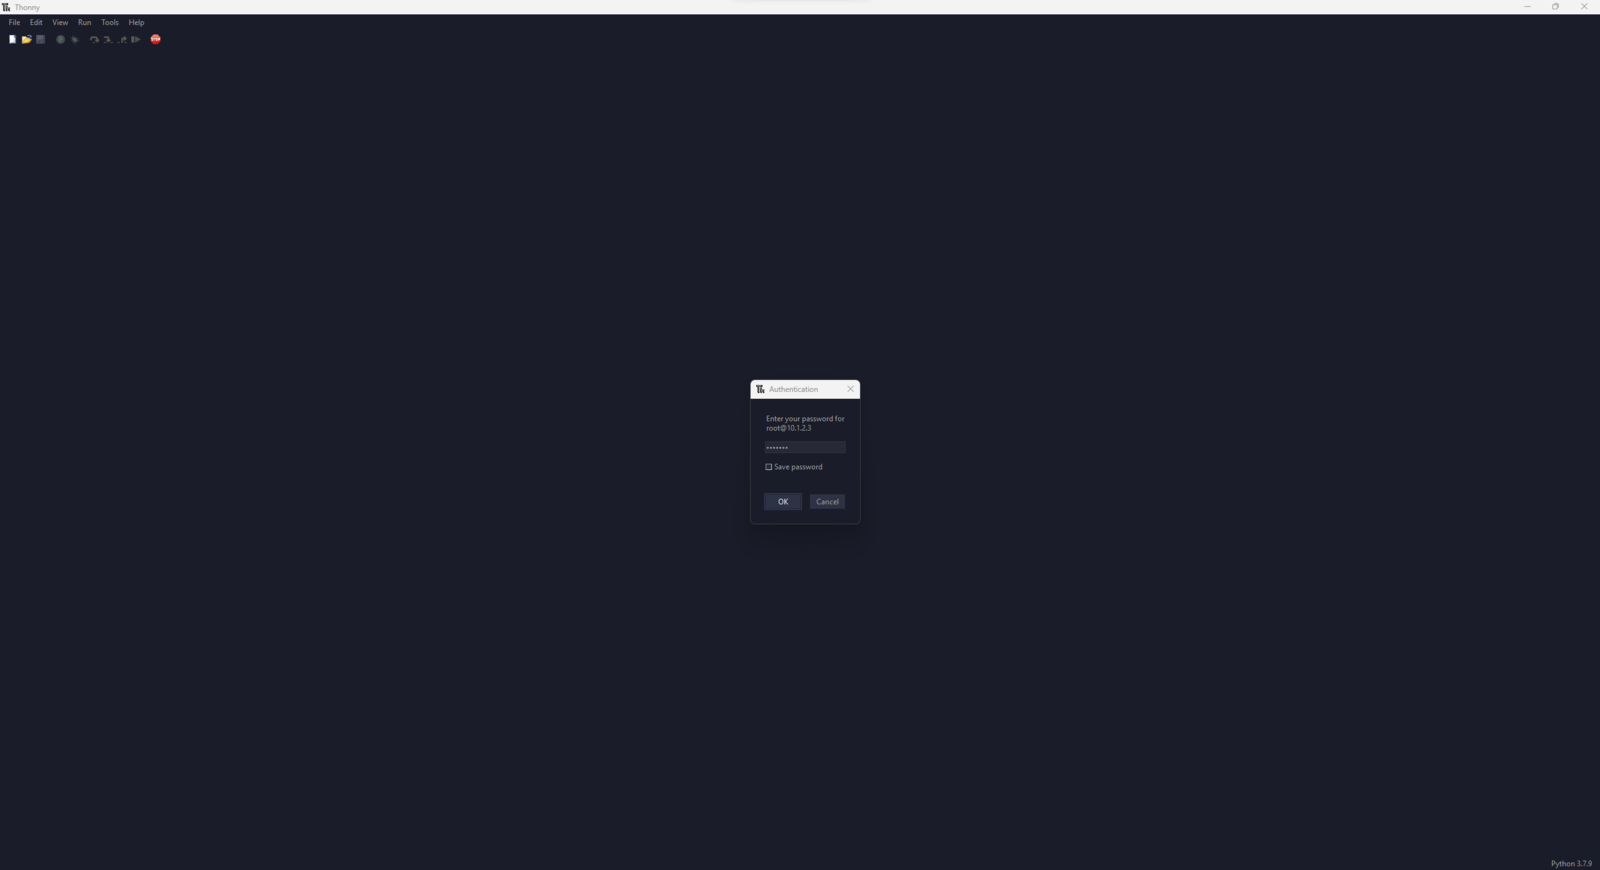
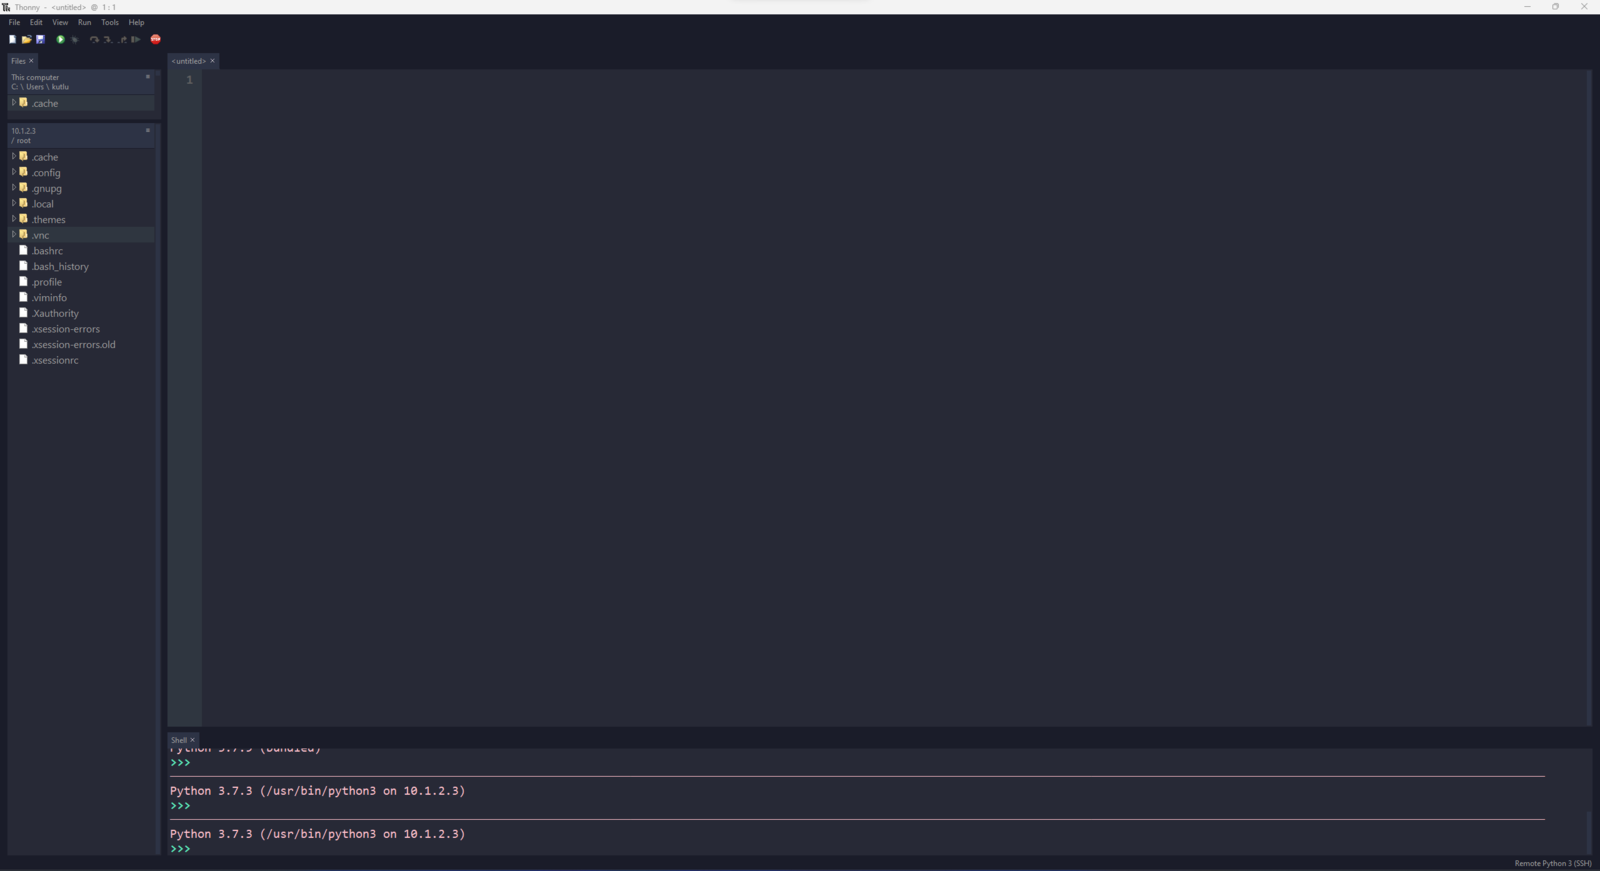
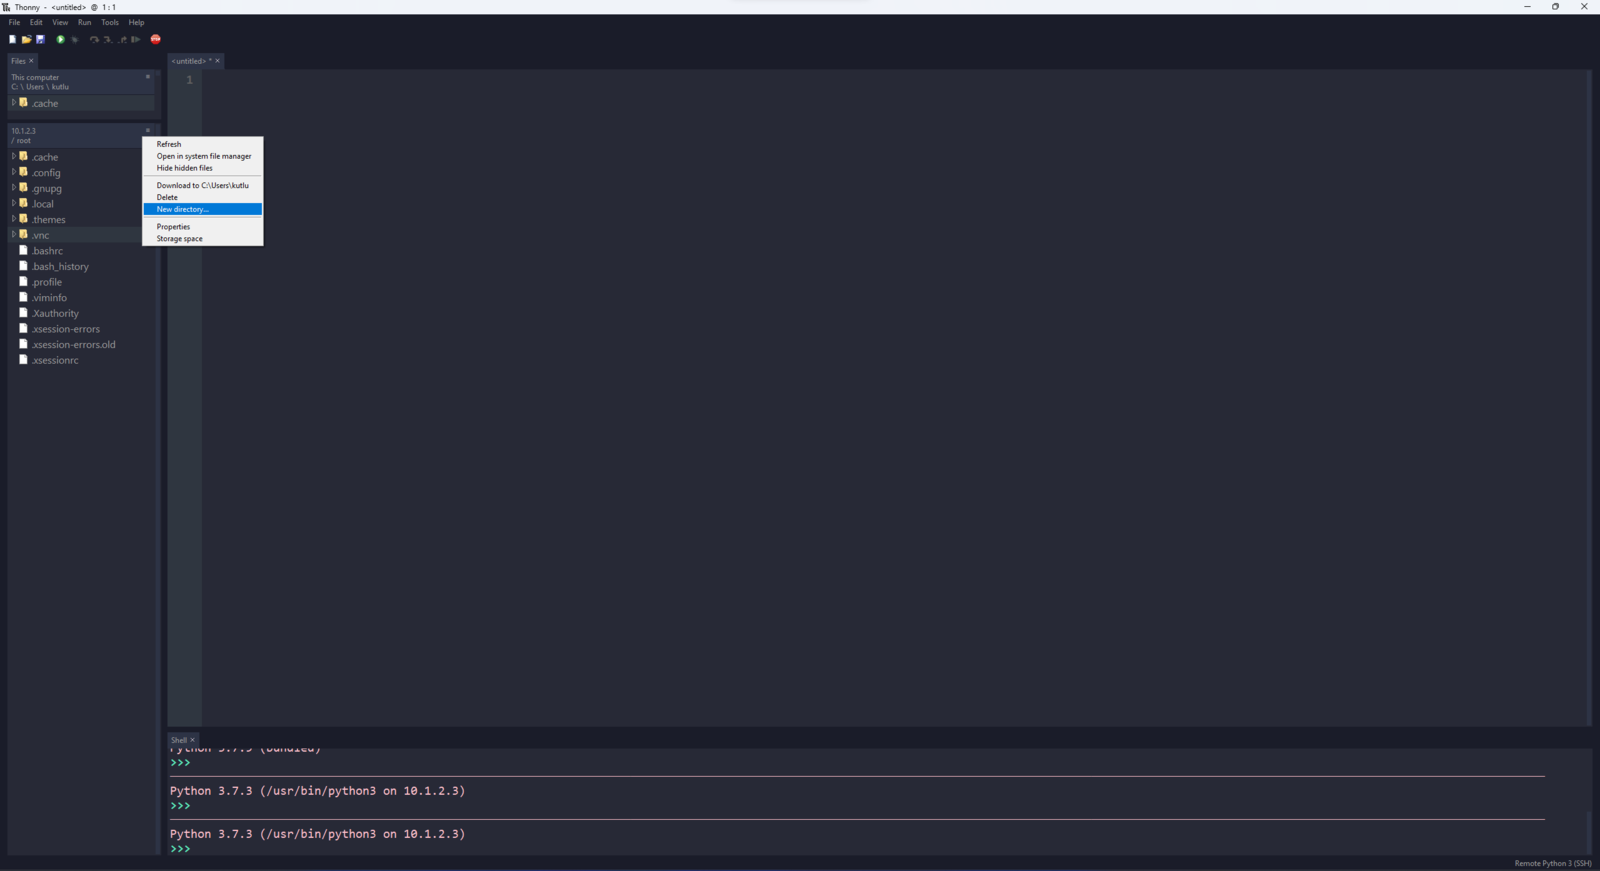
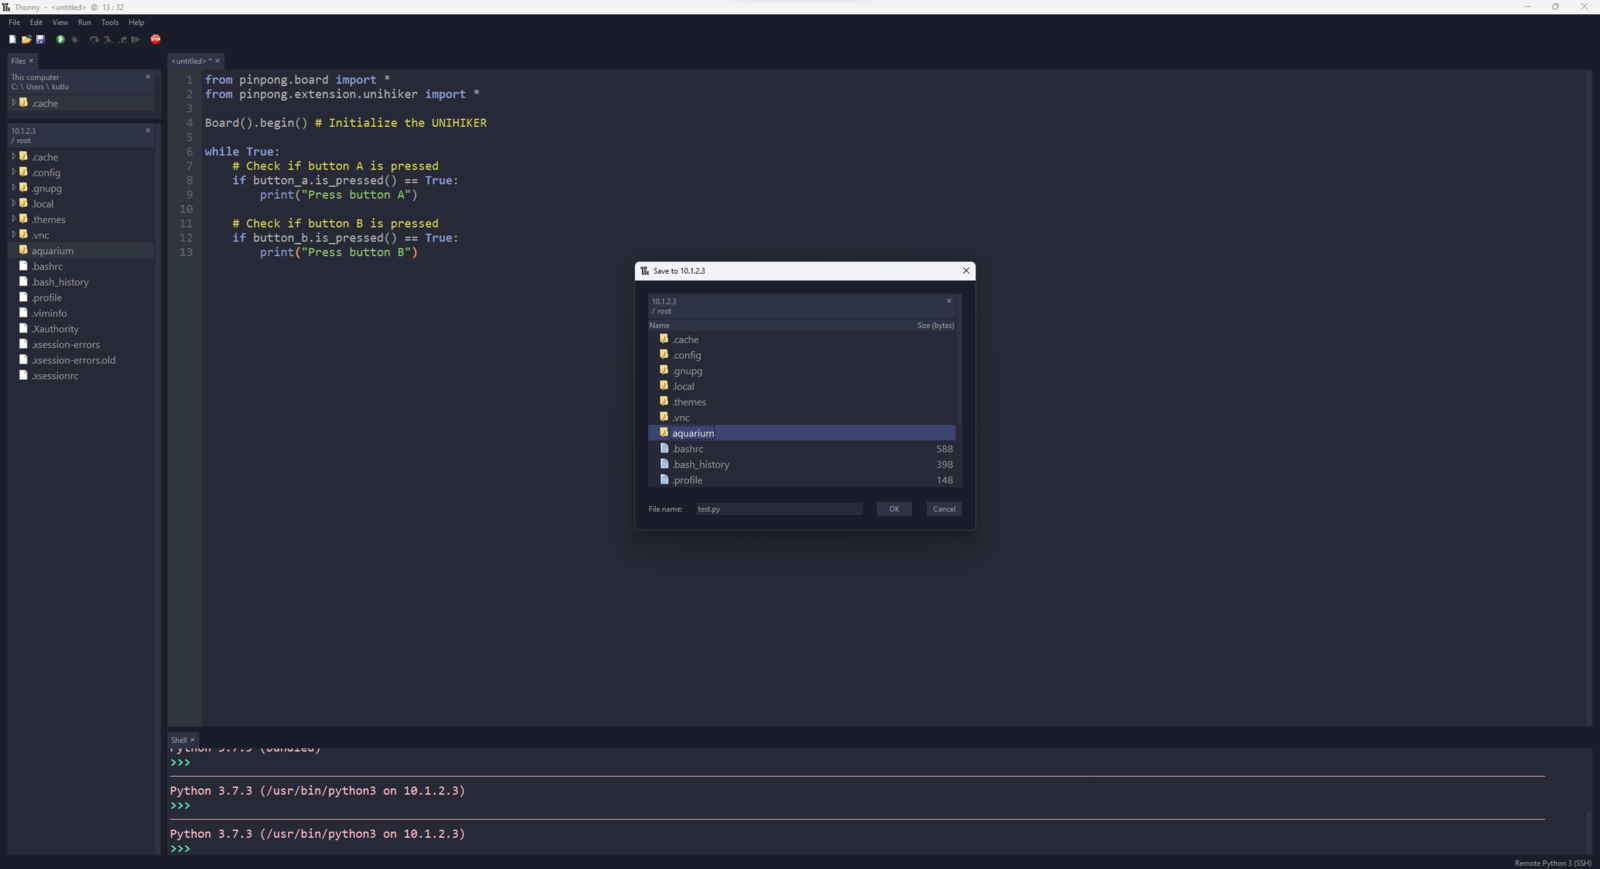
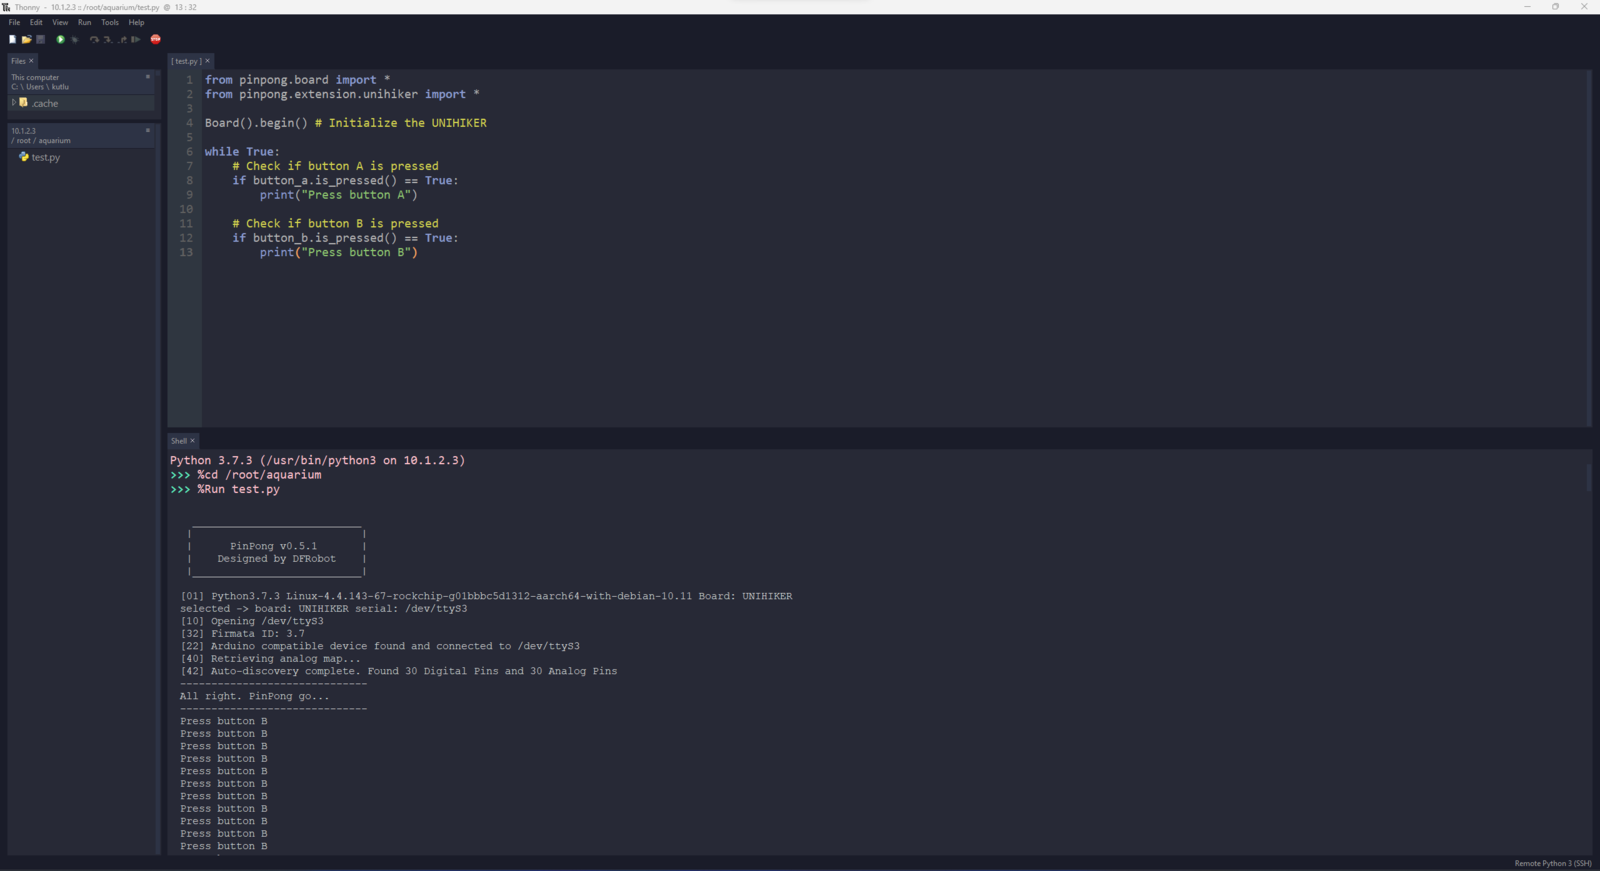
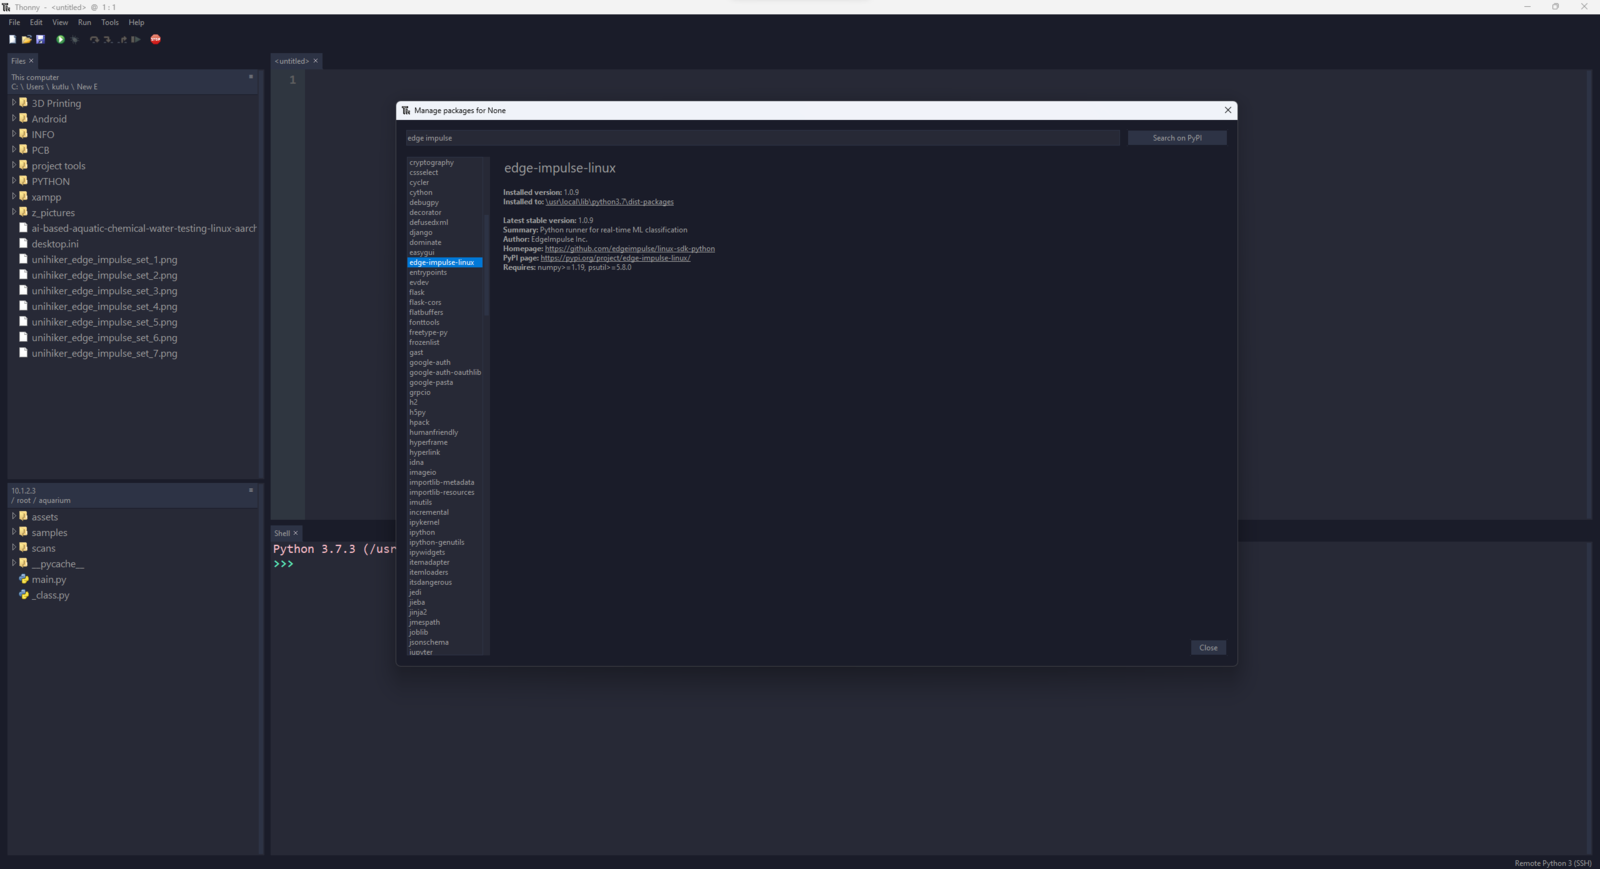
Step 7: Setting up UNIHIKER on MobaXterm & Thonny
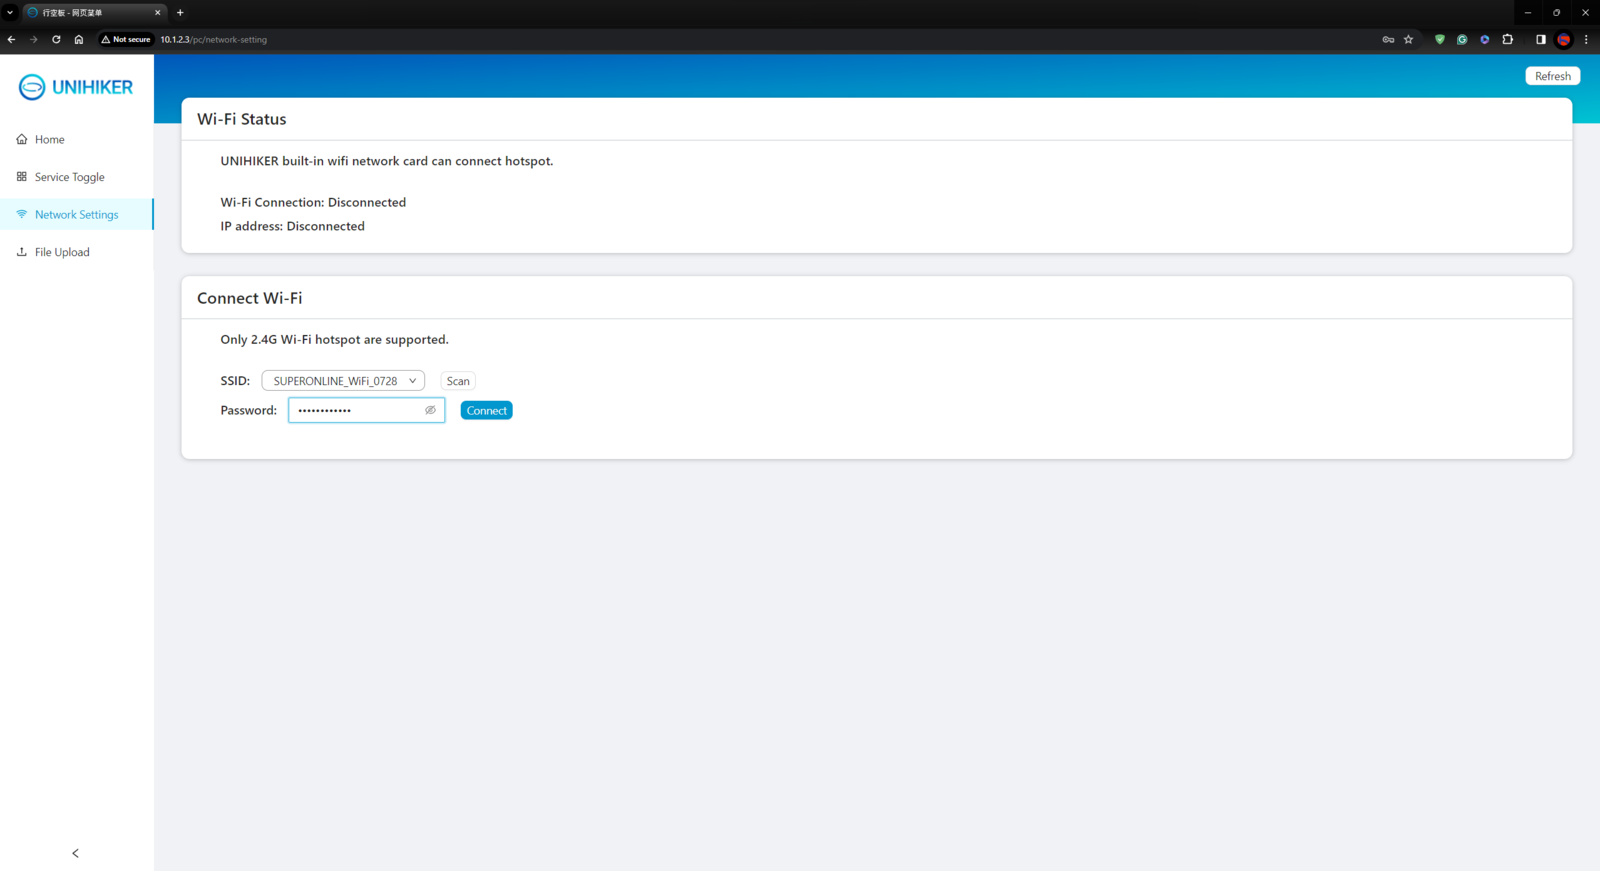
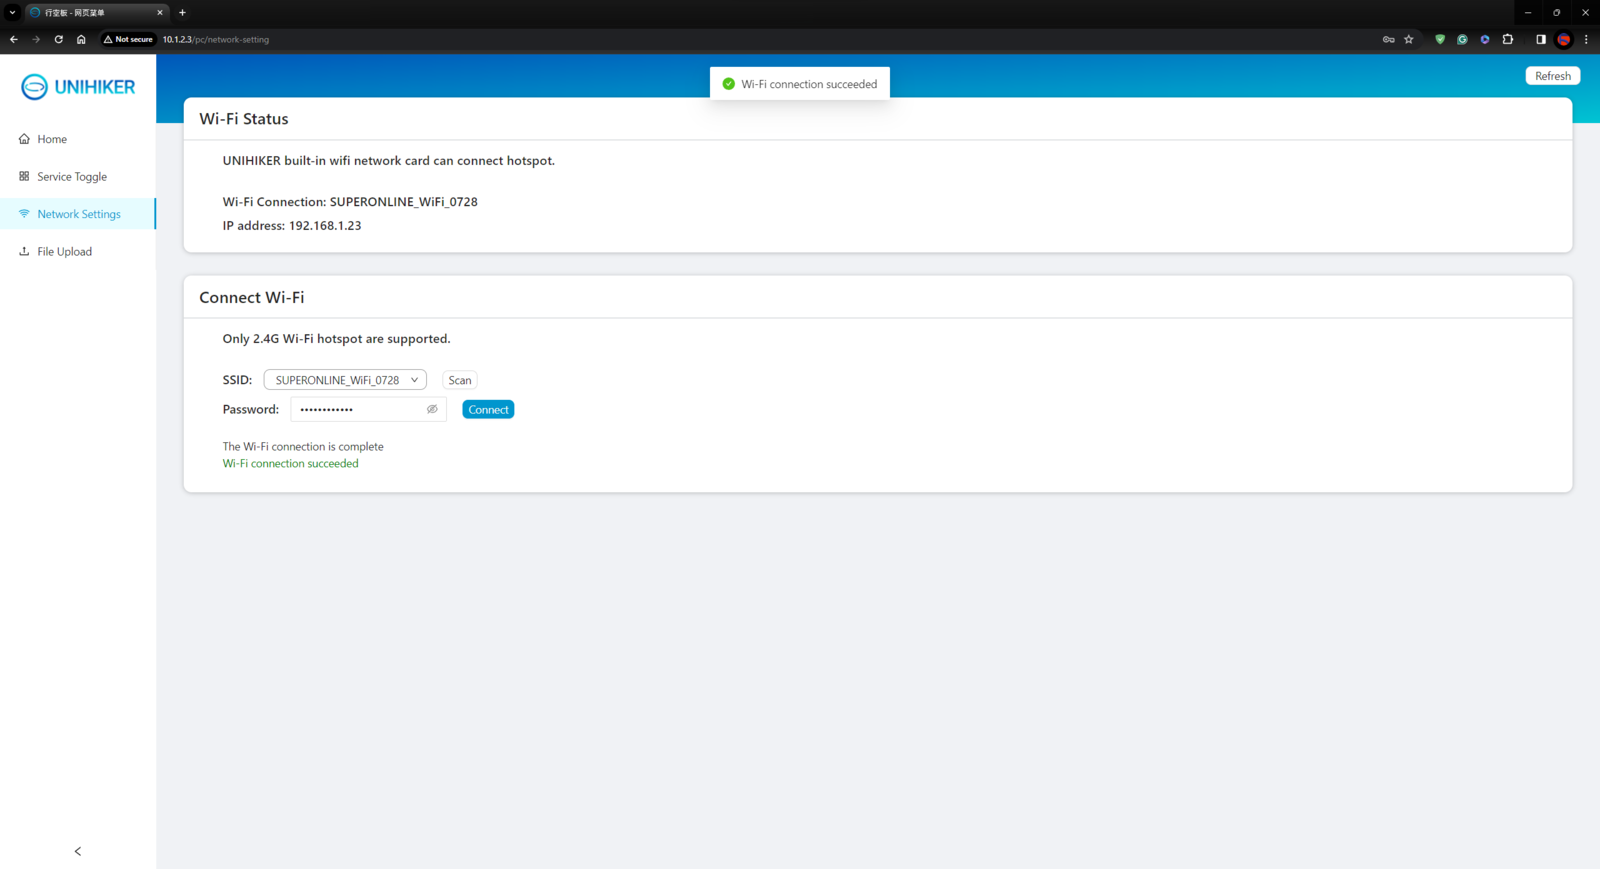
Although UNIHIKER is an outstandingly compact single-board computer providing a built-in touchscreen, integrated Python modules, and a microcontroller coprocessor, I still needed to install the required Python modules and set up the necessary software before proceeding with the following steps. :hash: First of all, if you are a novice in programming with UNIHIKER, please visit the official tutorials and guidelines. :hash: After connecting UNIHIKER to the computer via a USB Type-C cable, go to the home page of UNIHIKER’s local web server via the default browser: 10.1.2.3. :hash: Then, navigate to Network Settings and establish the Wi-Fi connection.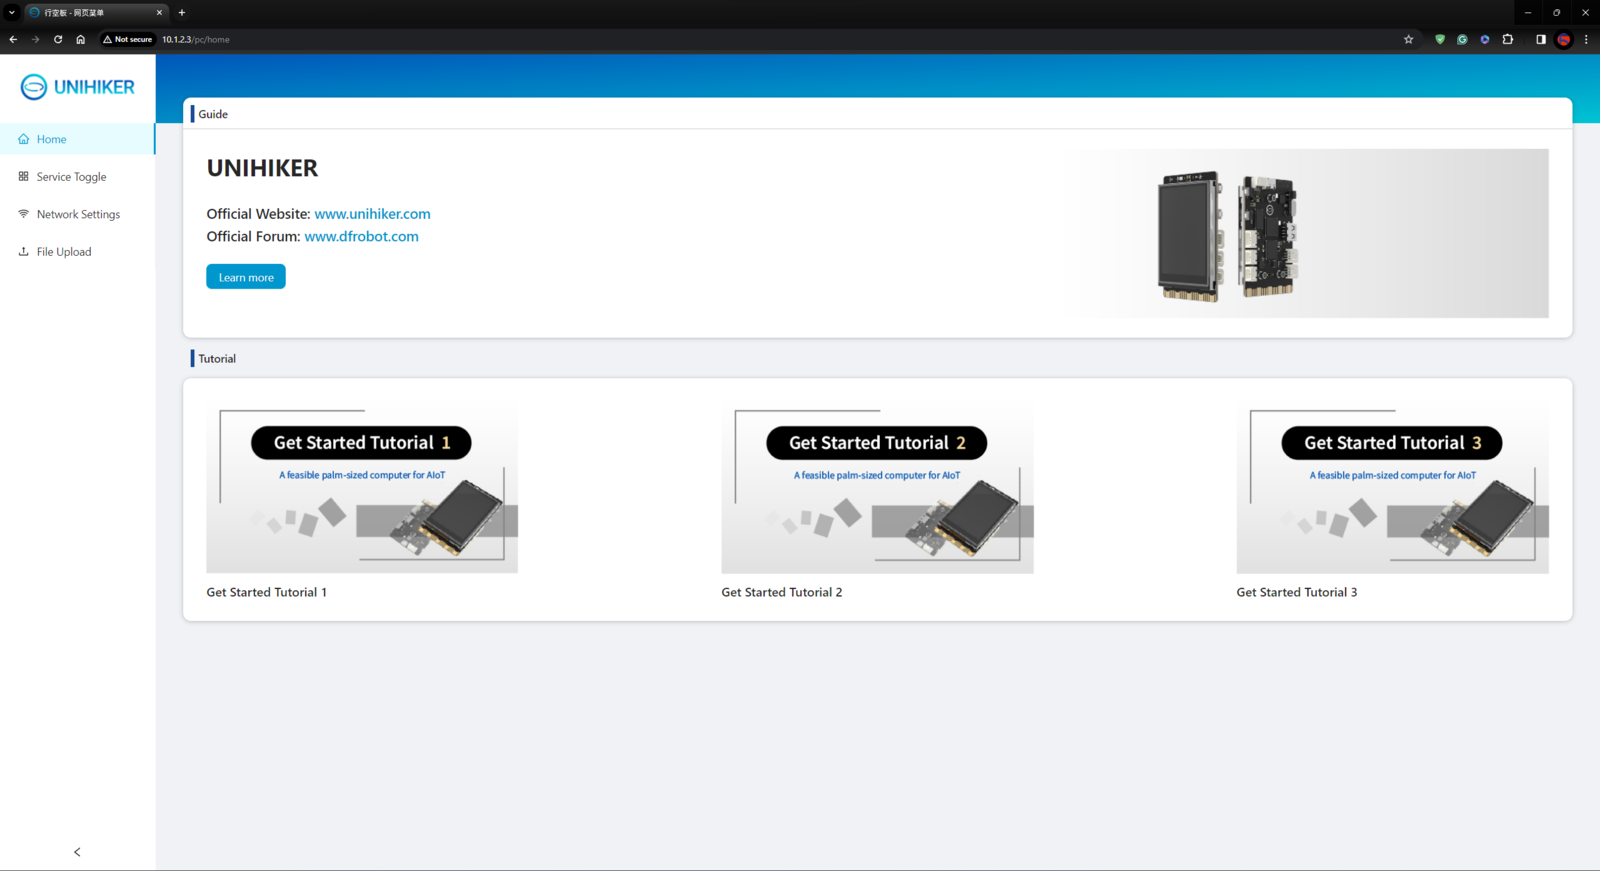
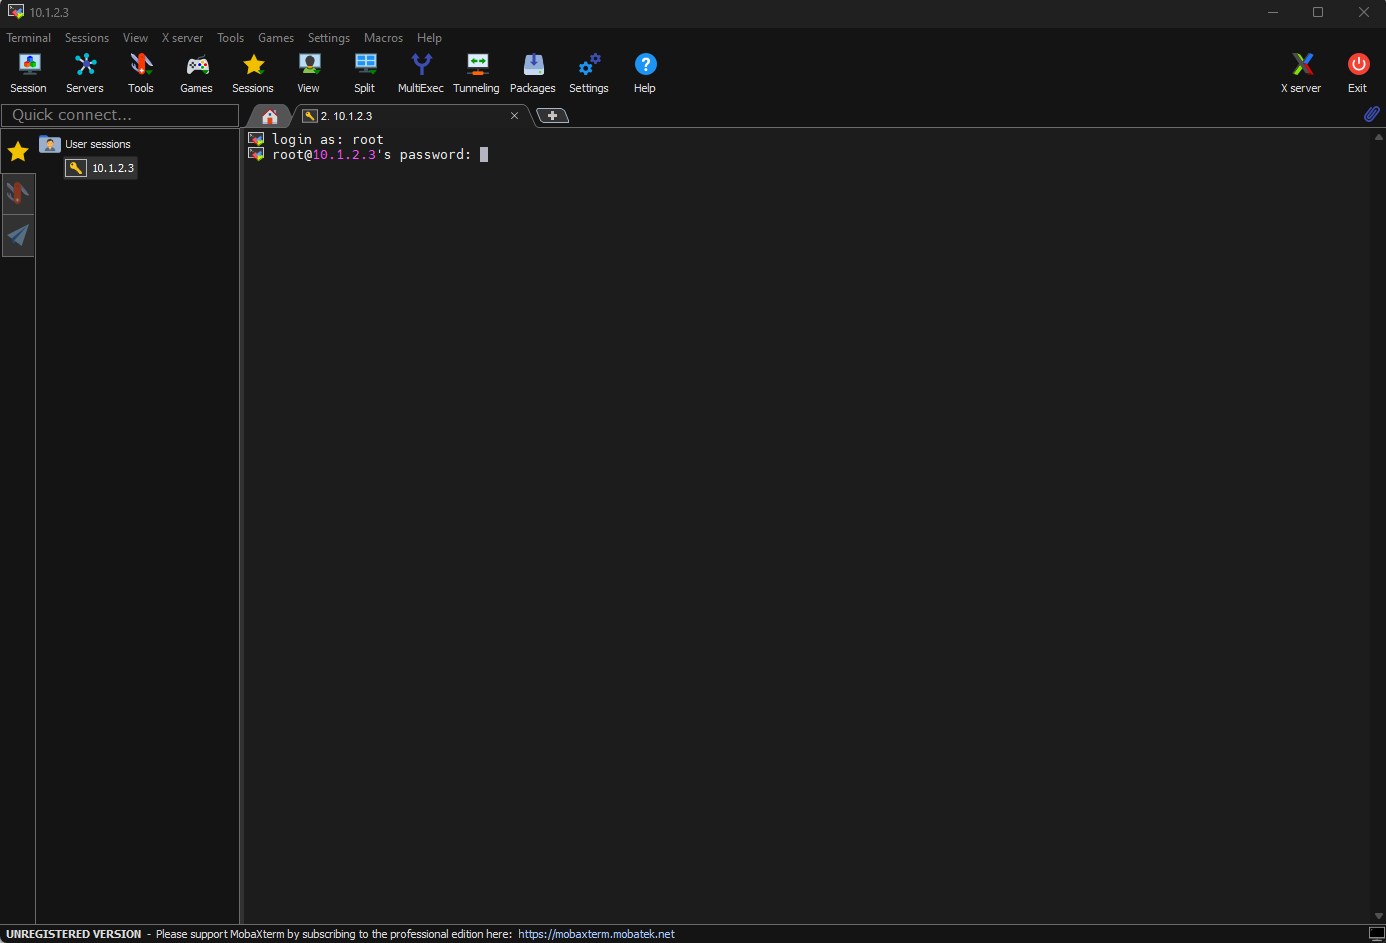
- Server (Host): 10.1.2.3
- Account (Username): root
- Password: dfrobot
Step 8: Collecting information produced by the ultrasonic sensor and the accelerometer
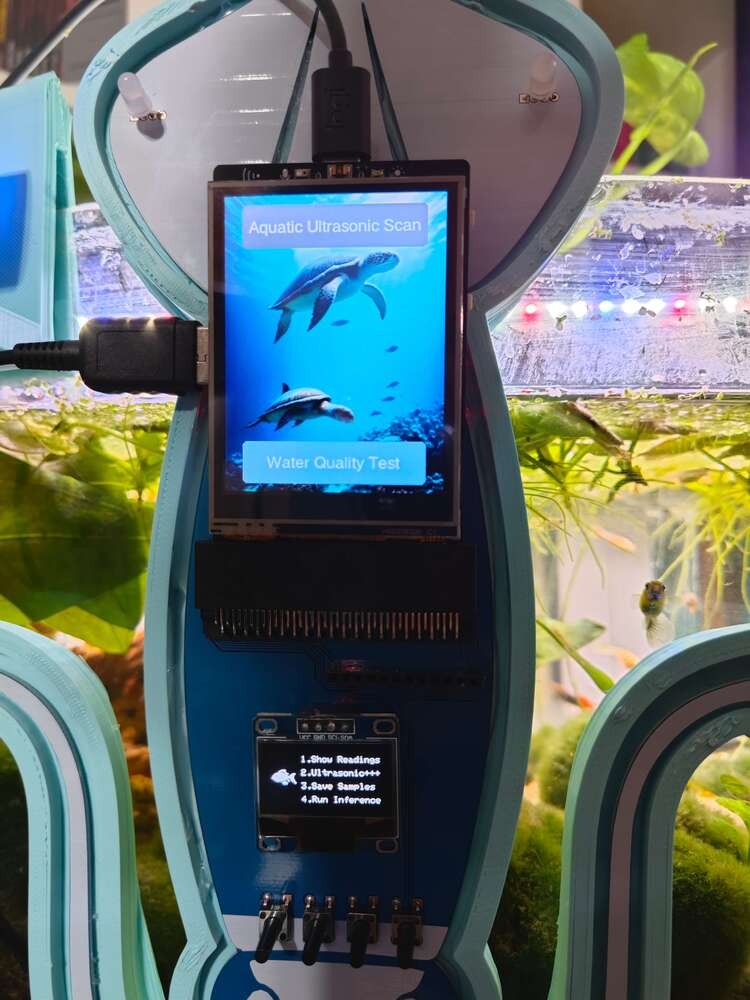
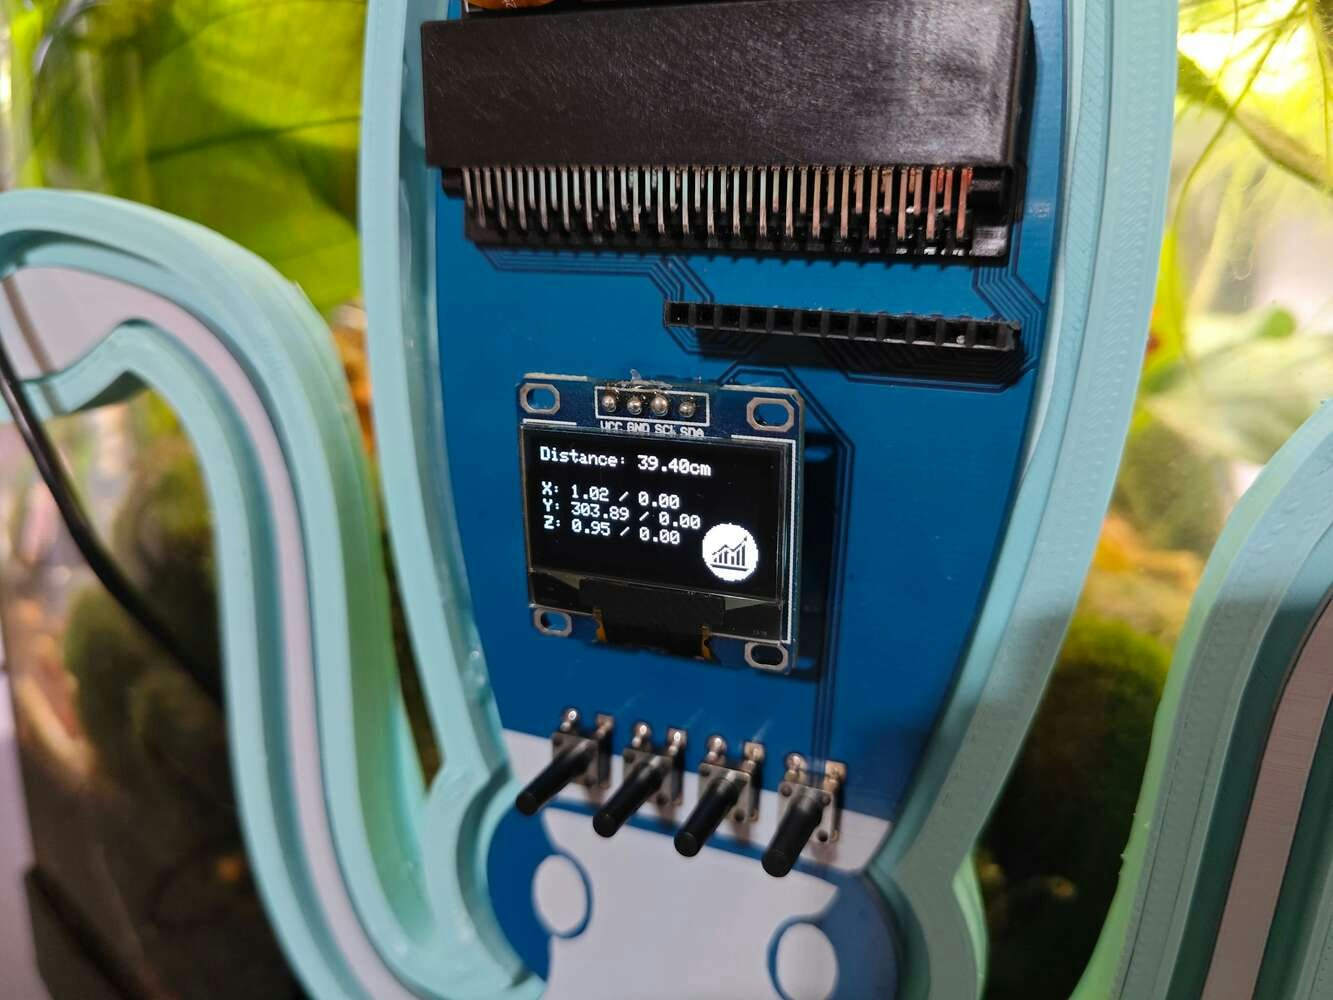
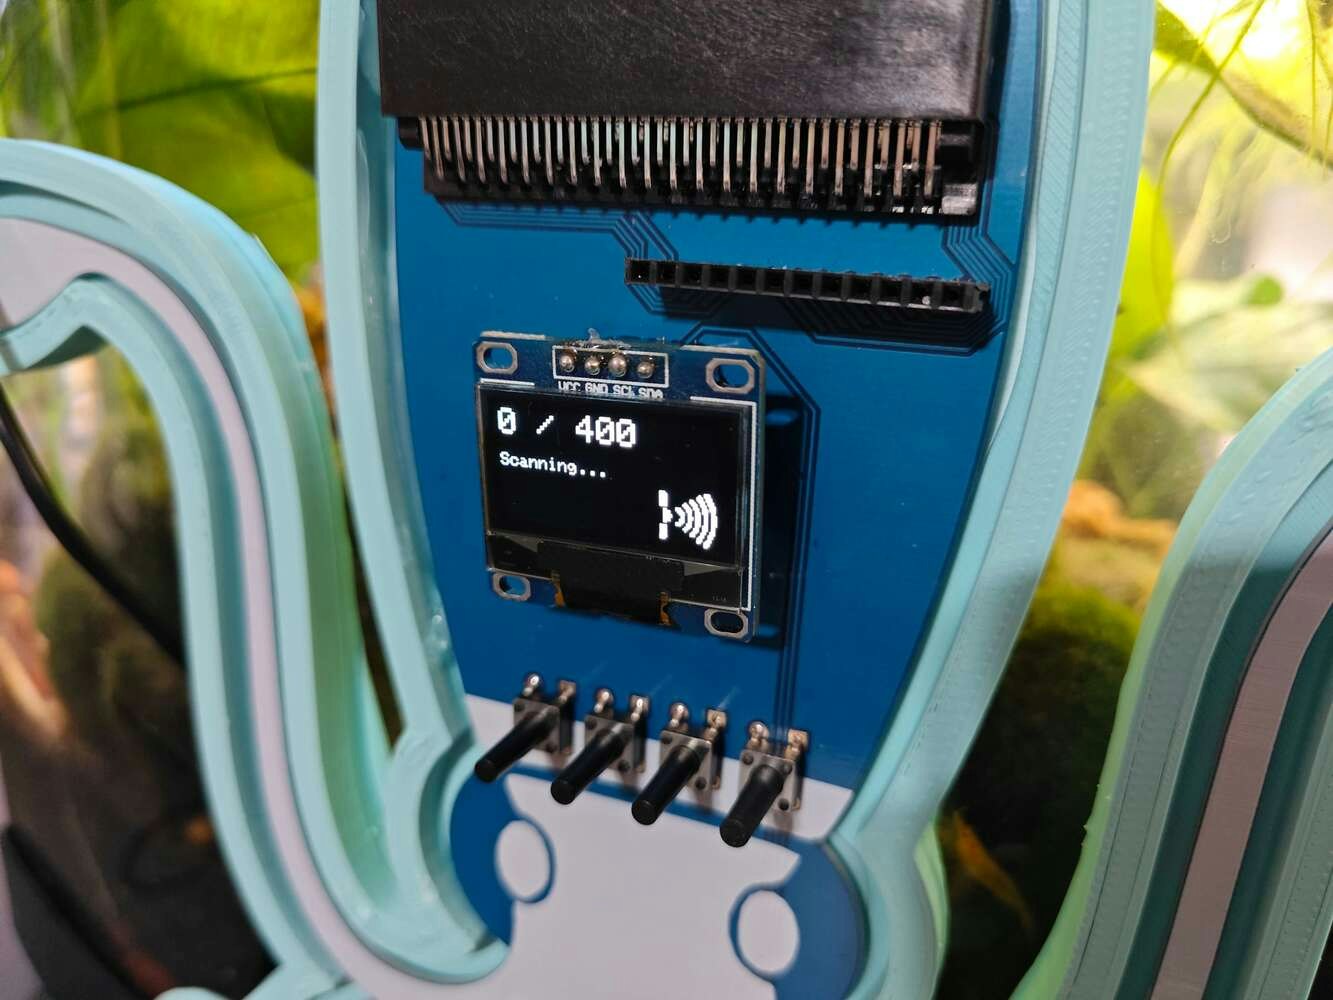
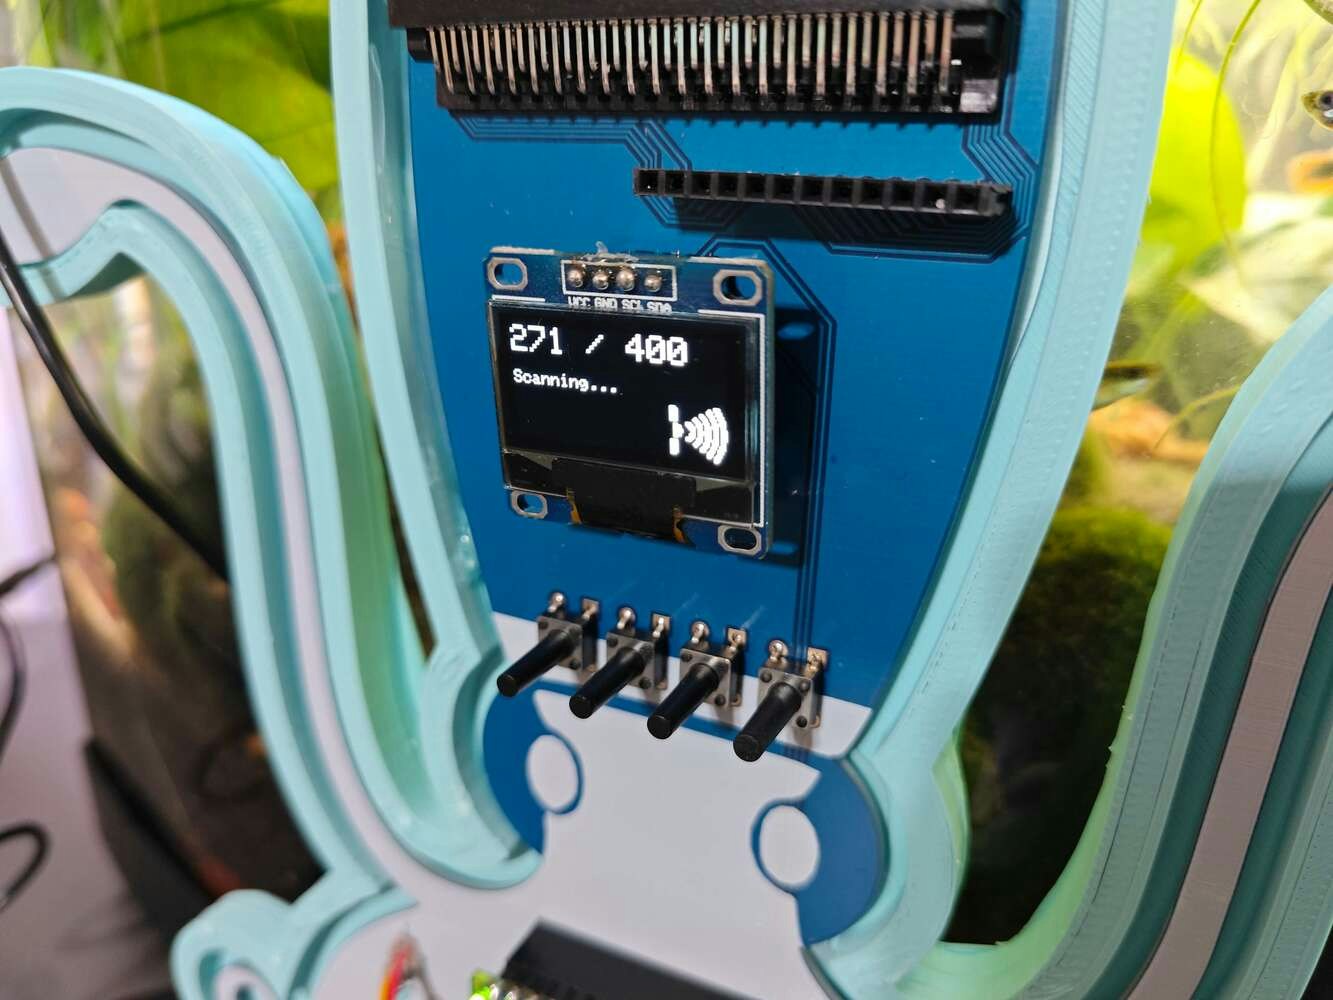
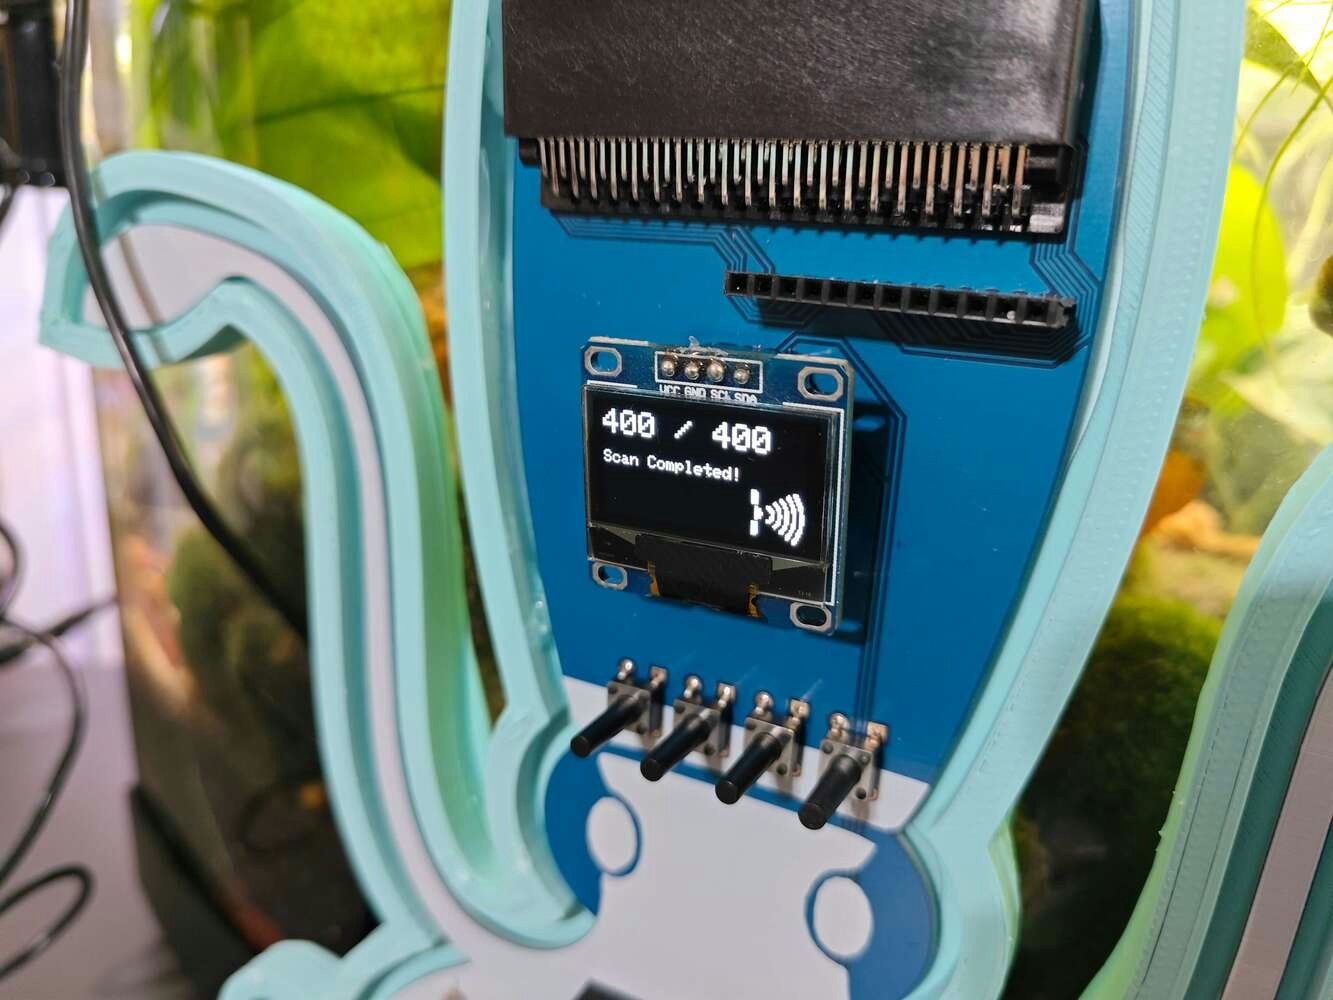
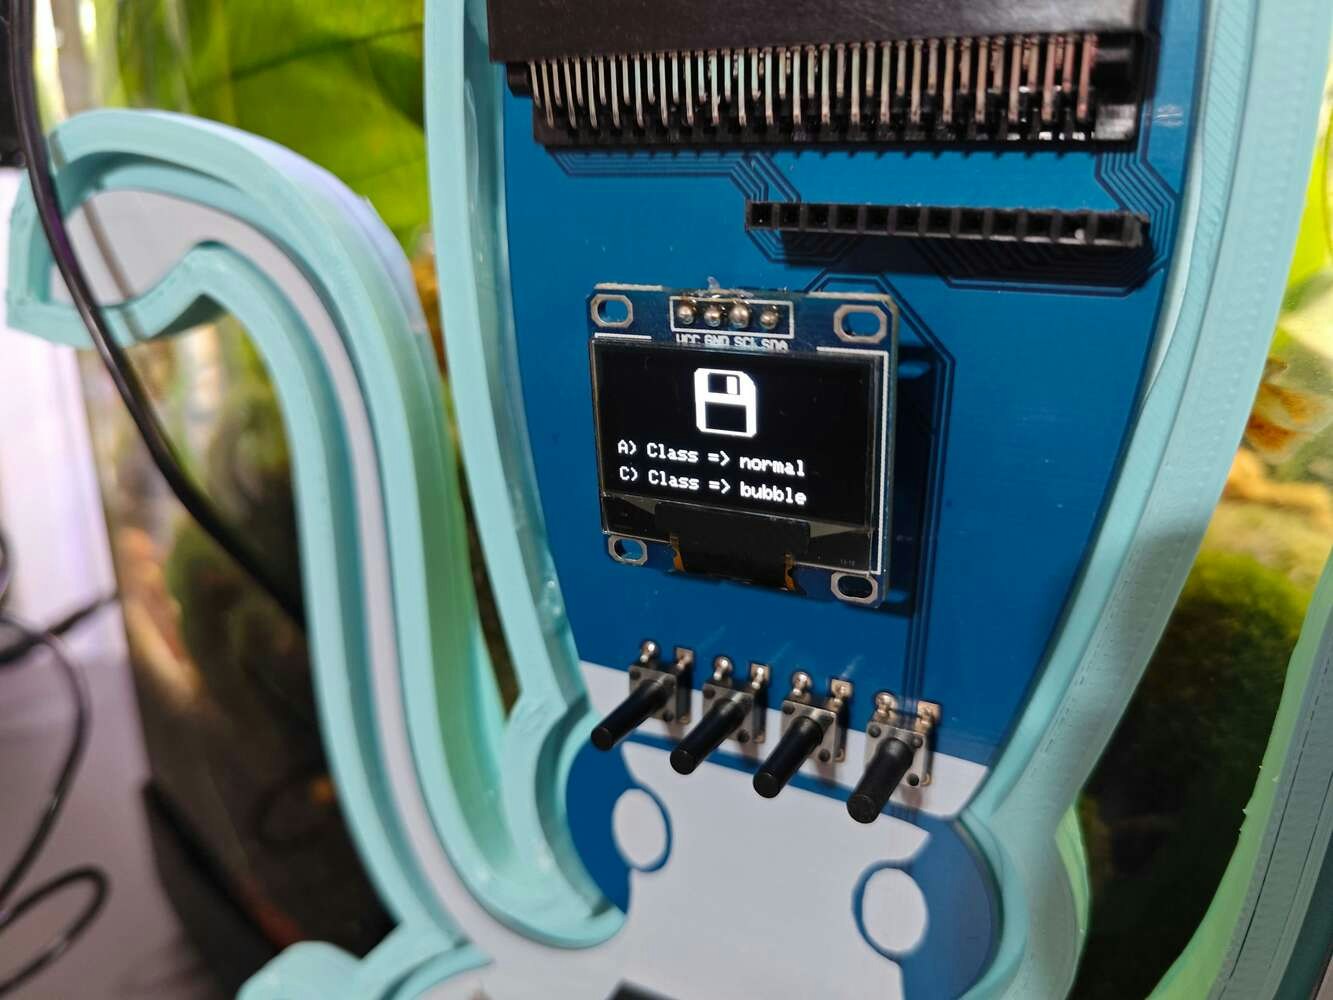
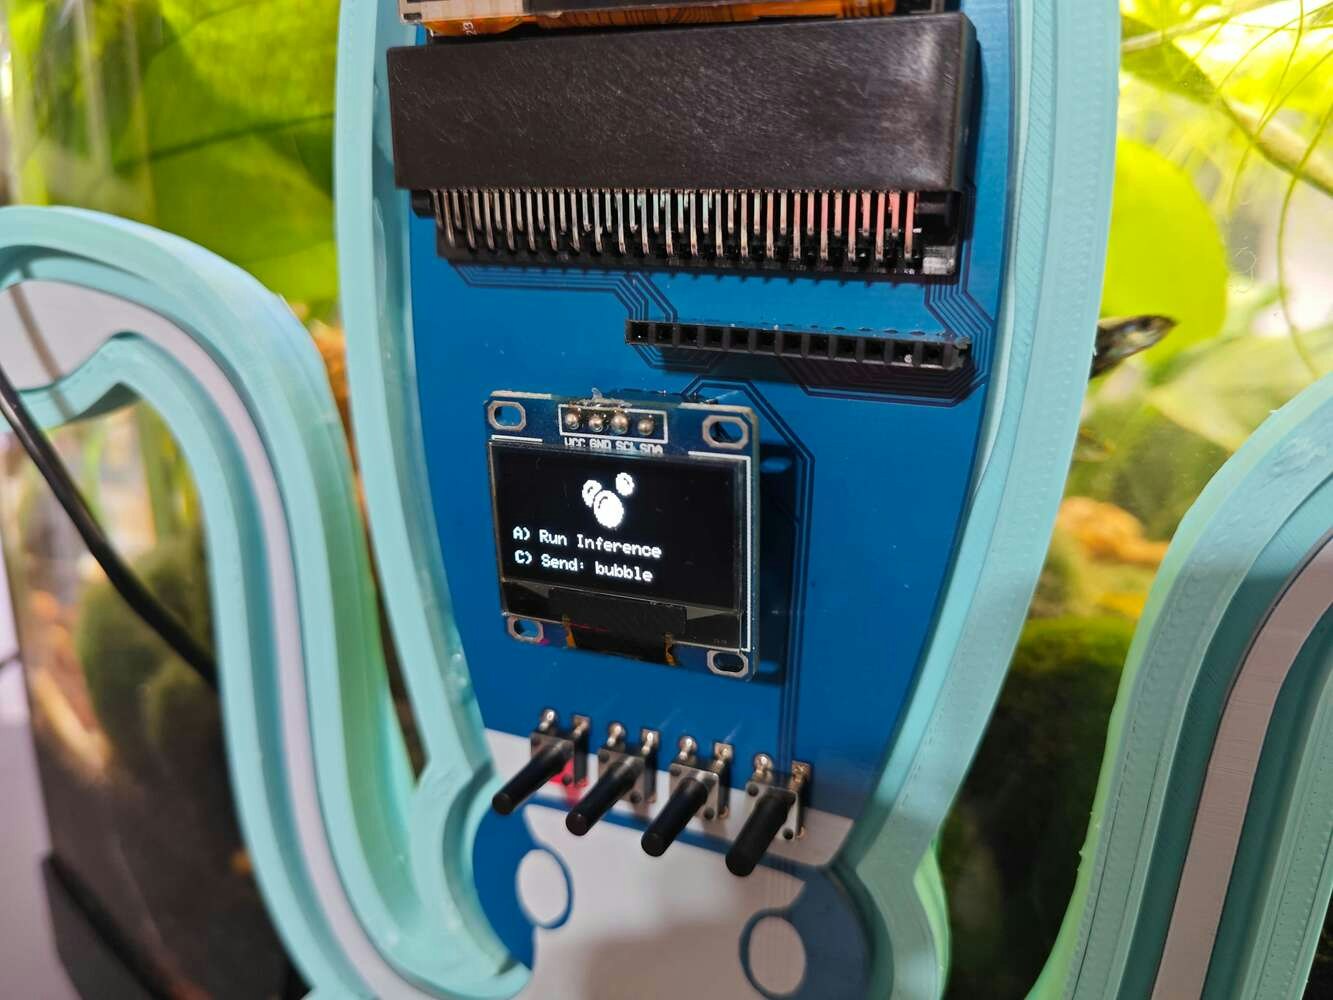
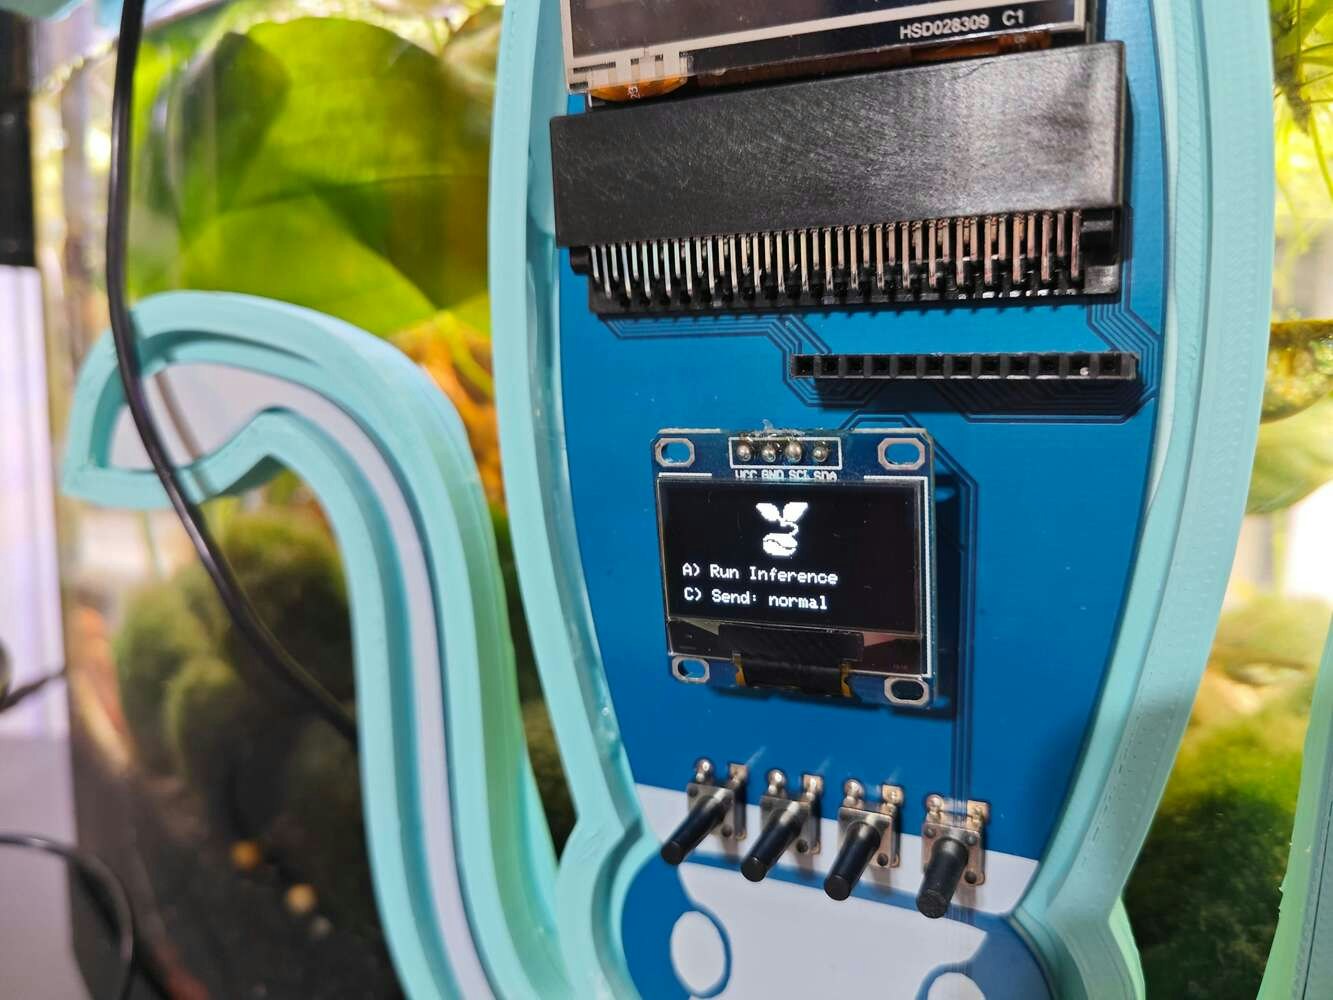
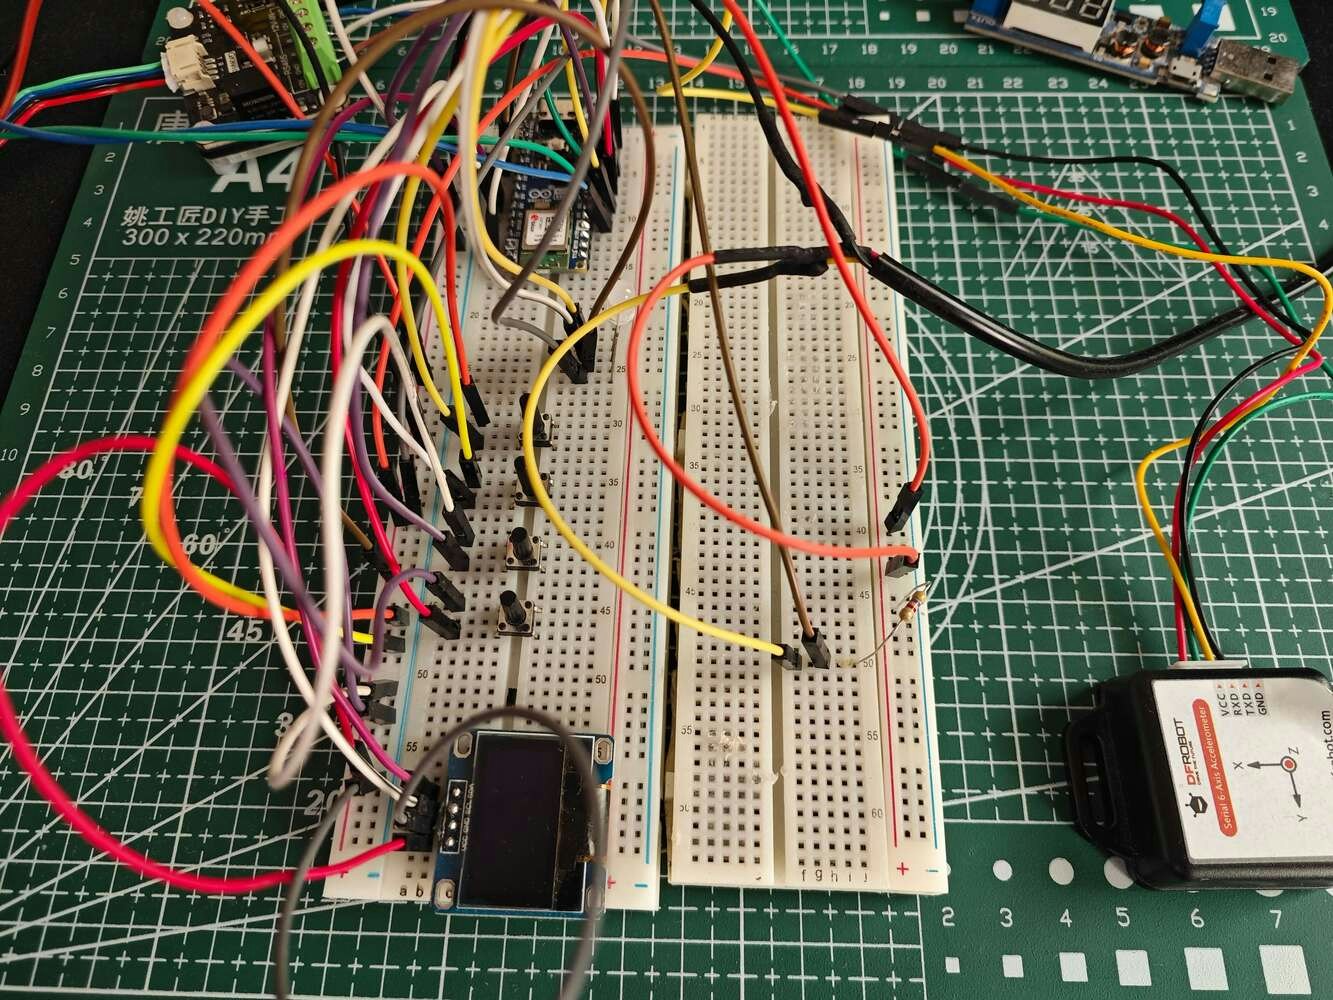
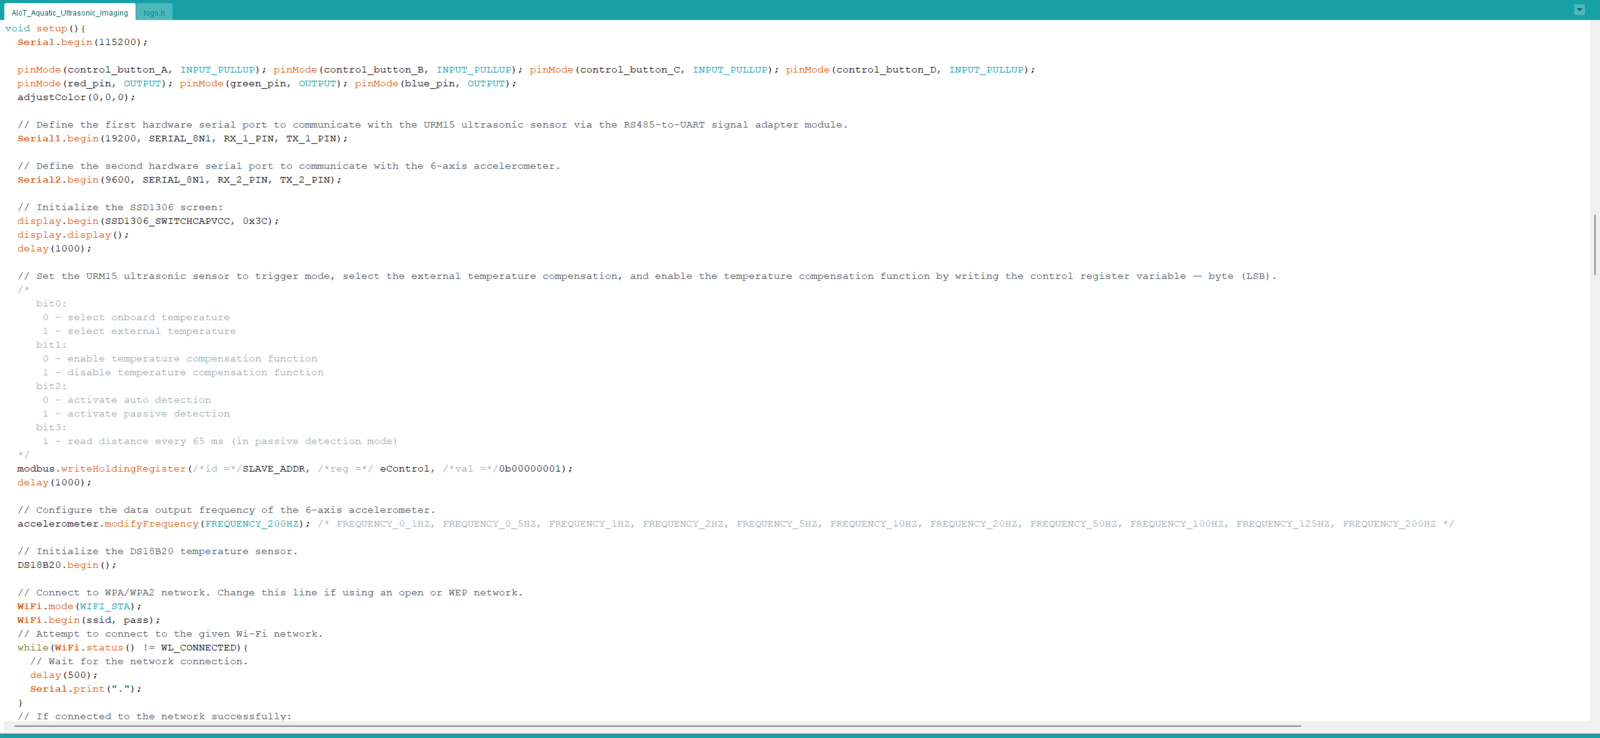
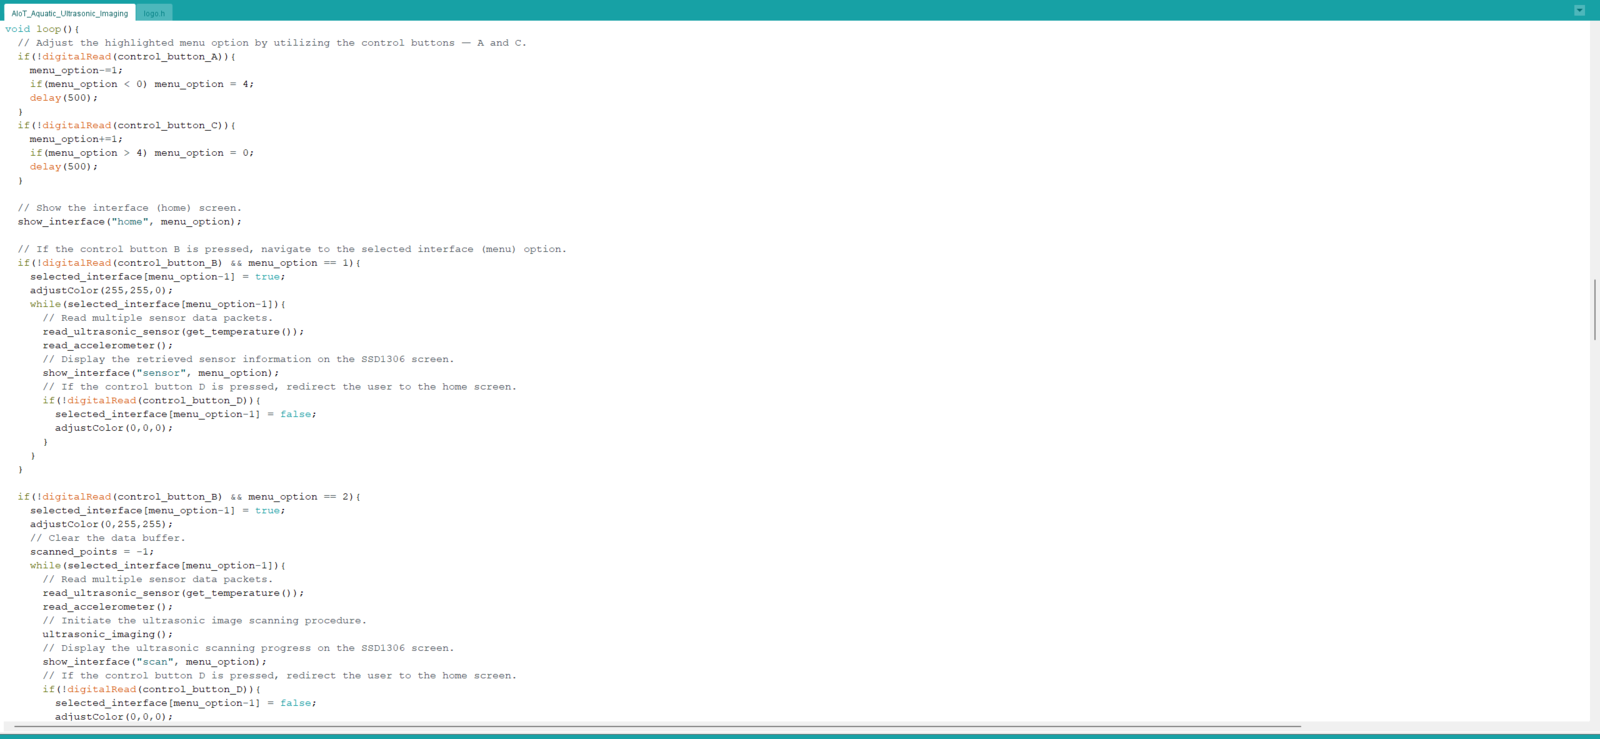
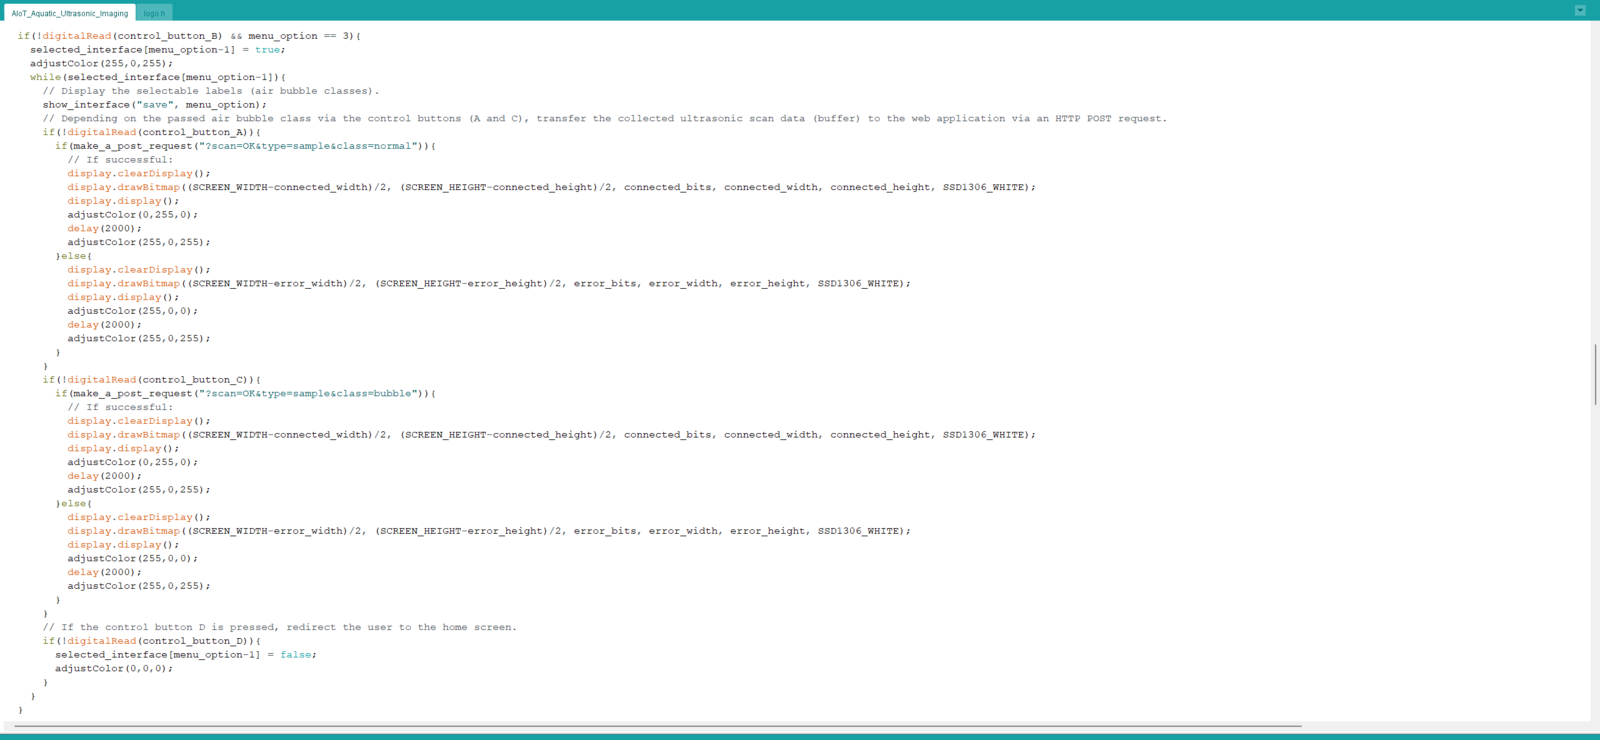
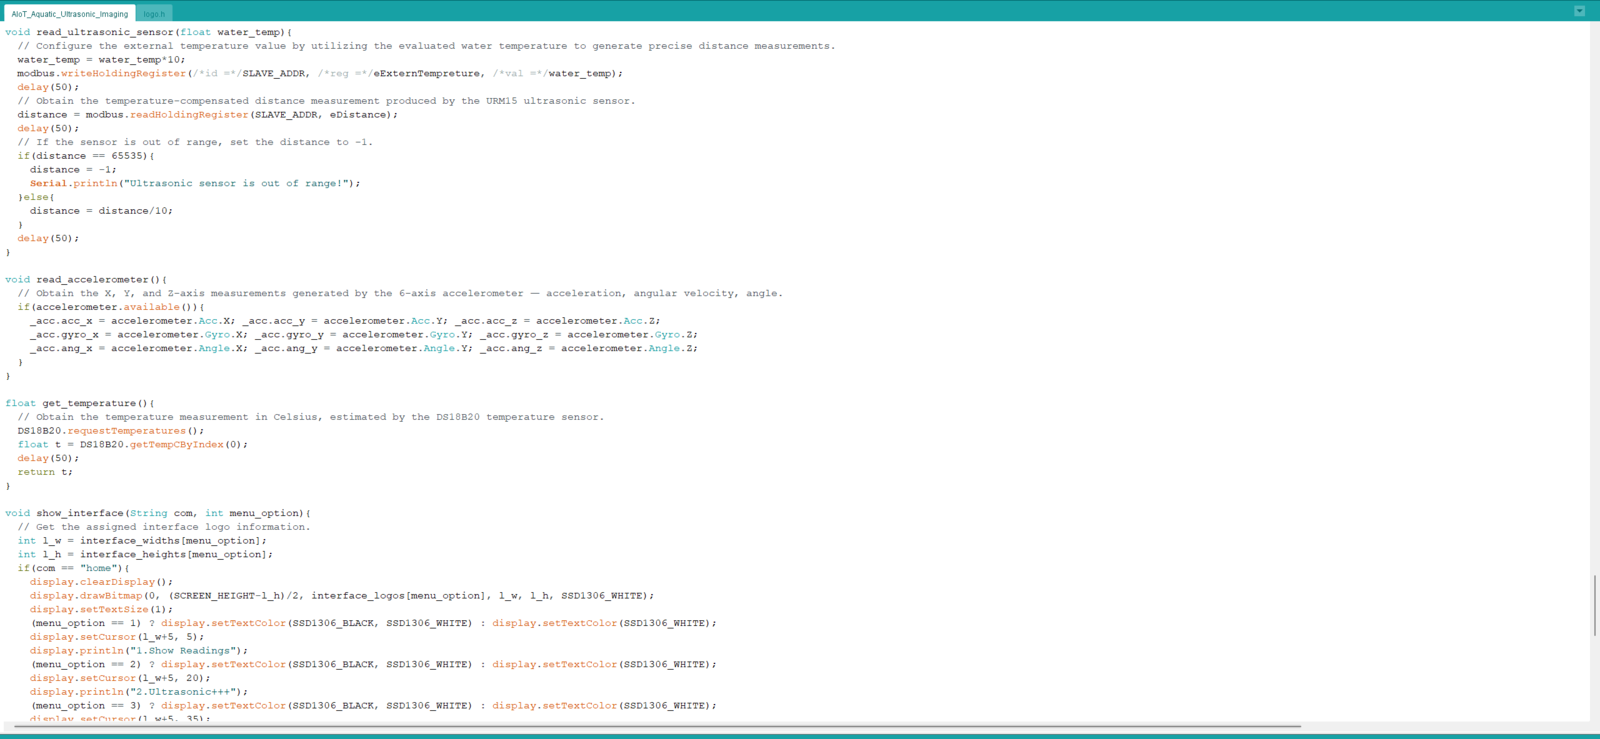
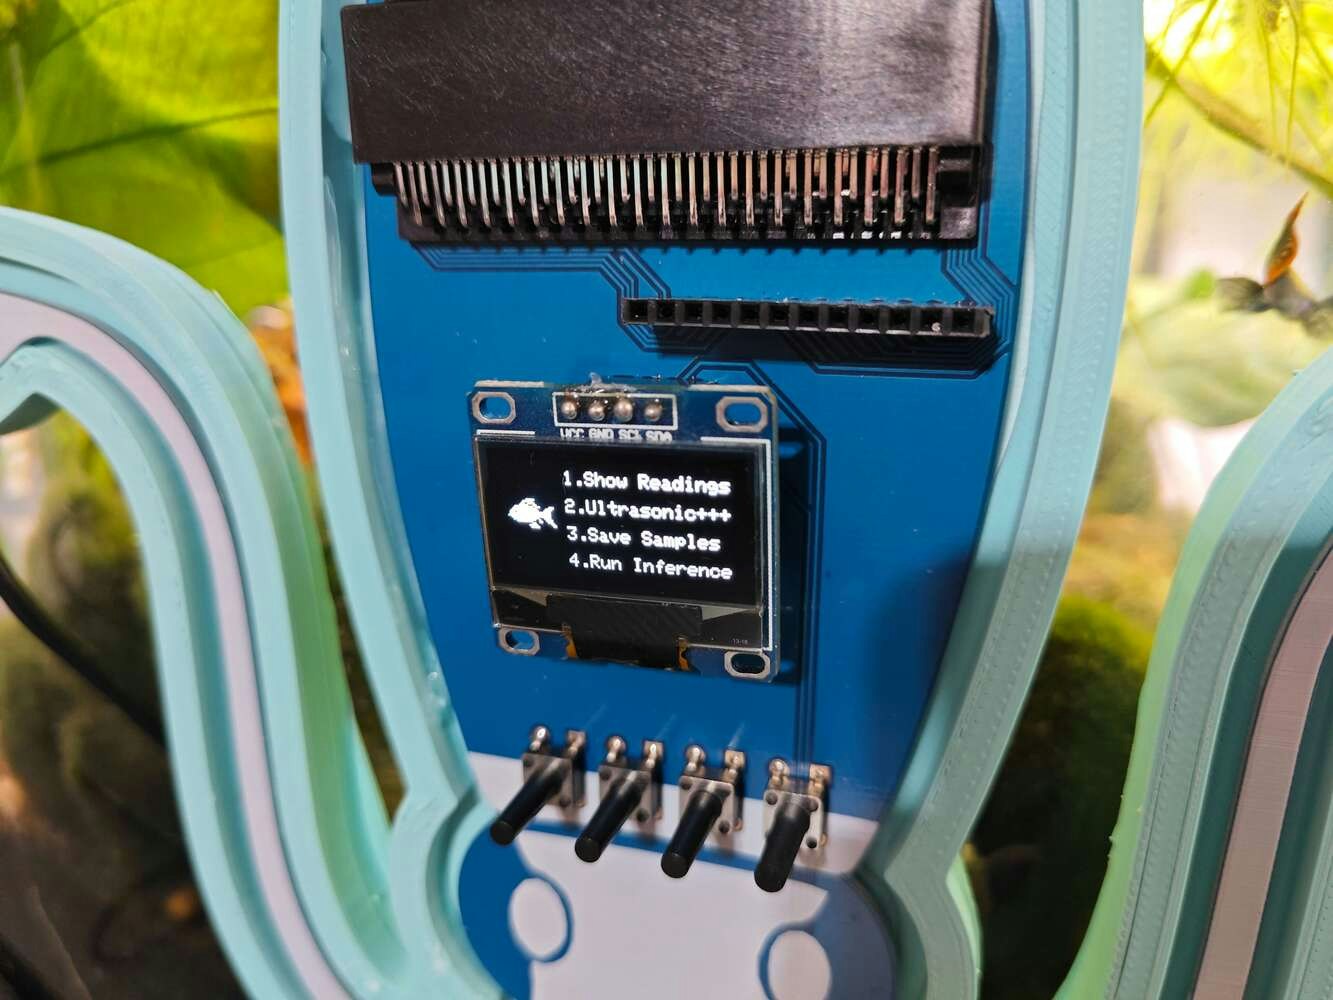
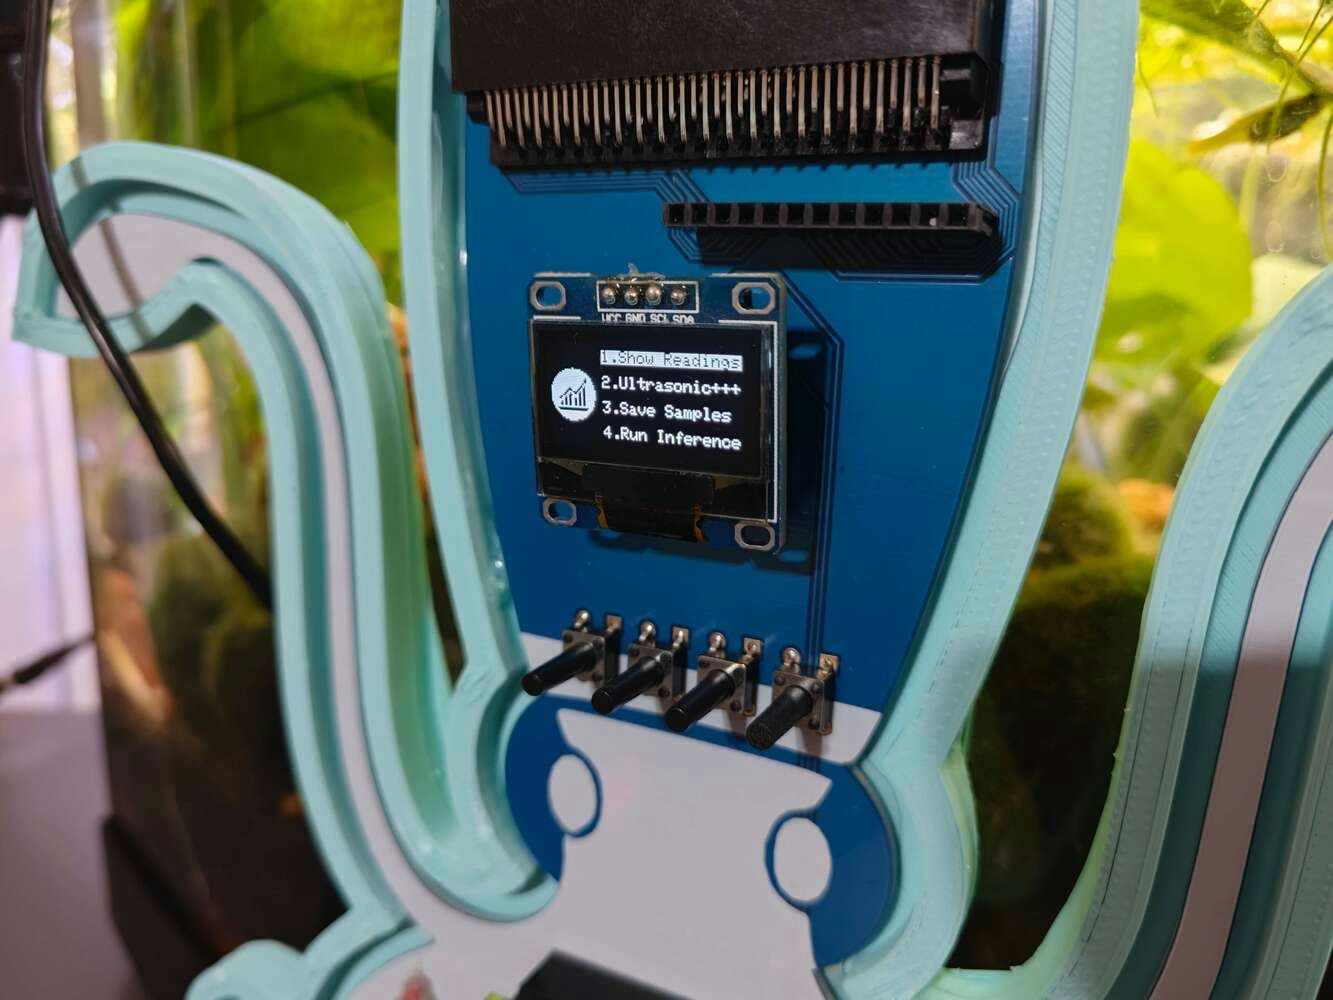
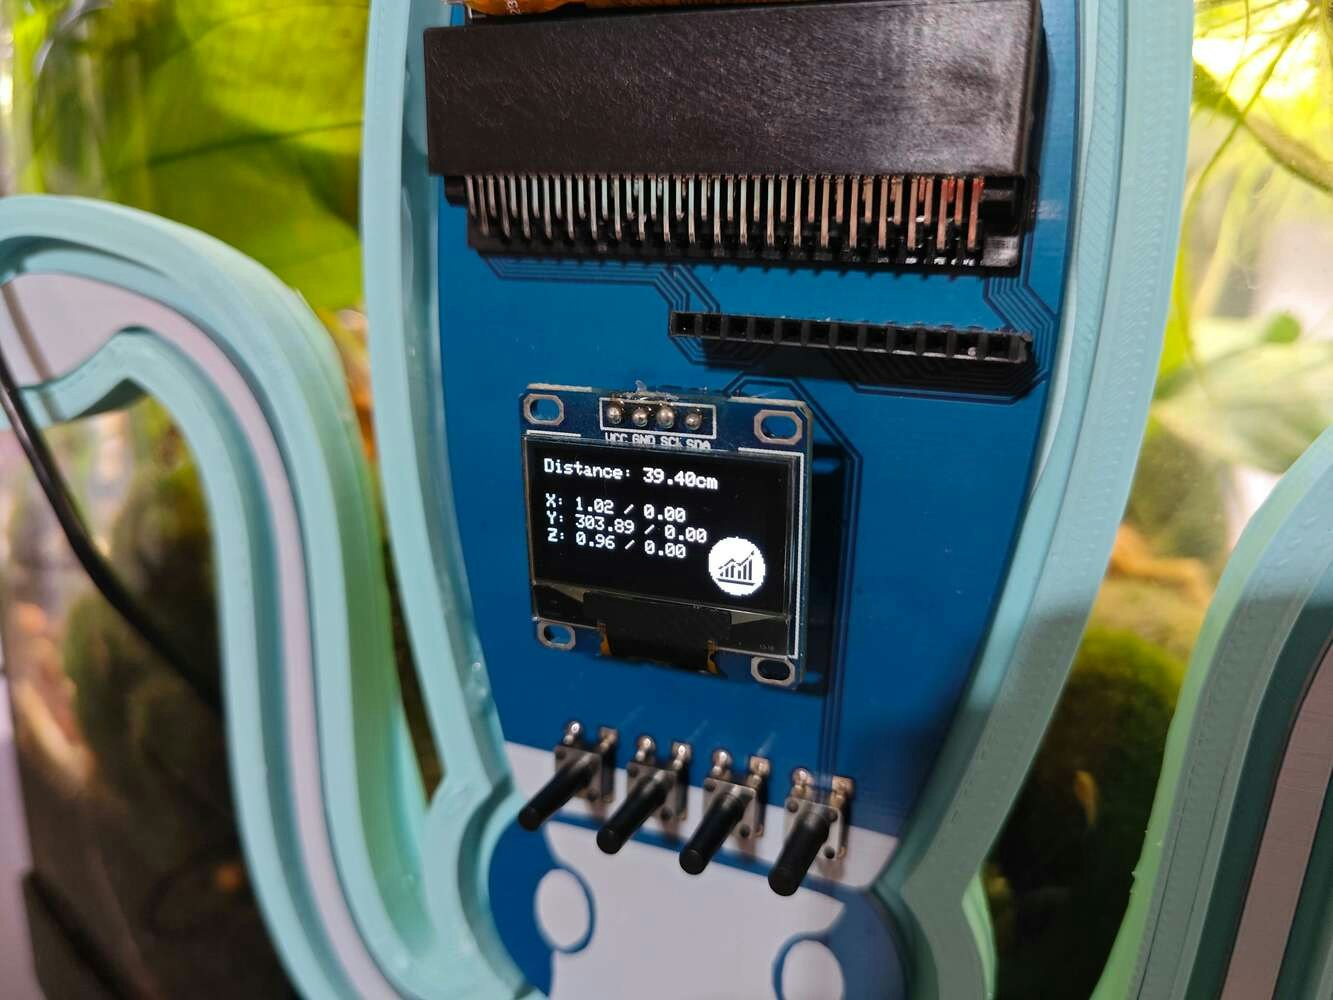
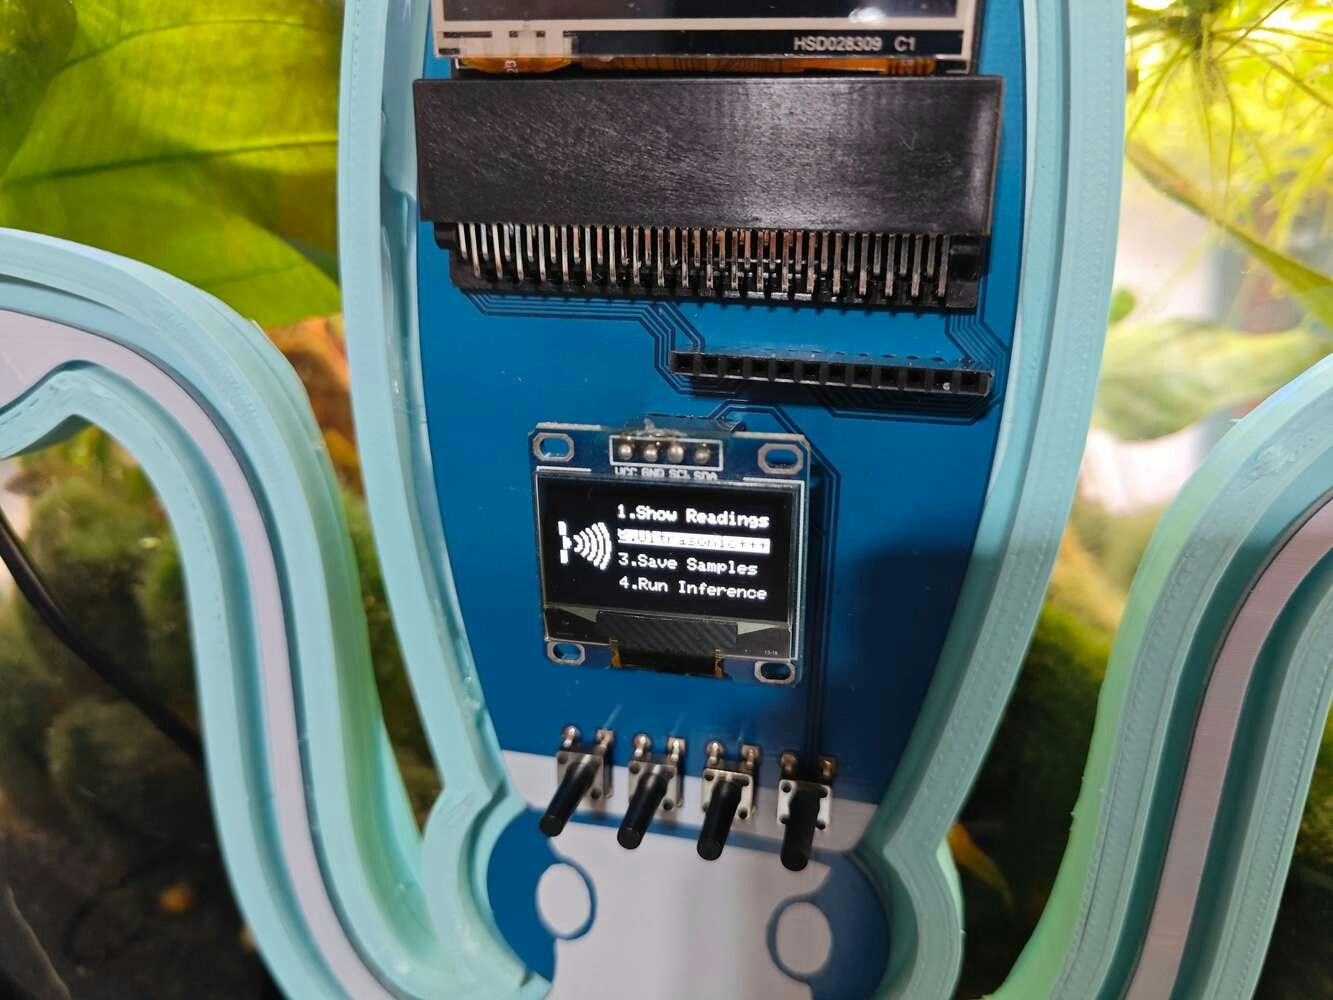
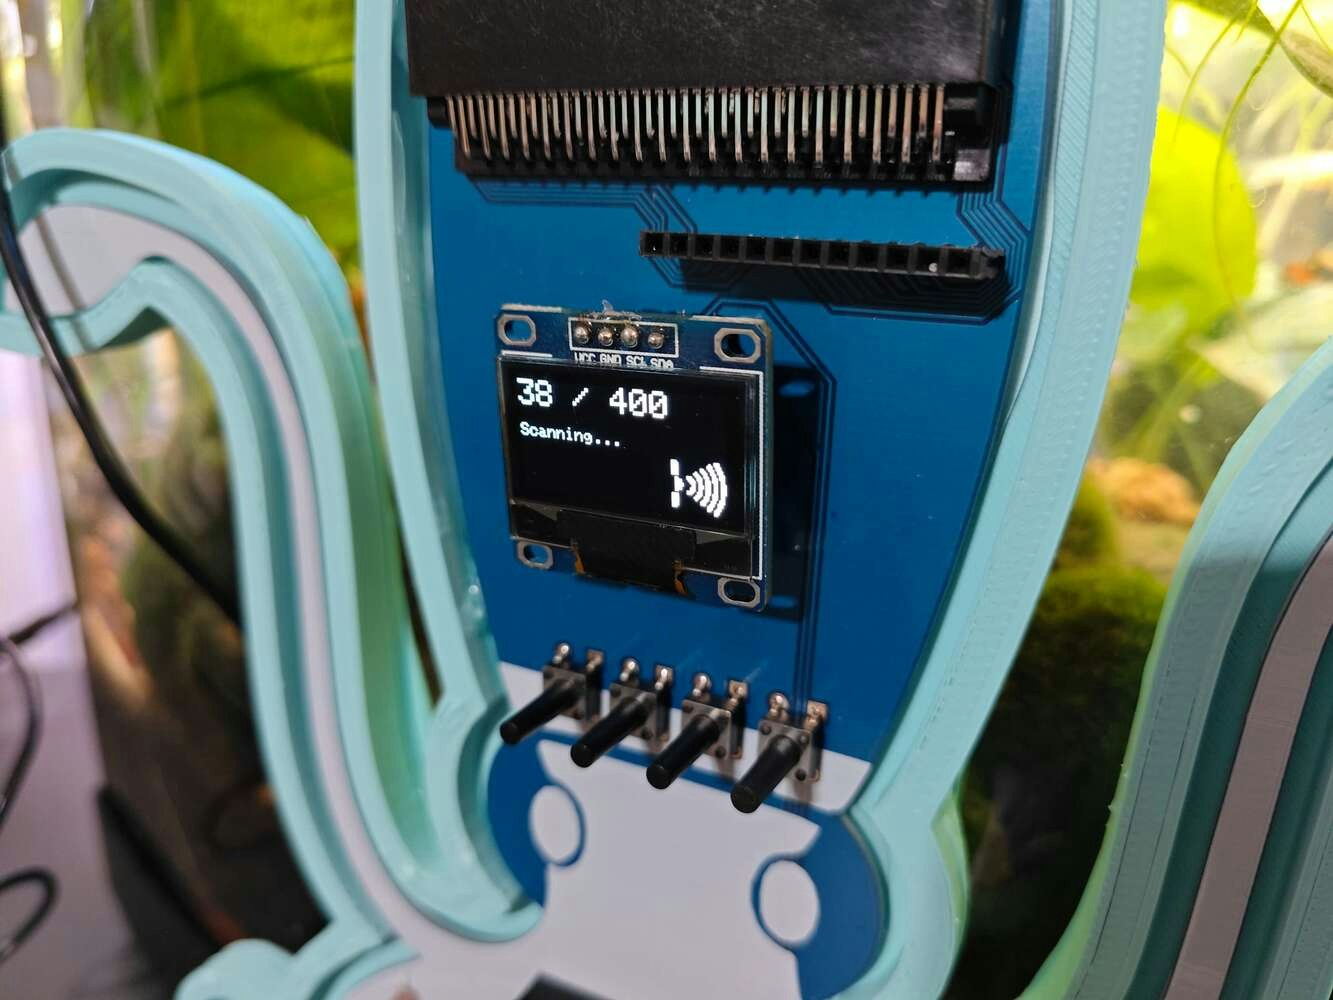
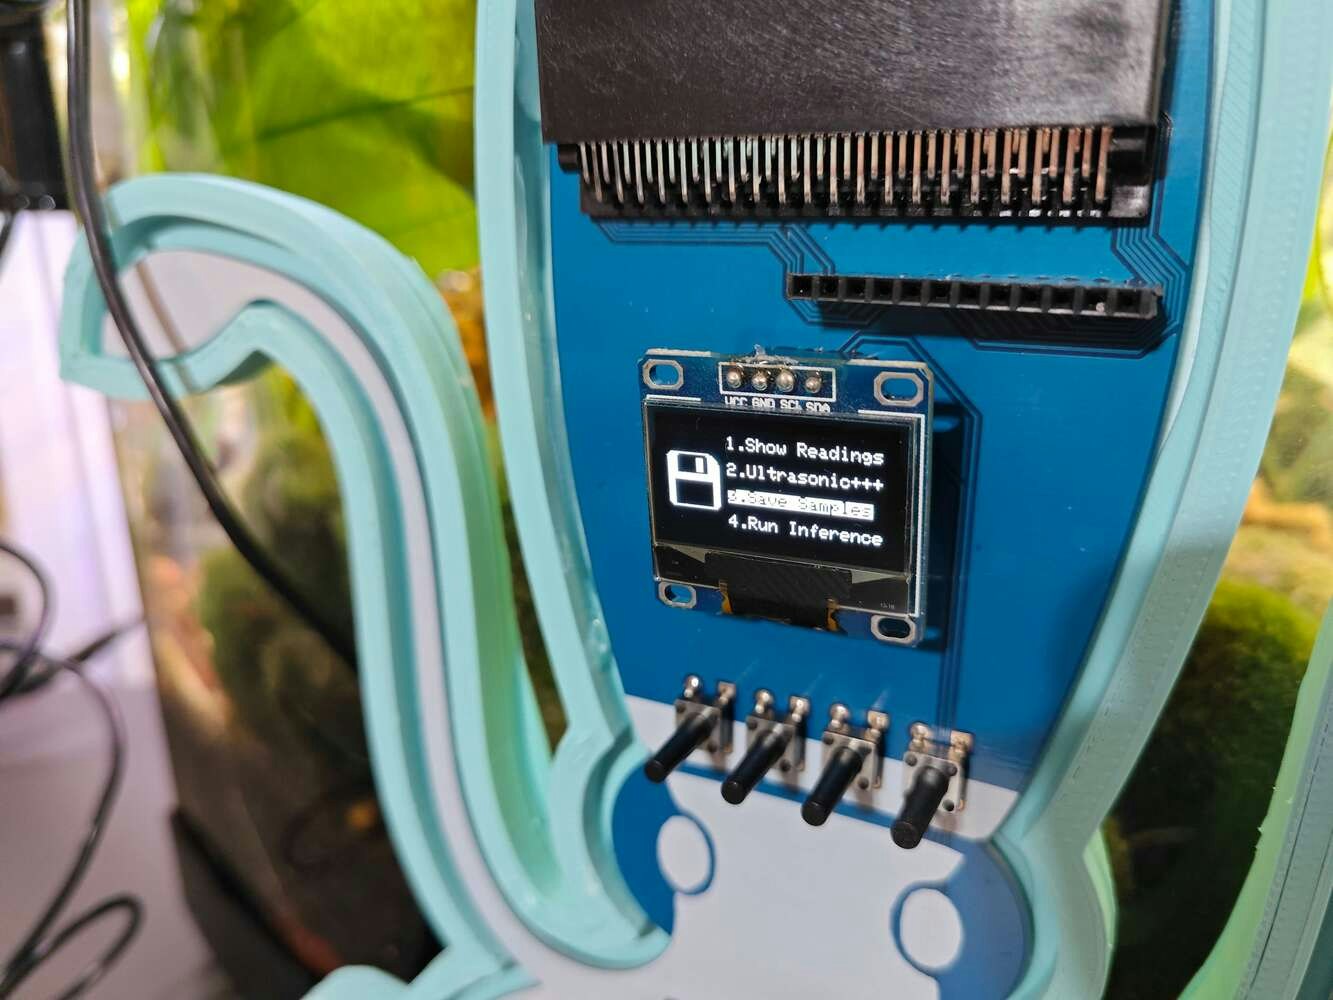
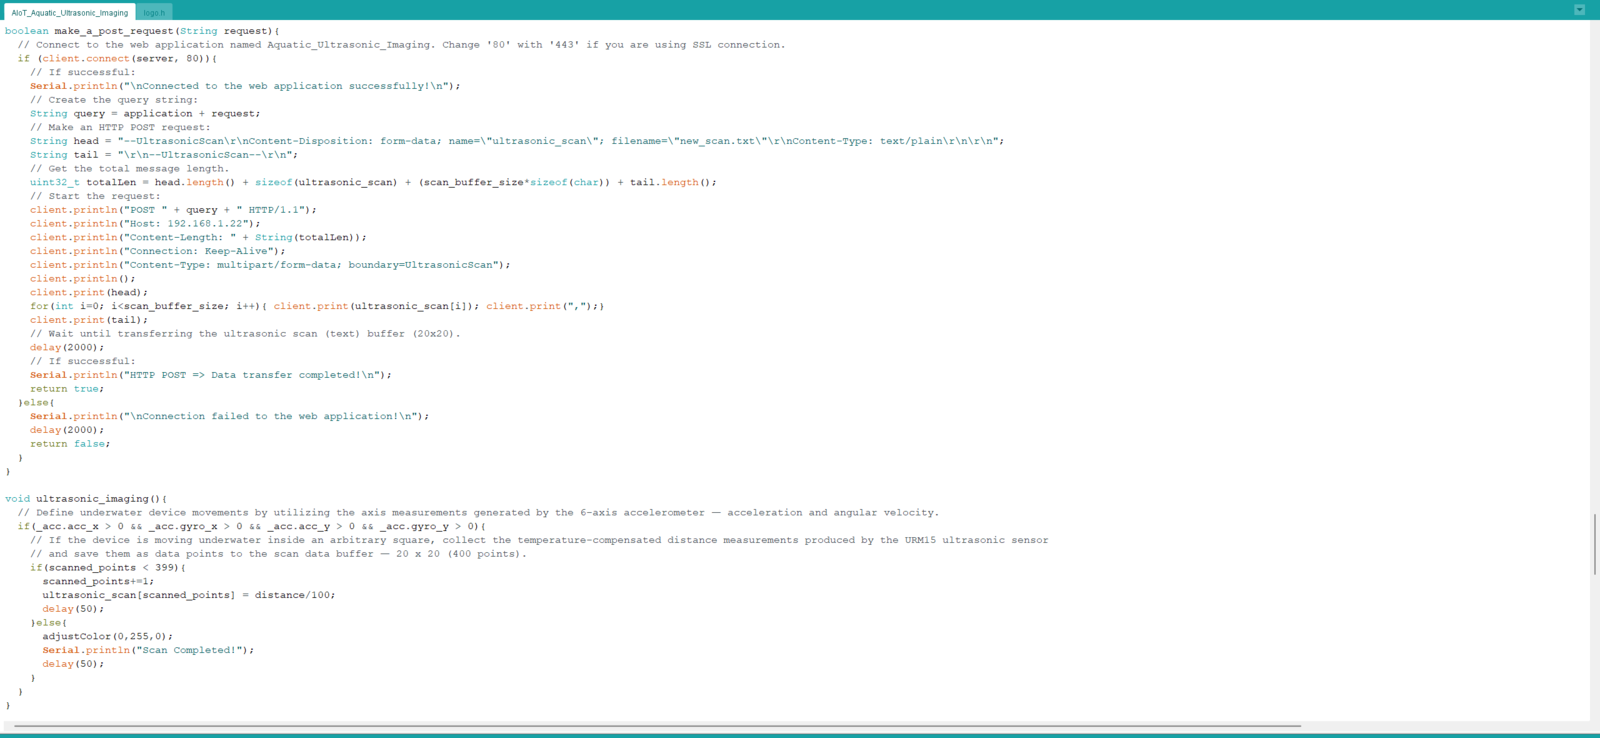
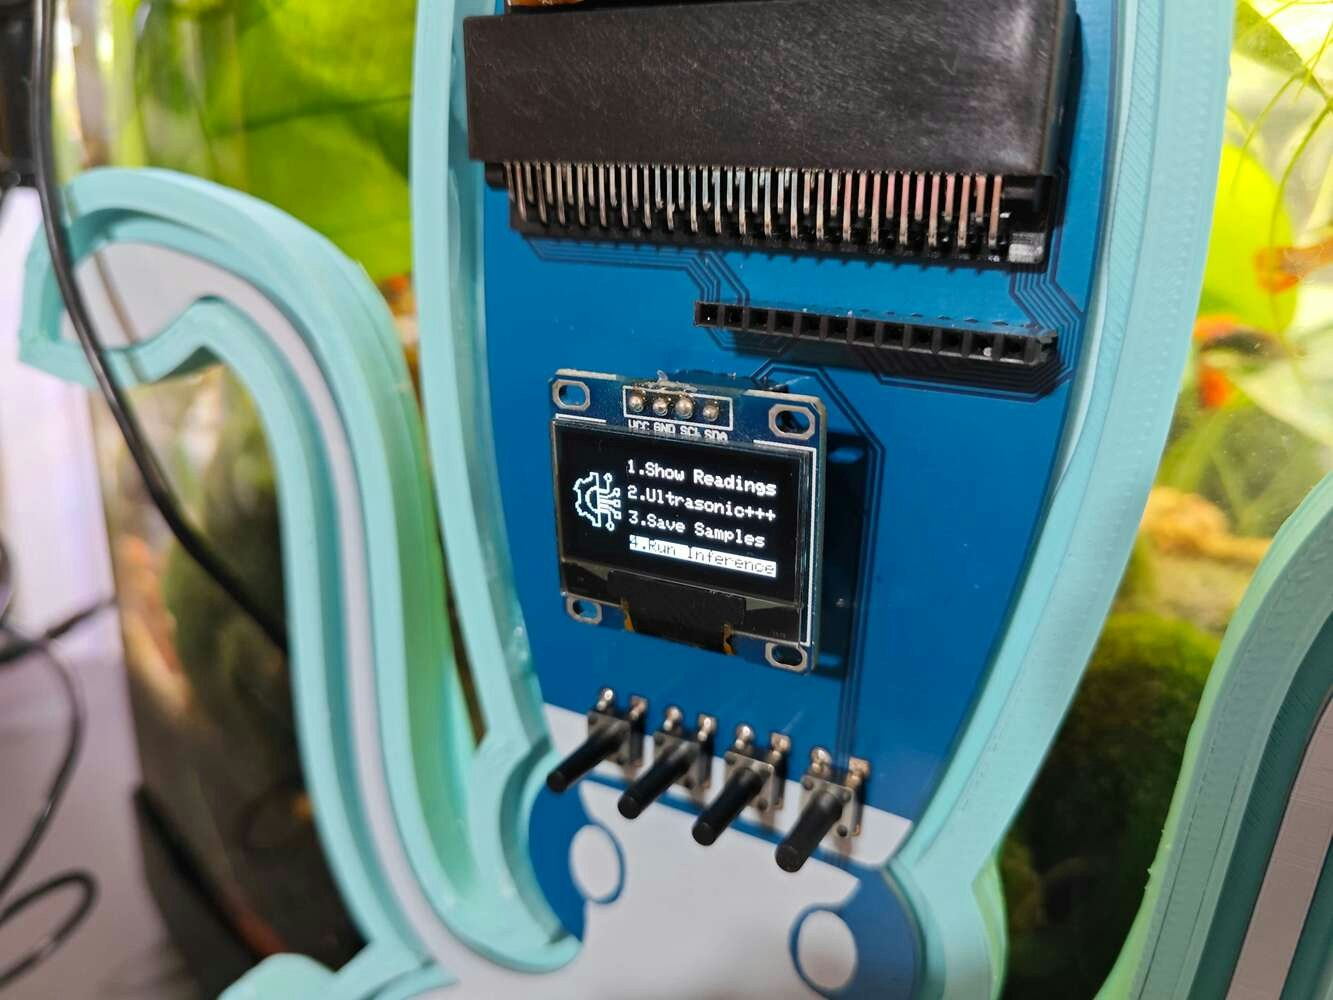
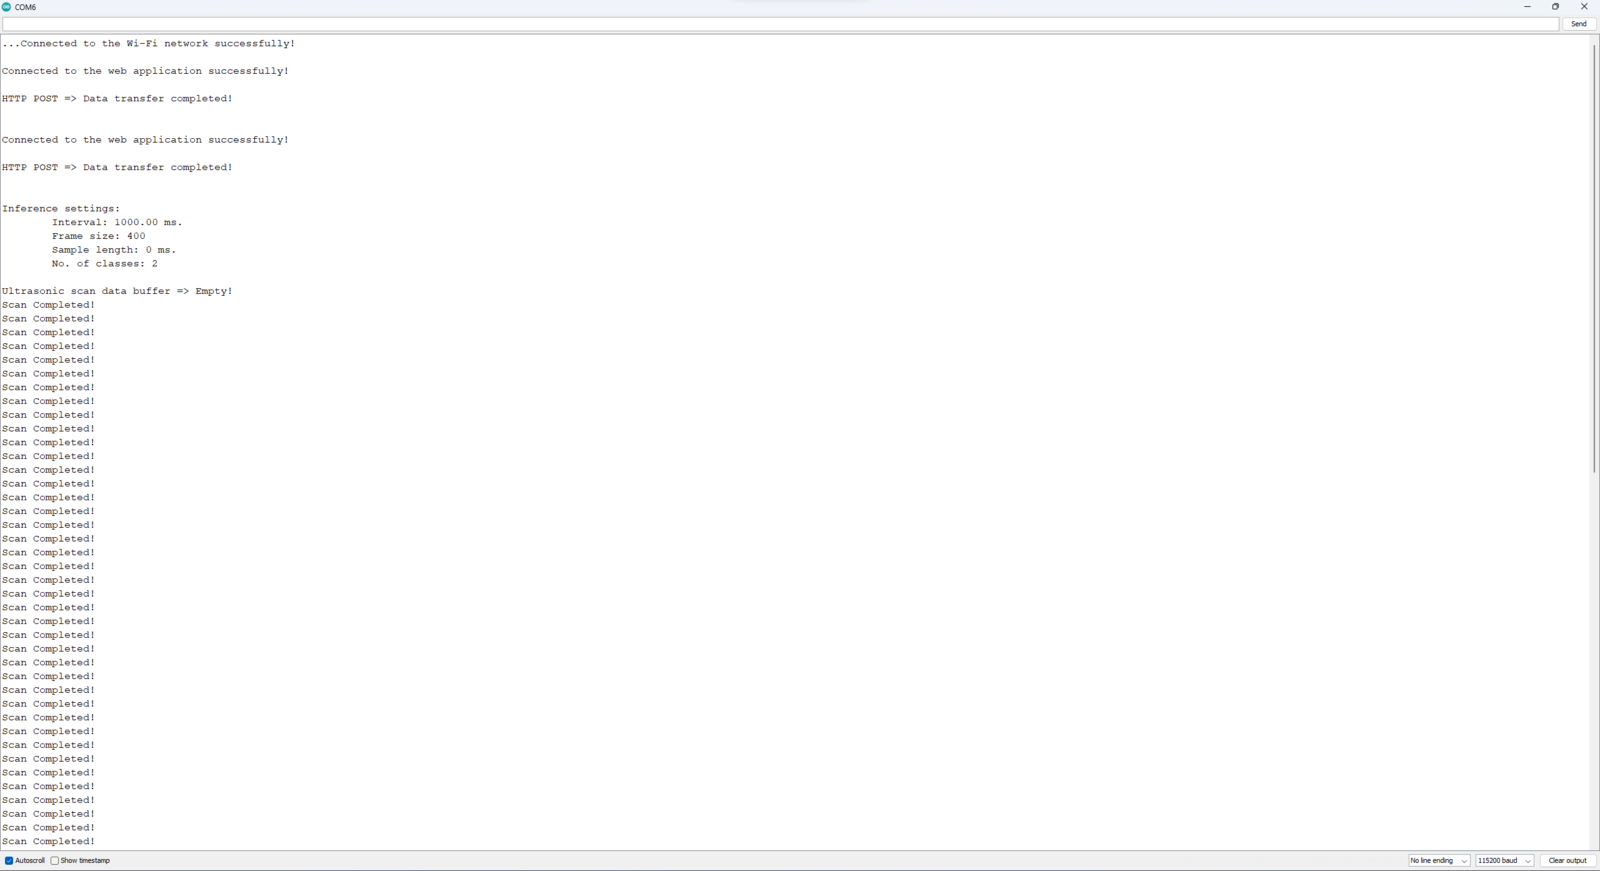
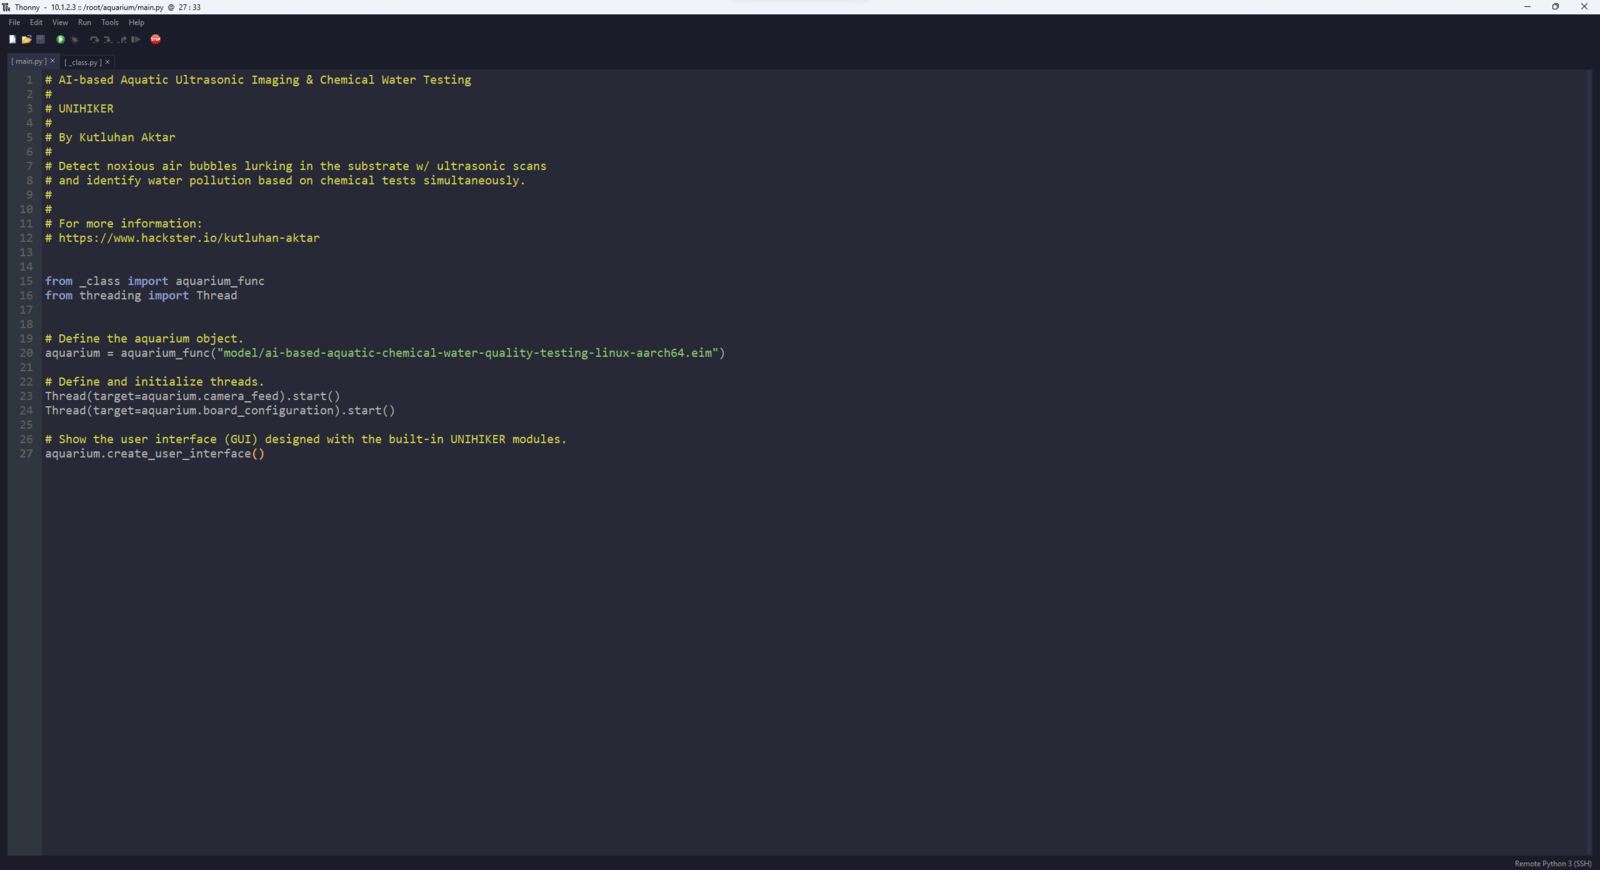
After setting Nano ESP32 on the Arduino IDE, I programmed Nano ESP32 to initiate an aquatic ultrasonic scan, generate an ultrasonic scan data buffer according to the movements detected by the accelerometer, and transfer the generated ultrasonic scan buffer to the web application via an HTTP POST request. Since I wanted to provide a feature-rich user interface allowing the user to assign labels while collecting data samples, I decided to connect the SSD1306 OLED display and four control buttons to Nano ESP32. Via the user interface, I was able to assign air bubble classes empirically and send the generated ultrasonic scan buffer with the selected air bubble class (label) directly to the web application. As mentioned earlier, Nano ESP32 does not provide an onboard storage option. Thus, by transferring samples to the web application, I obviated the need for connecting external storage to Nano ESP32. Since Nano ESP32 features three hardware serial (UART) ports, excluding the USB serial port, I was able to connect multiple sensors requiring serial communication without a data transmission conflict. As explained in the previous steps, the web application sorts the transferred data packet to save ultrasonic scan samples as text files named according to the assigned classes. This AI-powered underwater air bubble detection device comprises two separate development boards — Nano ESP32 and UNIHIKER — performing interconnected features for data collection and running advanced AI models. Thus, the described code snippets show the different aspects of the same code file. Please refer to the code files below to inspect all interconnected functions in detail. 📁 AIoT_Aquatic_Ultrasonic_Imaging.ino ⭐ Include the required libraries.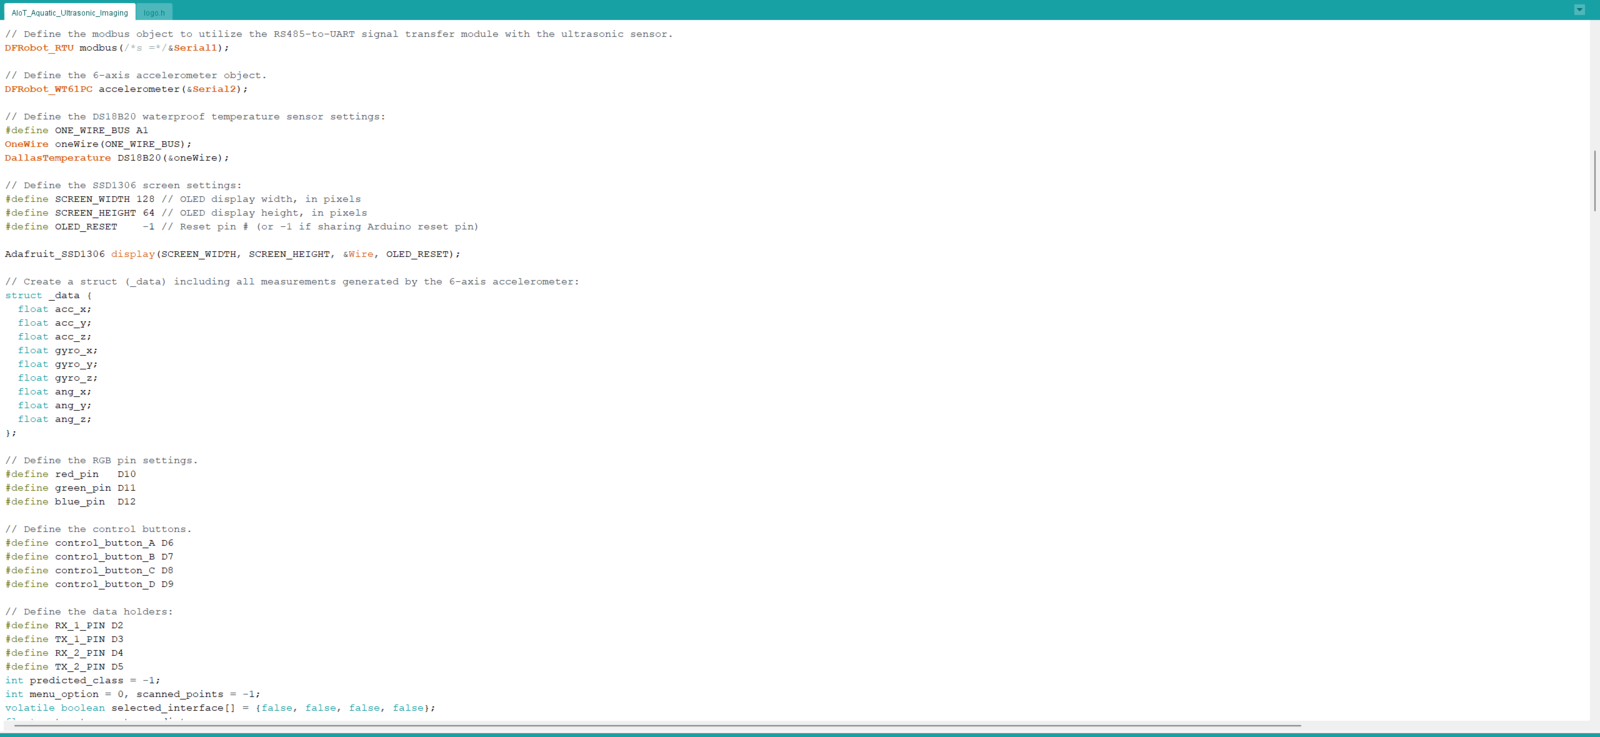
Step 8.1: Generating aquatic ultrasonic scans manifesting air bubbles and saving samples via the web application
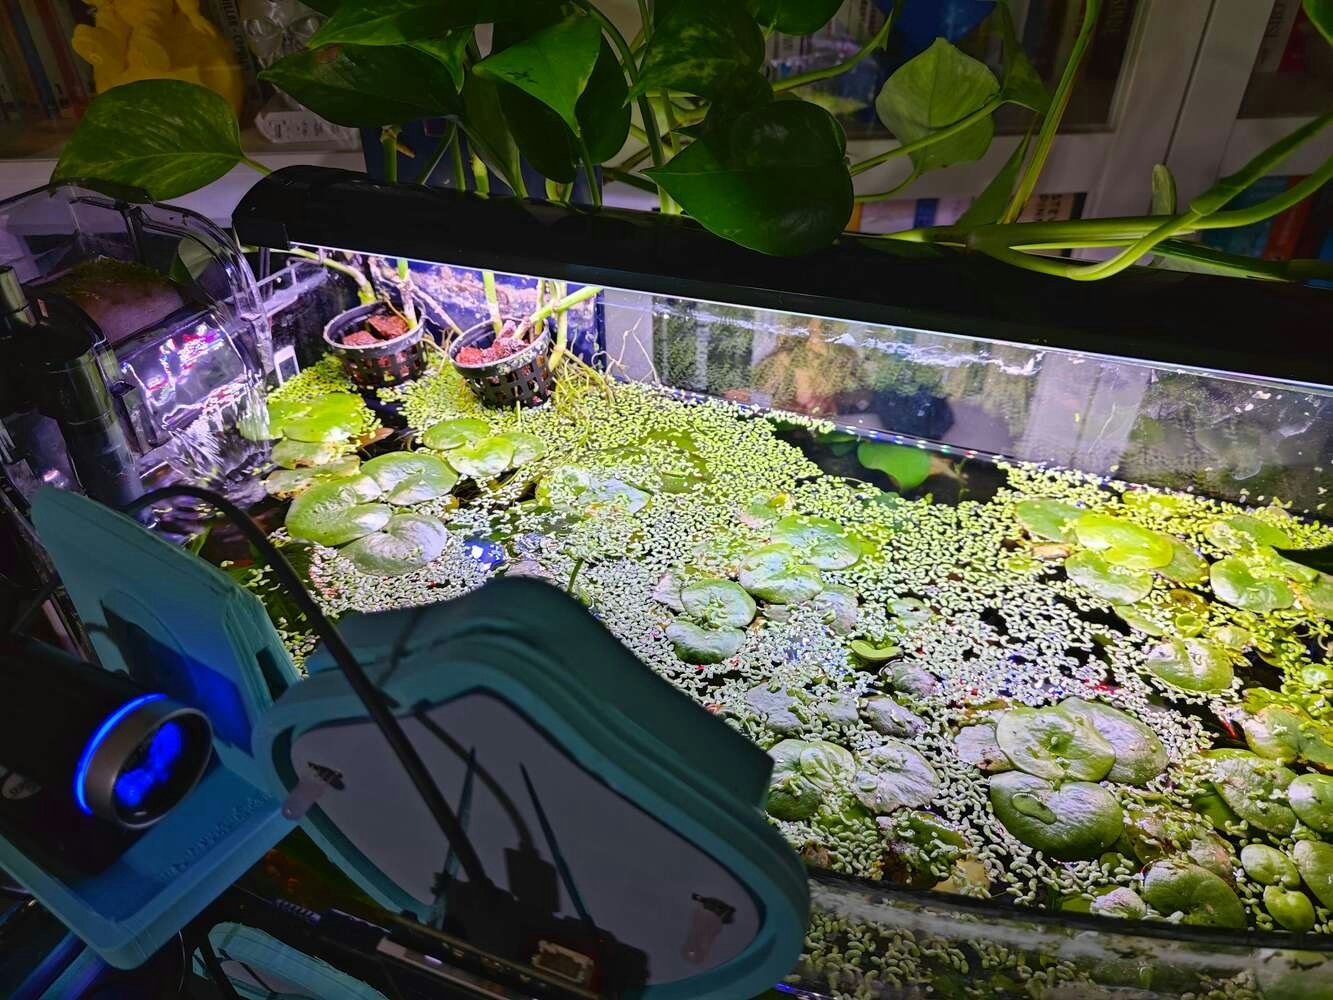
:hash: As explained earlier, I placed a lot of marimo moss balls at the bottom of the tank to increase the bottom surface area, provide underwater substrate gaps, and observe abundant noxious air bubbles while collecting ultrasonic scan data. :hash: Thus, I managed to construct a valid data set for the neural network model.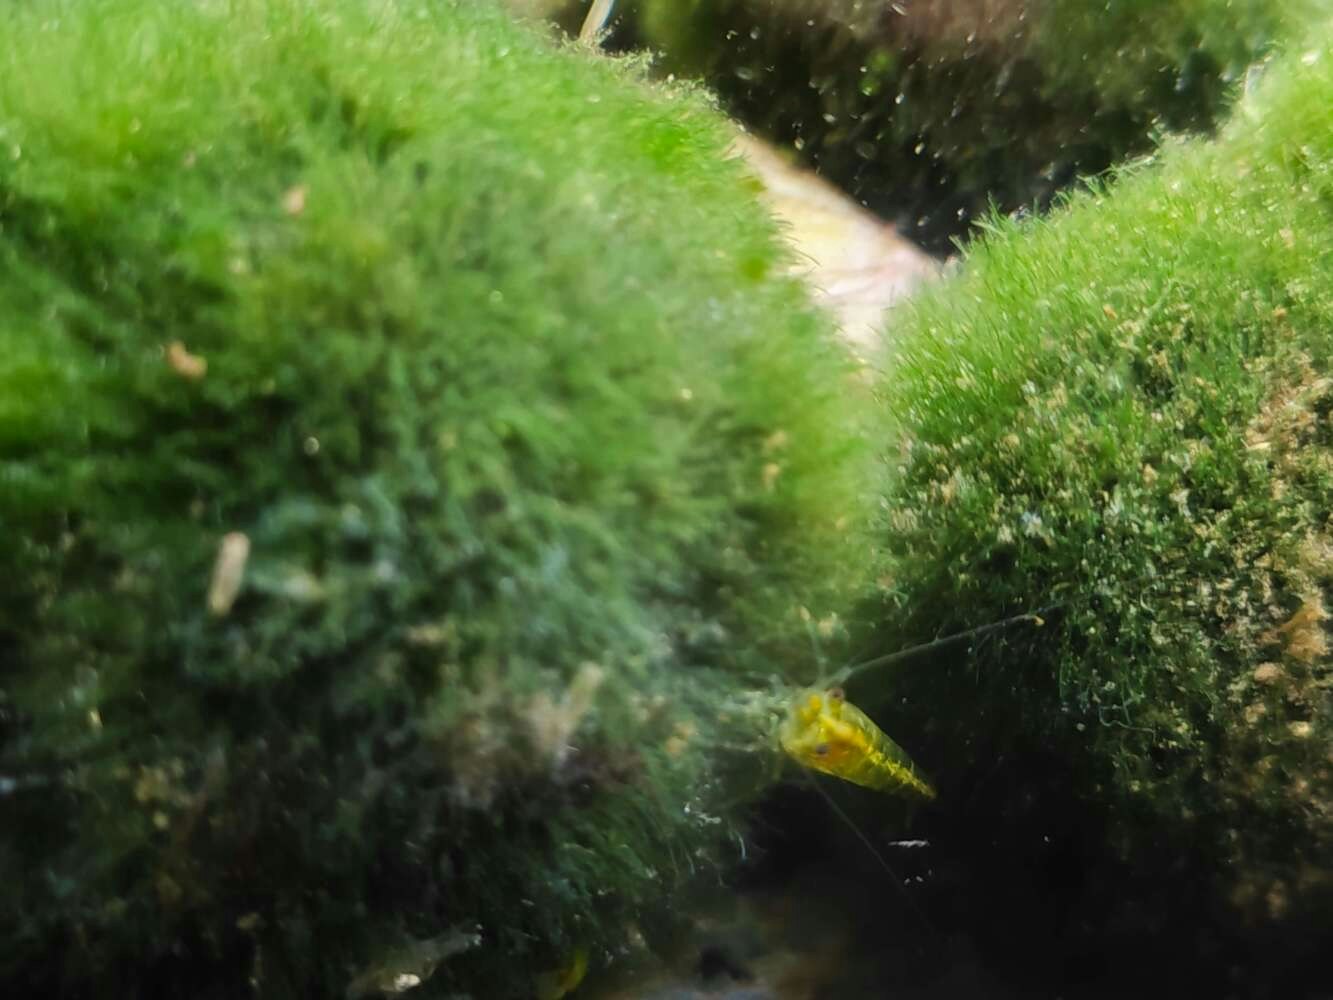
-
- Show Readings
-
- Ultrasonic+++
-
- Save Samples
-
- Run Inference
- A) Class => normal
- C) Class => bubble
- sample_normal__2024_03_14_07_52_41.txt
- sample_bubble__2024_04_03_16_53_08.txt
Step 9: Applying chemical water quality tests to analyze water contamination
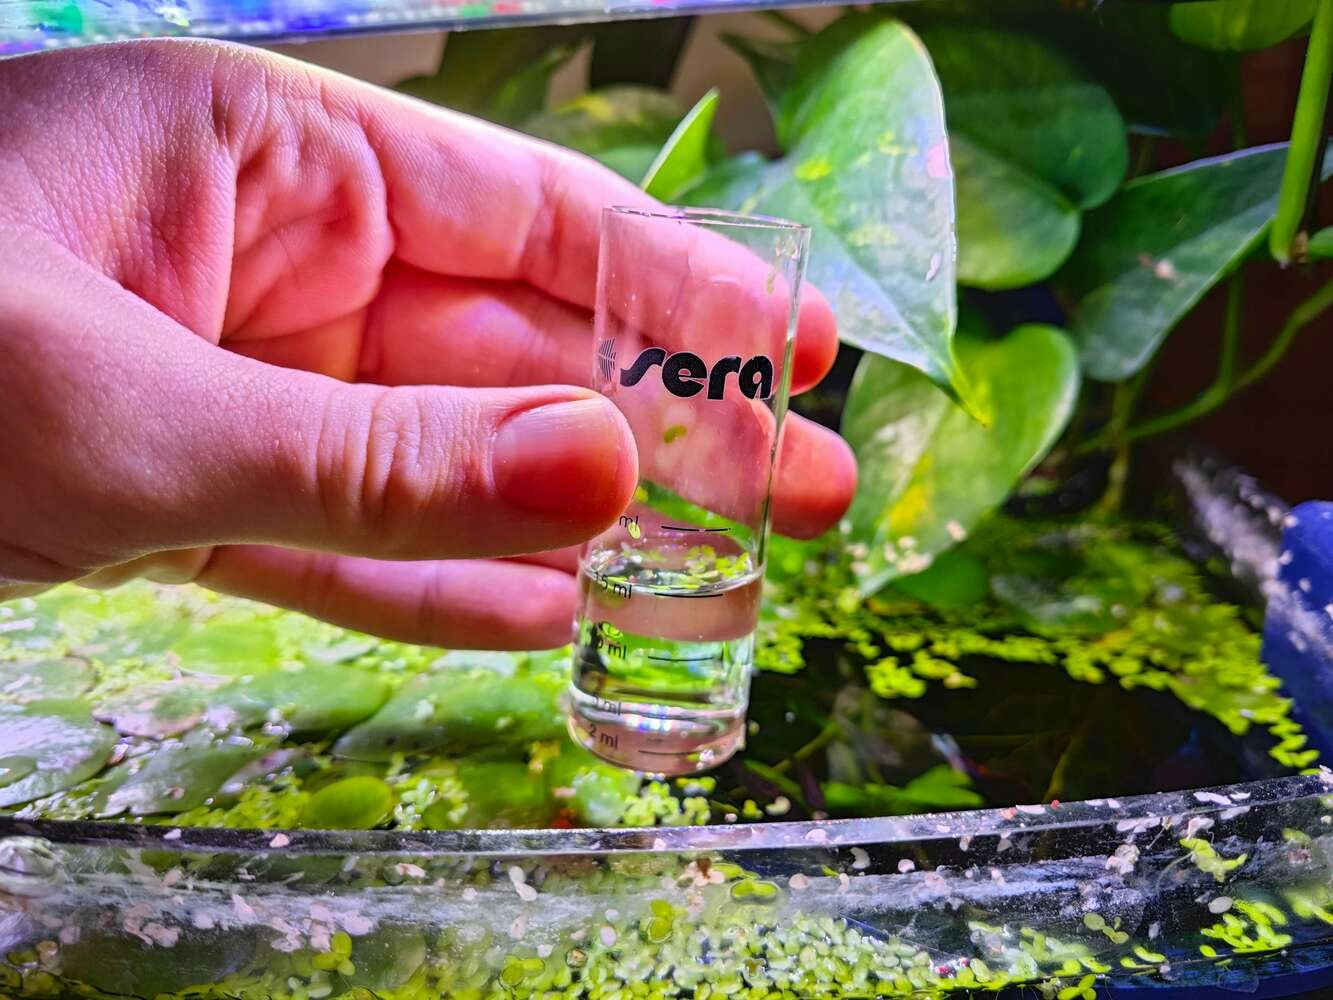
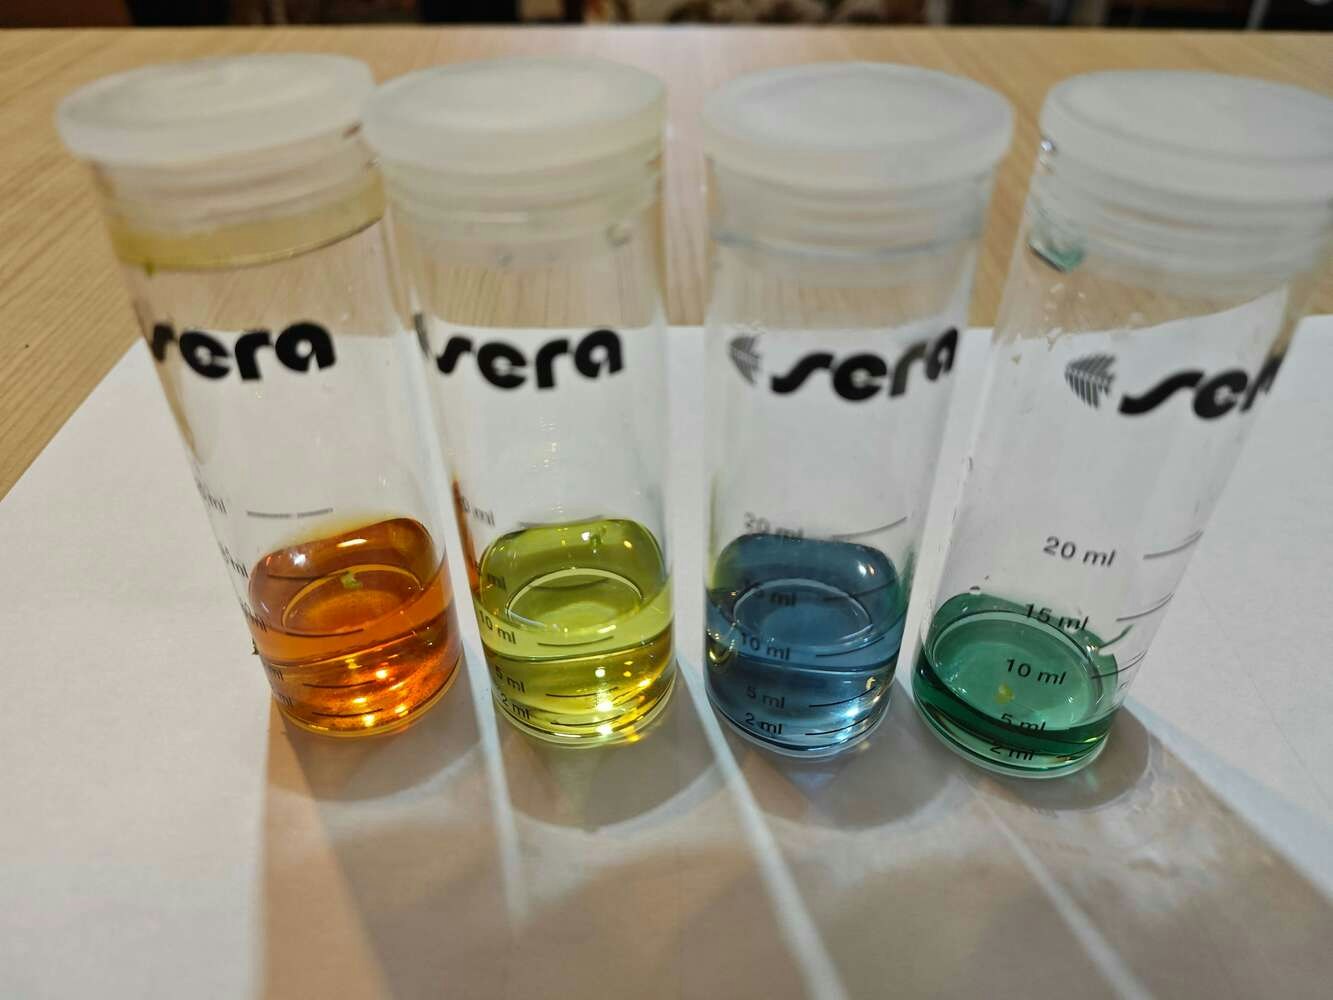
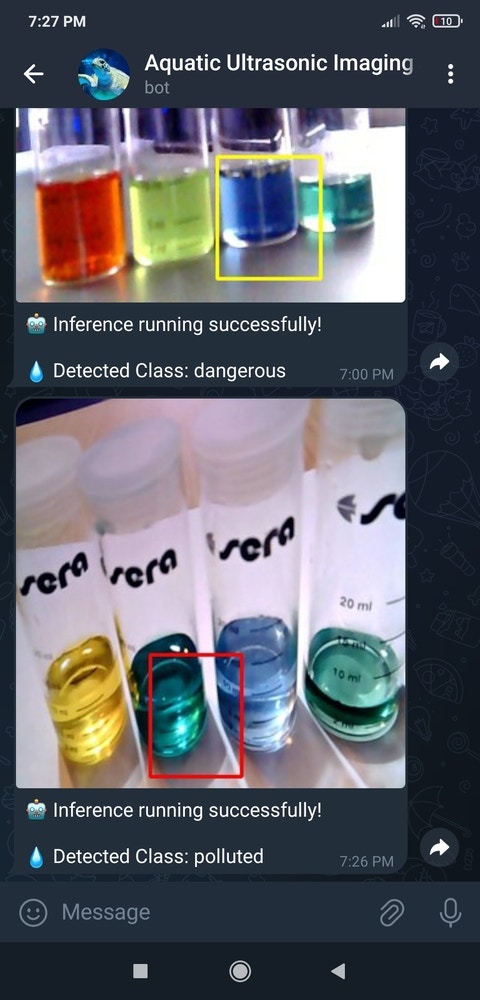
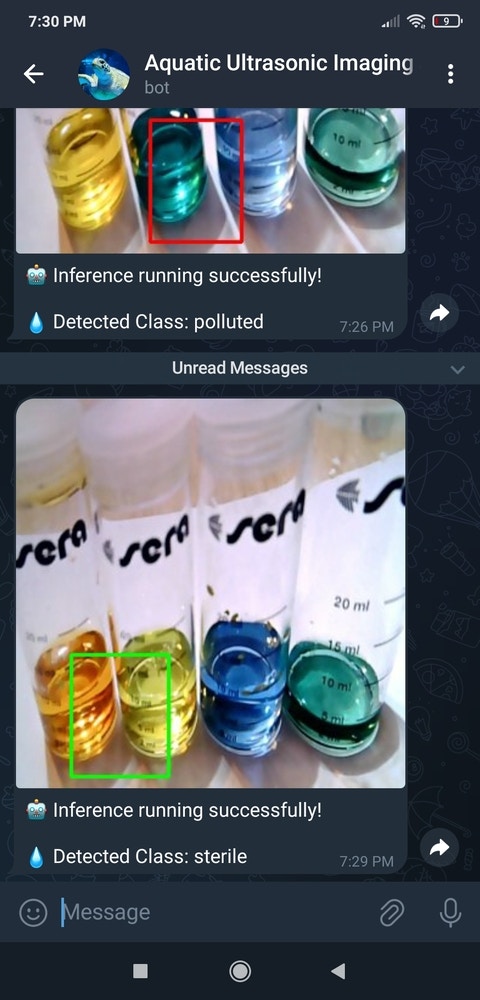
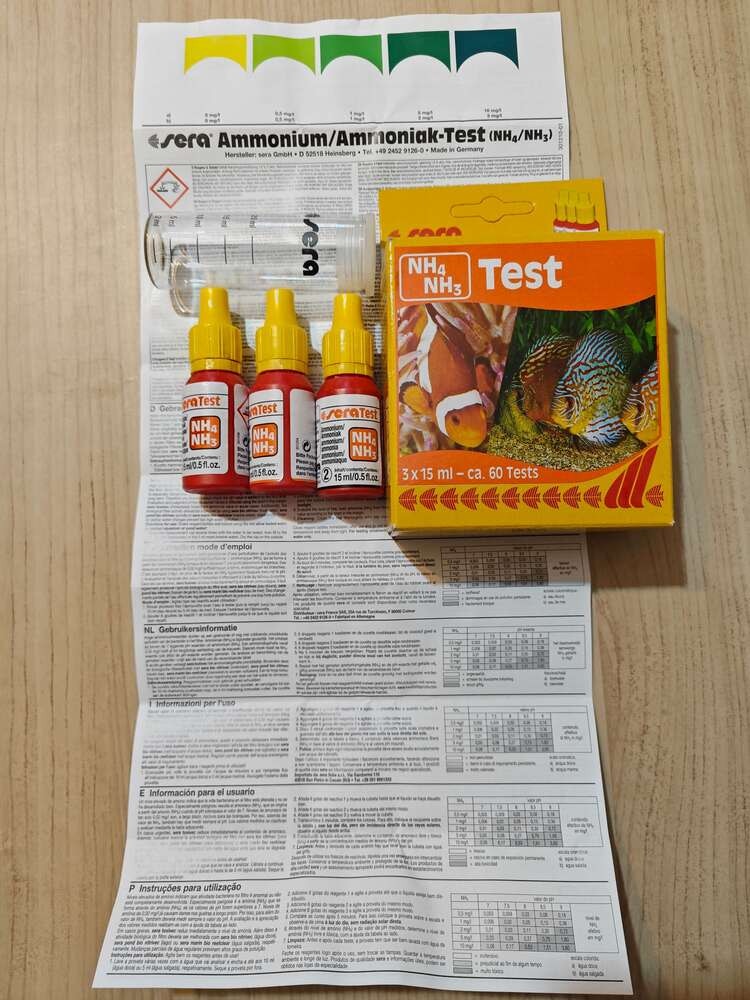
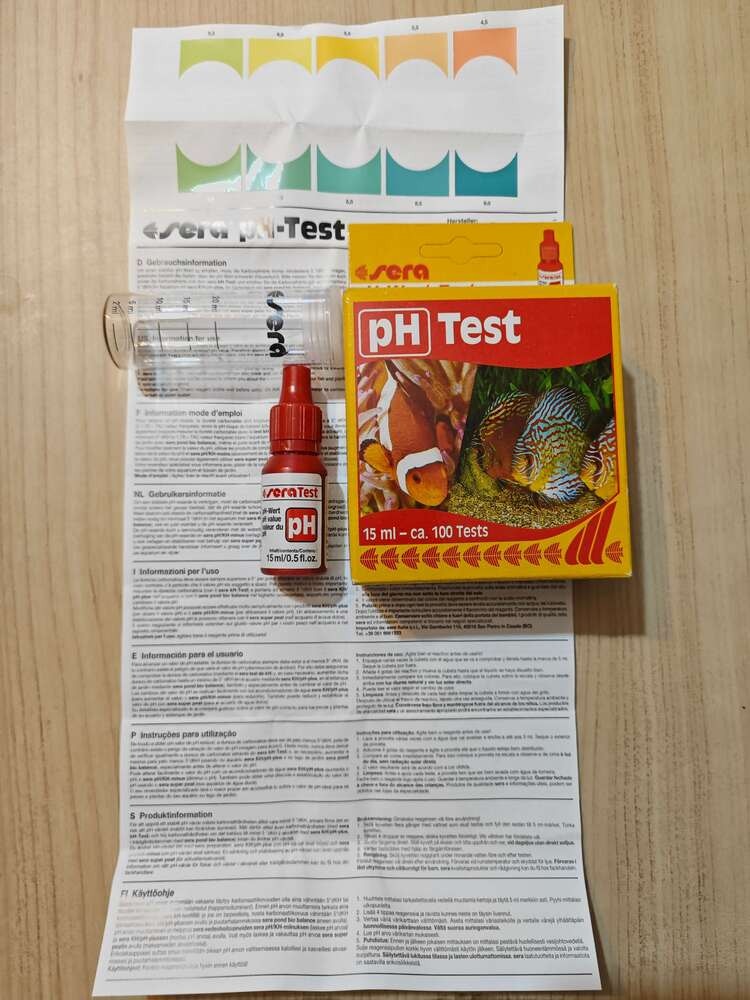
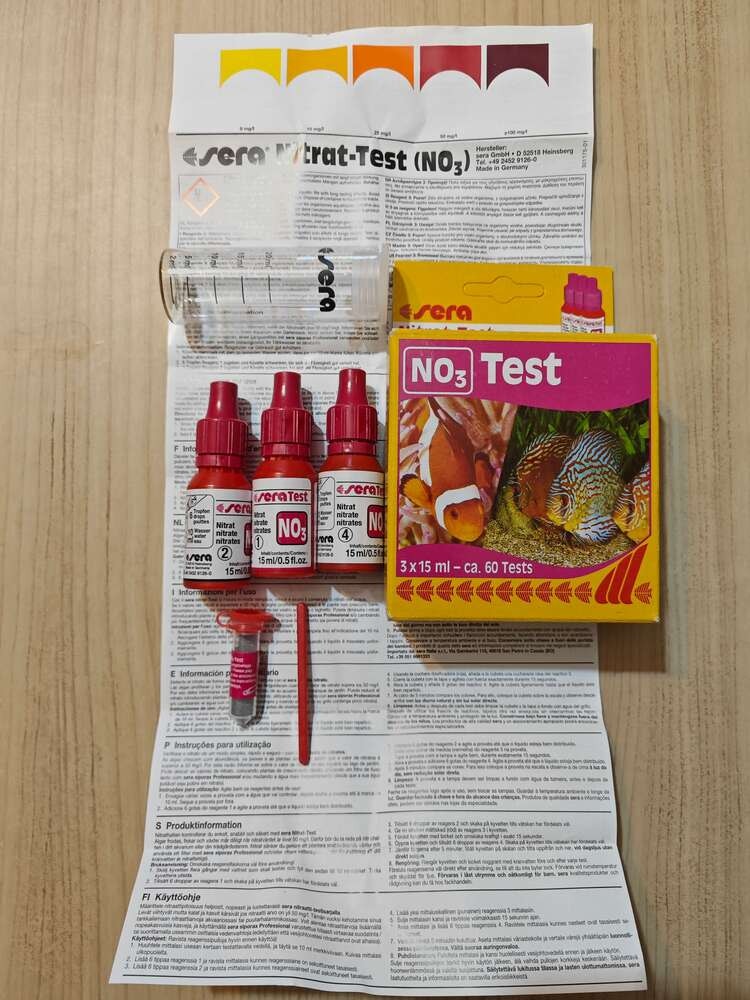
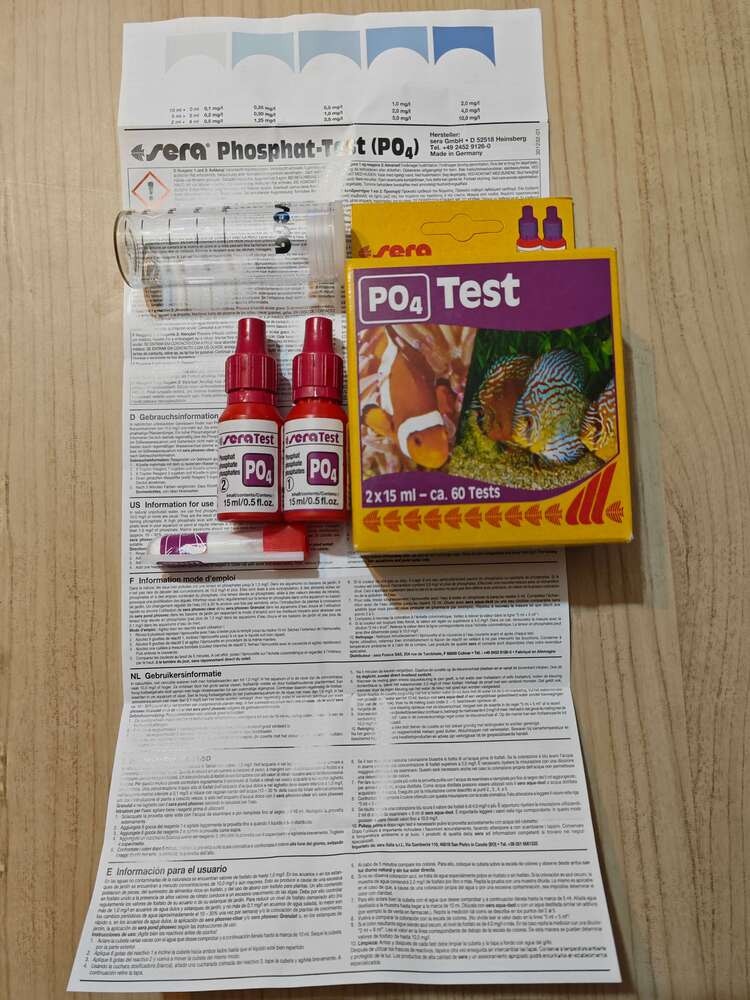
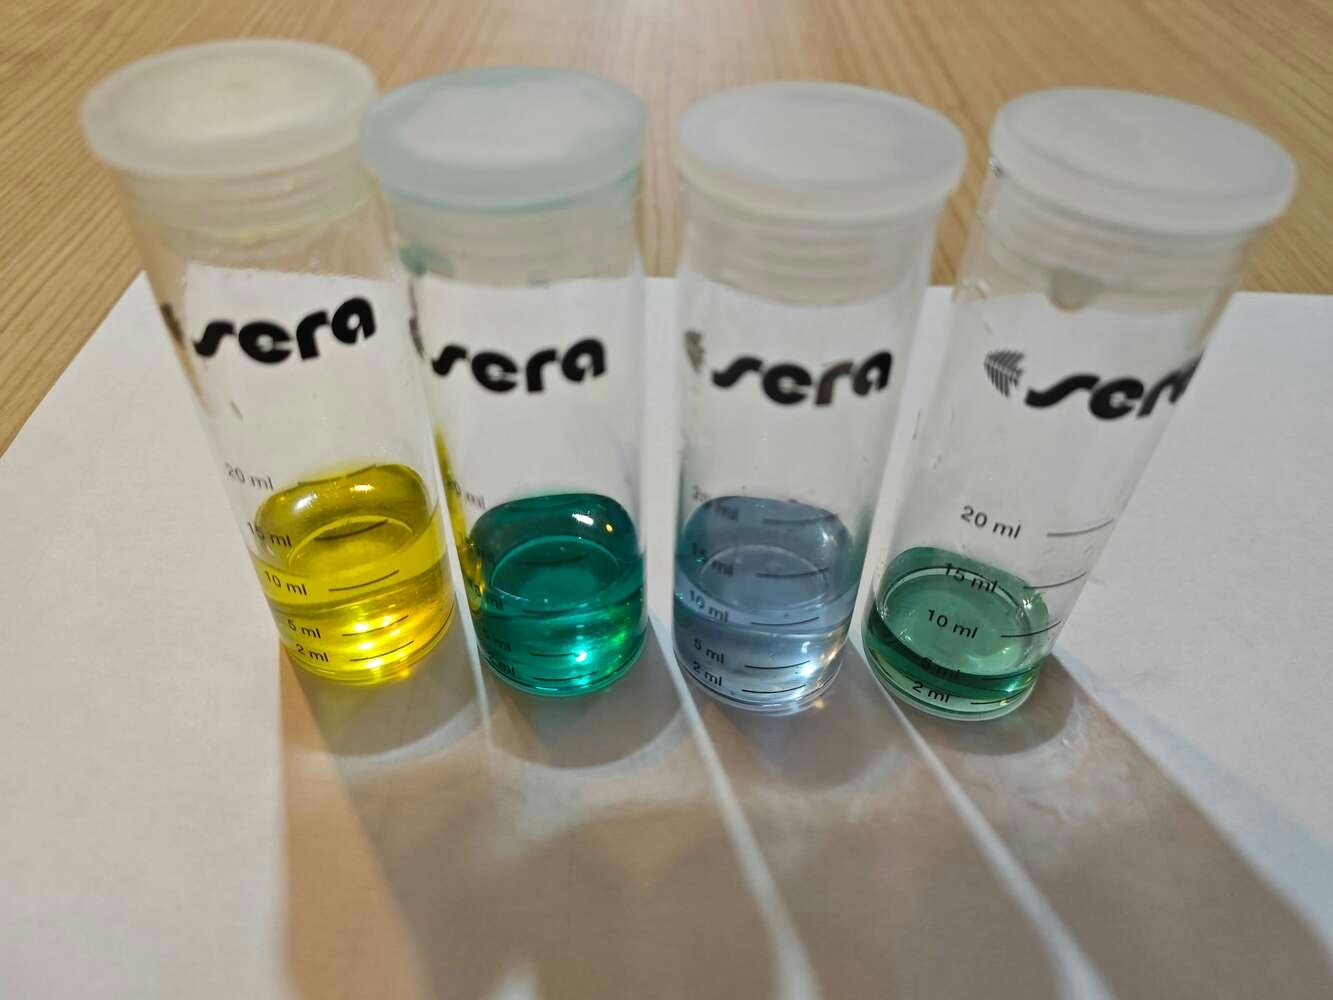
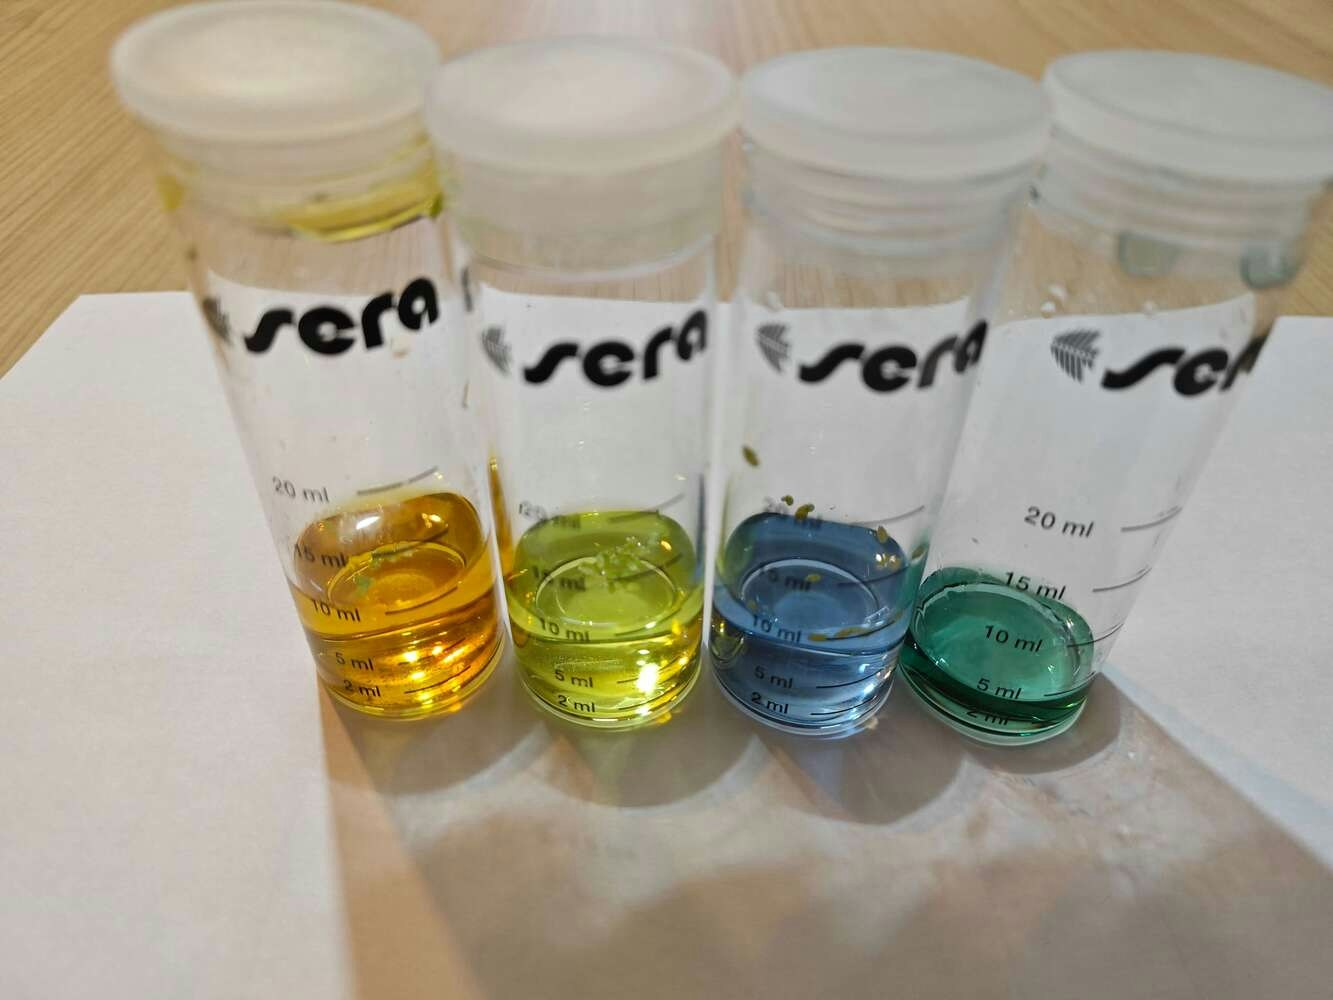
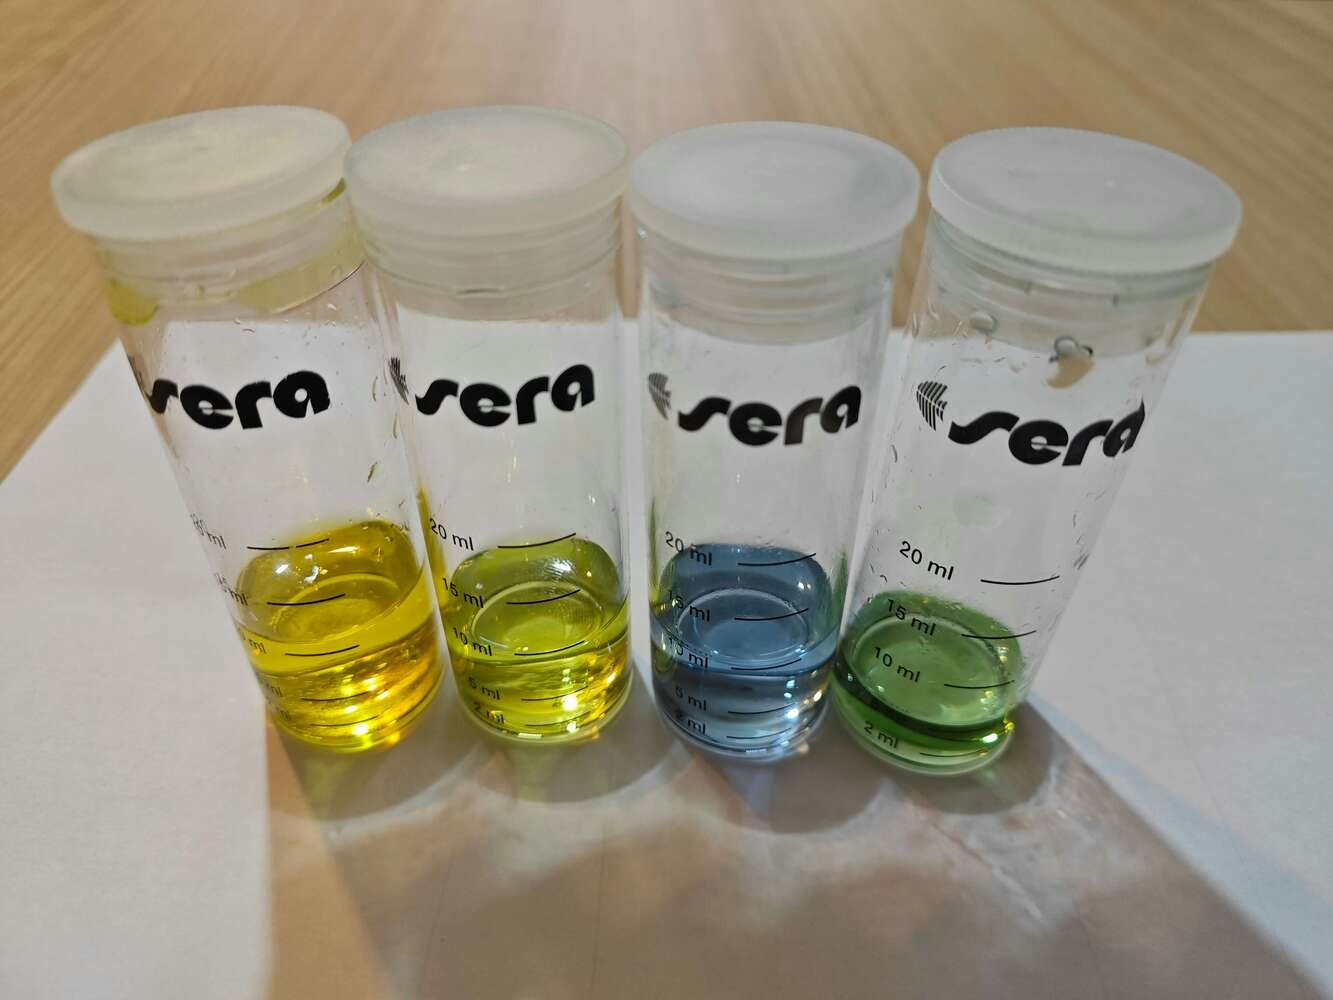
Since all underwater air bubble activity cannot be singled out as an imminent toxic pollution risk, I decided to enable this air bubble detection device with the ability to assess potential water pollution based on chemical water quality tests. Even though there are various water quality tests for fish tanks, I decided to utilize color-coded chemical tests produced by the renowned full-range supplier for aquariums, ponds, and terrariums — sera. In this regard, I was able to make the object detection model determine the water pollution levels easily by the color discrepancies of the applied water quality tests. After researching the most common indicators of water pollution in a retail fish farm, in this case, my overpopulated medium-sized aquarium simulating harsh fish farm conditions, I decided to apply these four water quality tests regularly: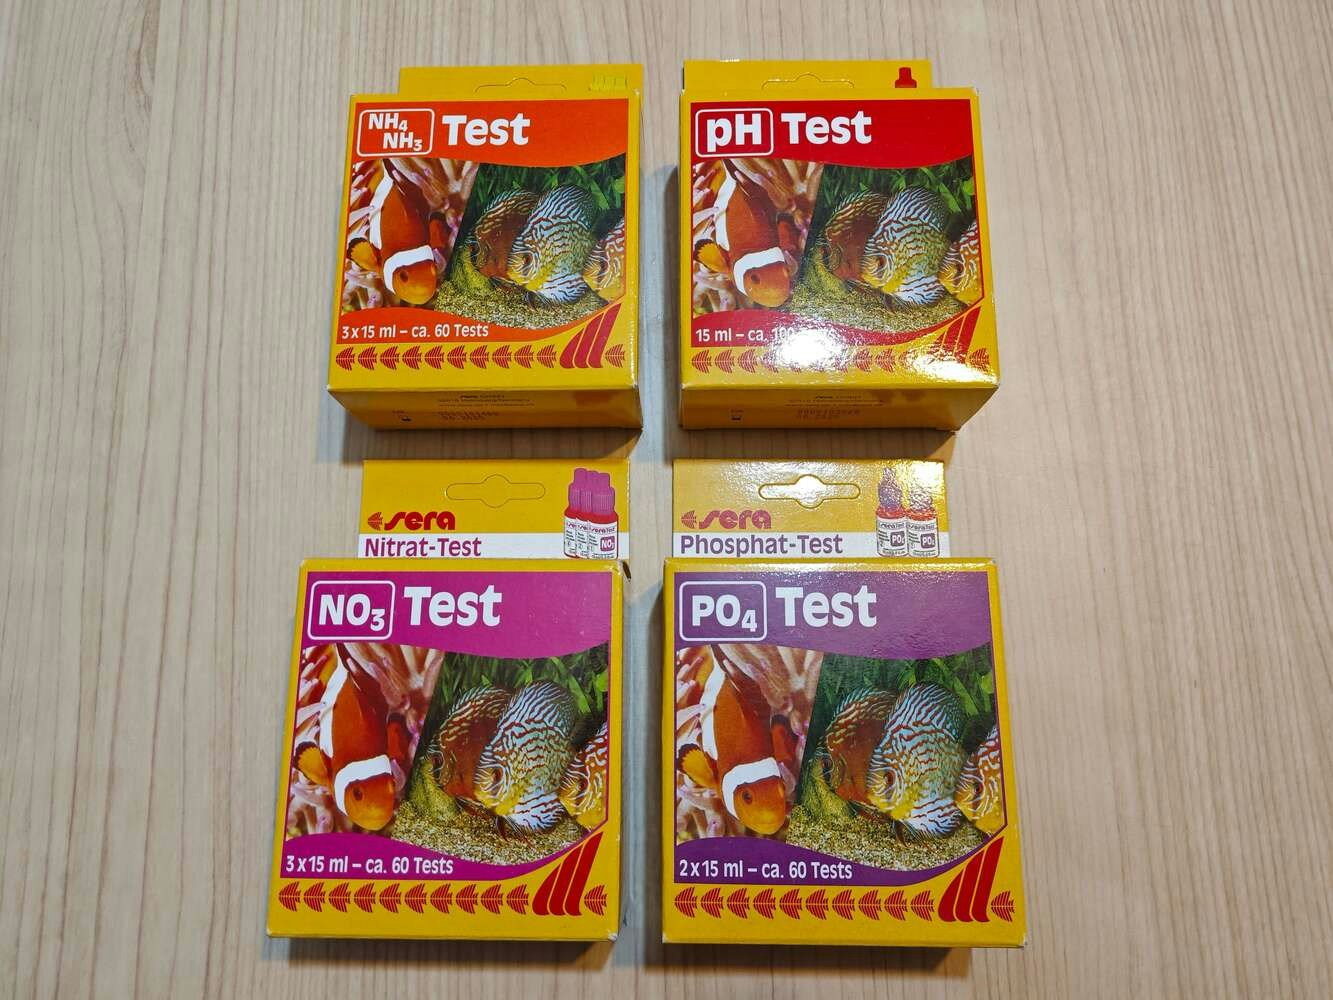
- sterile
- dangerous
- polluted
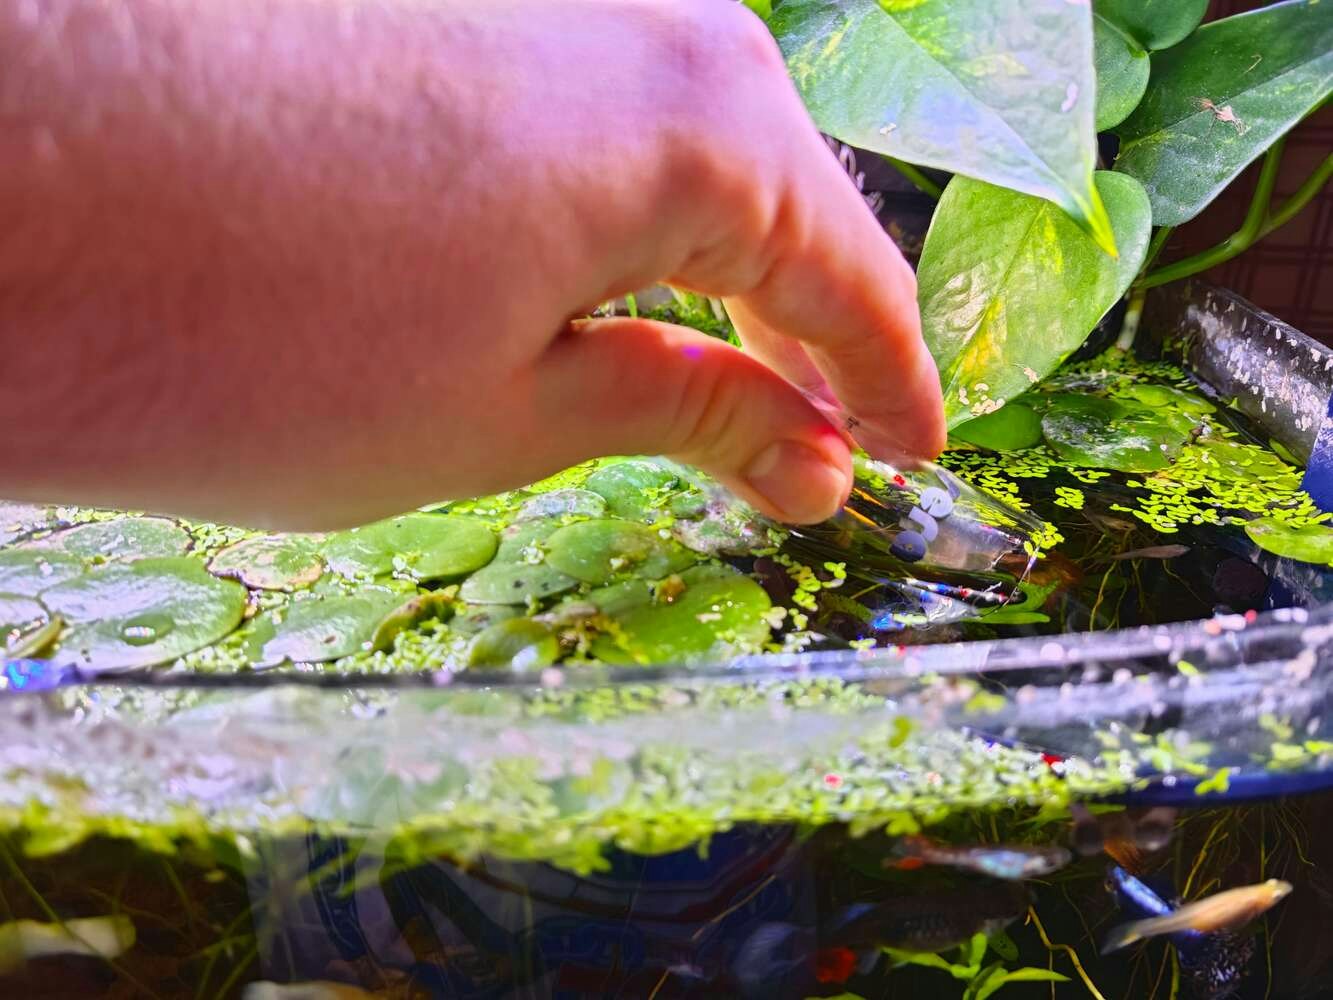
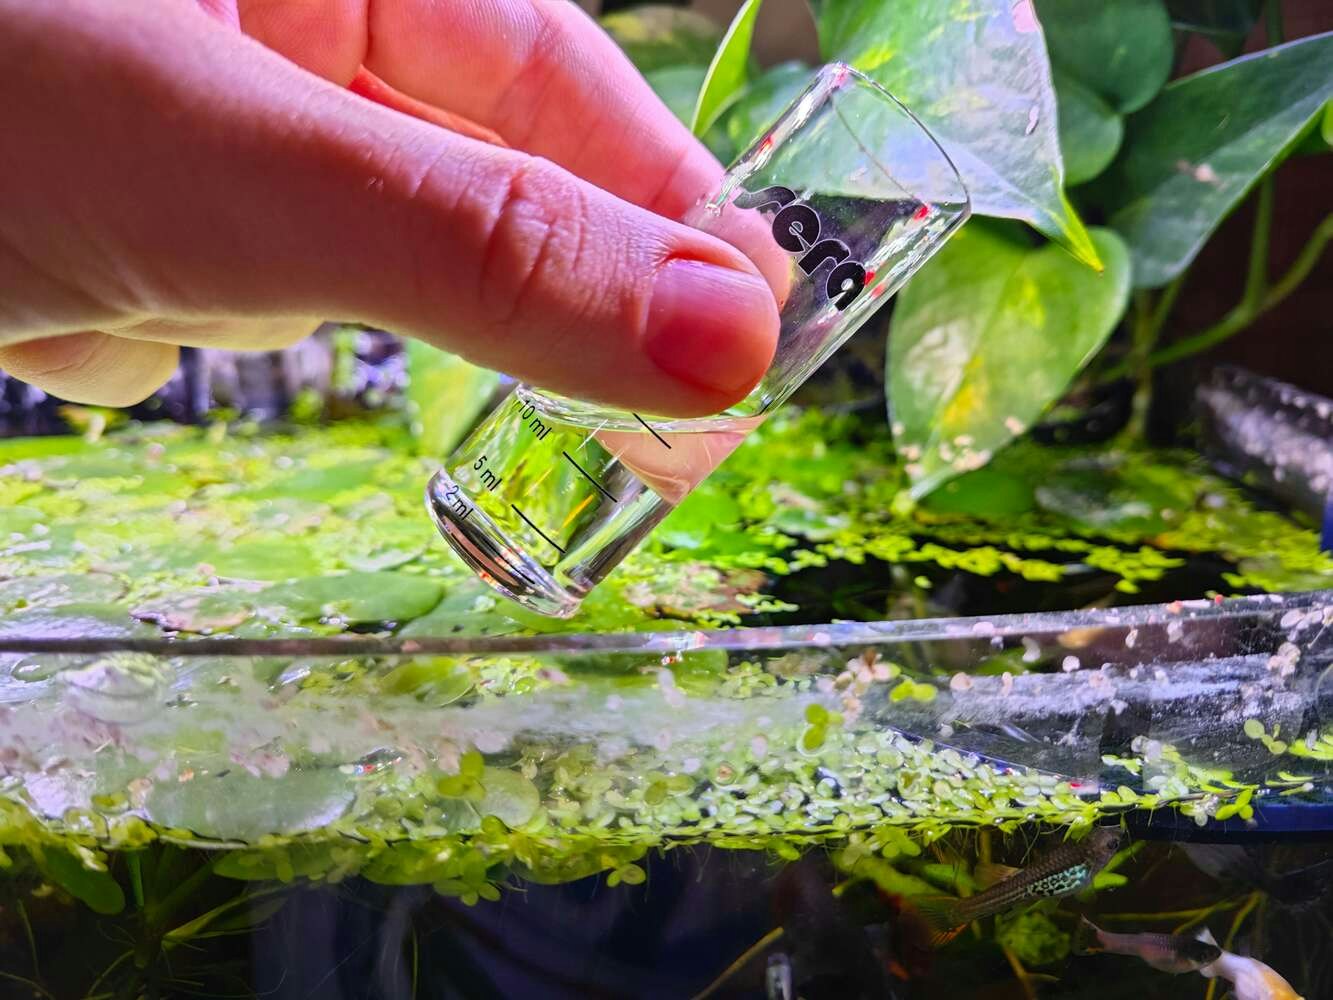
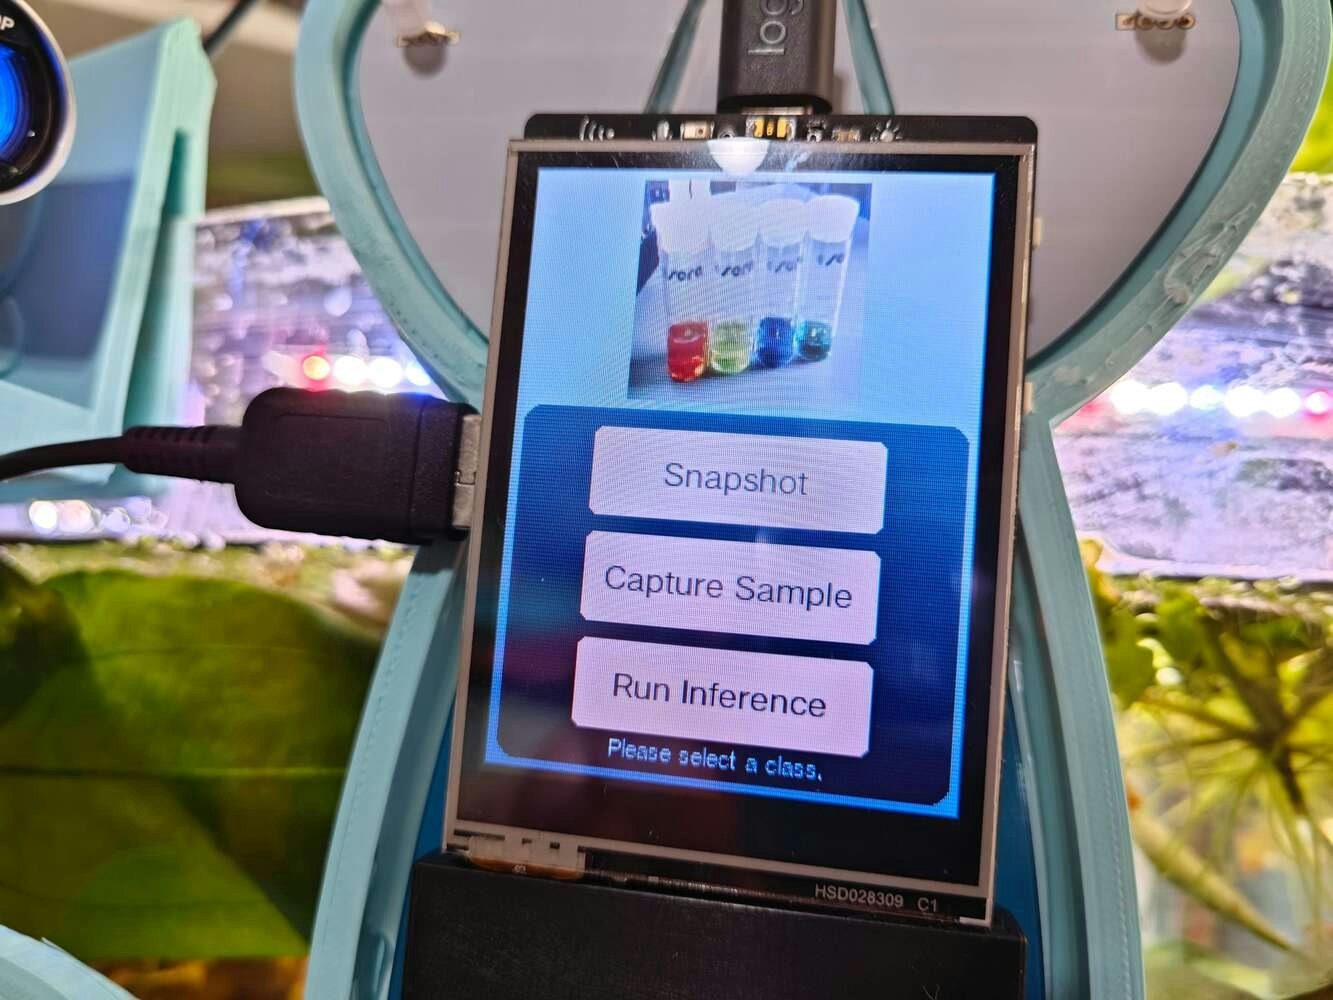
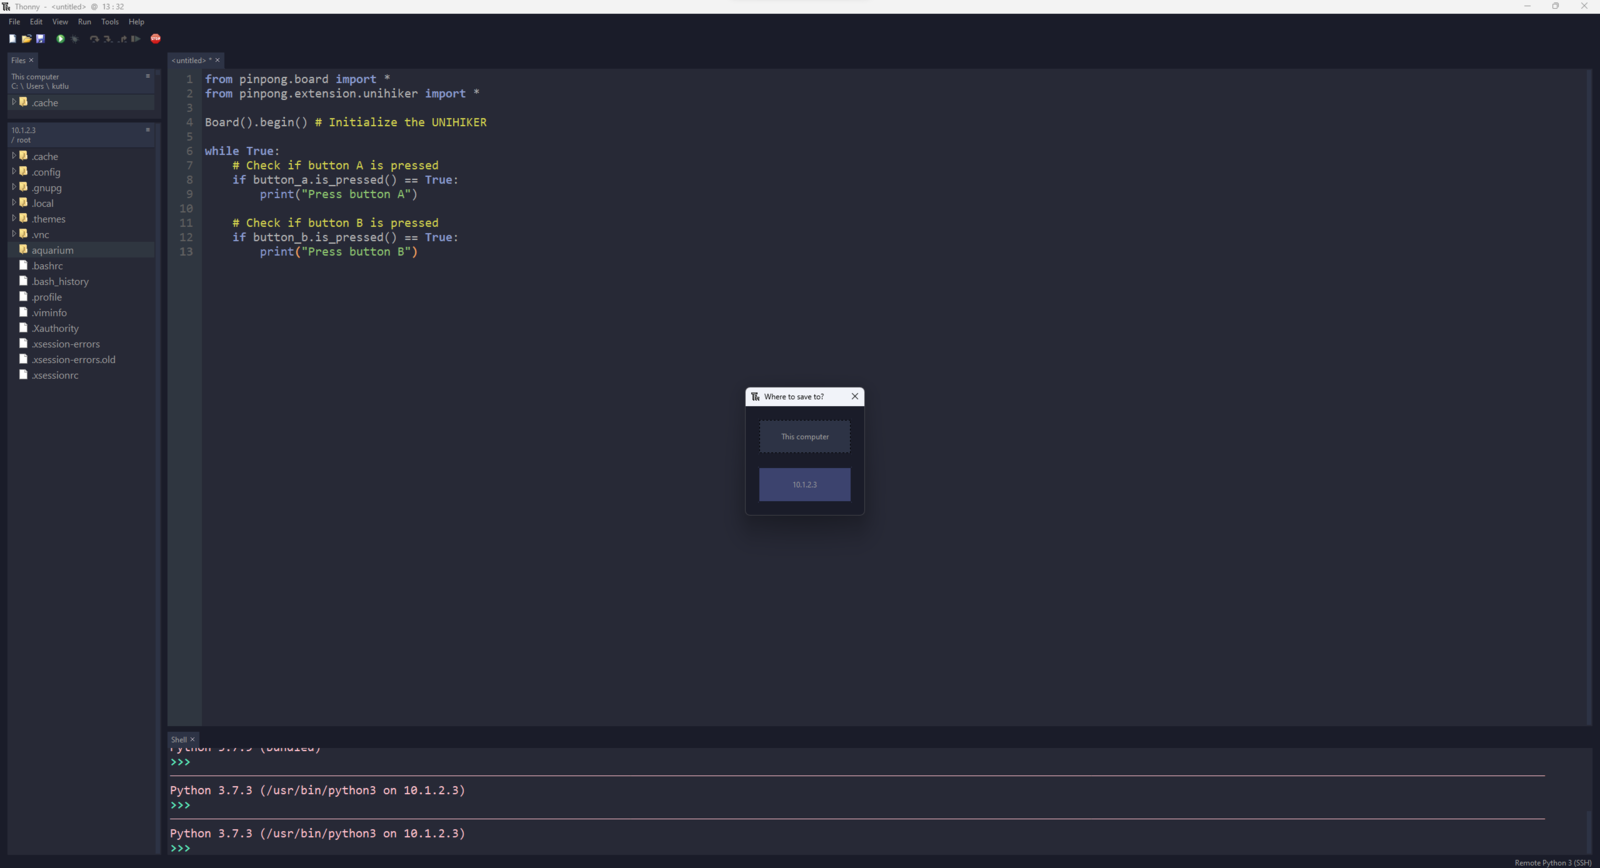
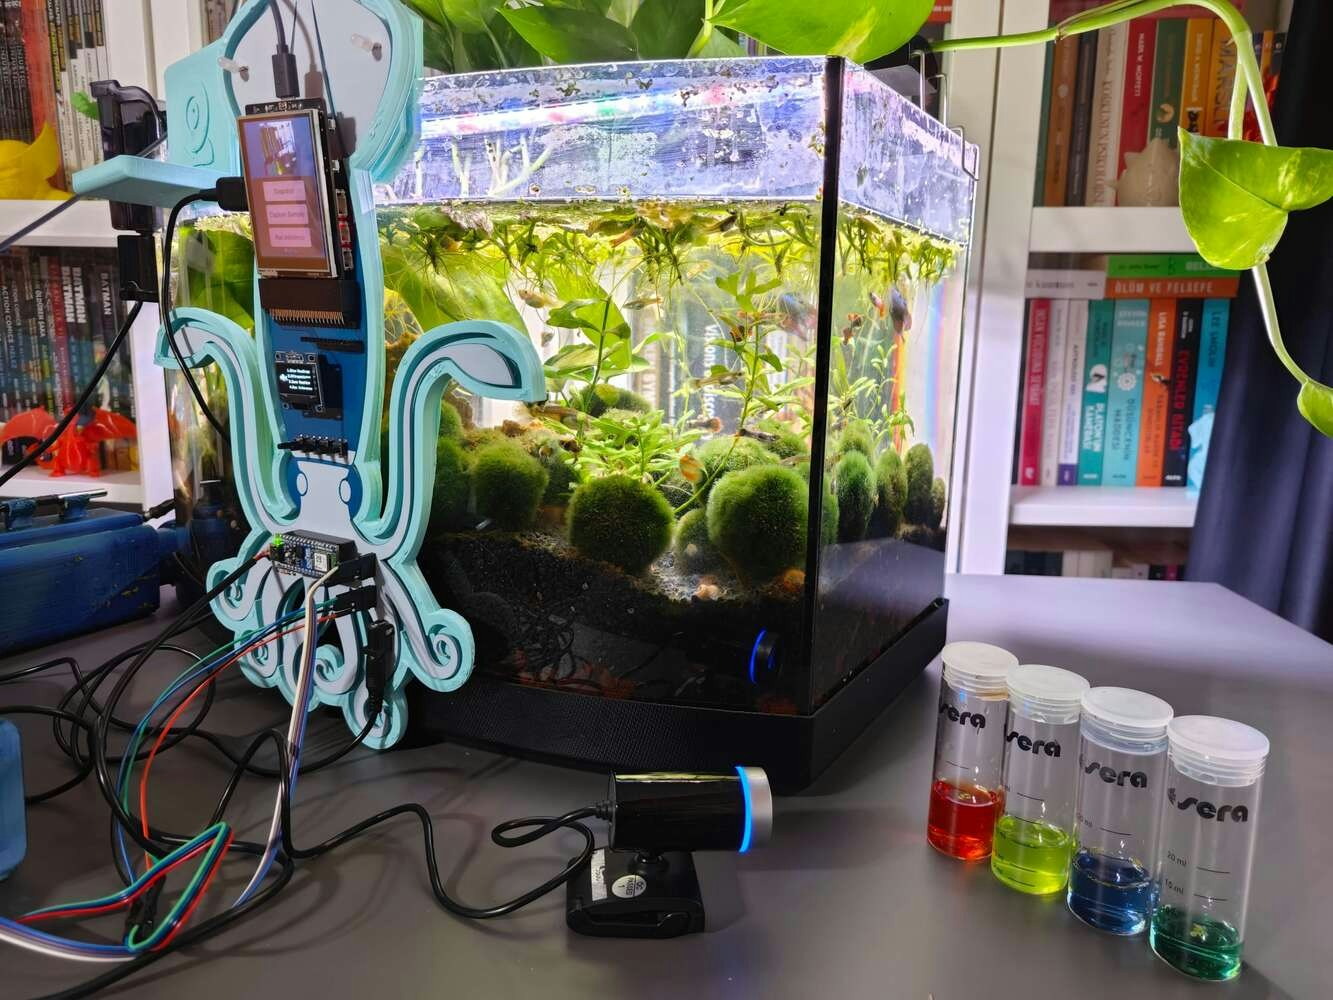
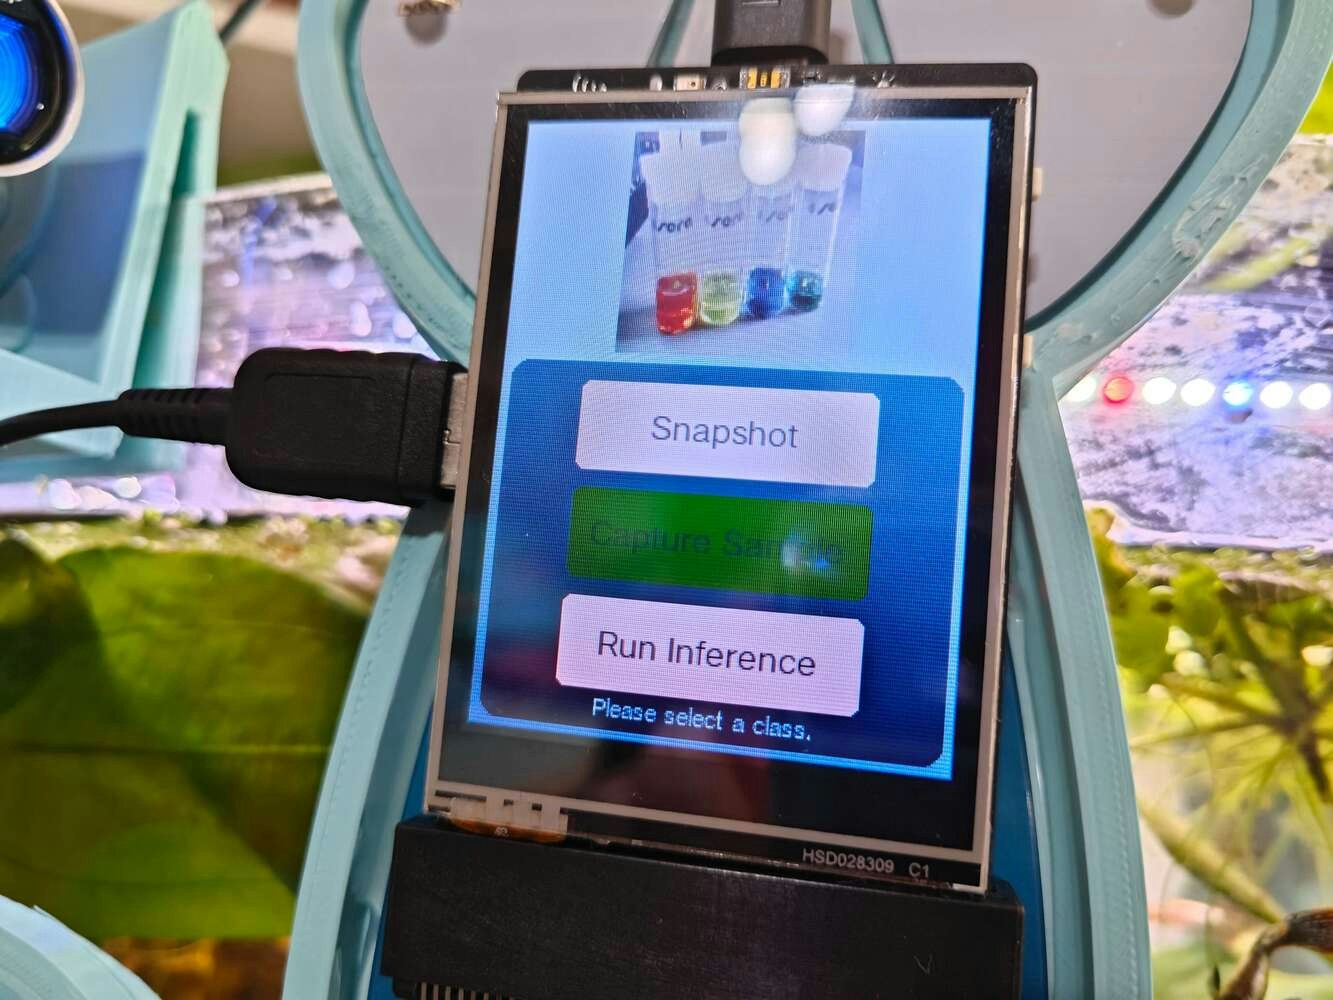
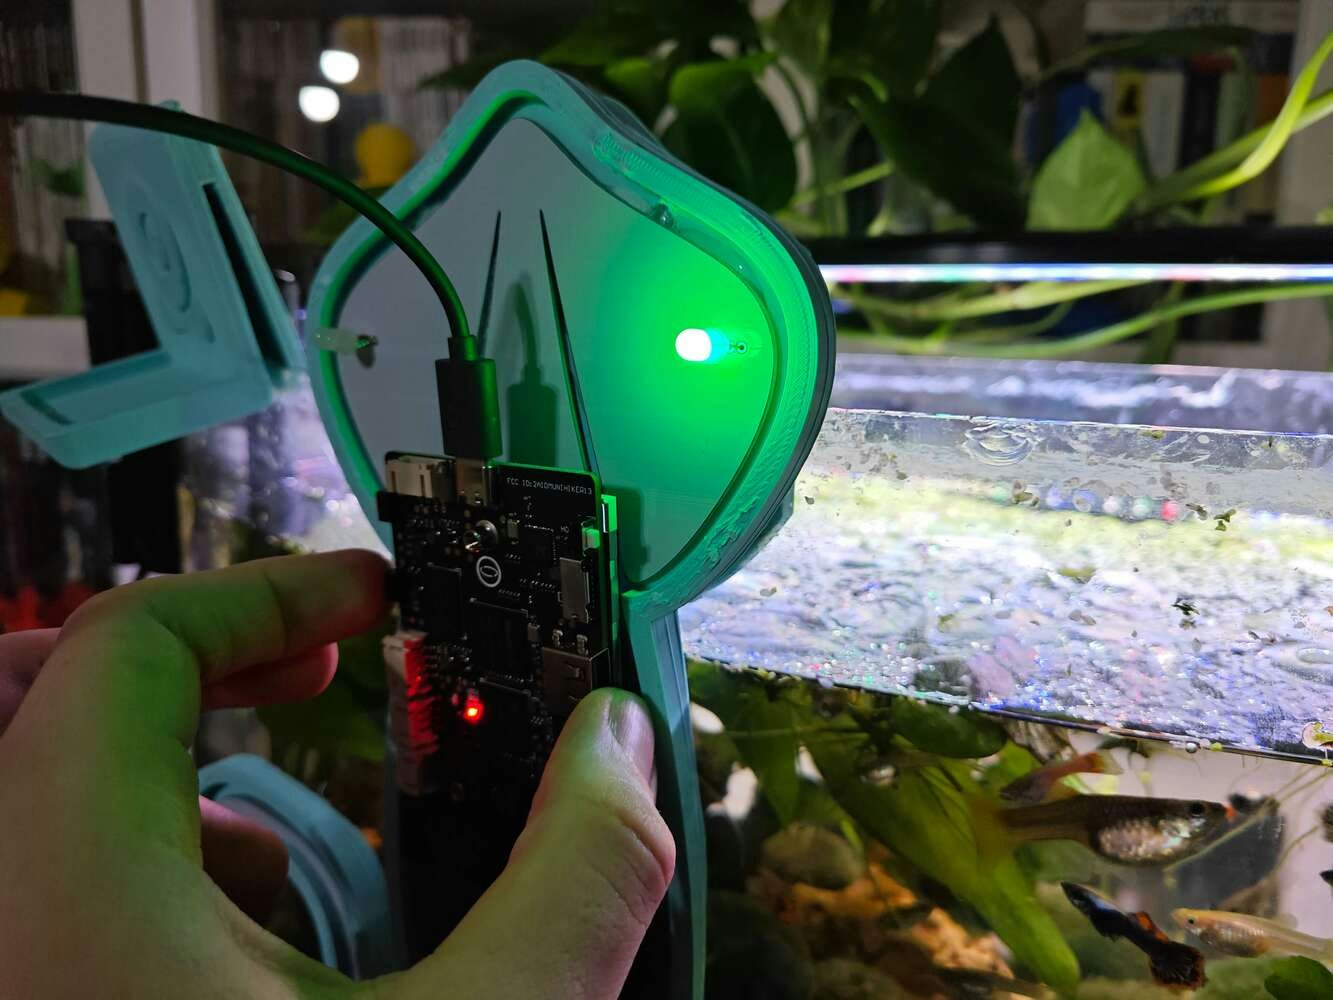
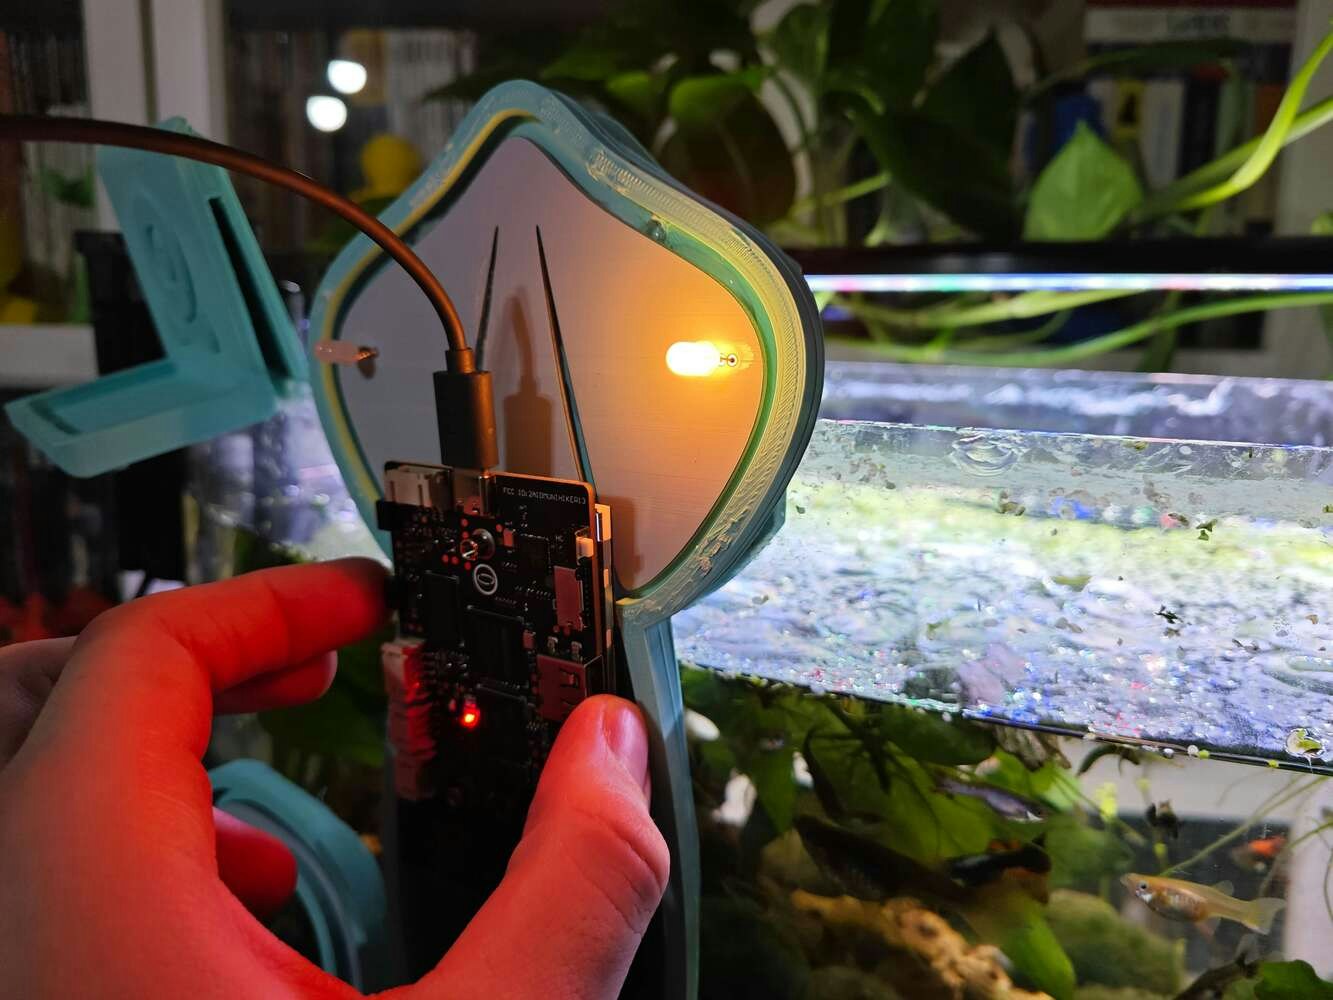
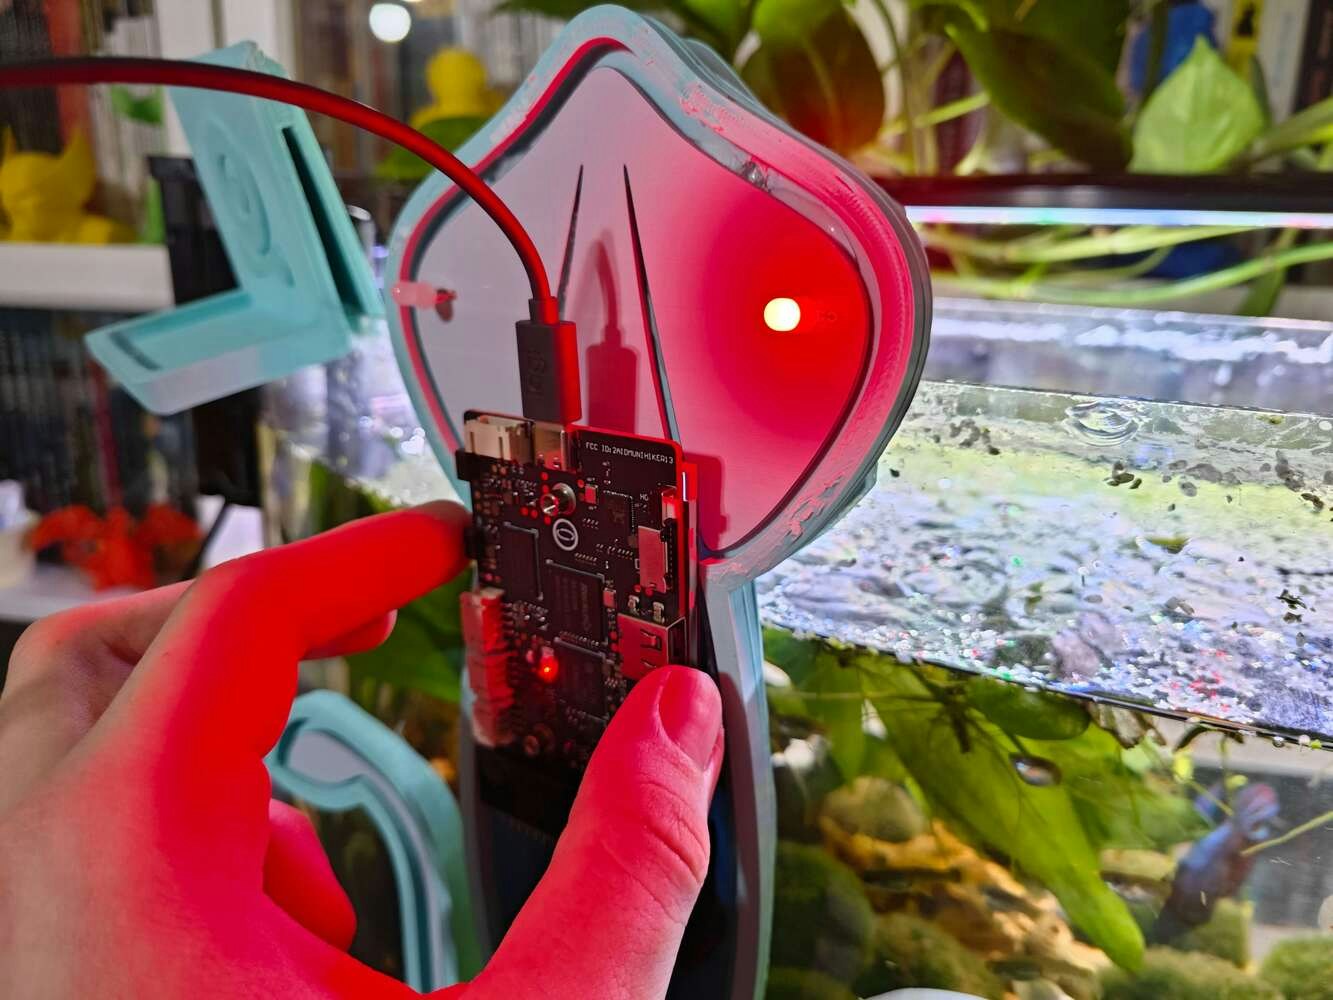
Step 9.1: Capturing water quality test result images w/ the USB webcam
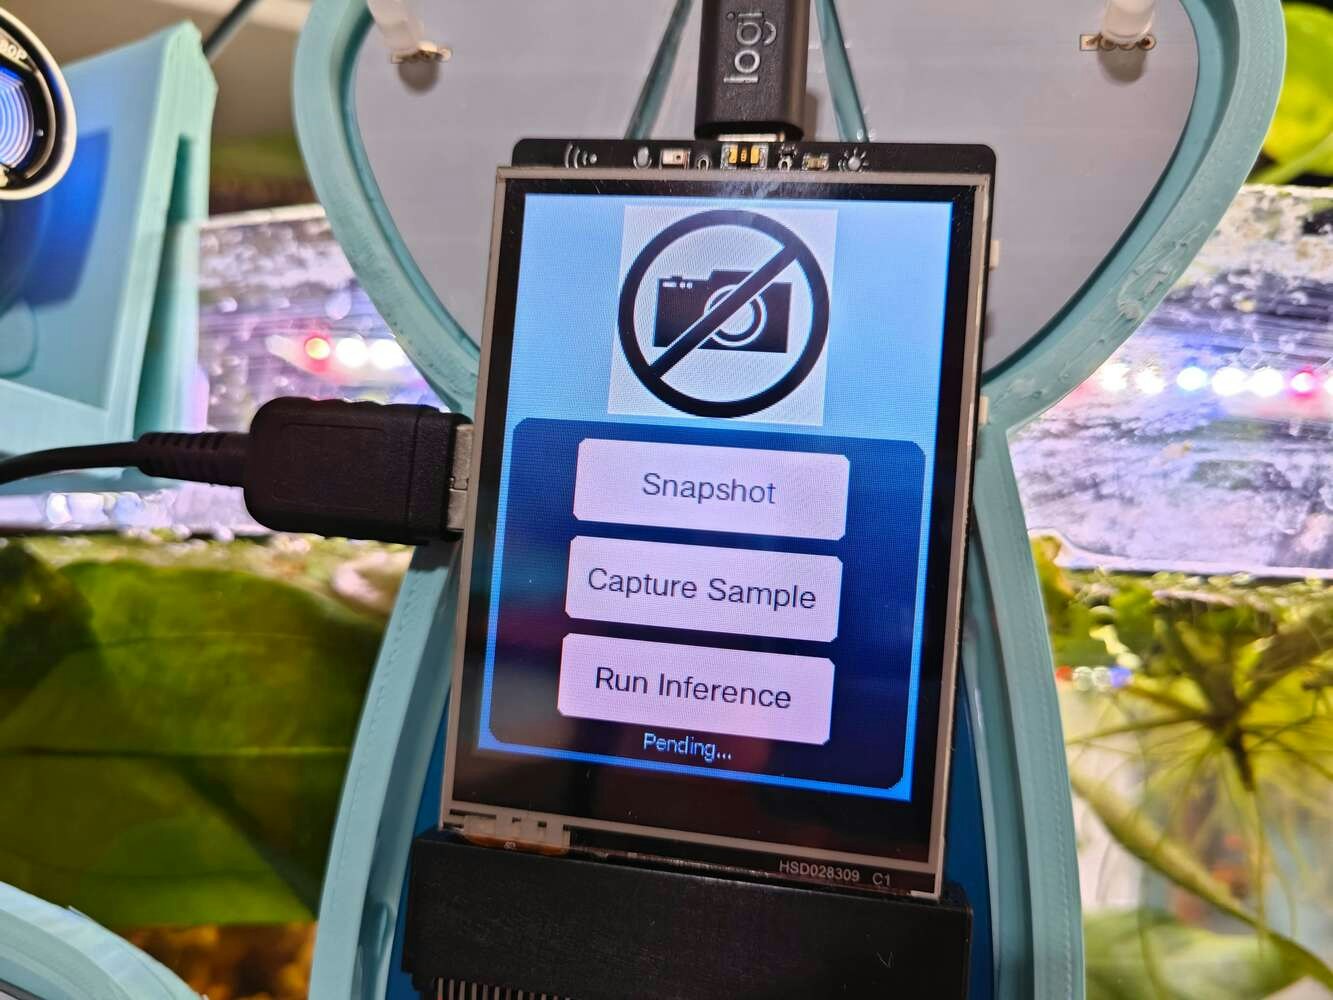
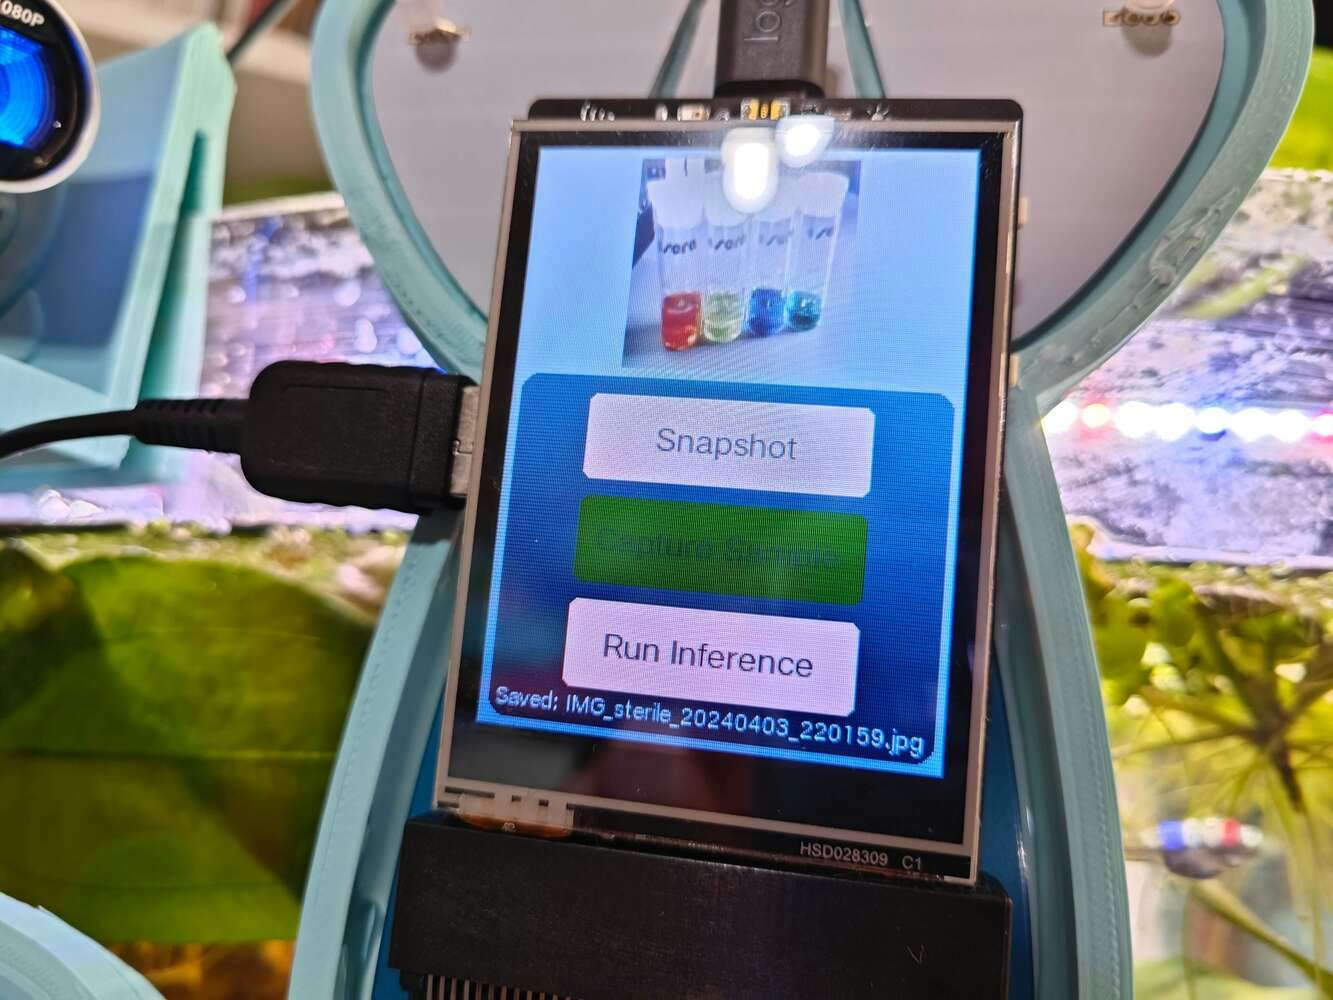
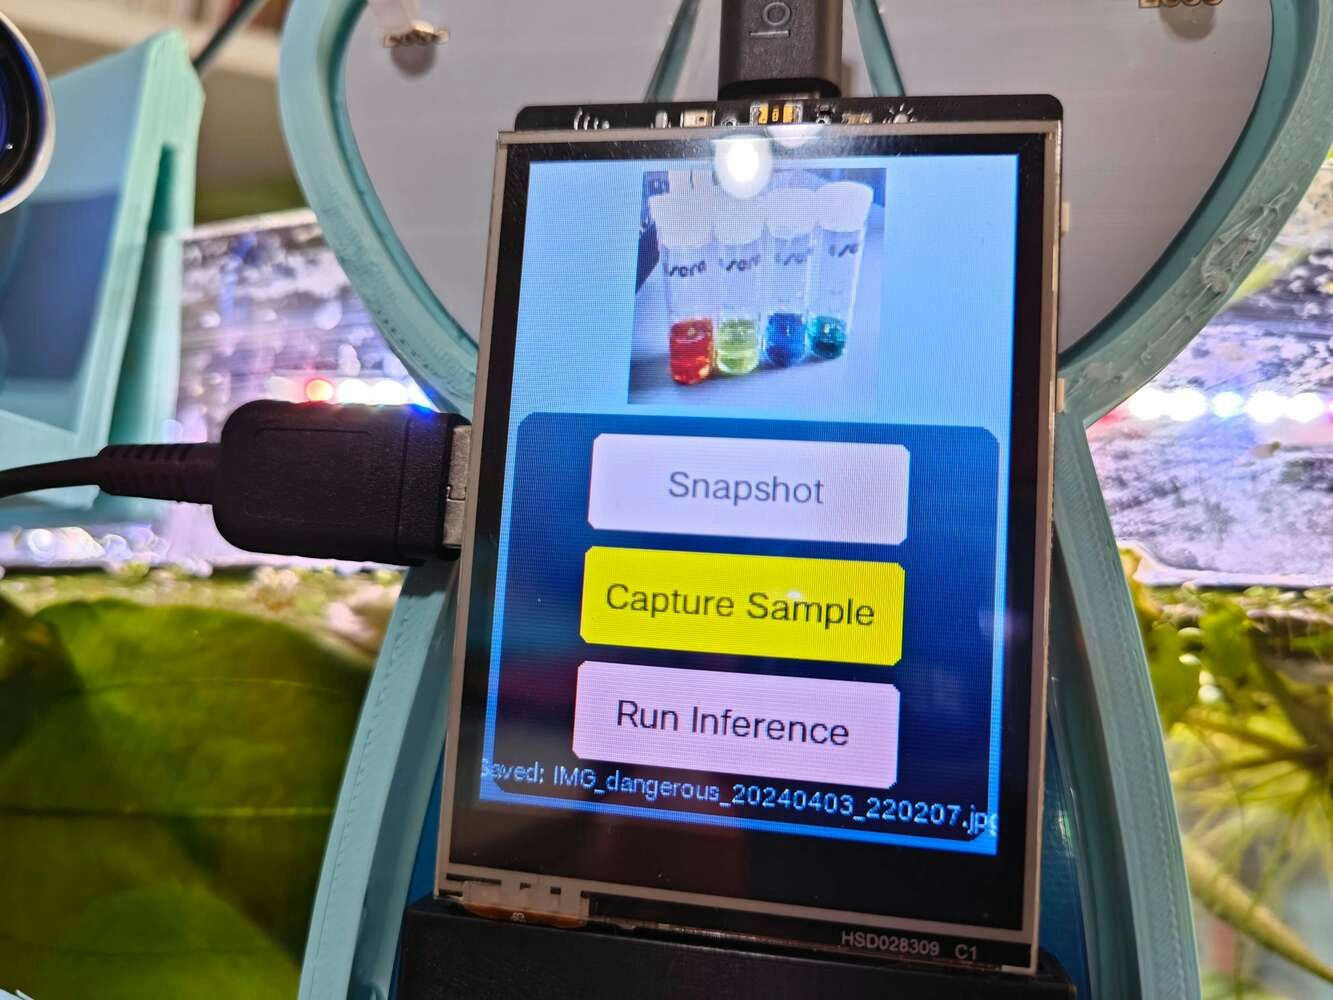
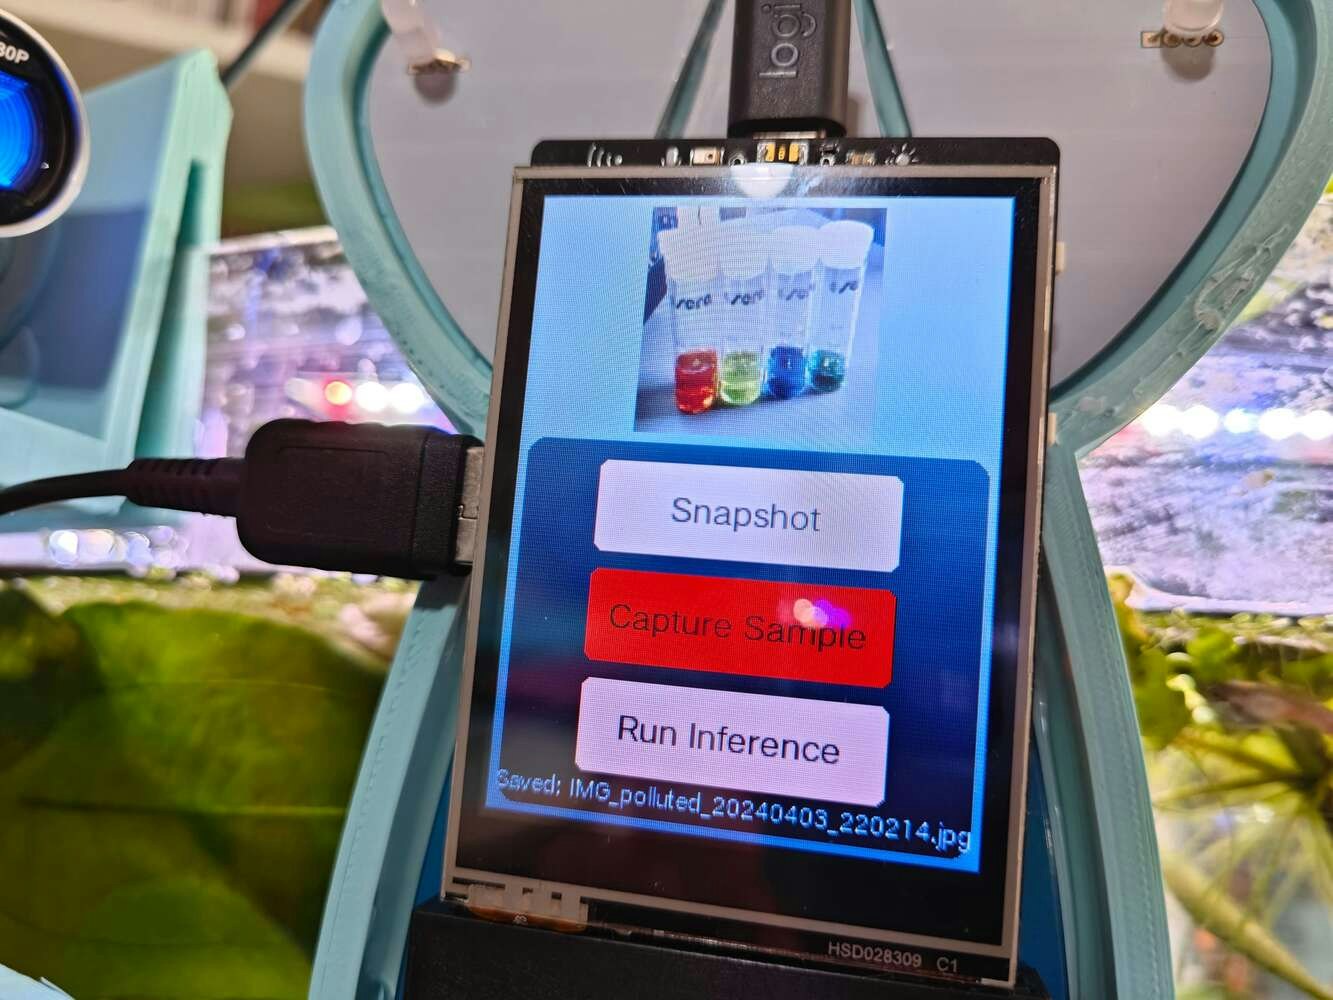
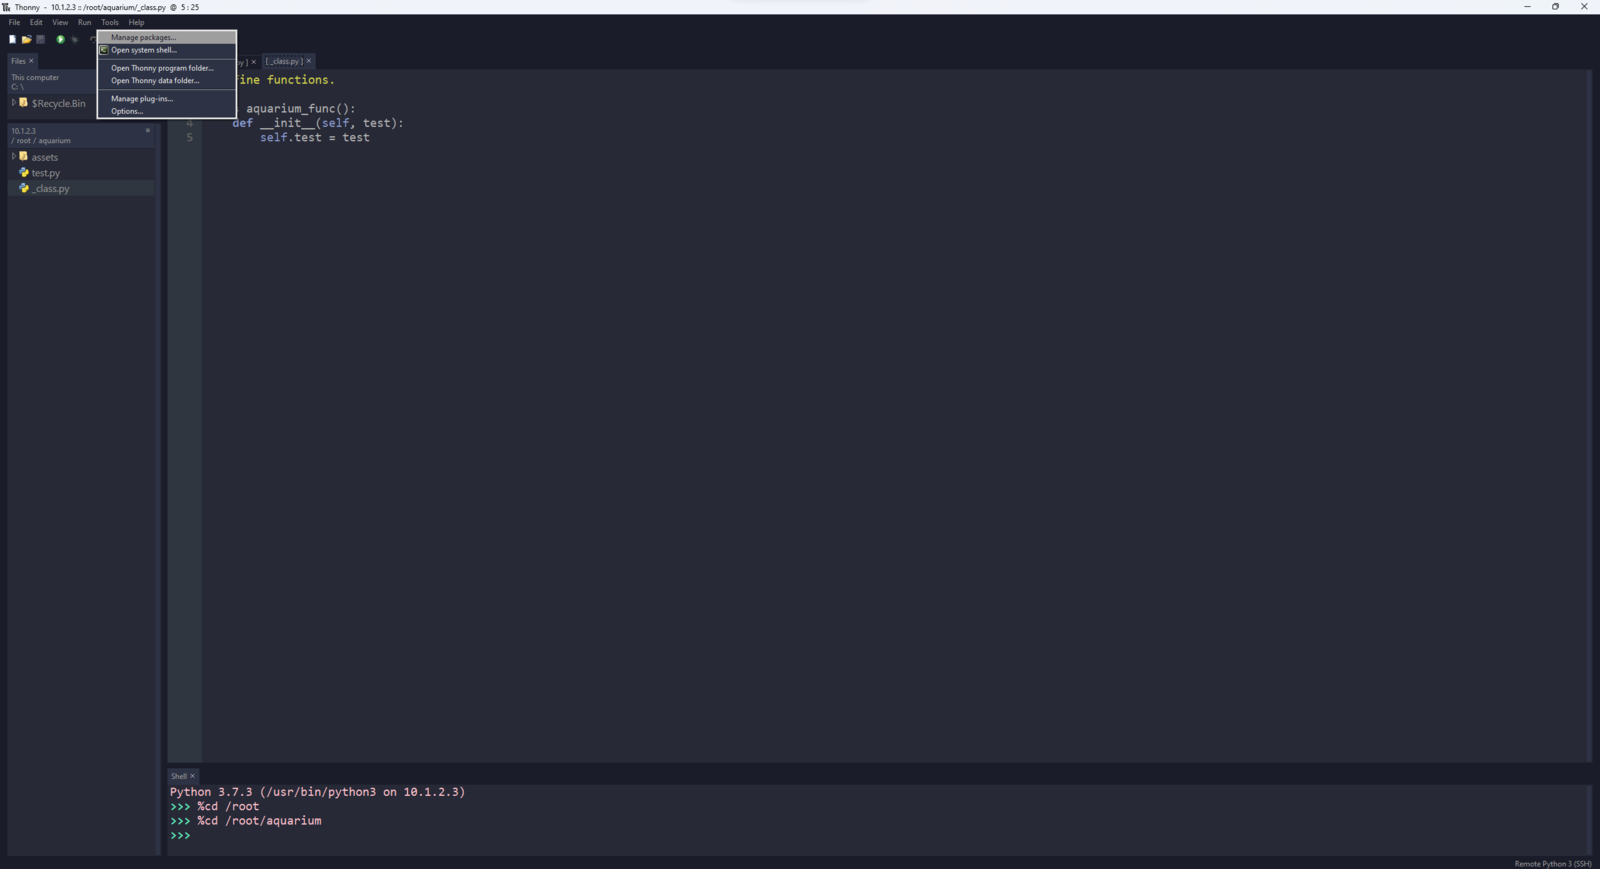
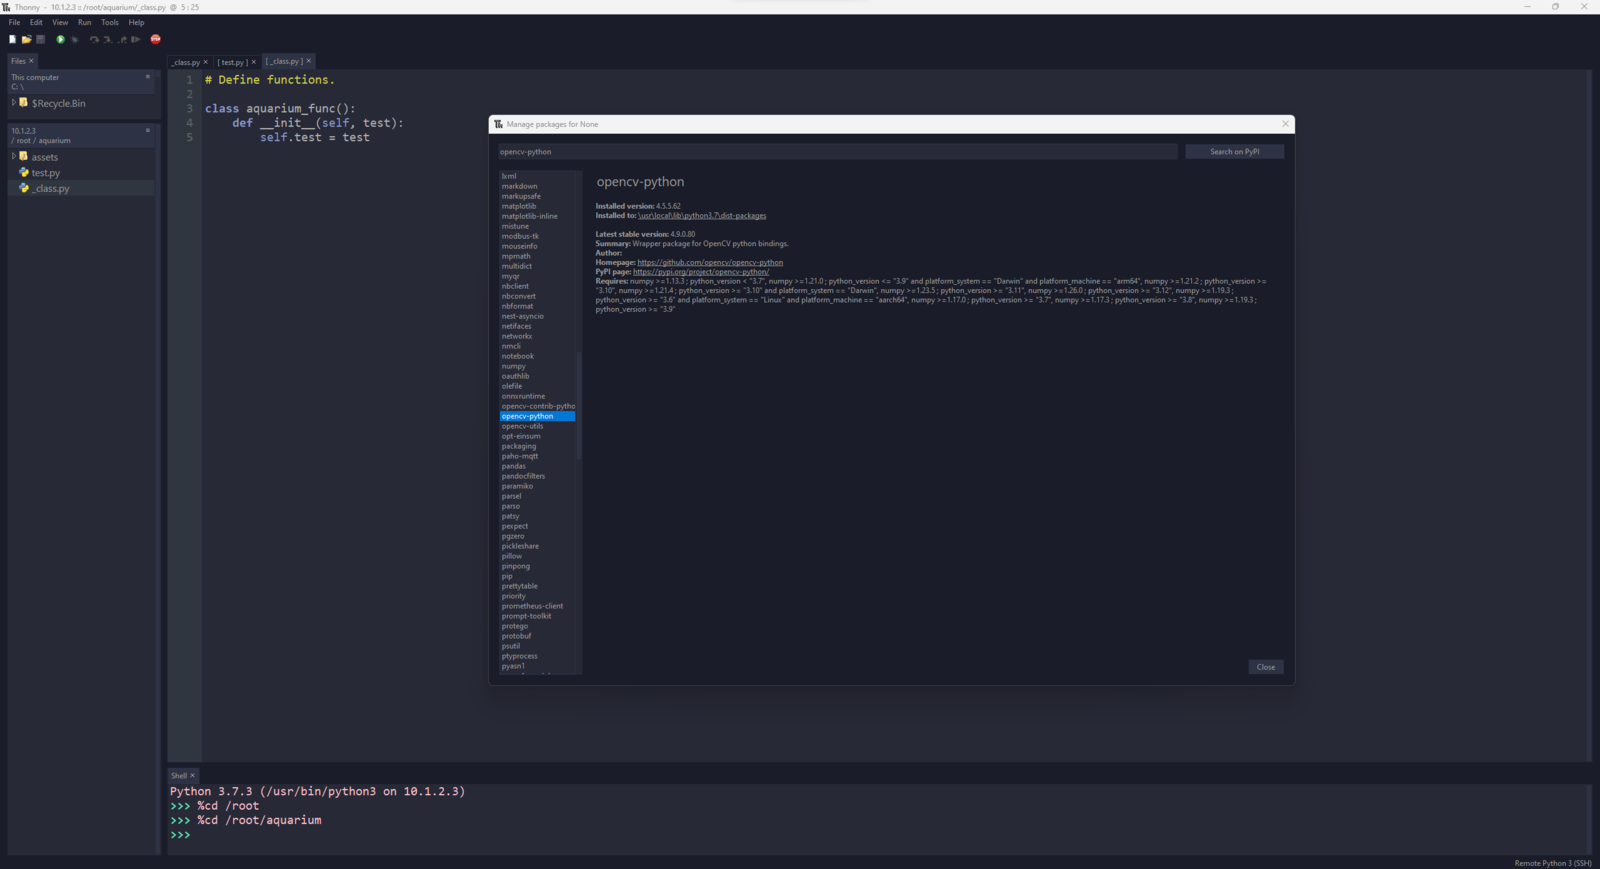
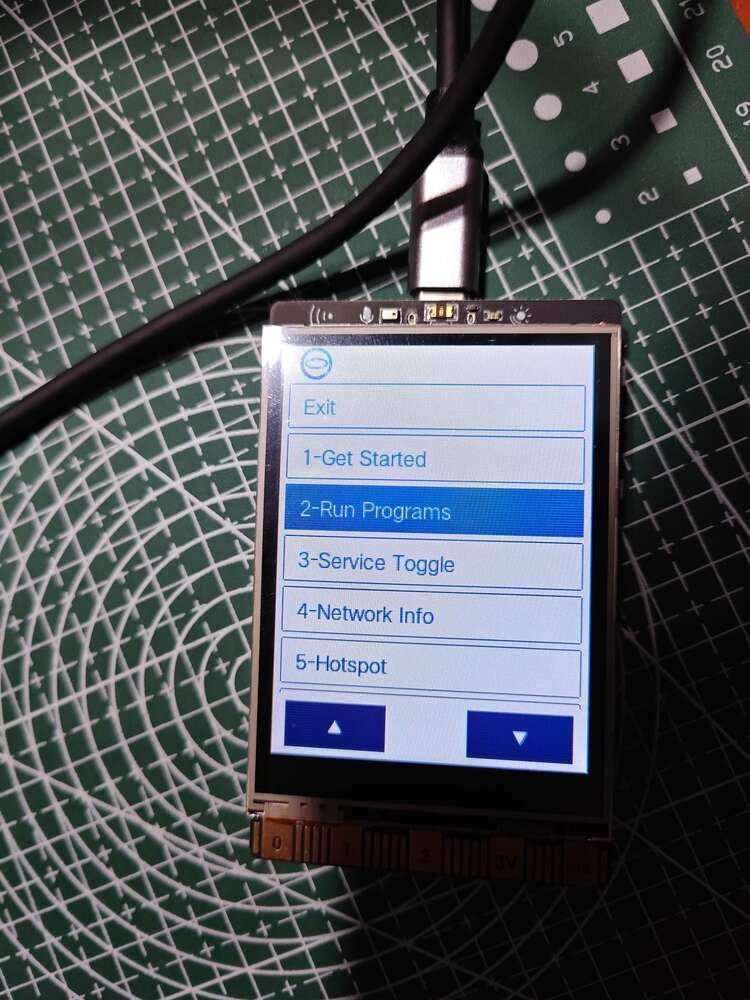
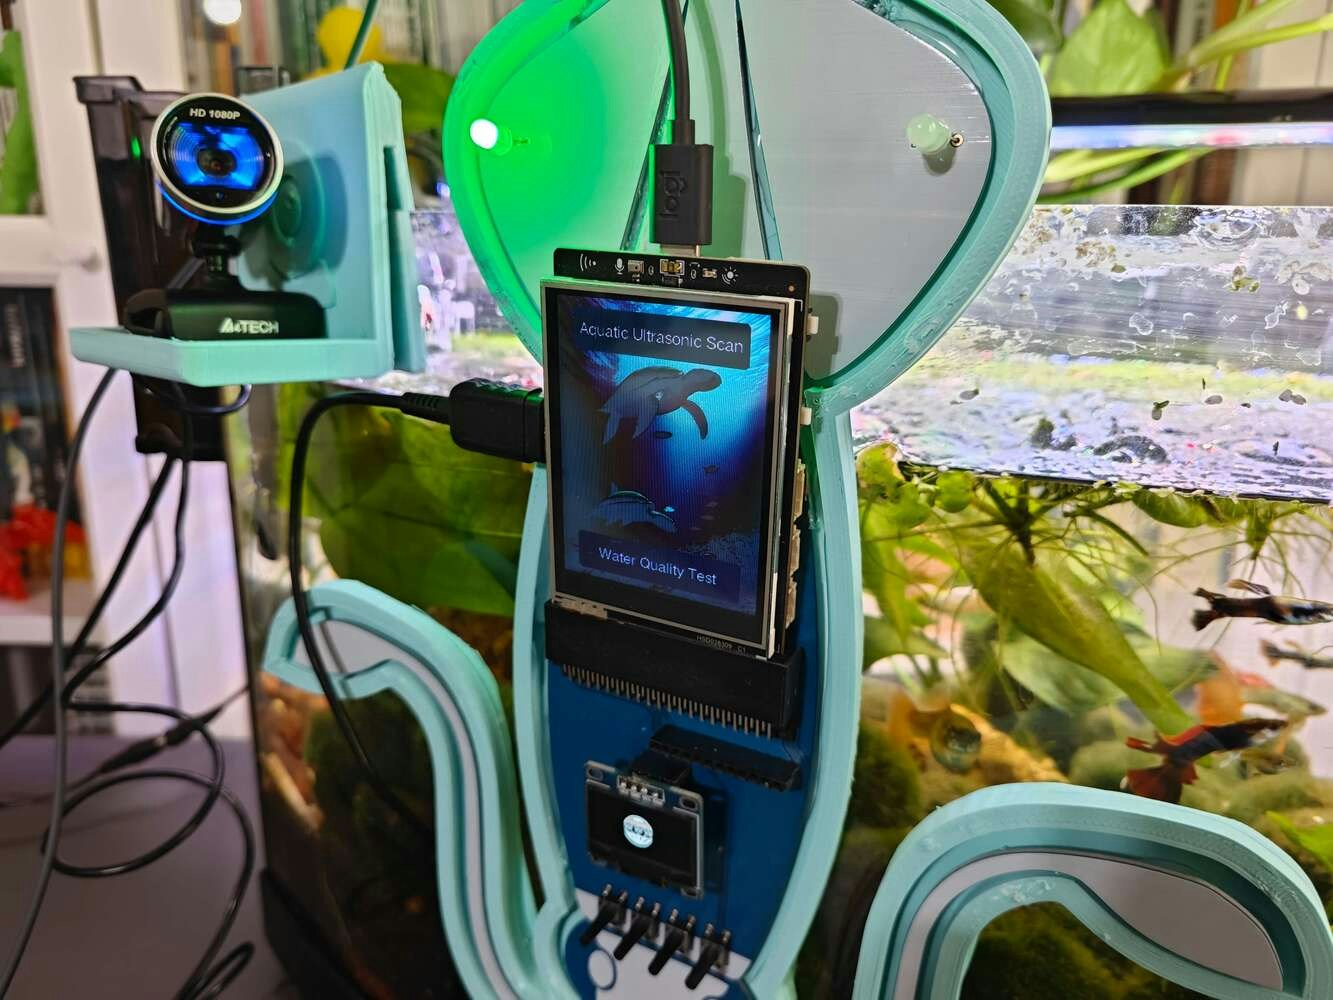
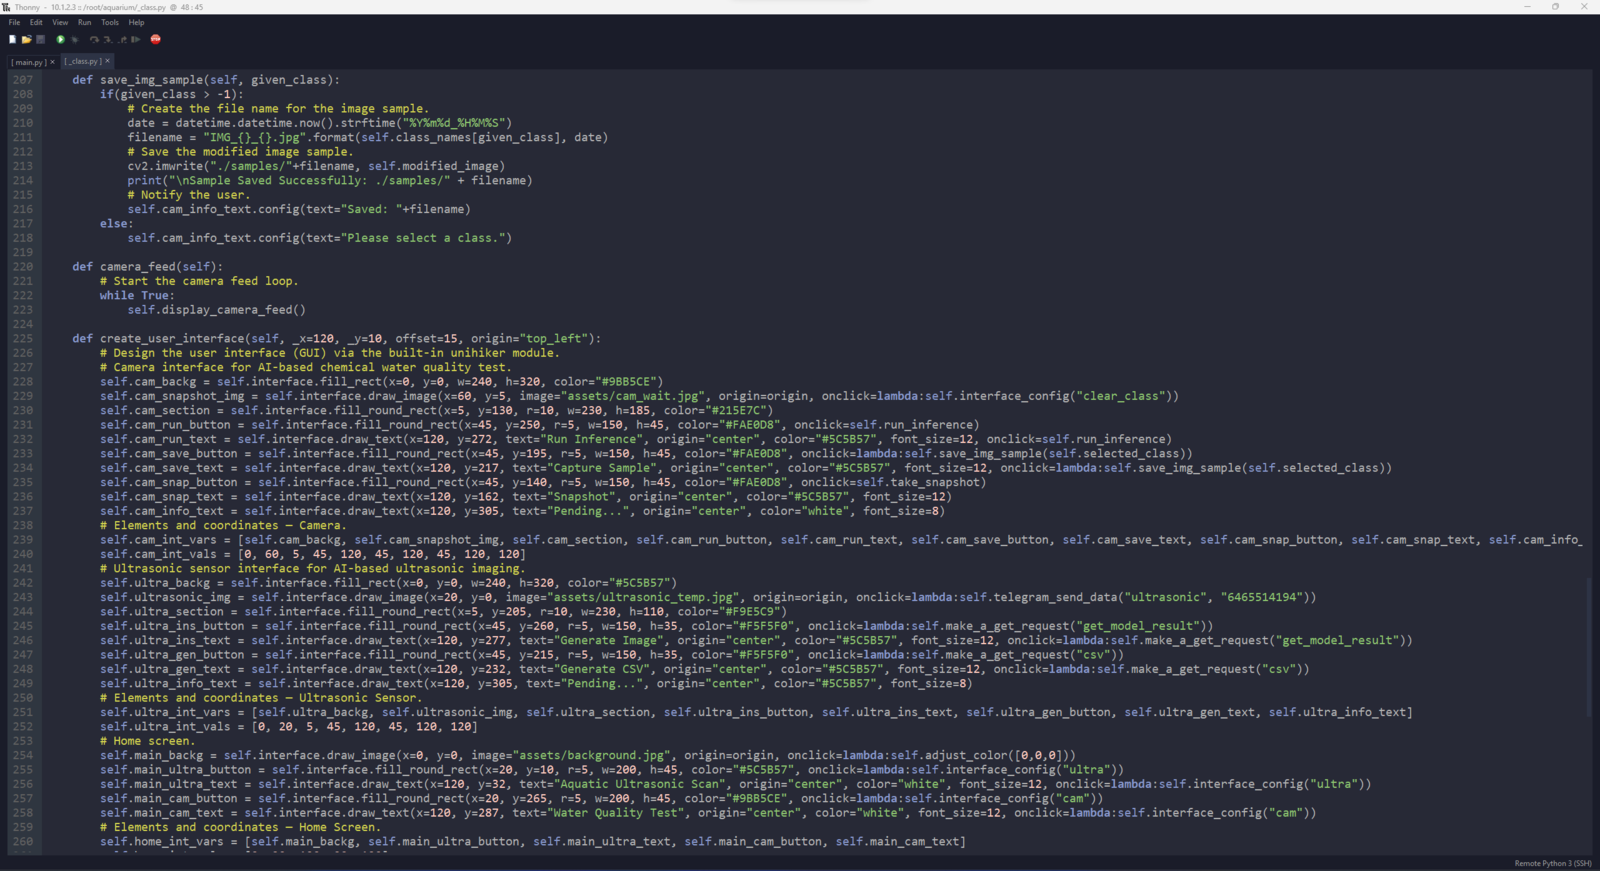
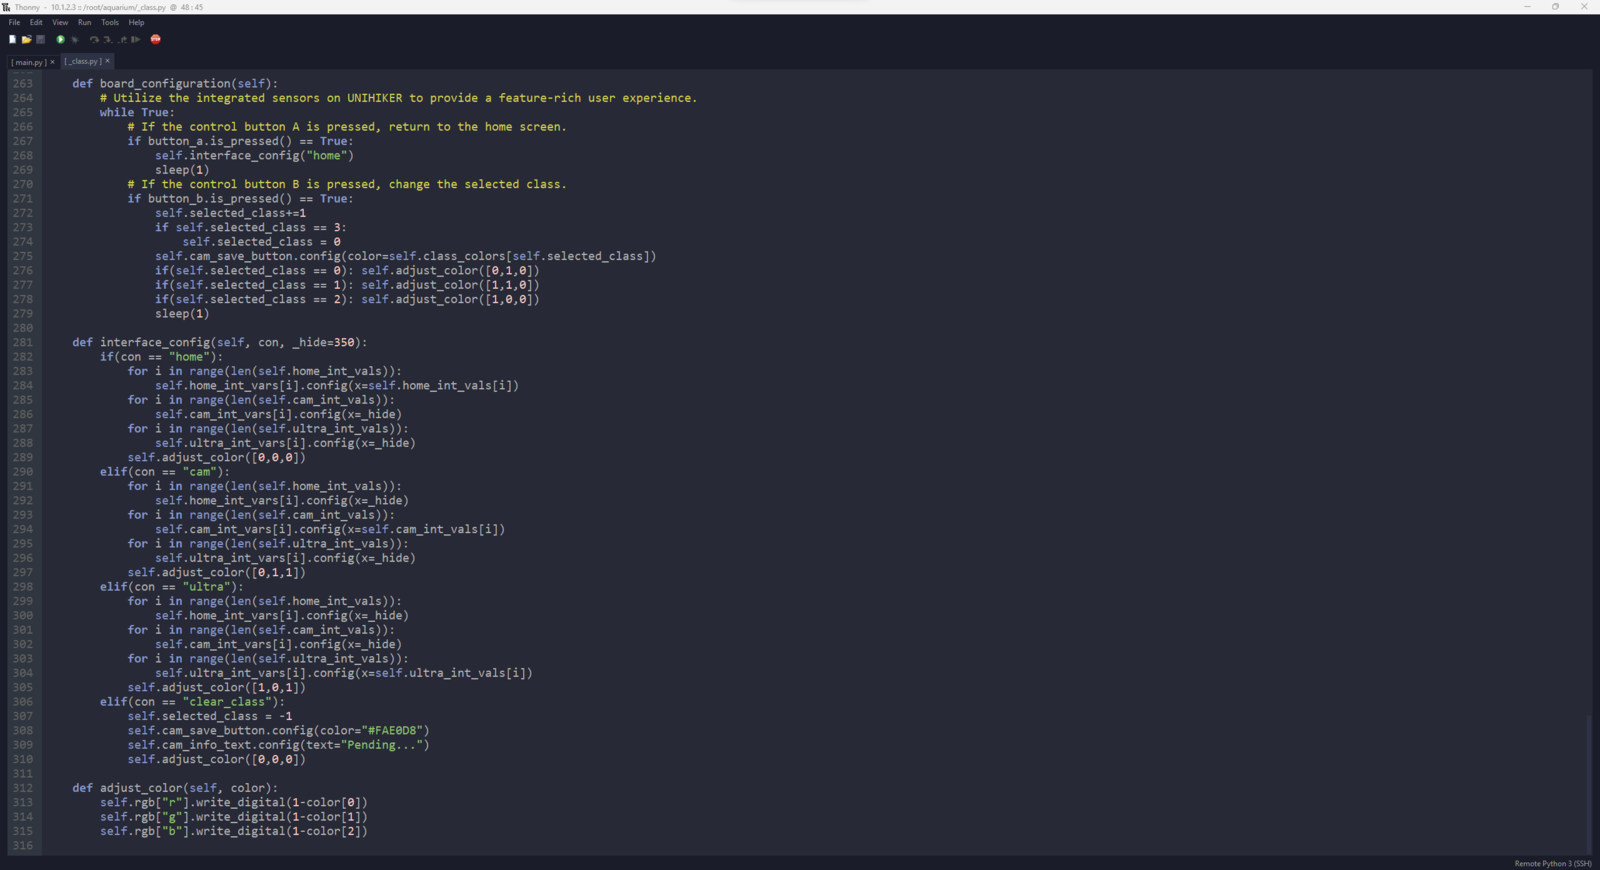
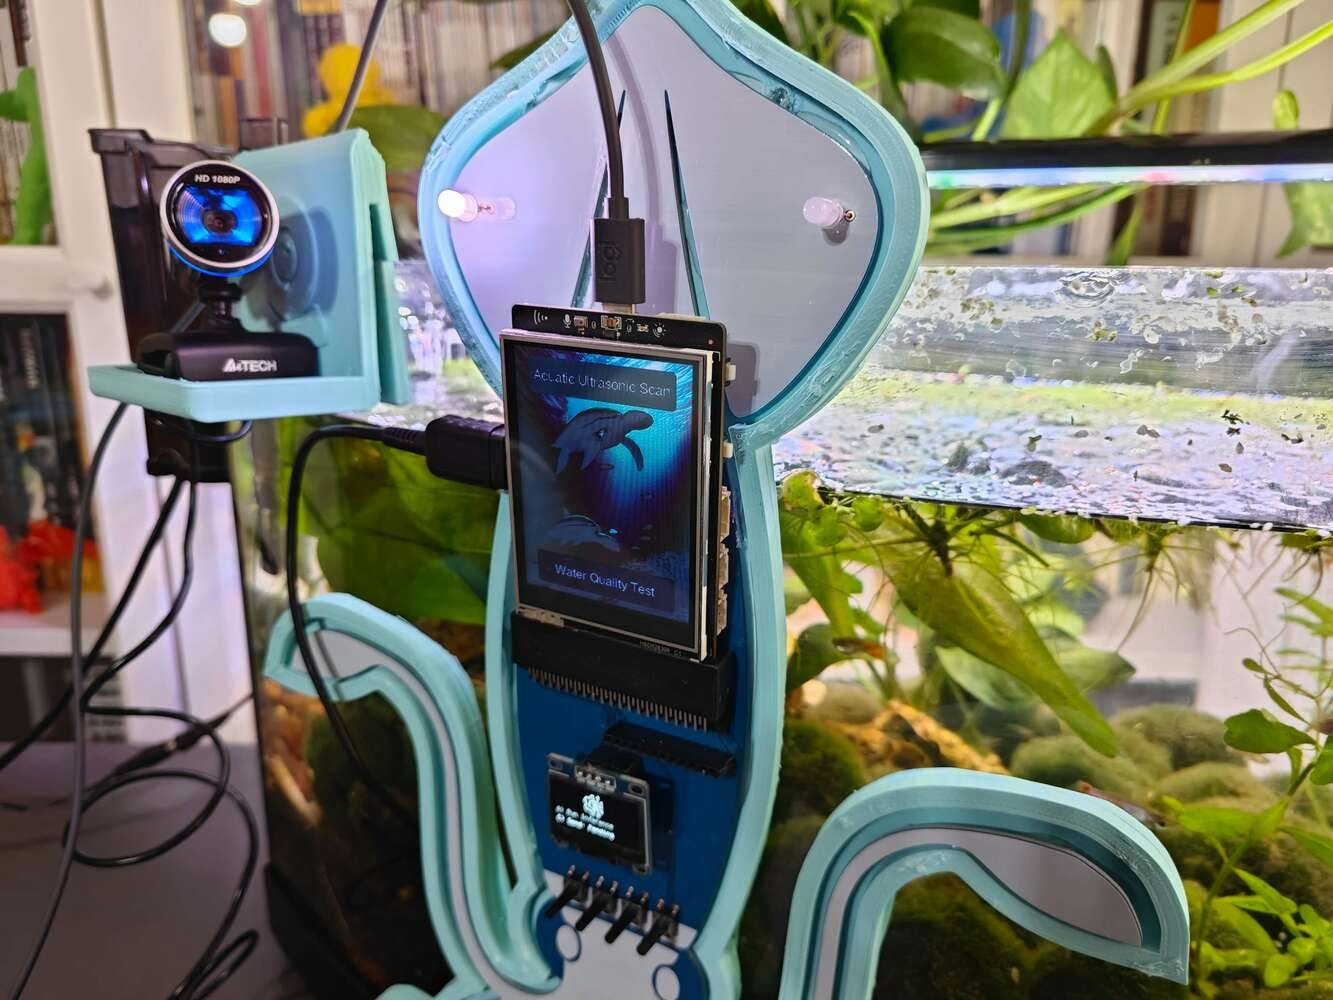
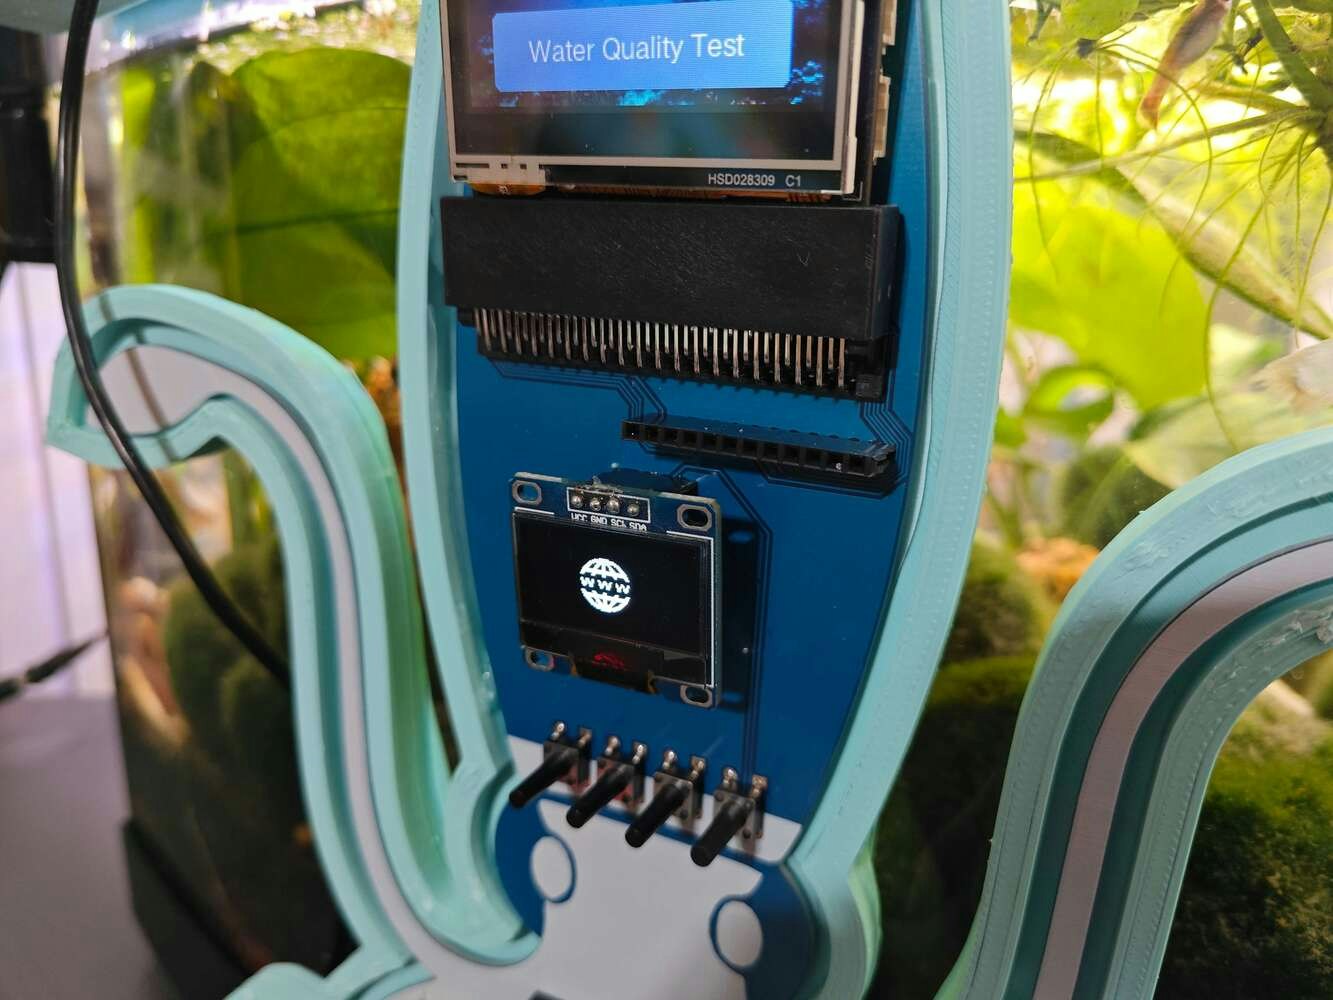
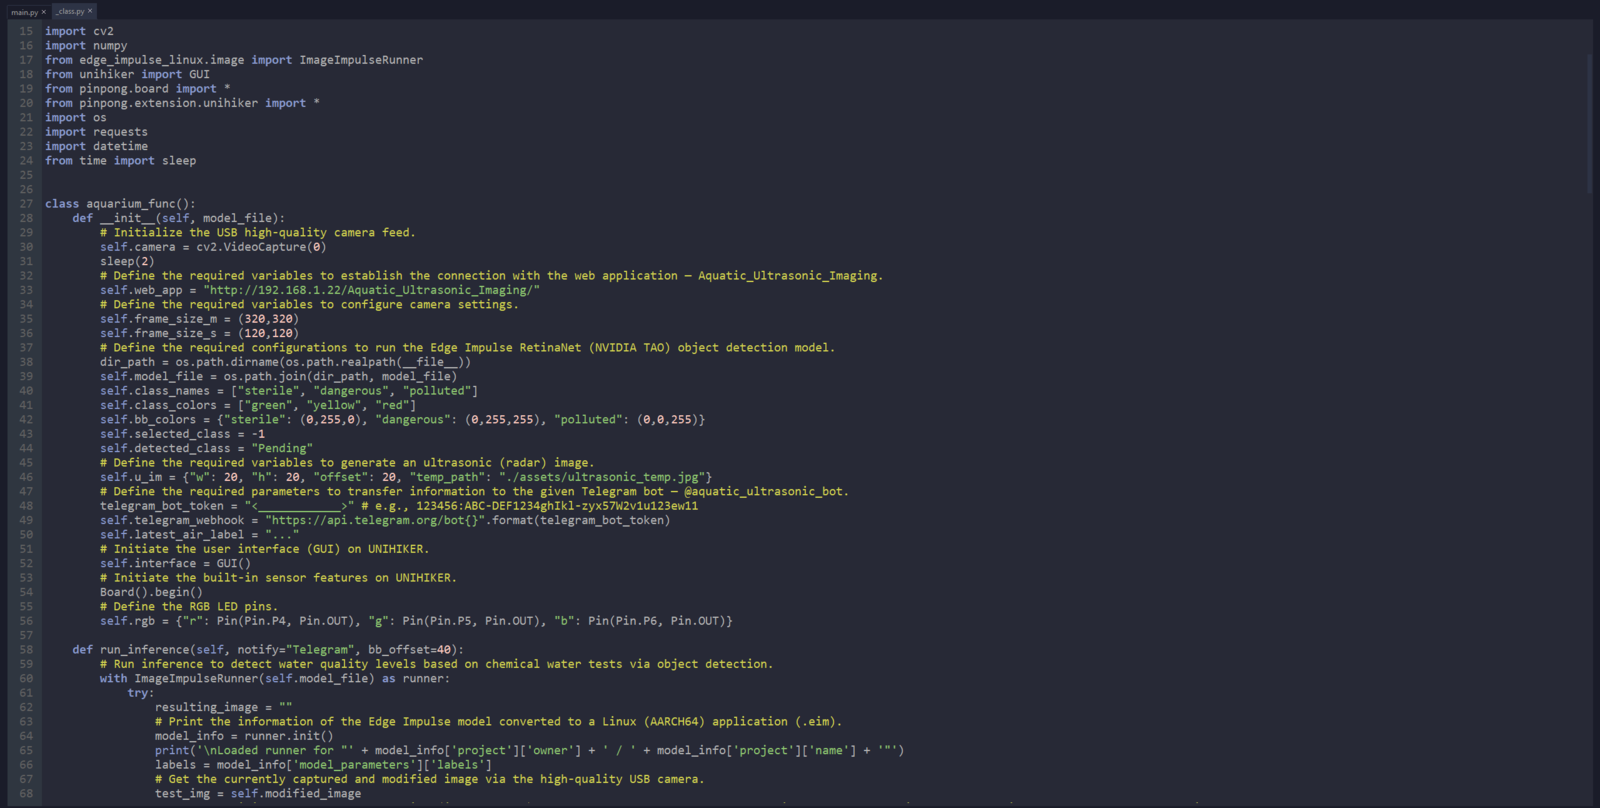
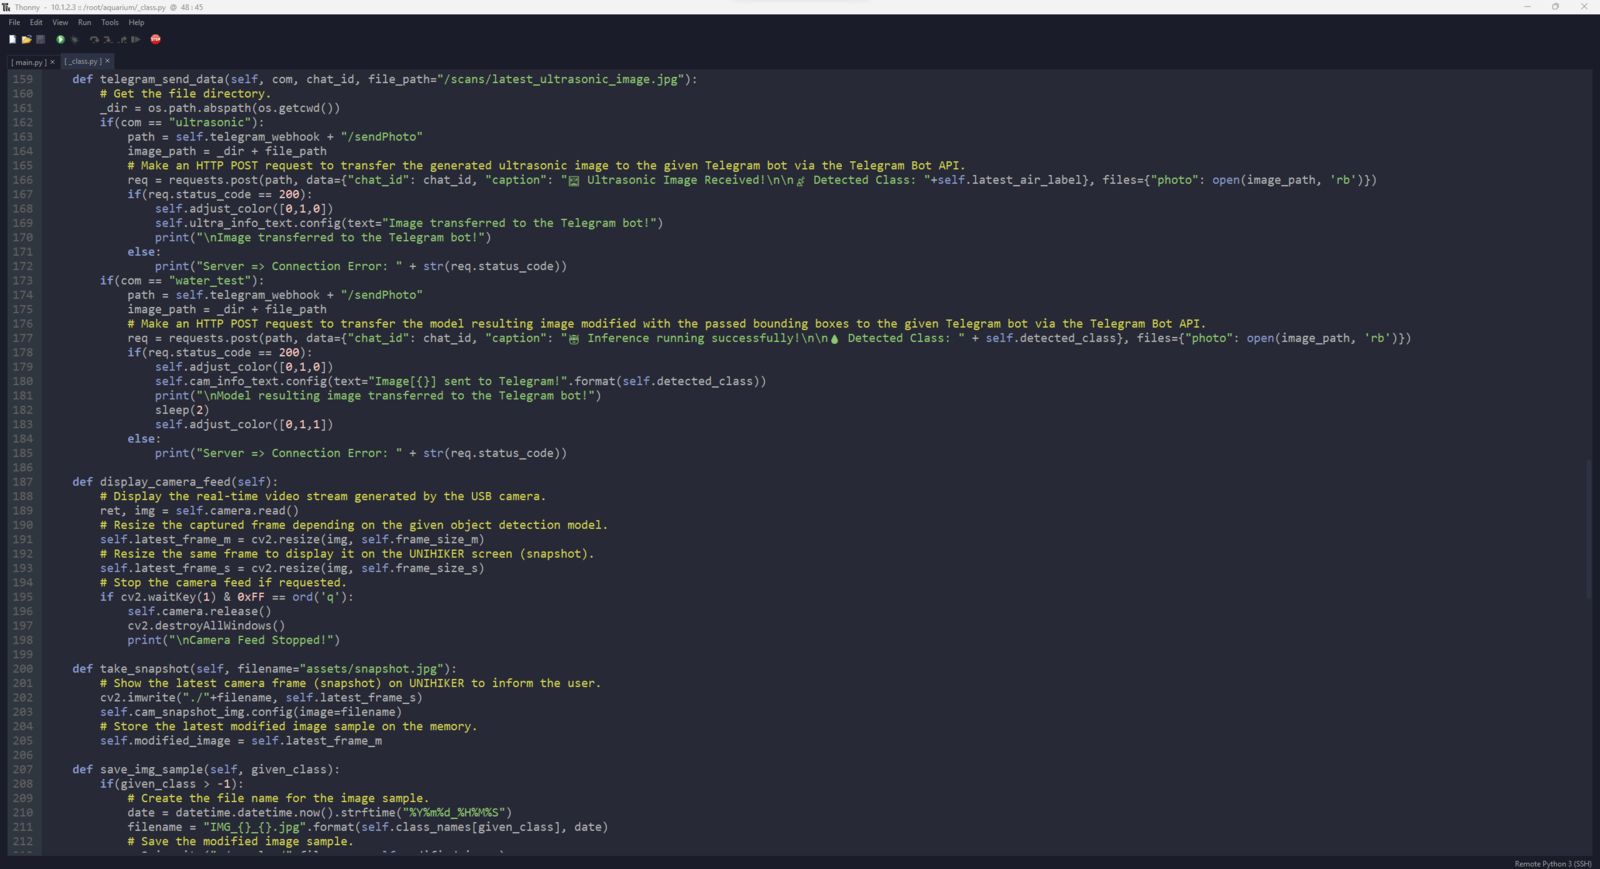
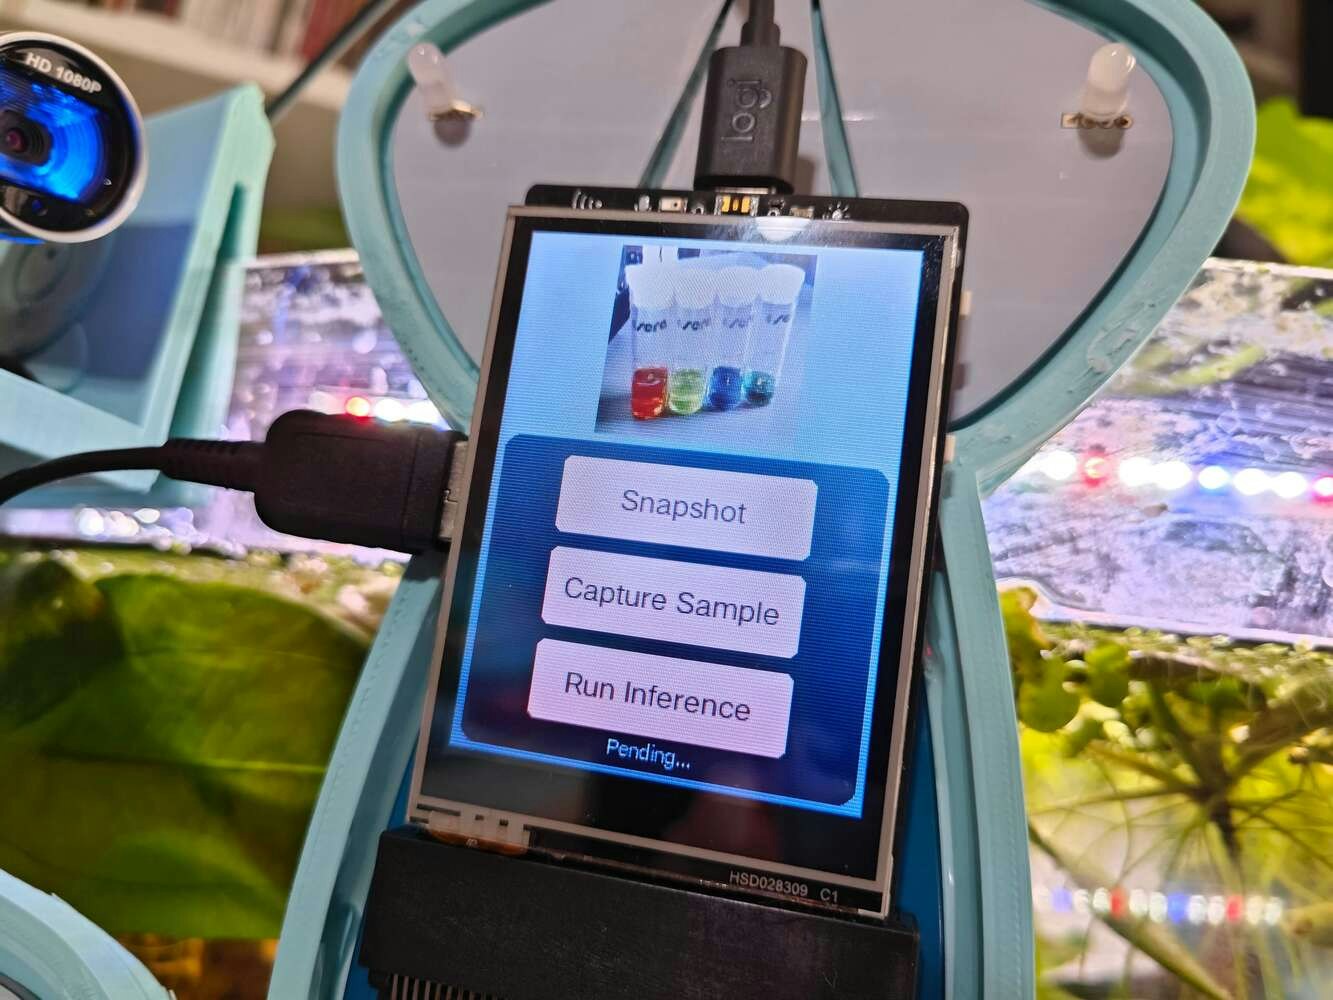
After setting up the necessary software on UNIHIKER via SSH and installing the required modules, I programmed UNIHIKER to capture the water quality test result images with the USB webcam and save them as samples. Since I wanted to provide a feature-rich user interface to capture water quality test result image samples, assign labels, and access the interconnected features, I decided to program an interactive user interface (GUI — Tkinter application) with the integrated Python modules. Since UNIHIKER provides an onboard touchscreen and two control buttons, I did not need to connect additional components to display the user interface. Via the micro:bit-compatible edge connector on the Squid PCB, I added a secondary RGB LED to inform the user of the device status while performing operations related to UNIHIKER. As explained earlier, I managed to group water pollution levels into three categories. Thus, I added the corresponding pollution levels as labels to the file names of each sample while capturing images to create a valid data set for the object detection model. This AI-powered underwater air bubble detection device, assessing water pollution based on chemical tests, comprises two separate development boards — UNIHIKER and Nano ESP32 — performing interconnected features for data collection and running advanced AI models. Thus, the described code snippets show the different aspects of the same code file. Please refer to the code files below to inspect all interconnected functions in detail. 📁 _class.py To bundle all functions under a specific structure, I created a class named aquarium_func. In the following steps, I will clarify the remaining functions of this class. Please refer to the _class.py file to inspect all interconnected functions. ⭐ In the display_camera_feed function: ⭐ Obtain the real-time video stream (frames) generated by the high-quality USB webcam. ⭐ Resize the latest captured camera frame depending on the provided image sample sizes of the Edge Impulse object detection model. ⭐ Then, resize the same frame to display a snapshot of the latest captured camera frame on the onboard touchscreen. ⭐ Stop the real-time camera feed if requested.- Home
- Aquatic Ultrasonic Scan
- Water Quality Test
Step 9.2: Saving the captured images via the interactive user interface (GUI)
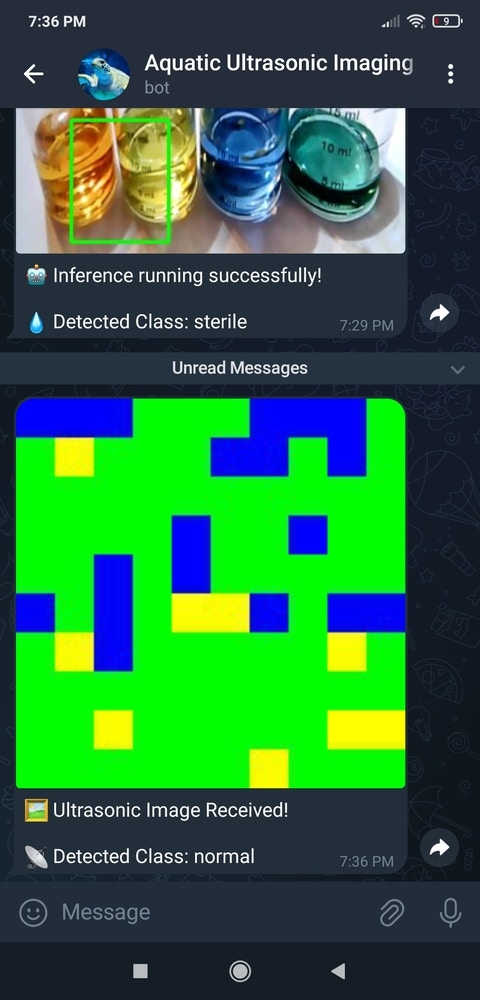
Since the captured camera frame size is not compatible with the object detection model, I utilized the built-in OpenCV features to resize the captured frame according to the required dimensions for both the model and the user interface (snapshot). After executing the main.py file on UNIHIKER: 🐠📡💧📊 The device displays the home screen, showing two main sections, on the built-in touchscreen of UNIHIKER.- Aquatic Ultrasonic Scan
- Water Quality Test
- Green ➡ sterile
- Yellow ➡ dangerous
- Red ➡ polluted
Step 10: Building a neural network model w/ Edge Impulse Enterprise
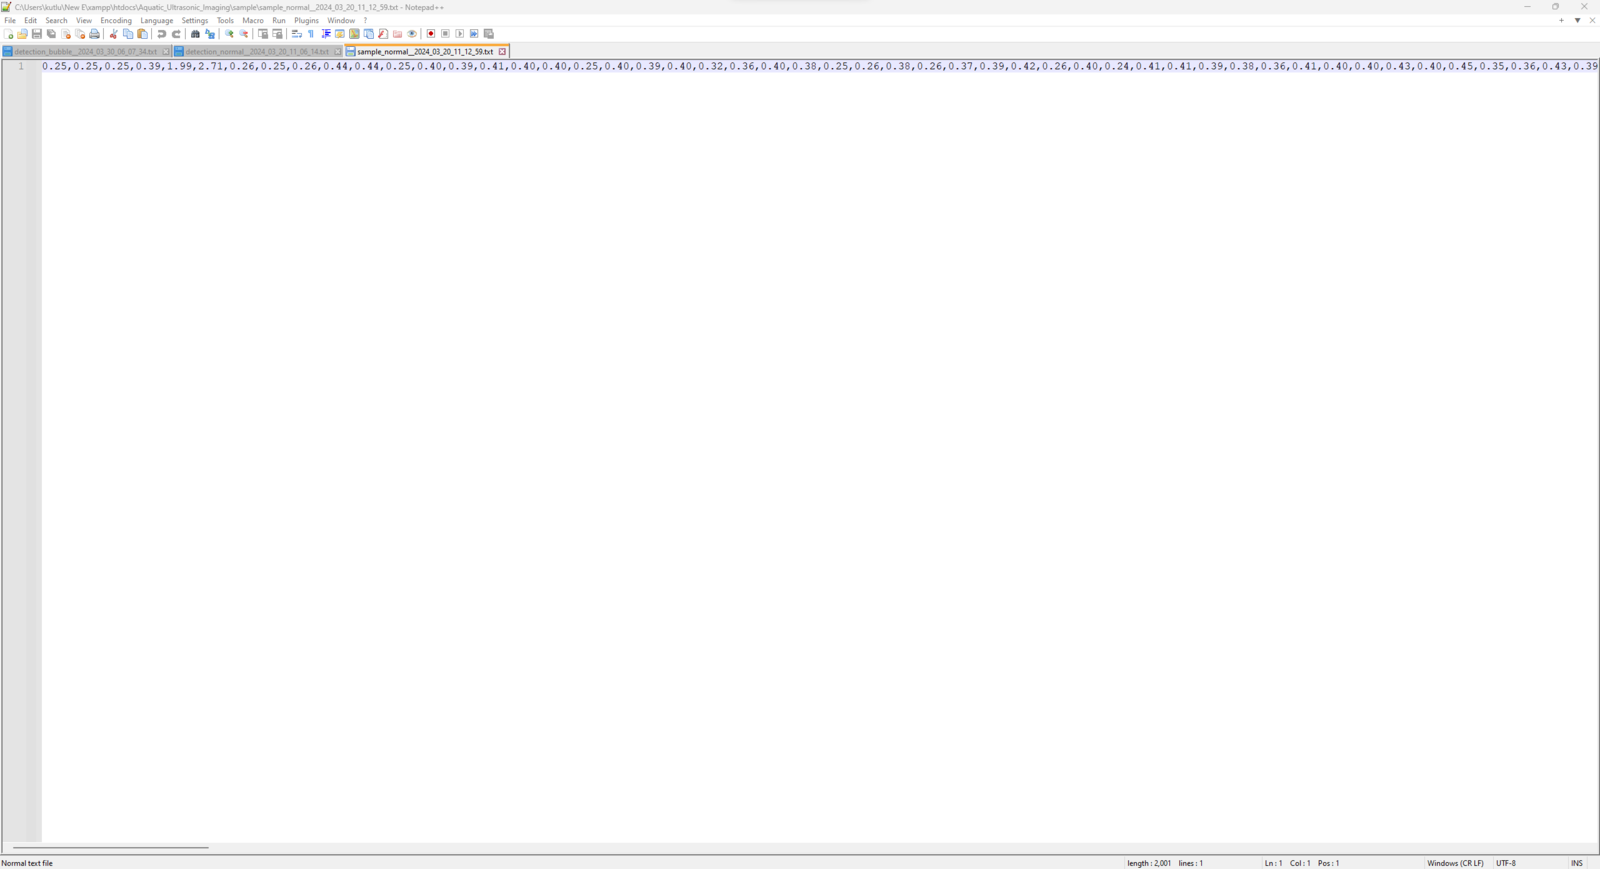
As explained earlier, I set up a freshwater aquarium to simulate the harsh fish farm conditions leading to noxious air bubbles lurking in the underwater substrate. Then, I utilized the URM15 (waterproof) ultrasonic sensor to generate ultrasonic scan buffers of the bottom of the tank, consisting of 400 data points as a 20 x 20 ultrasonic image. While collecting and saving aquatic ultrasonic scan buffers, I empirically differentiated the produced samples (data records) depending on the presence of toxic air bubbles:- normal
- bubble
- Data Scaling (Resizing)
- Data Labeling
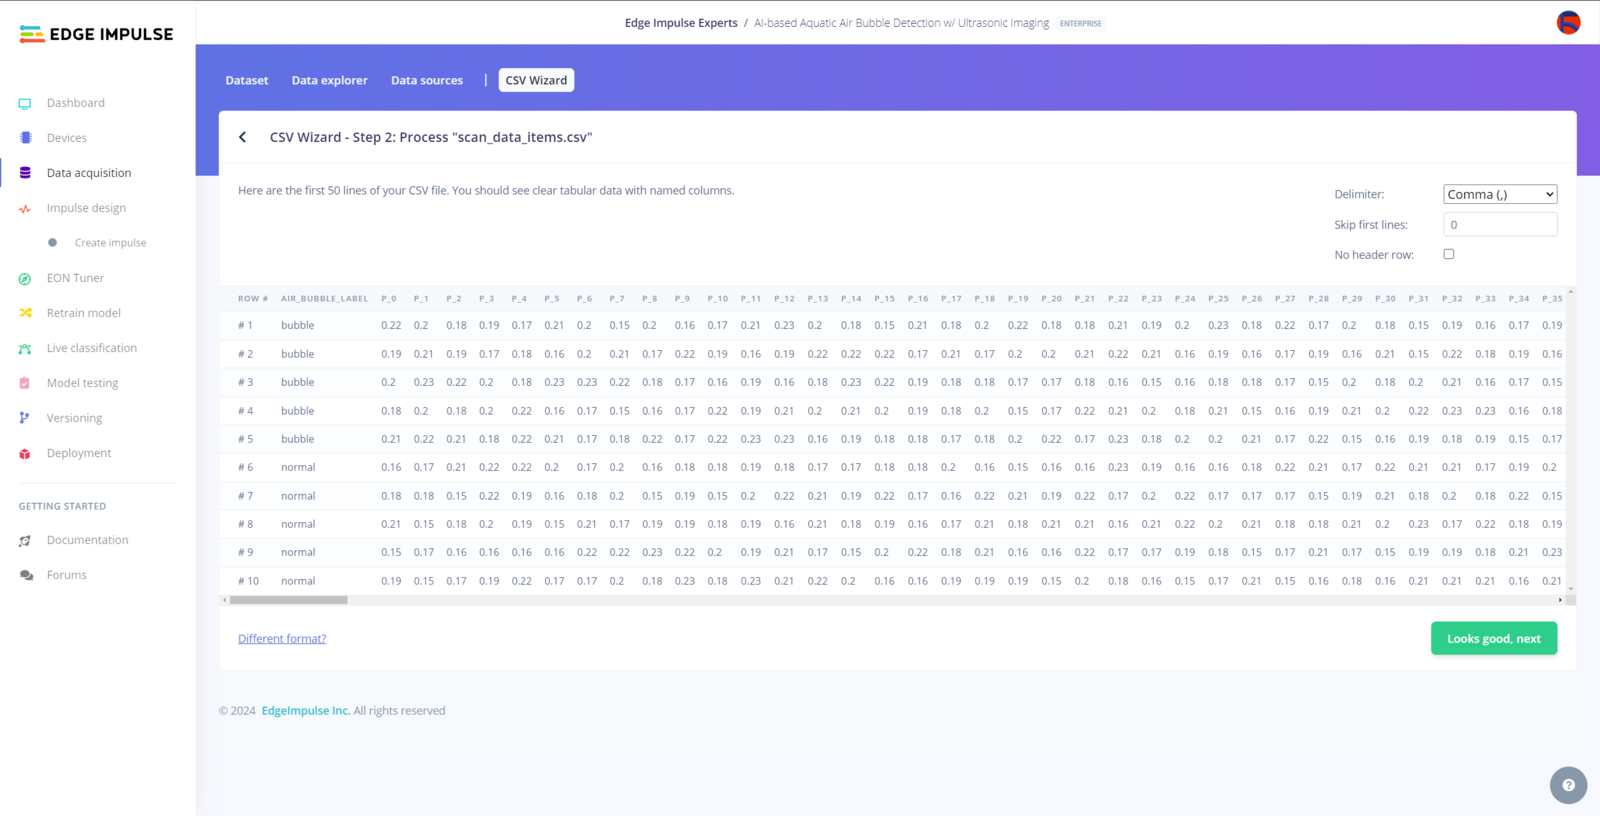
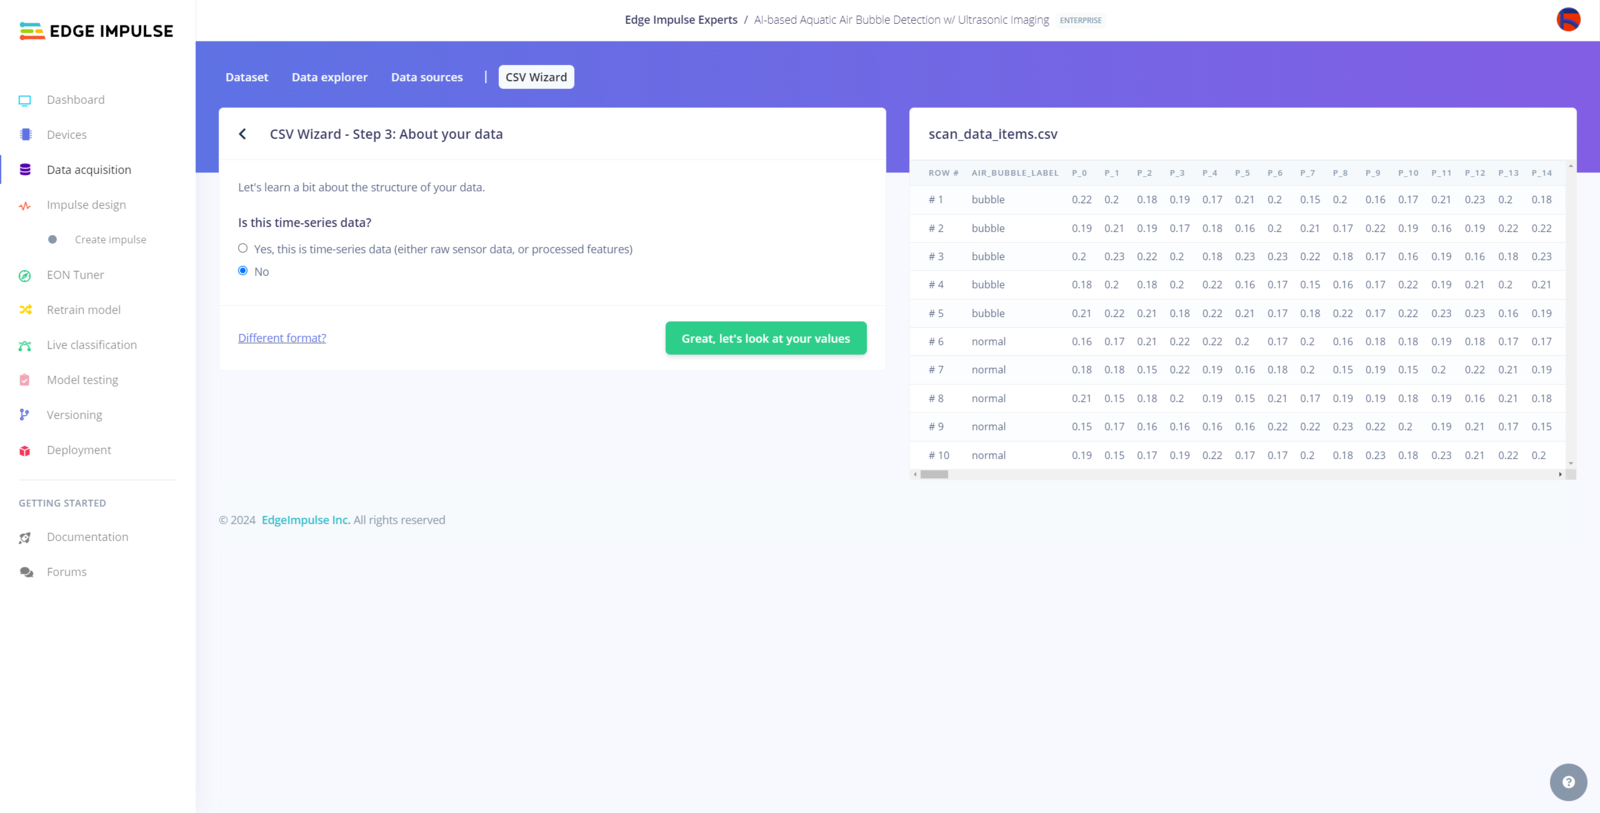
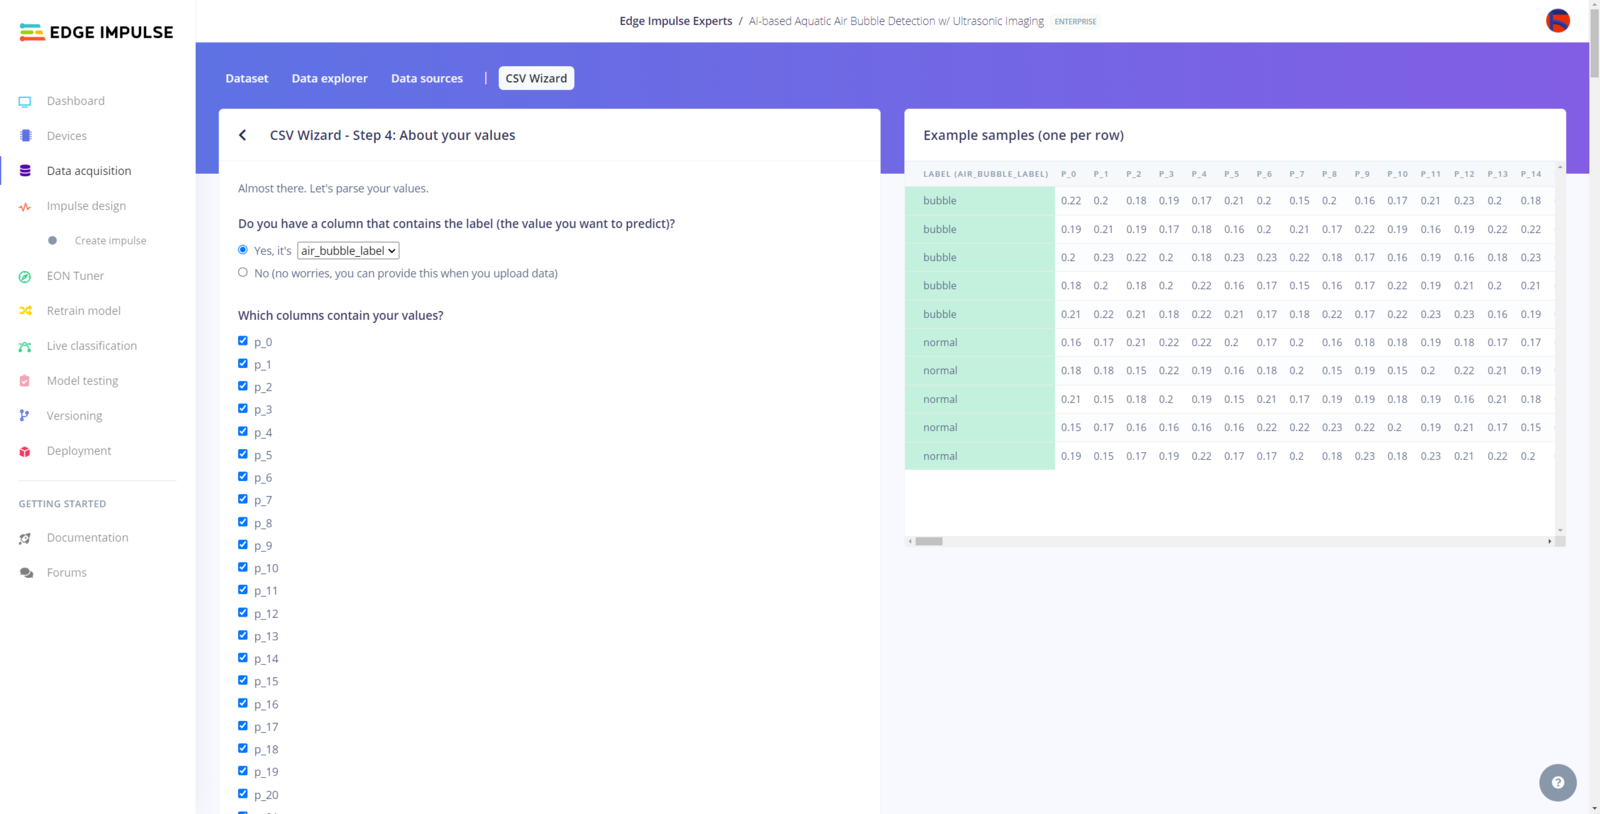
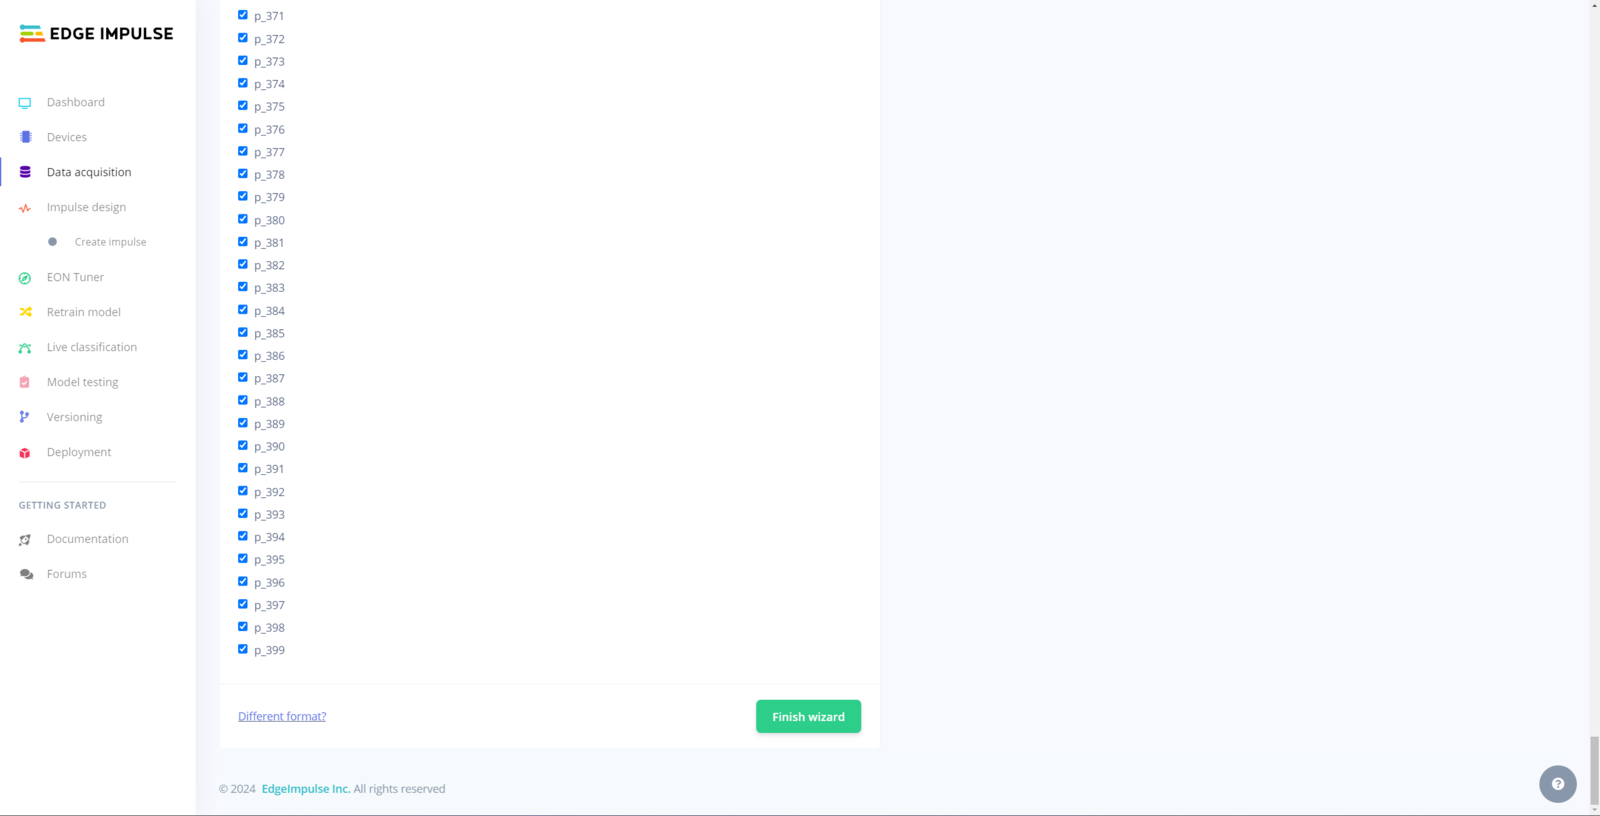
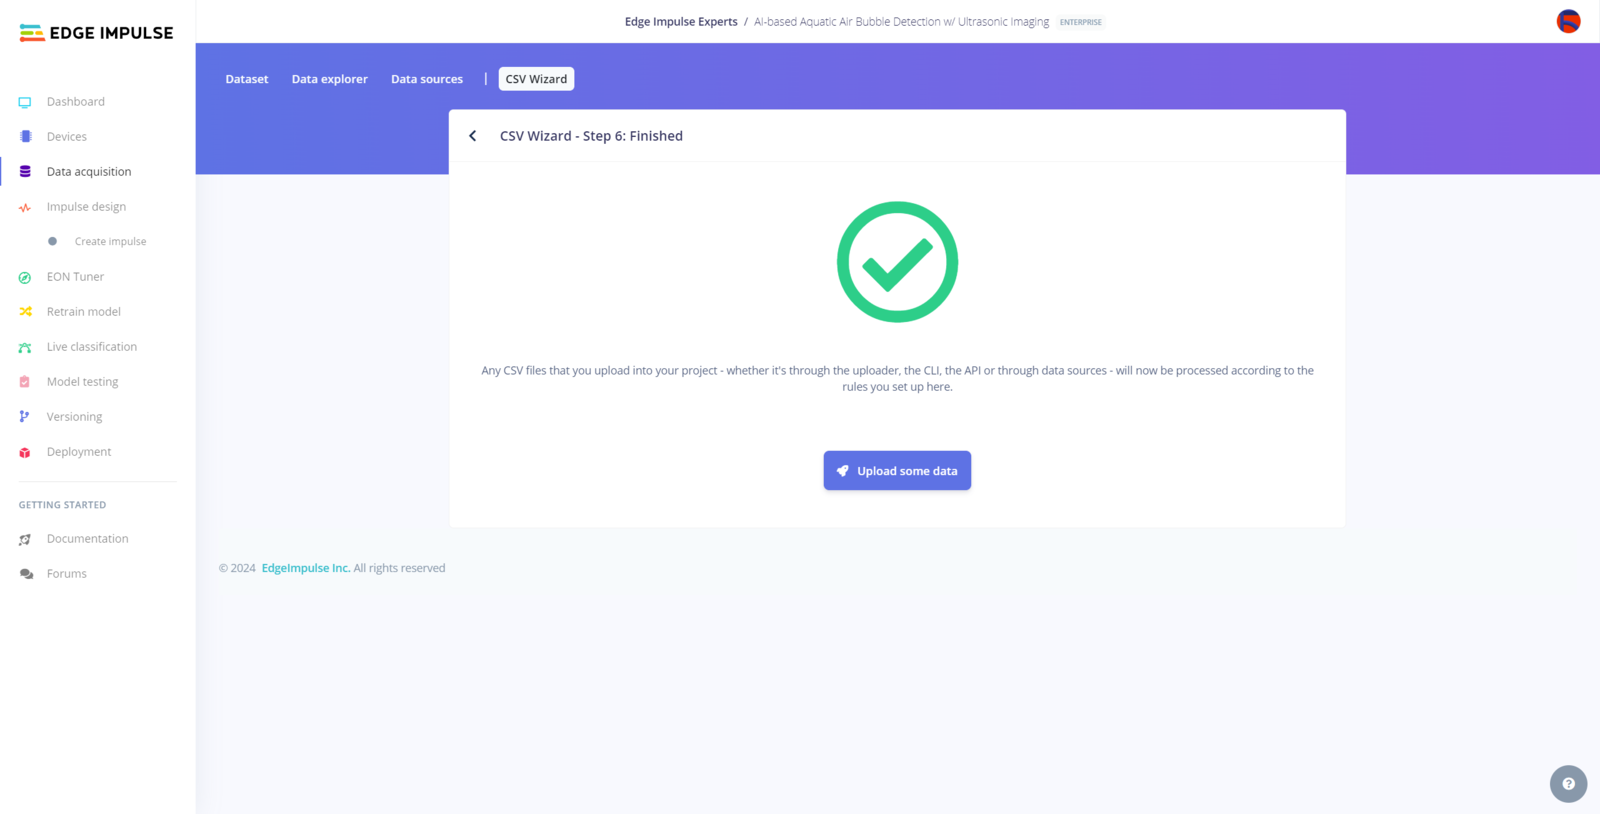
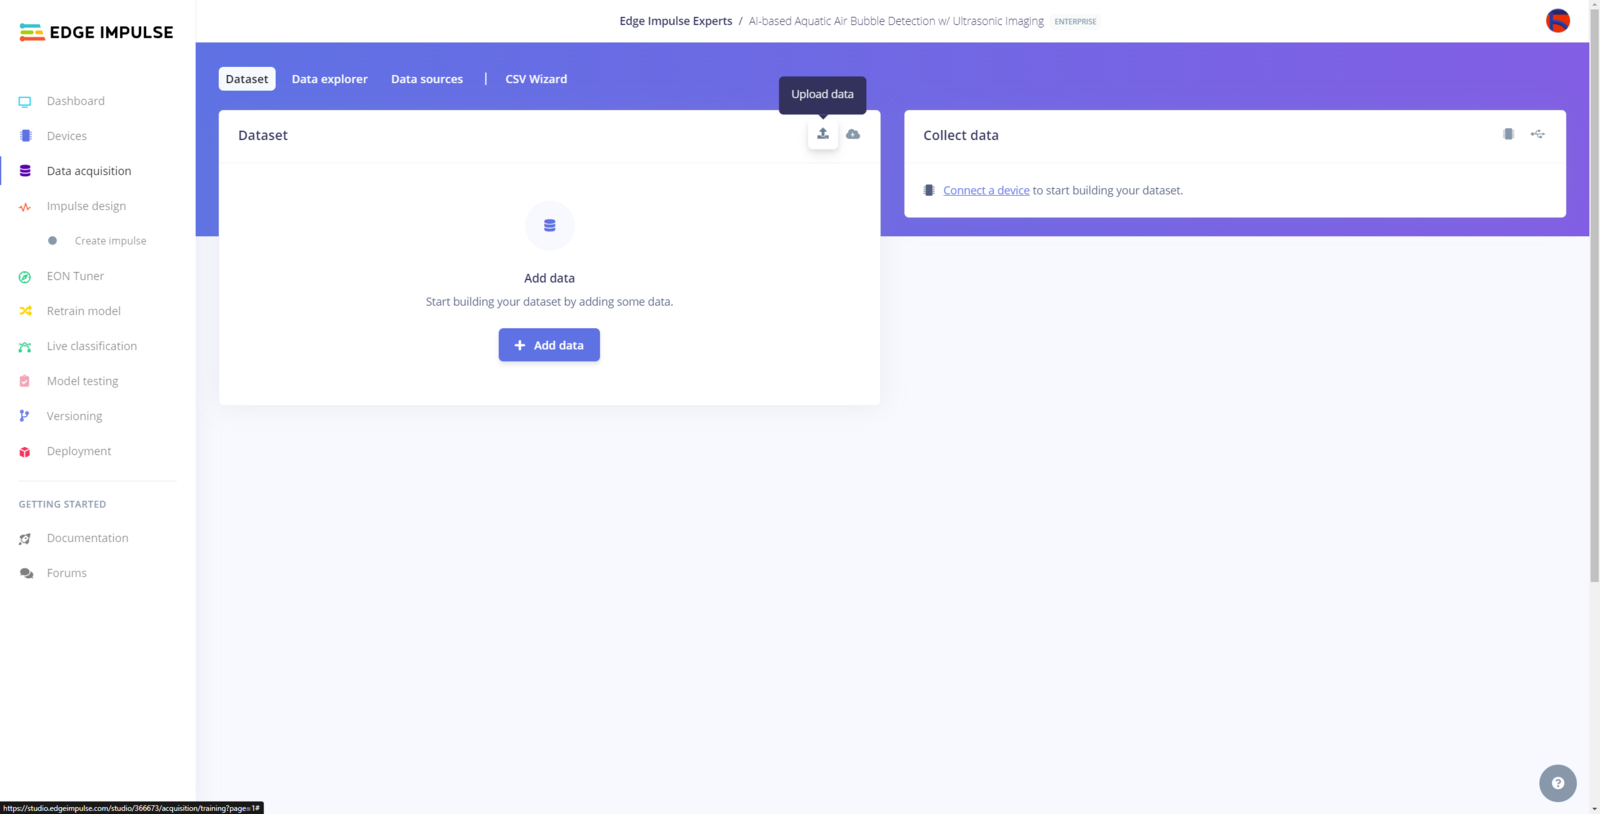
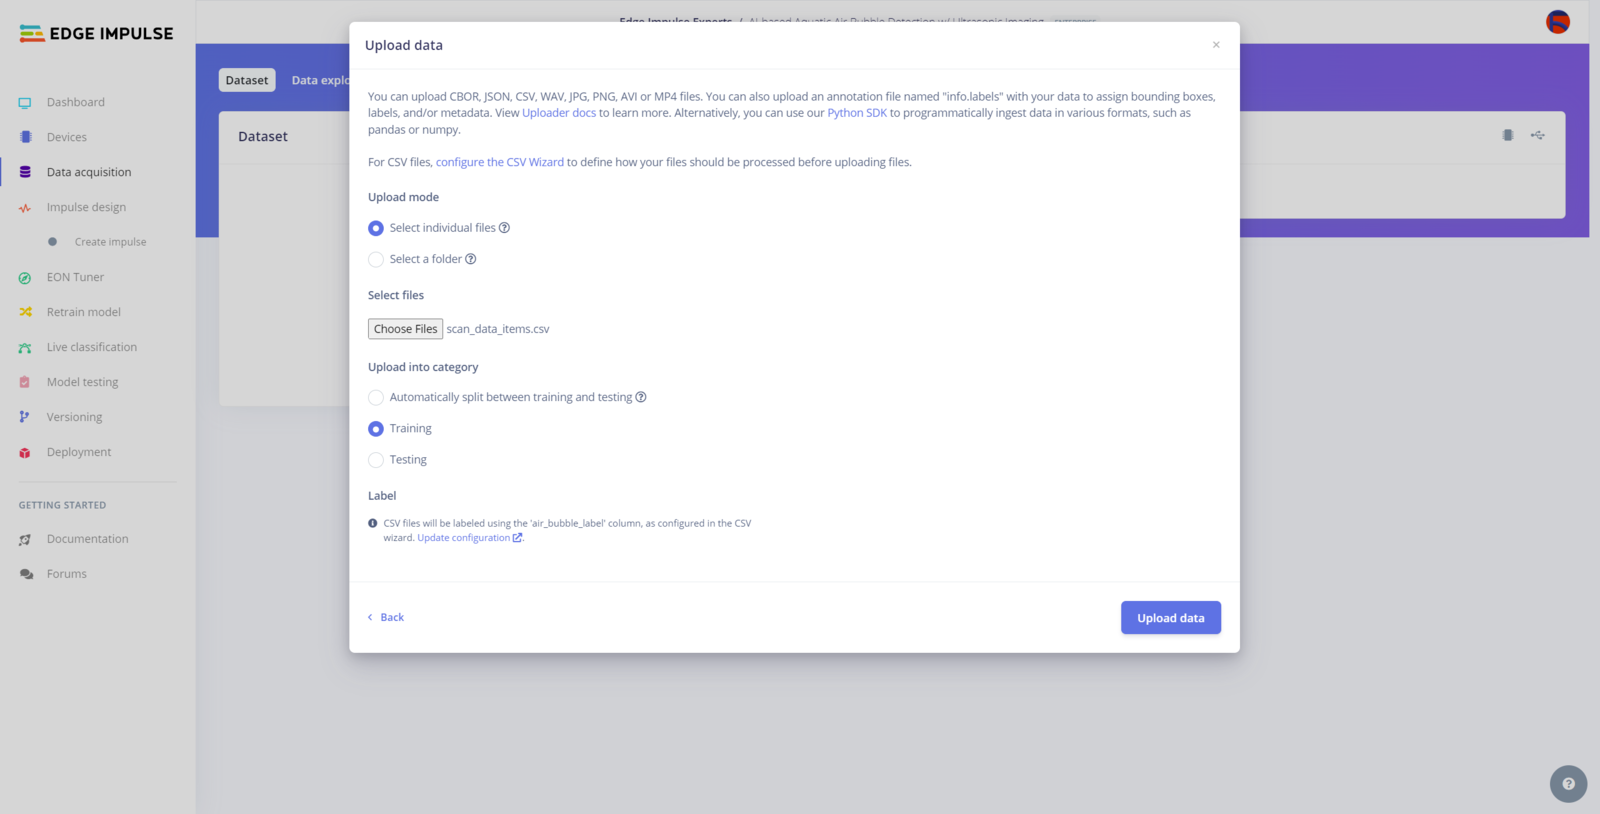
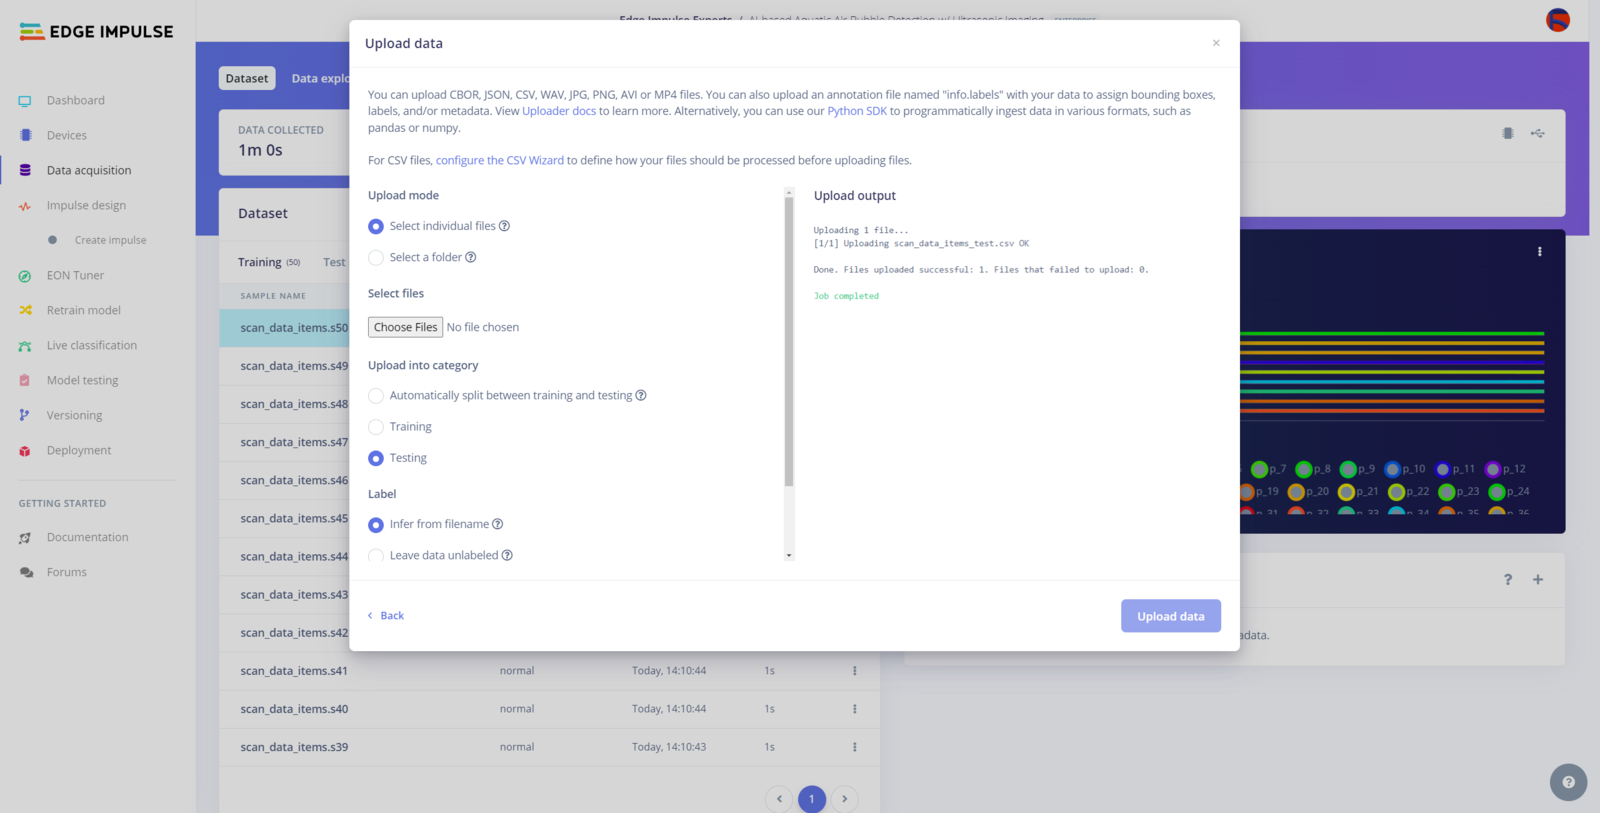
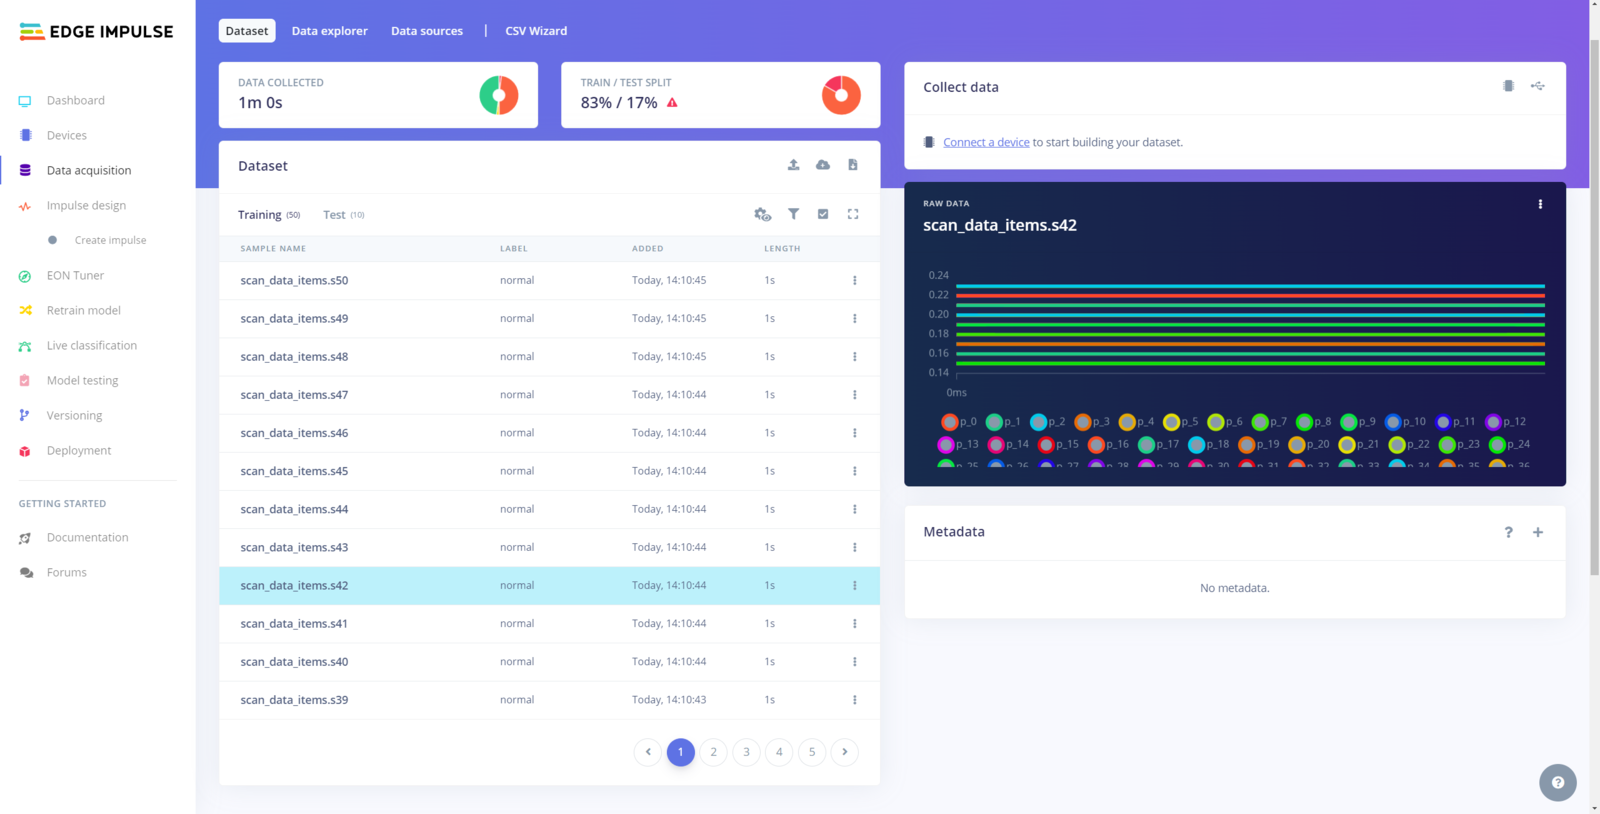
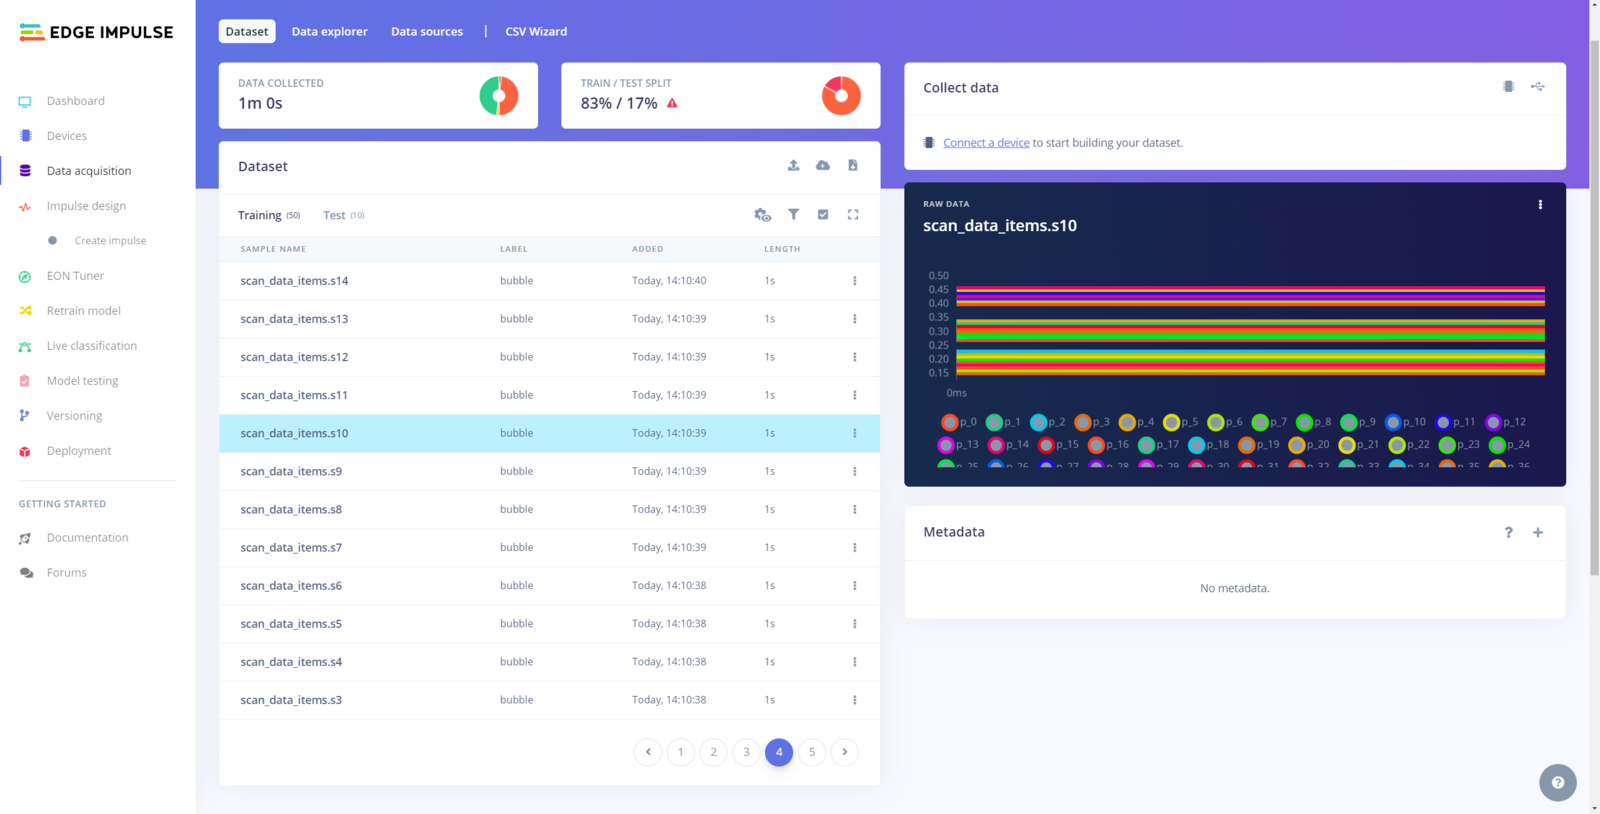
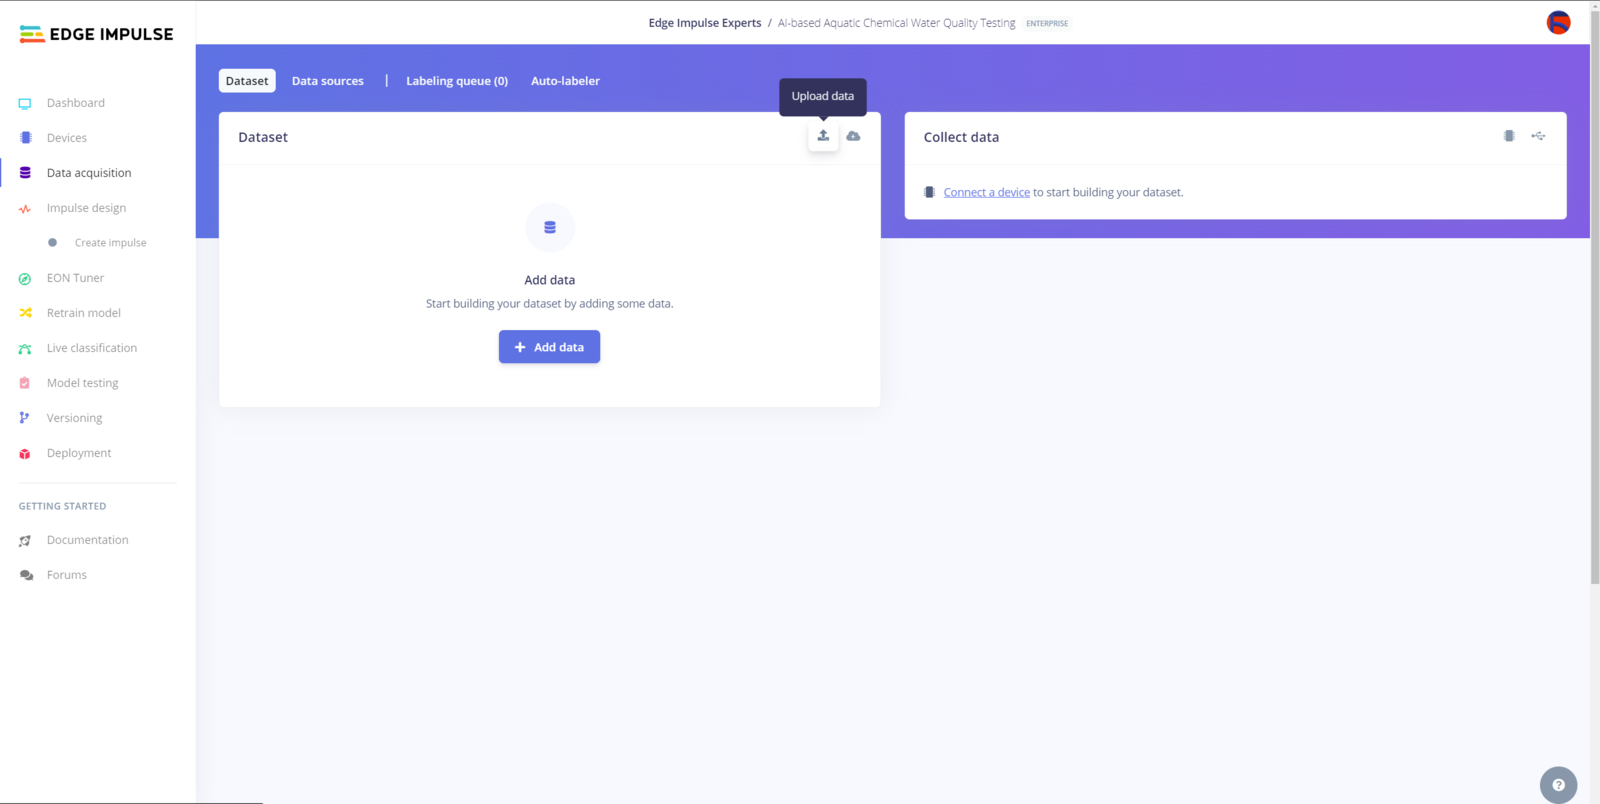
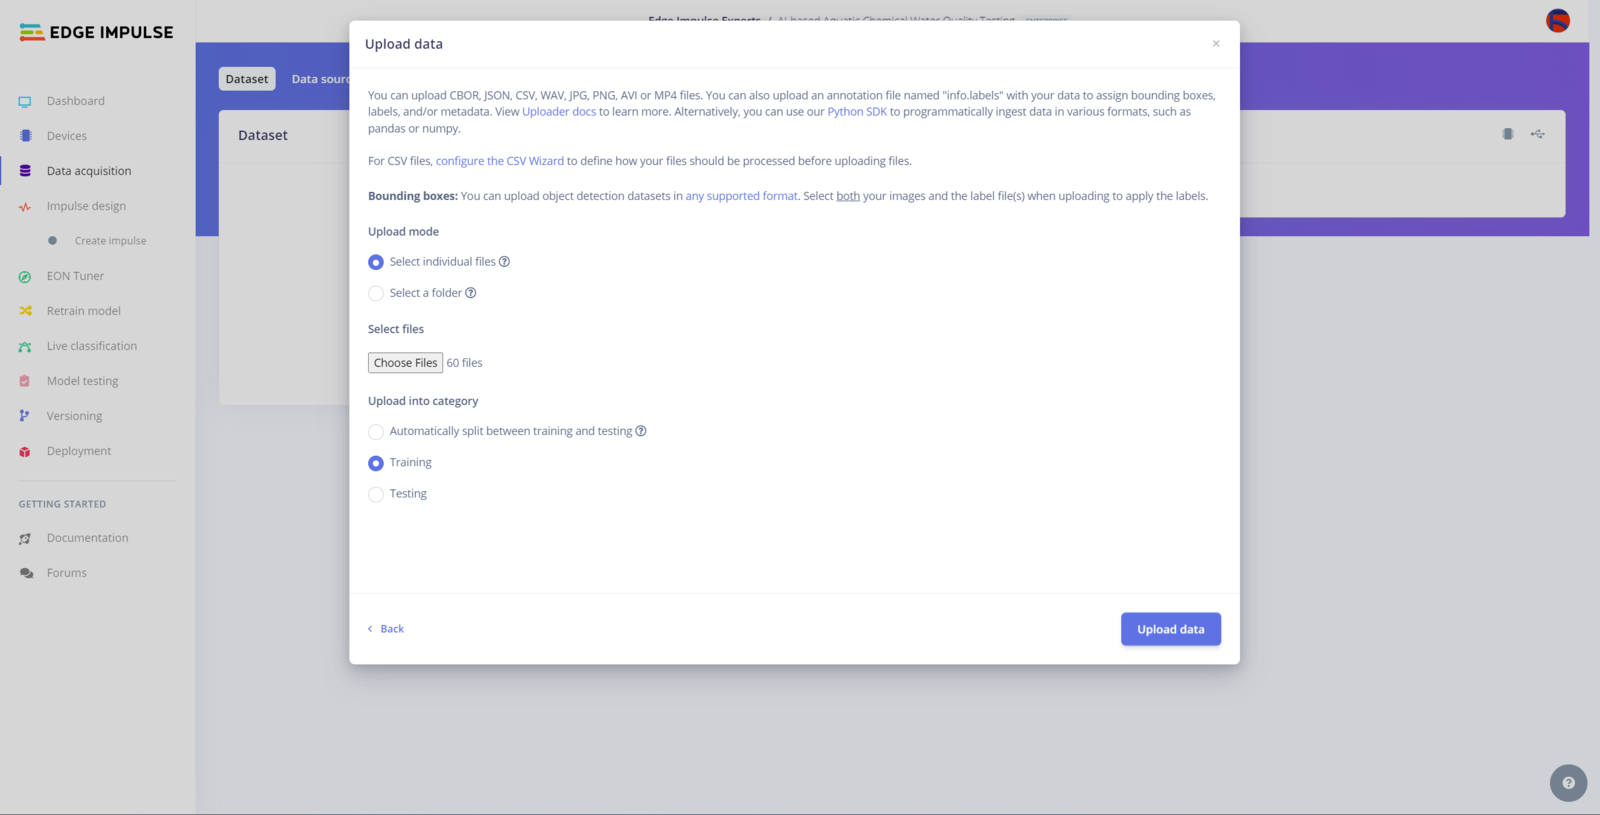
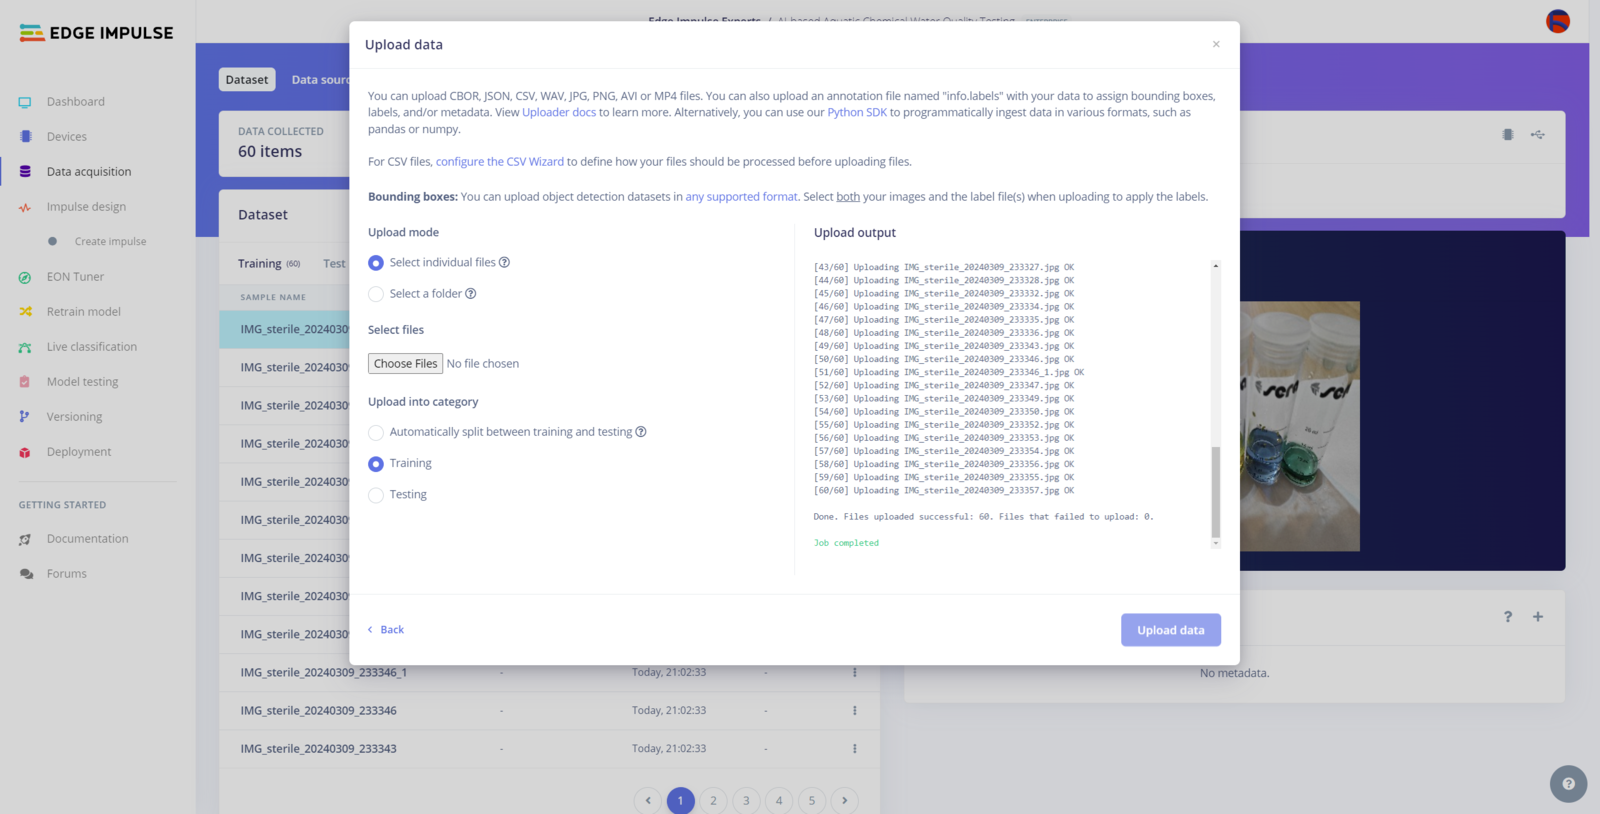
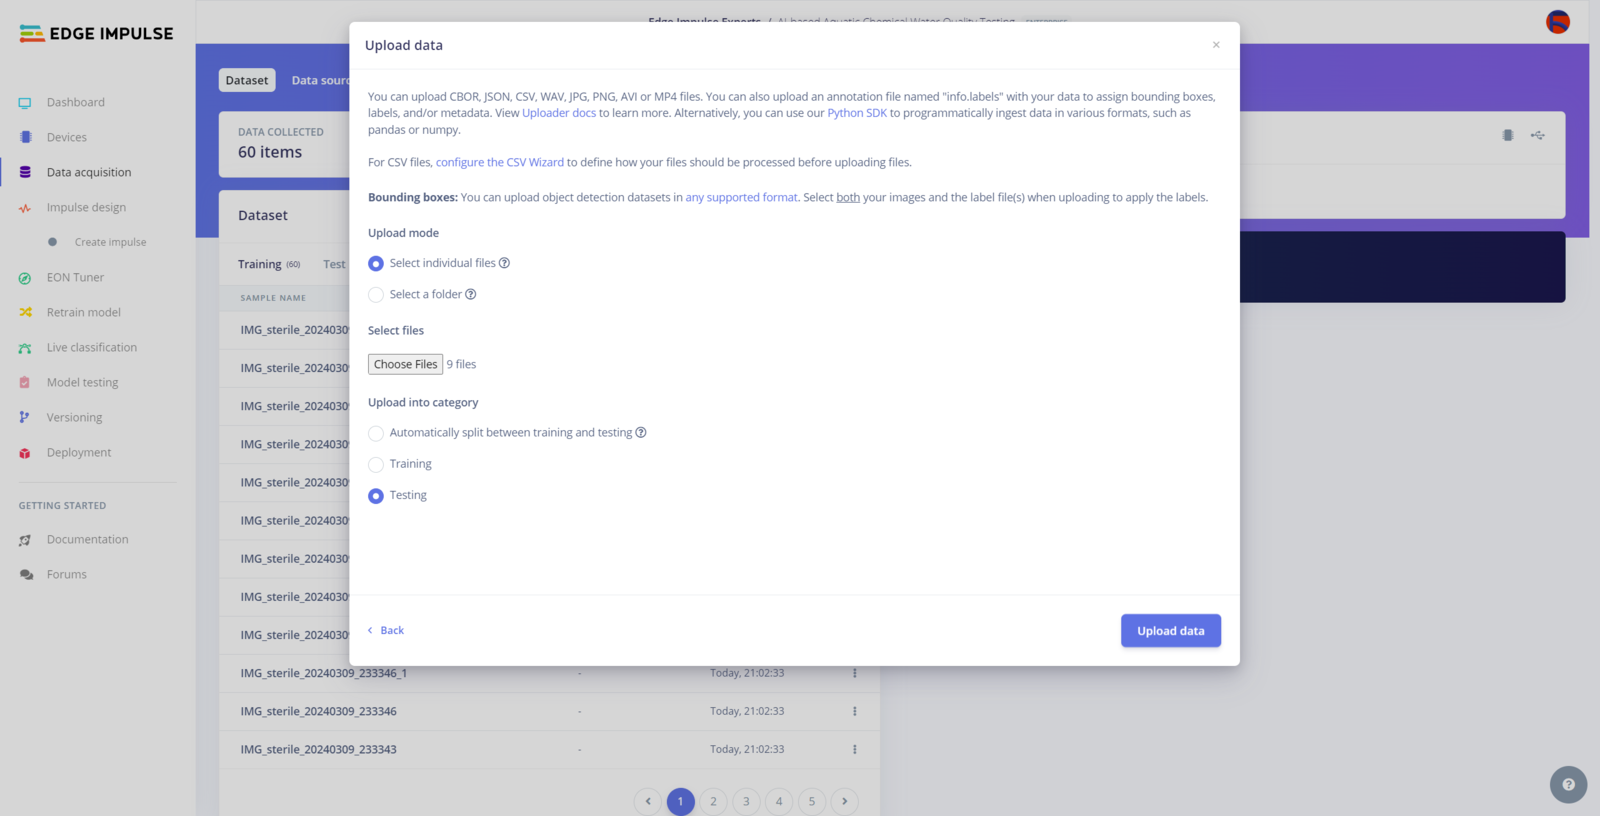
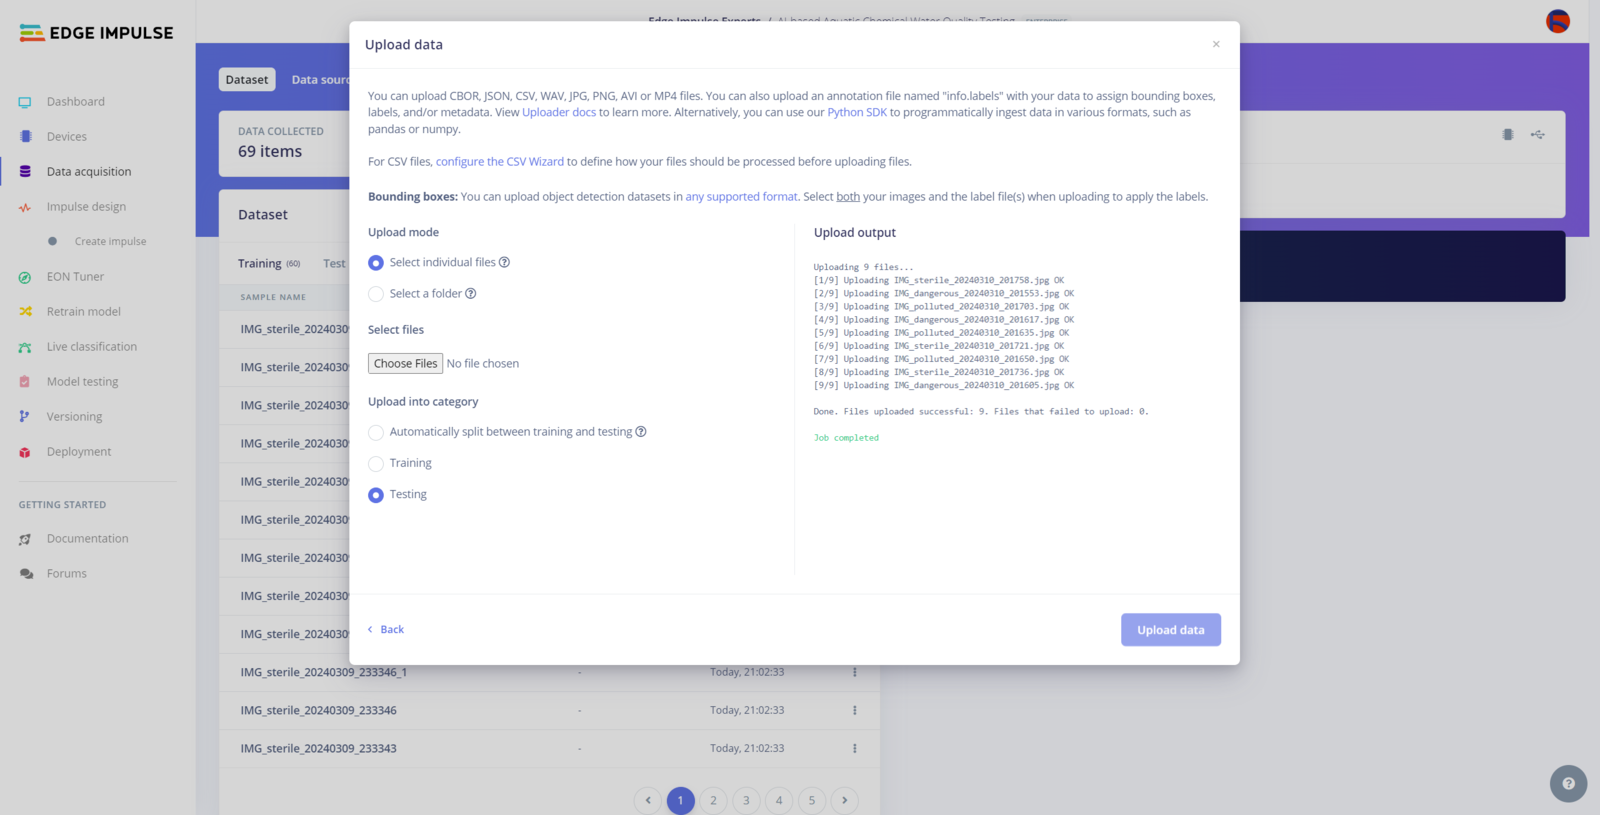
Step 10.1: Uploading and processing samples
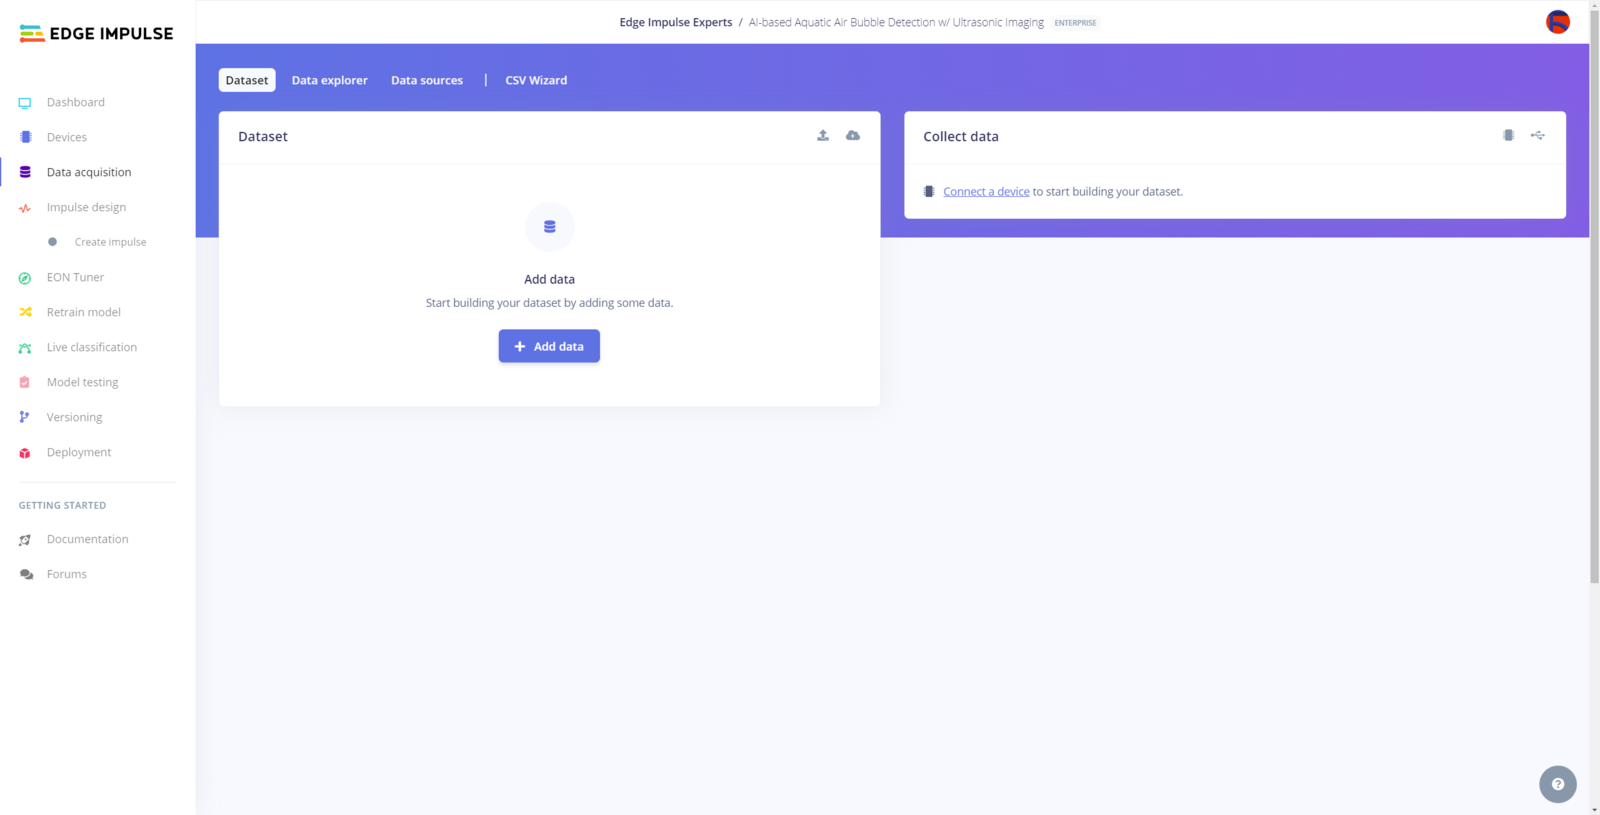
After generating training and testing samples successfully, I uploaded them to my project on Edge Impulse Enterprise. :hash: First of all, to utilize the incorporated tools for advanced AI applications, sign up for Edge Impulse Enterprise. :hash: Then, create a new project under your organization.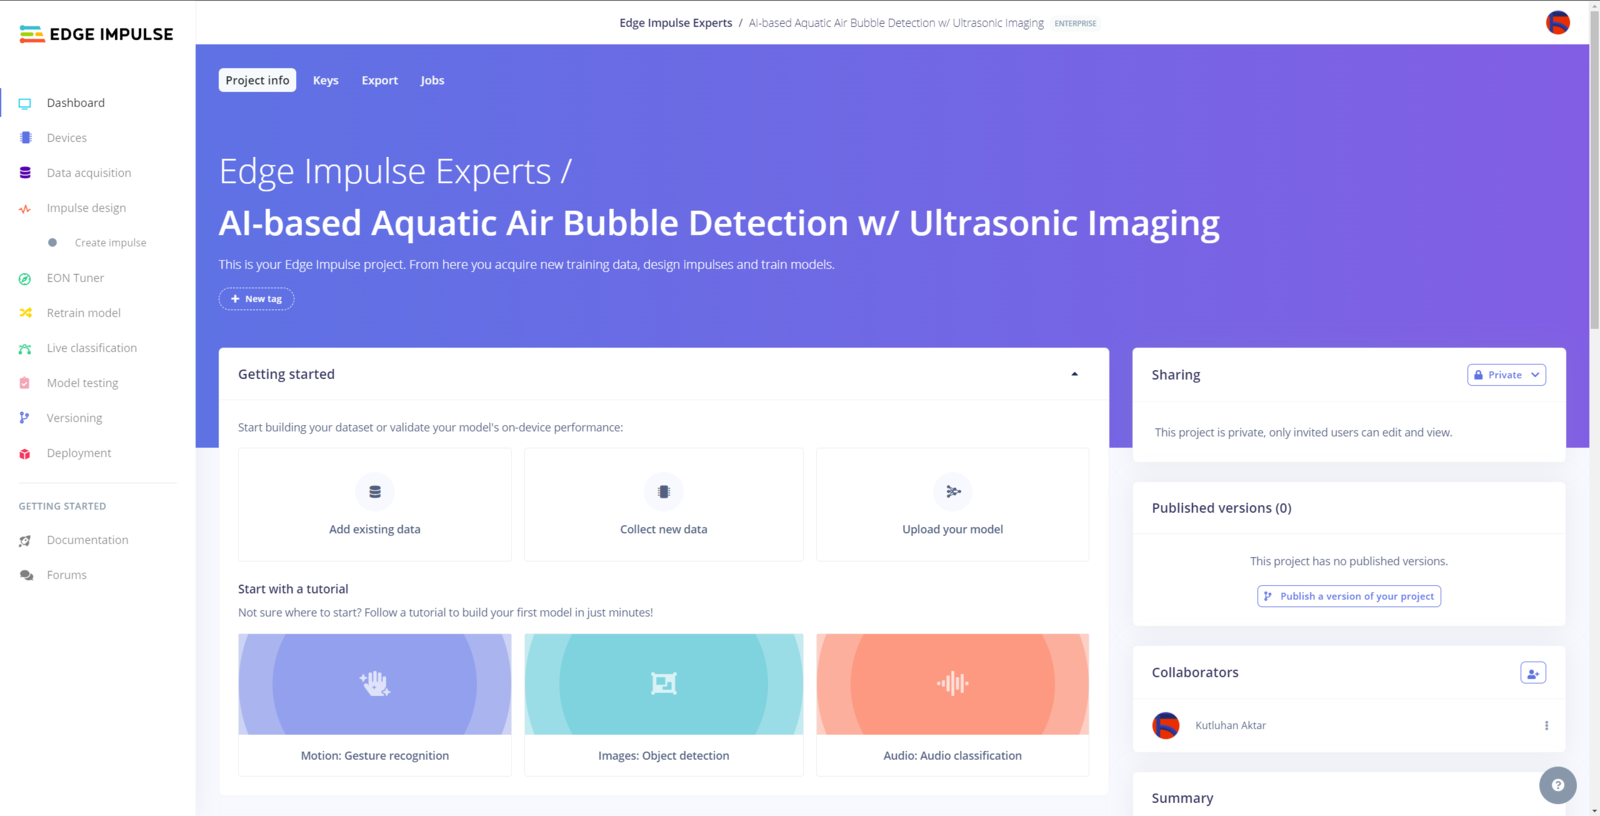


Step 10.2: Training the model on aquatic ultrasonic scan buffers
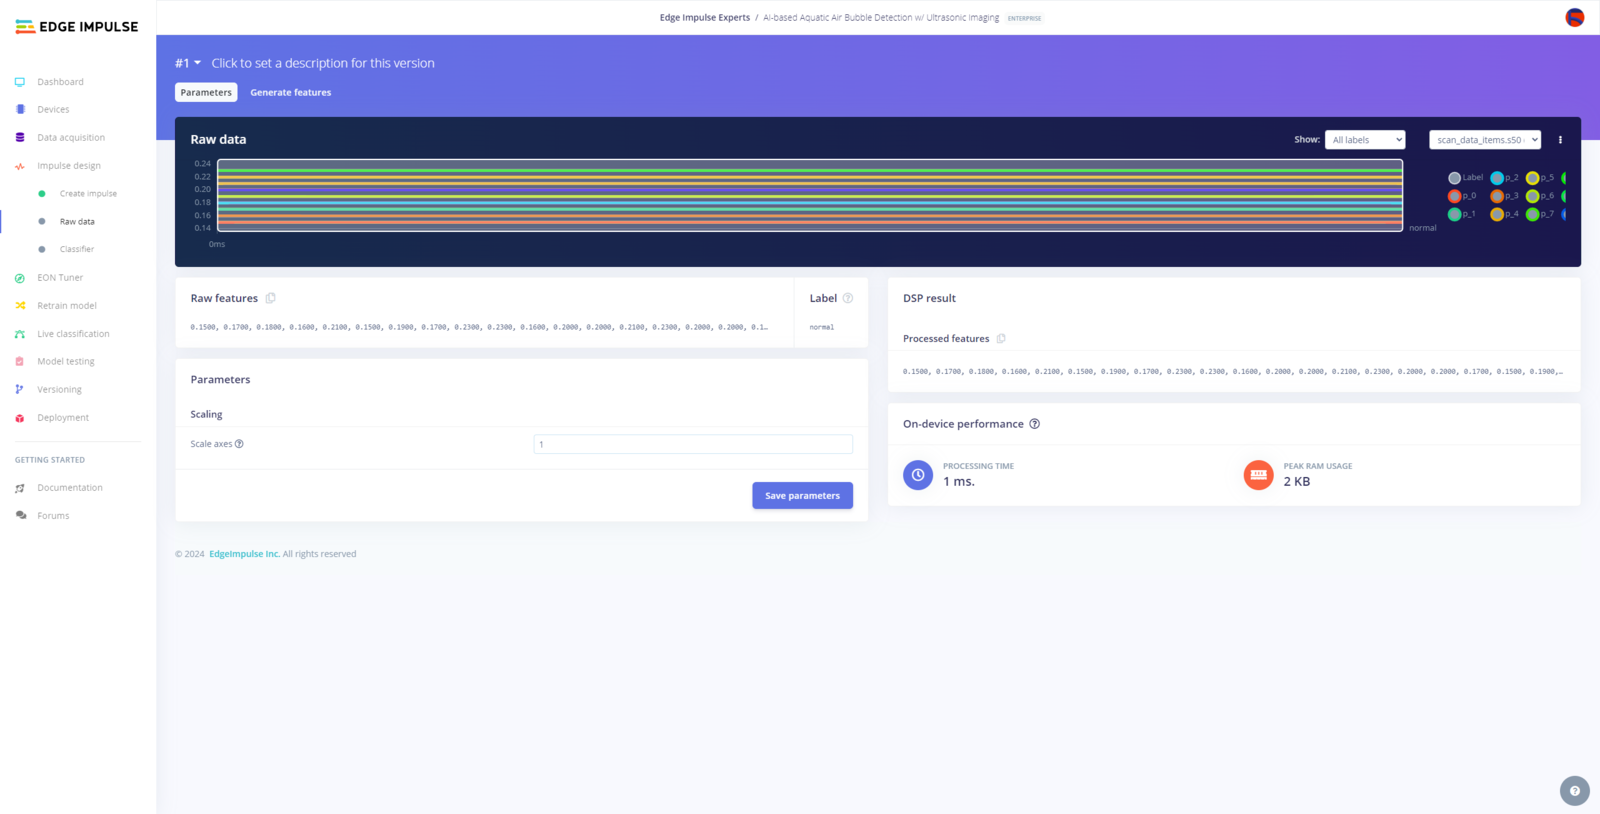
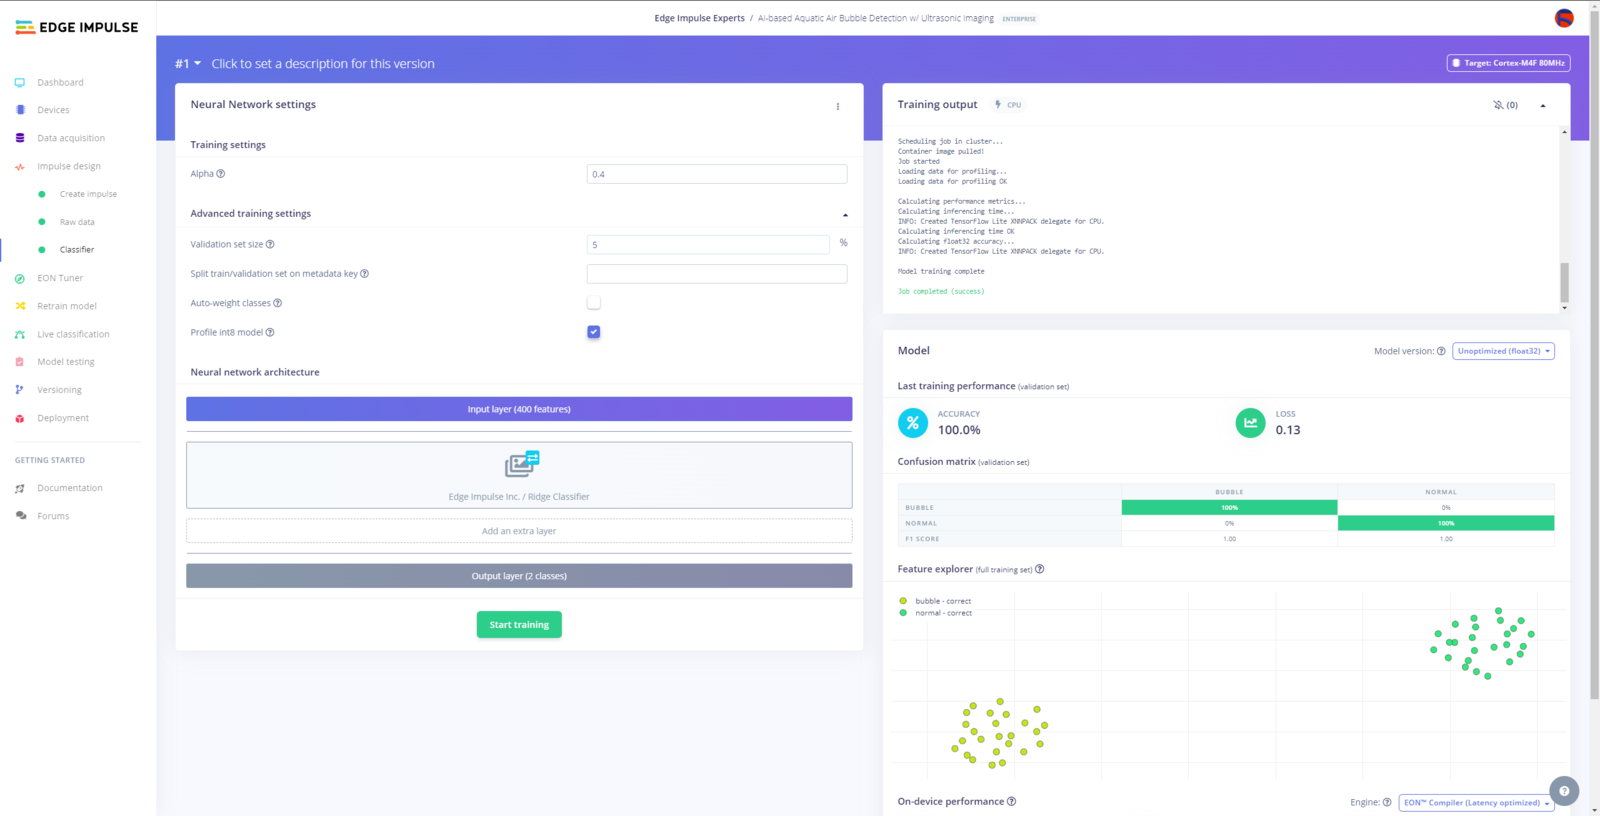
After uploading and labeling my training and testing samples successfully, I designed an impulse and trained the model to identify noxious underwater air bubbles. An impulse is a custom neural network model in Edge Impulse. I created my impulse by employing the Raw Data processing block and the Classification learning block. The Raw Data processing block generates windows from data samples without applying any specific signal processing procedures. The Classification learning block represents a Keras neural network model. This learning block lets the user change the model classifier, settings, architecture, and layers. :hash: After navigating to the Create impulse page, select the Raw Data processing block and the Classification learning block. Then, click Save Impulse.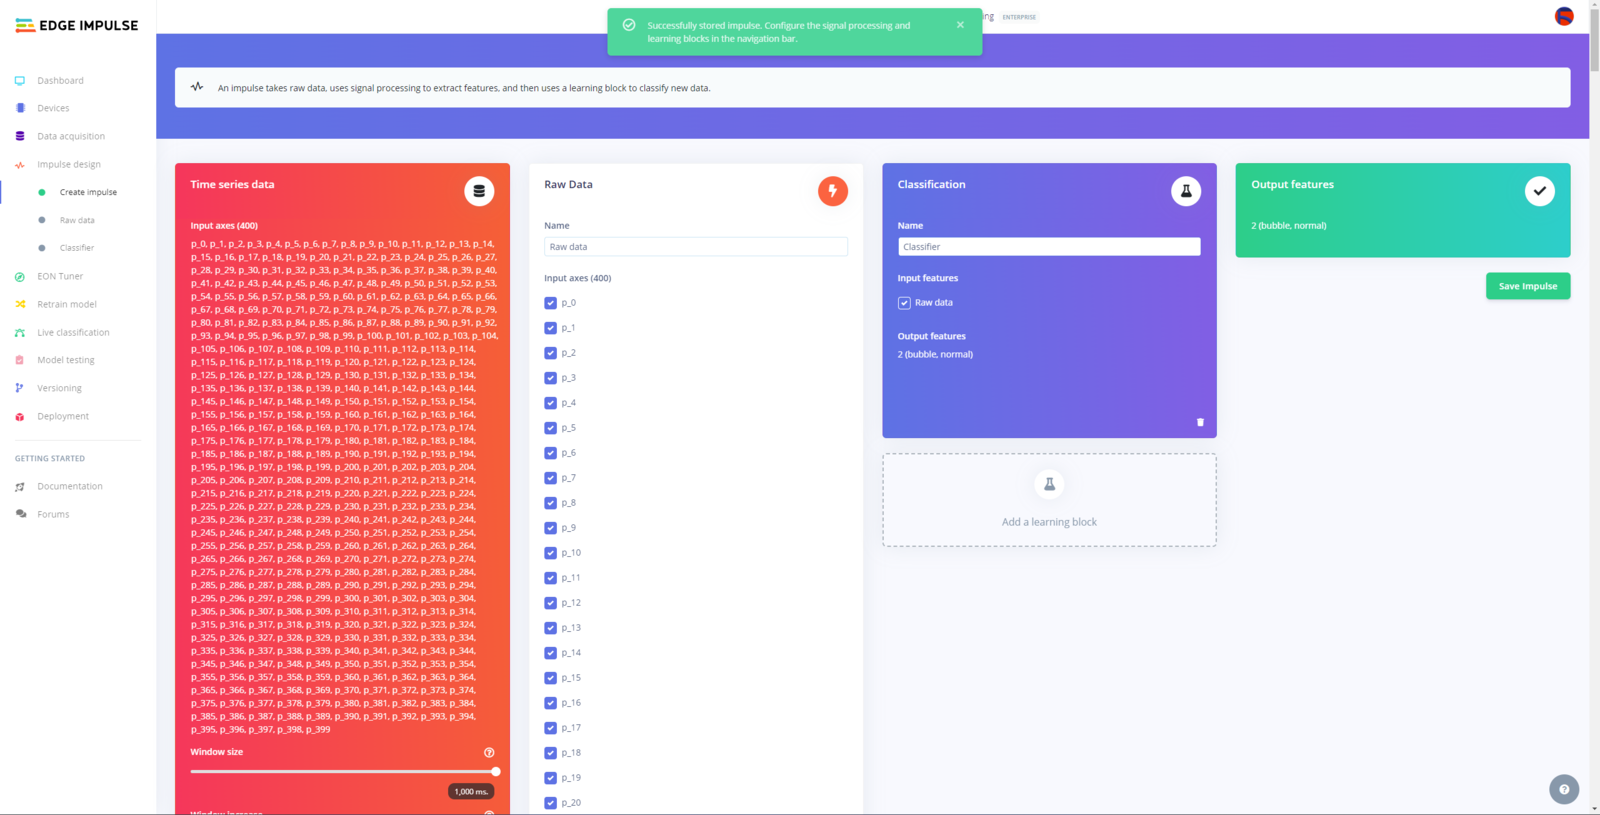
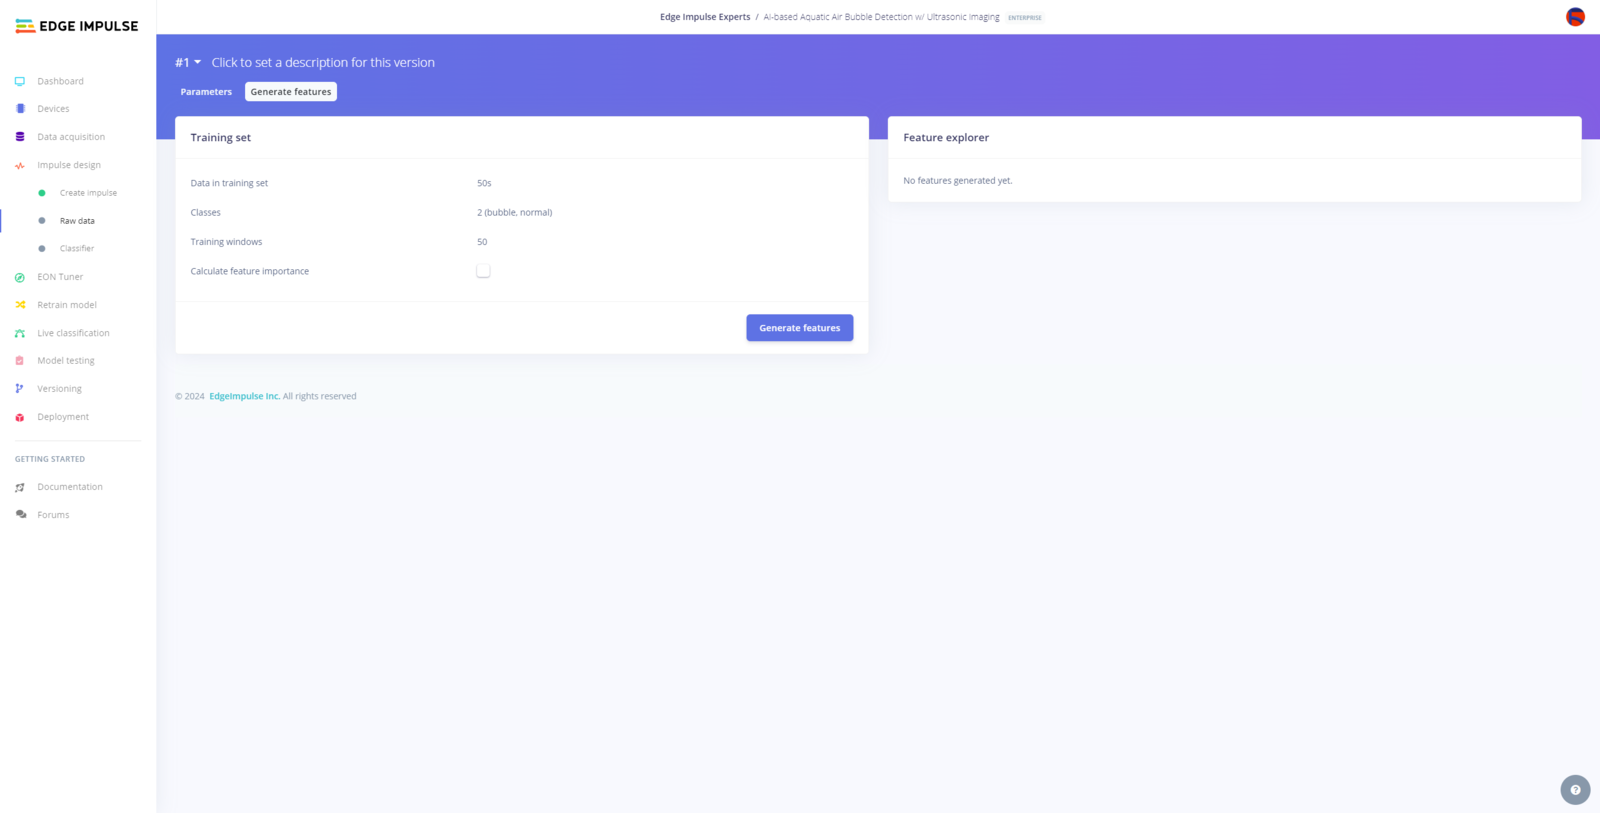
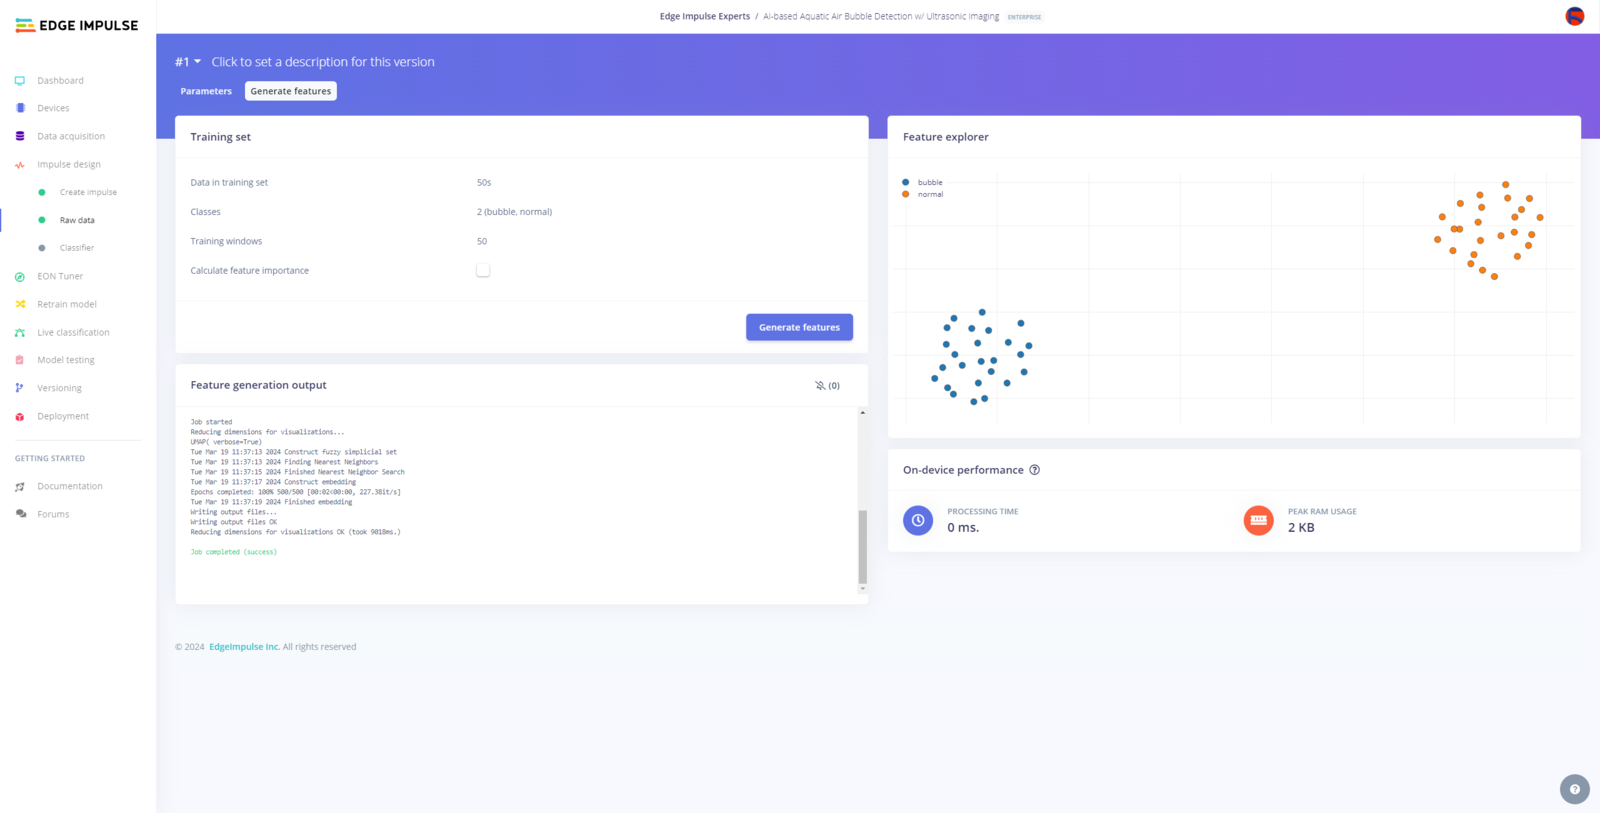
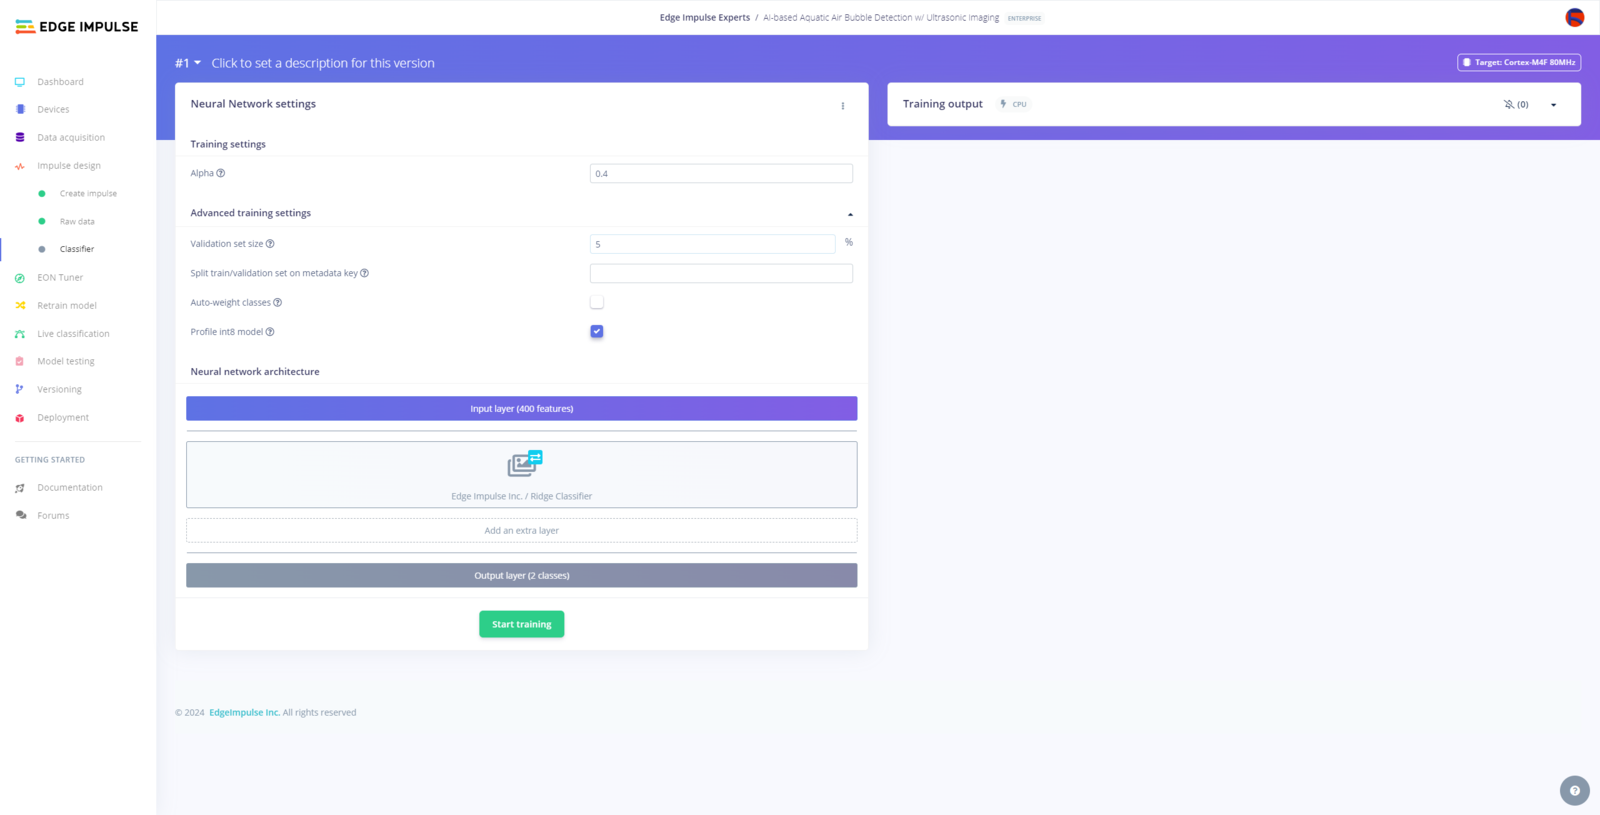
- Alpha ➡ 0.4
- Validation set size ➡ 5
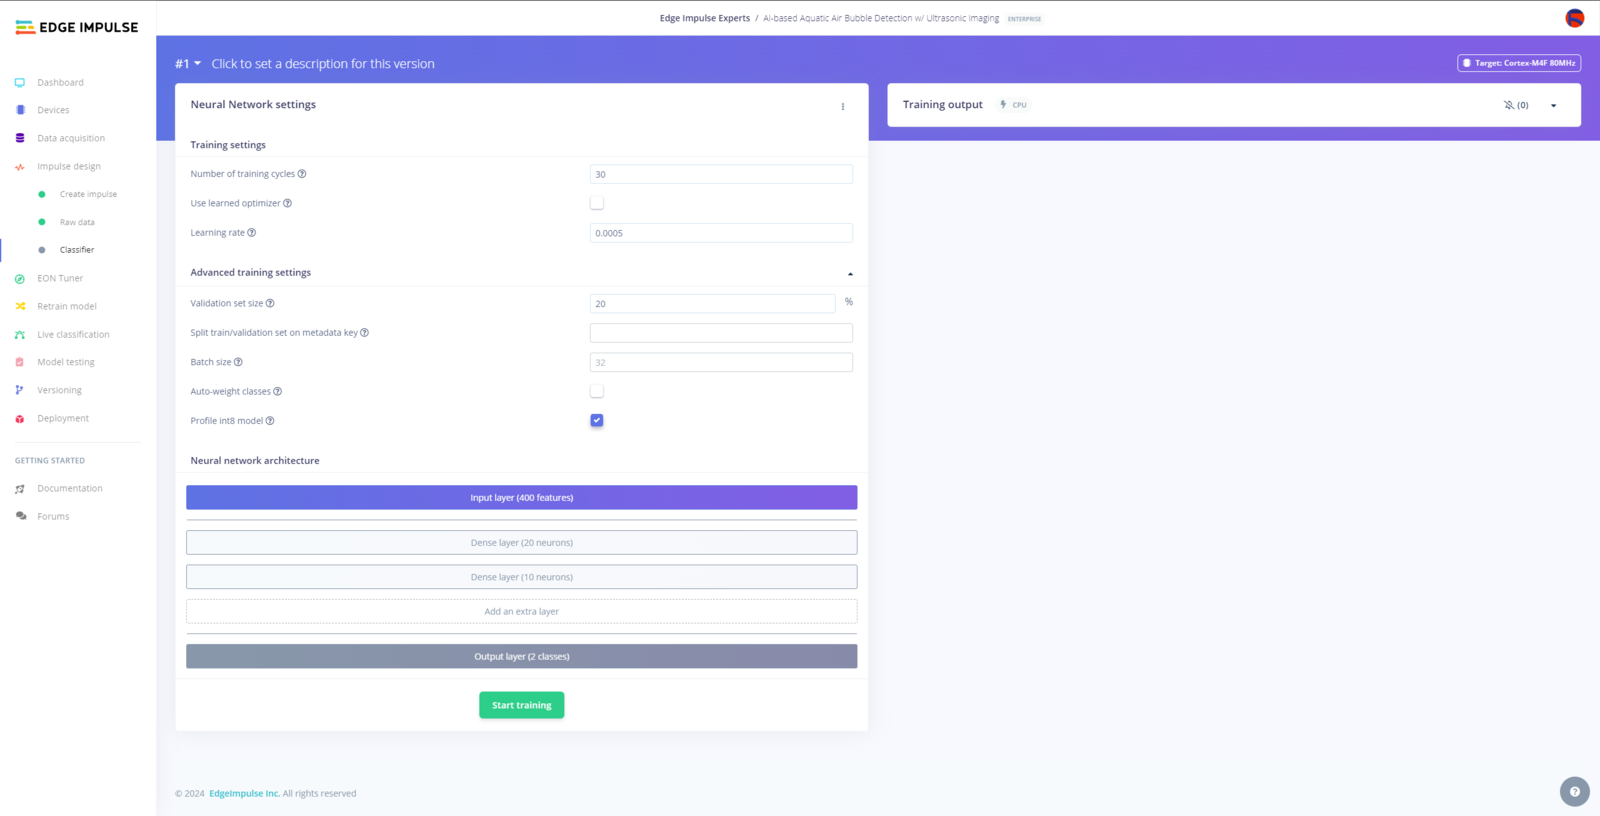
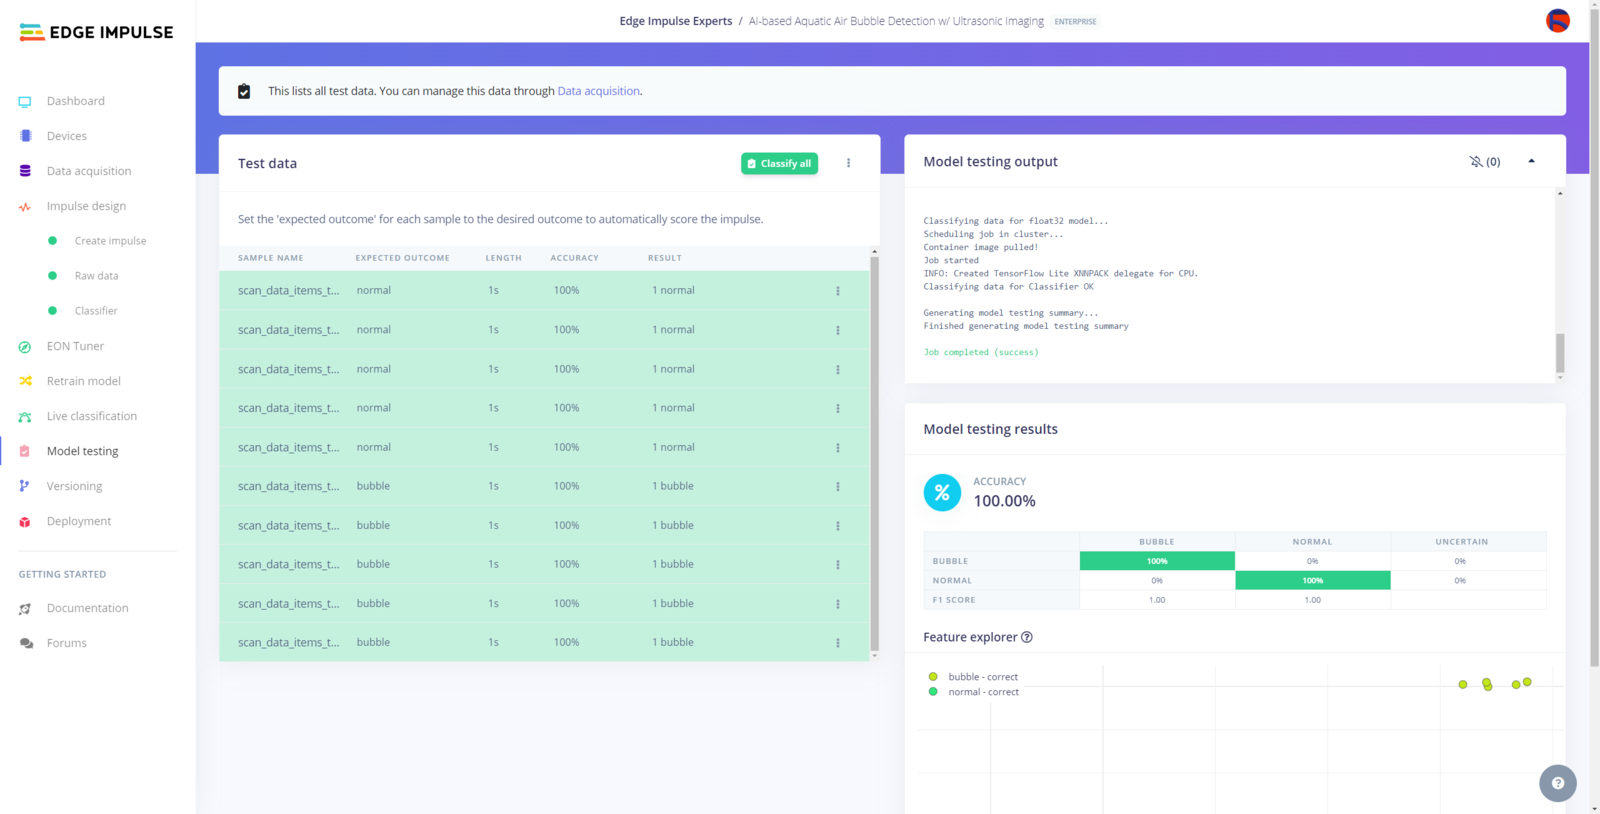
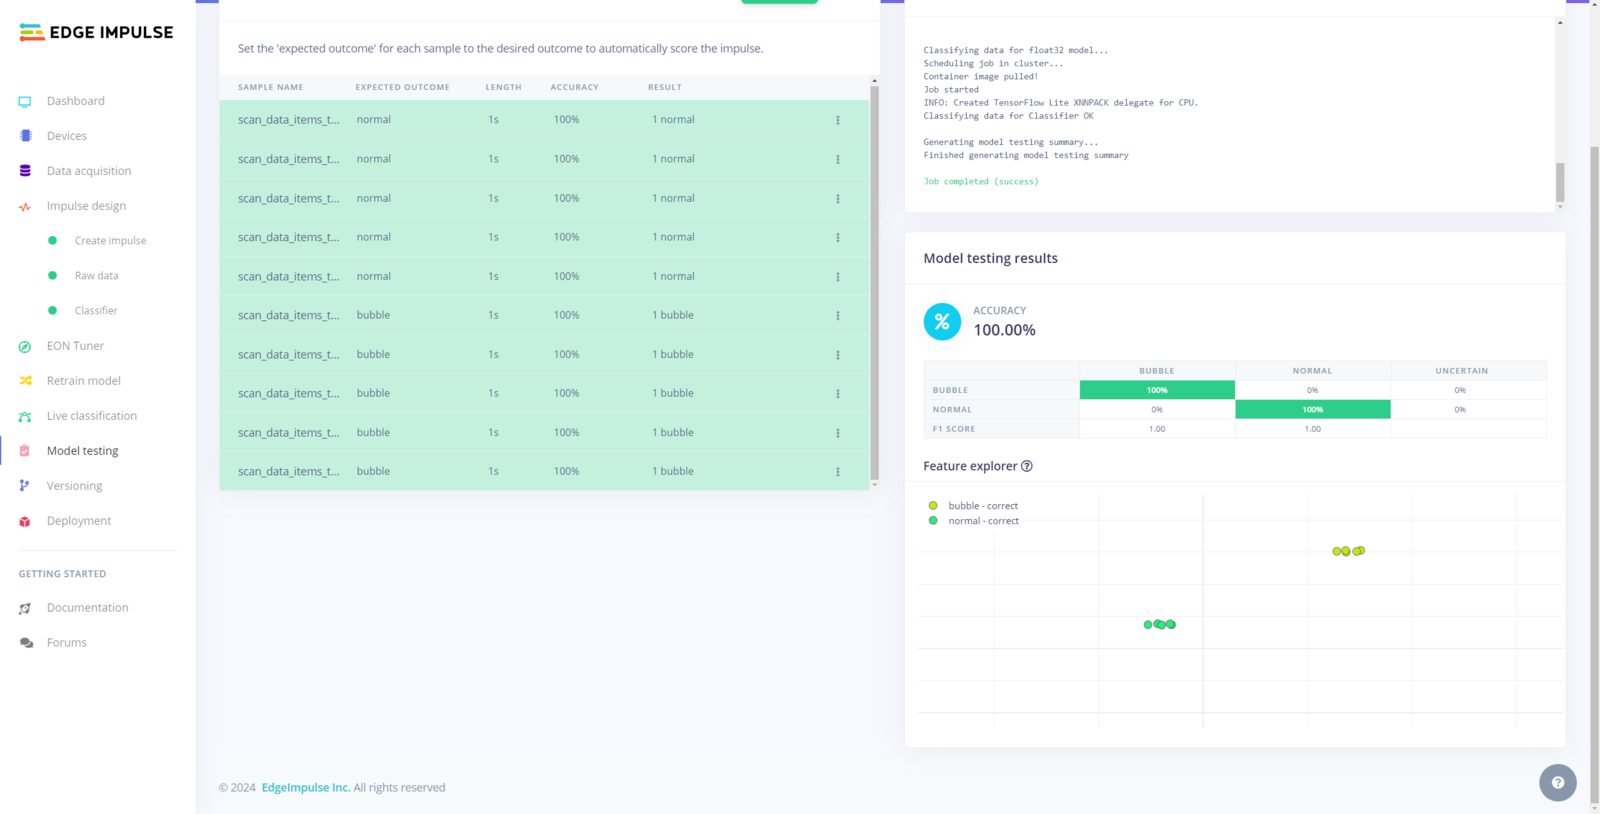
Step 10.3: Evaluating the model accuracy and deploying the model
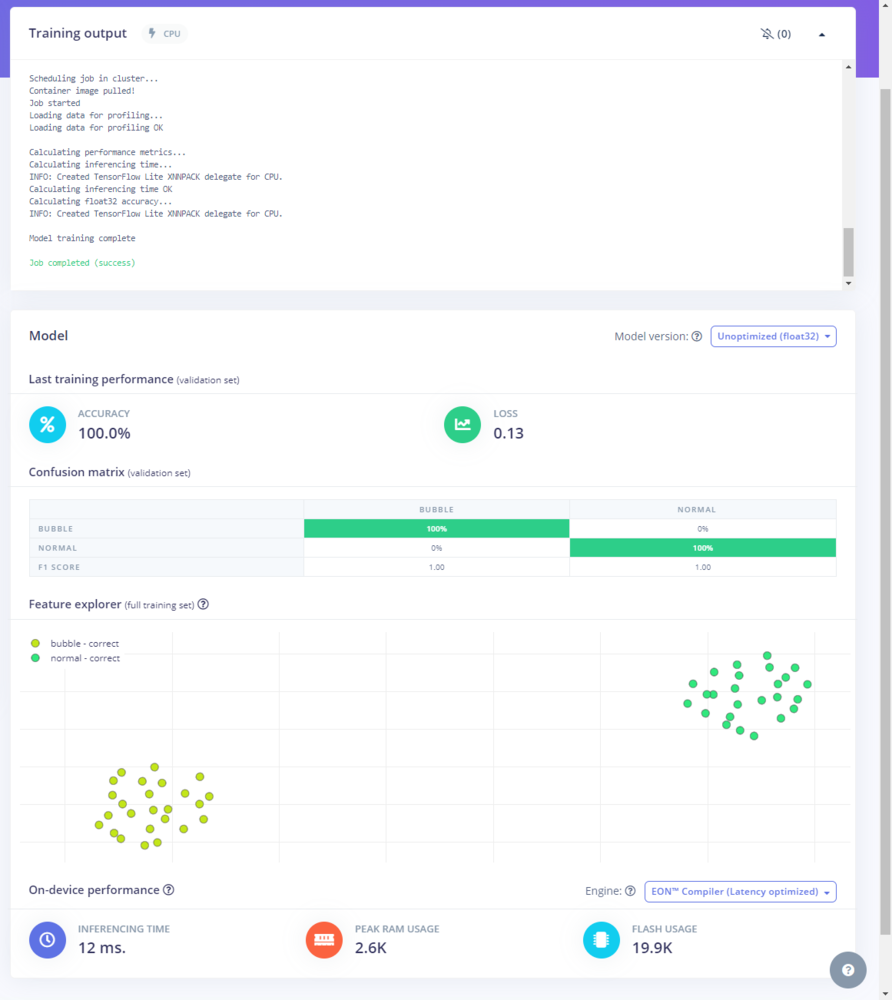
After building and training my neural network model with the Ridge classifier, I tested its accuracy and validity by utilizing testing samples. The evaluated accuracy of the model is 100%. :hash: To validate the trained model, go to the Model testing page and click Classify all.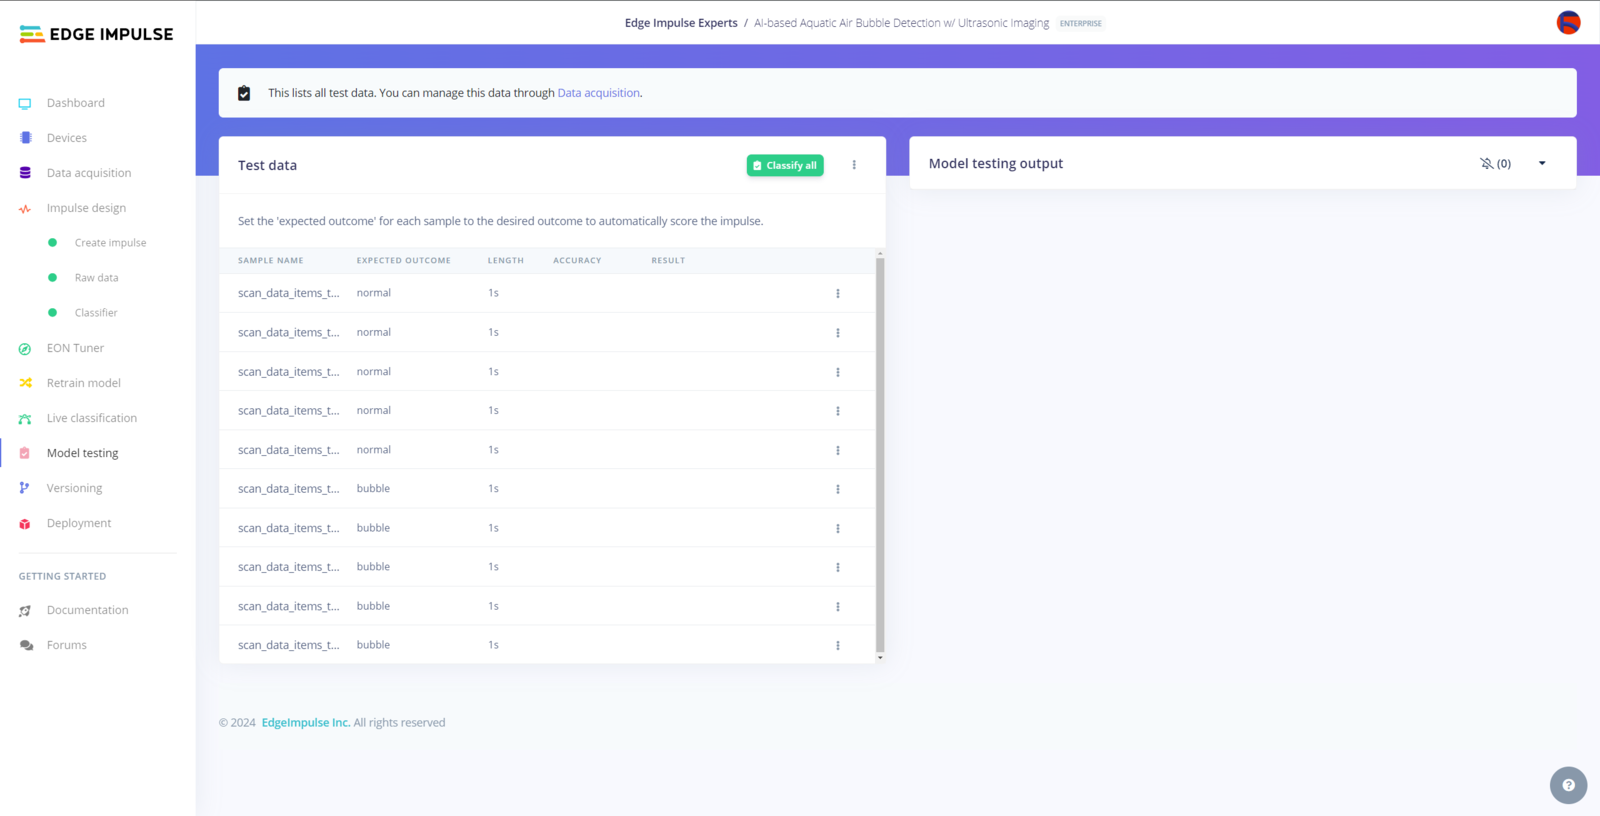
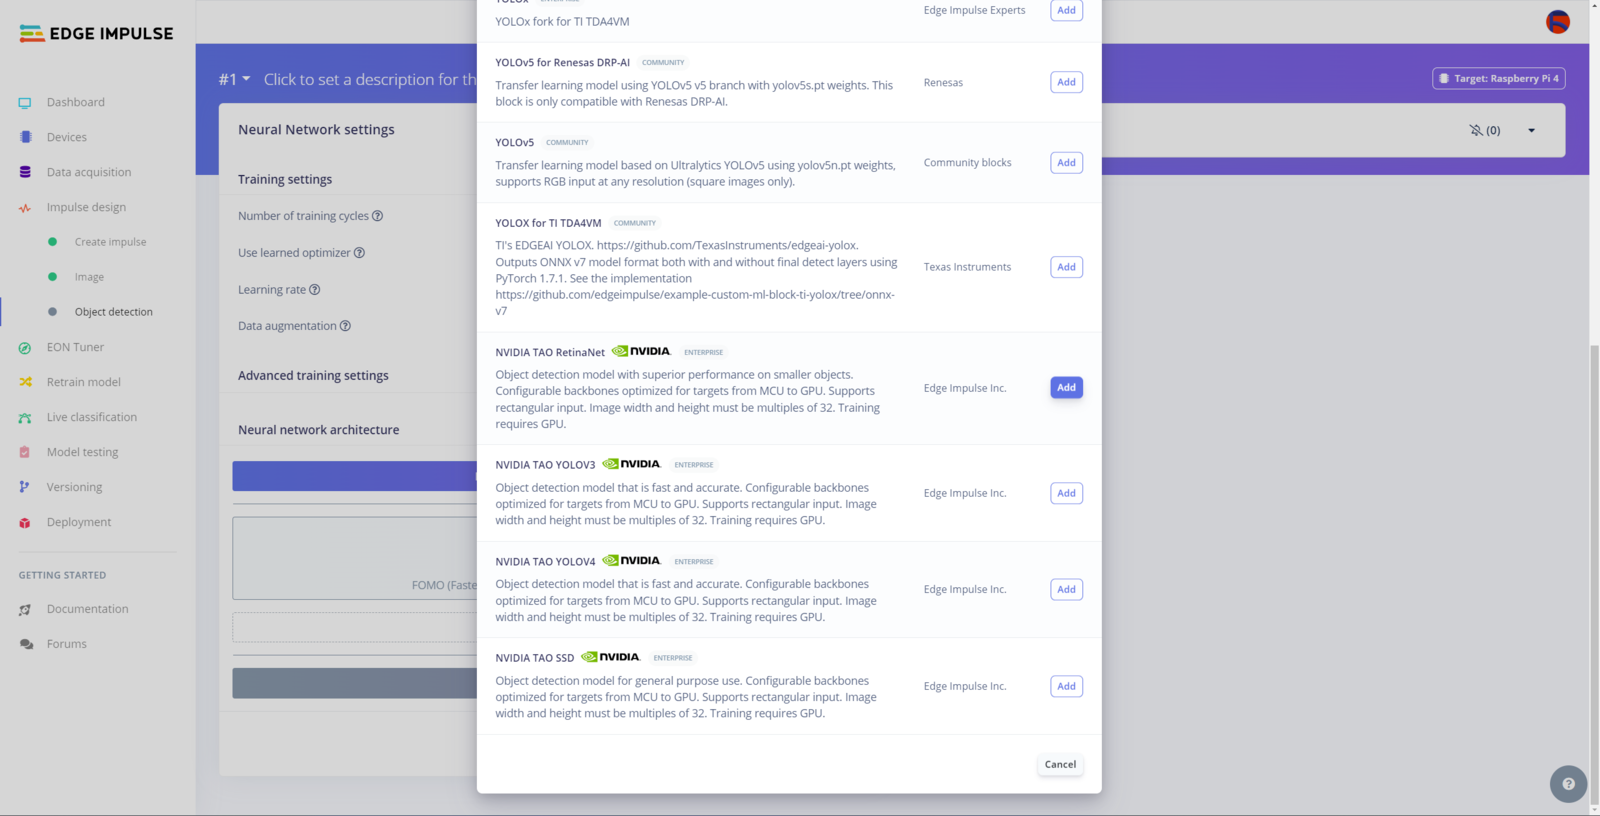
Step 11: Building an object detection (NVIDIA TAO RetinaNet) model w/ Edge Impulse Enterprise
When I completed capturing images of chemical water quality test results (color-coded) representing the most common indicators of water contamination in a retail fish farm and storing the captured samples on UNIHIKER, I started to work on my object detection (RetinaNet) model to assess water pollution levels. Since Edge Impulse provides developer-friendly tools for advanced edge AI applications and supports almost every development board due to its model deployment options, I decided to utilize Edge Impulse Enterprise to build my object detection model. Also, Edge Impulse Enterprise incorporates elaborate model architectures for advanced computer vision applications and optimizes the state-of-the-art vision models for edge devices such as UNIHIKER. Since assessing water pollution levels based on the applied chemical water quality tests (color-coded) is a complex computer vision task, I decided to employ an enhanced vision model architecture. After conducting experiments with the advanced algorithms supported by Edge Impulse Enterprise, I decided to utilize RetinaNet from the NVIDIA TAO Toolkit. NVIDIA TAO Toolkit is a low-code AI toolkit built on TensorFlow and PyTorch, which simplifies the model training process and lets developers select one of 100+ pre-trained vision AI models with customization options. TAO provides an extensive selection of pre-trained models, either trained on public datasets or proprietary datasets for task-specific use cases. Since Edge Impulse Enterprise incorporates production-tested NVIDIA TAO vision models and provides configurable backbones (MobileNetV2, GoogLeNet, ResNet, etc.), fine-tuning RetinaNet to unique data sets and deploying optimized models for edge devices are efficient and user-friendly on Edge Impulse. Even though Edge Impulse supports JPG or PNG files to upload as samples directly, each target object in a training or testing sample needs to be labeled manually. Therefore, I needed to follow the steps below to format my data set so as to train my object detection model accurately:- Data Scaling (Resizing)
- Data Labeling
- sterile
- dangerous
- polluted
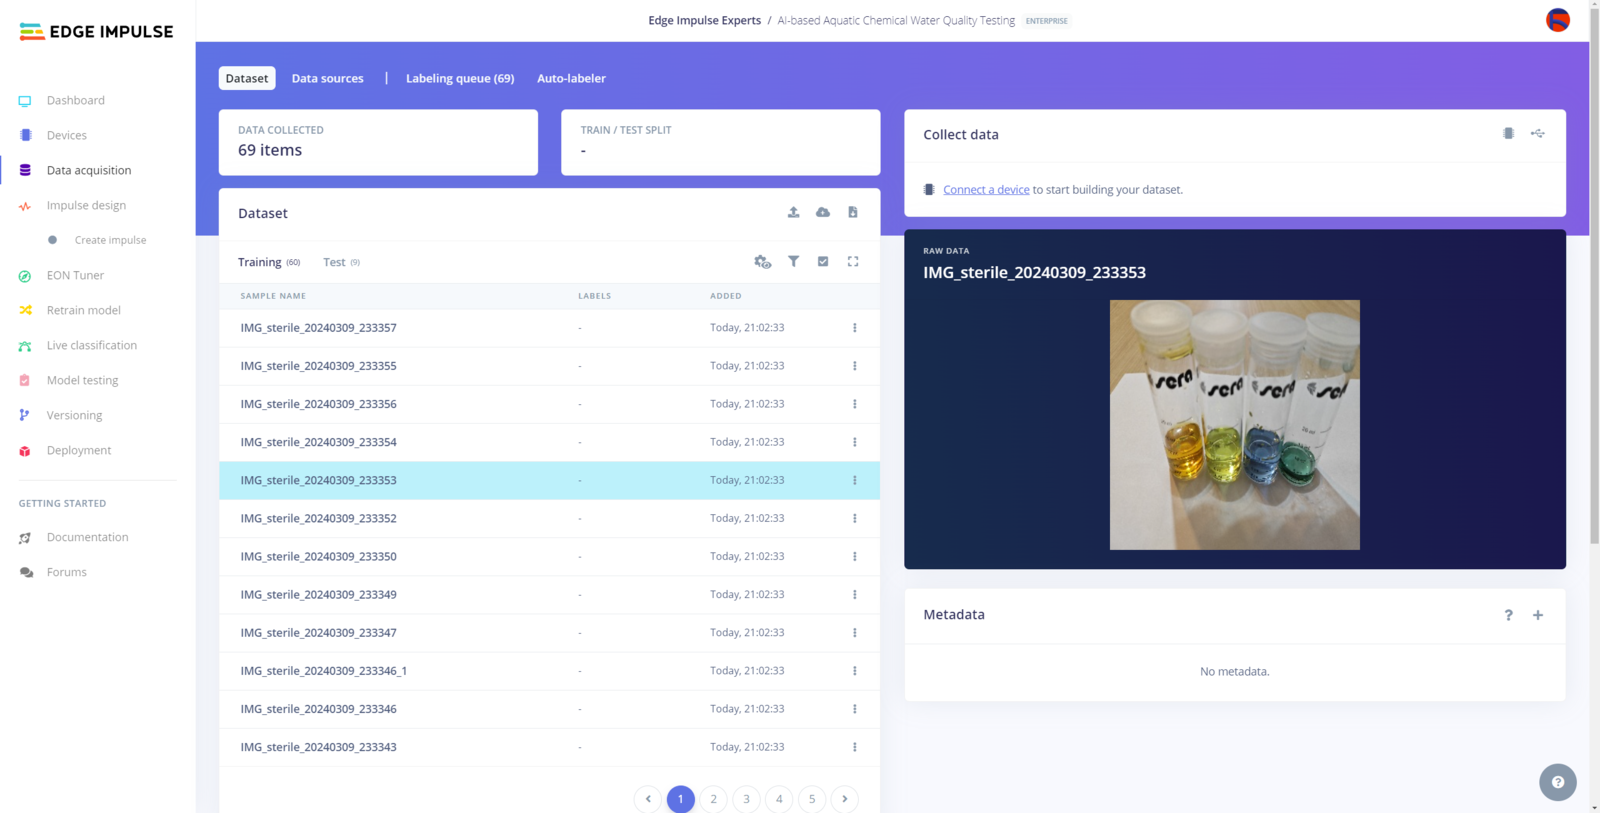
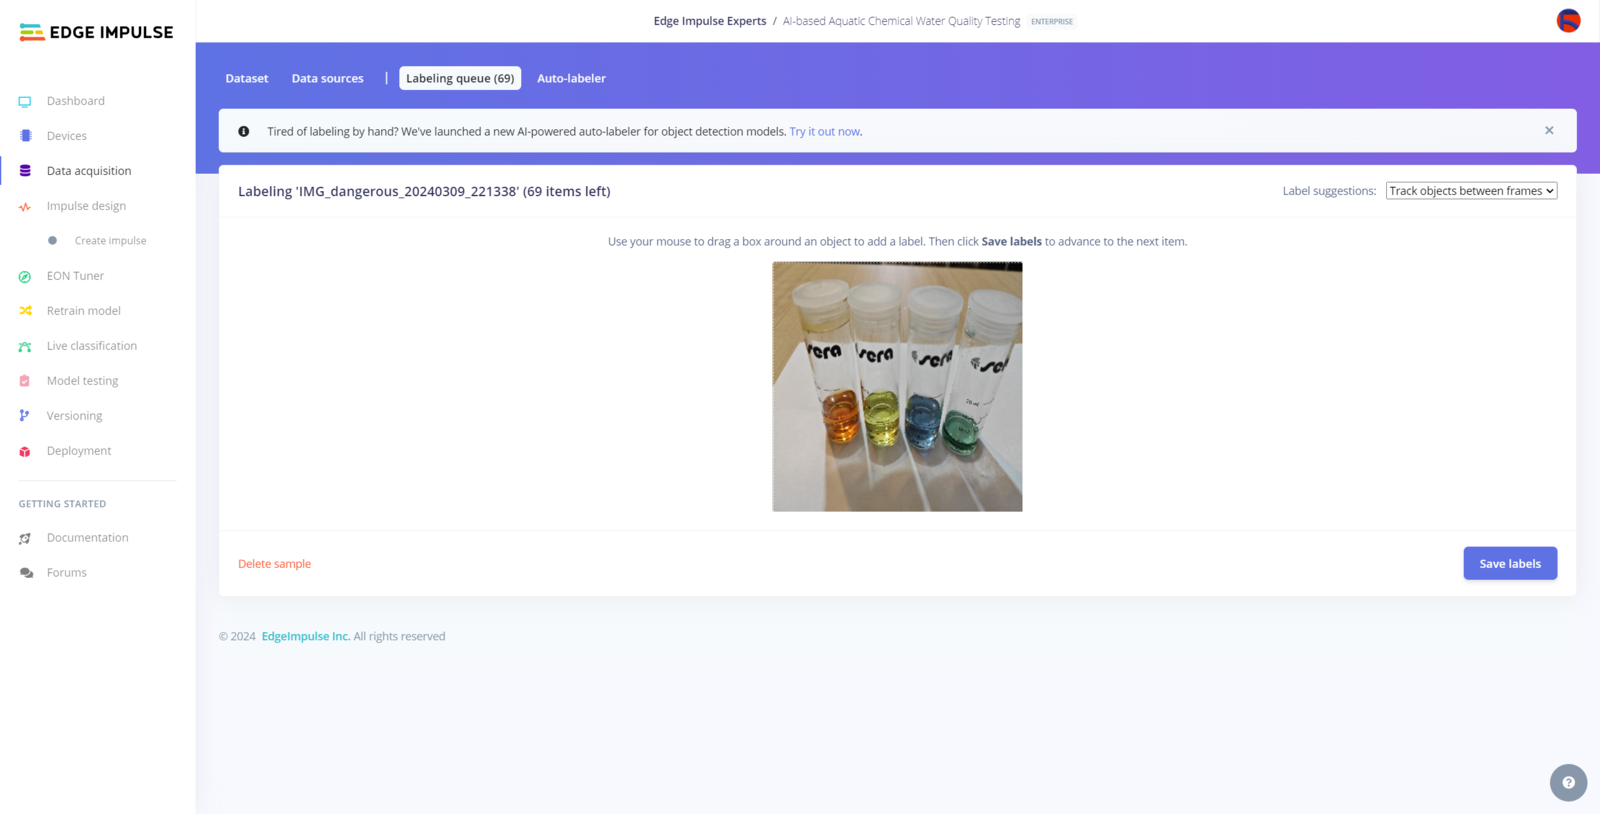
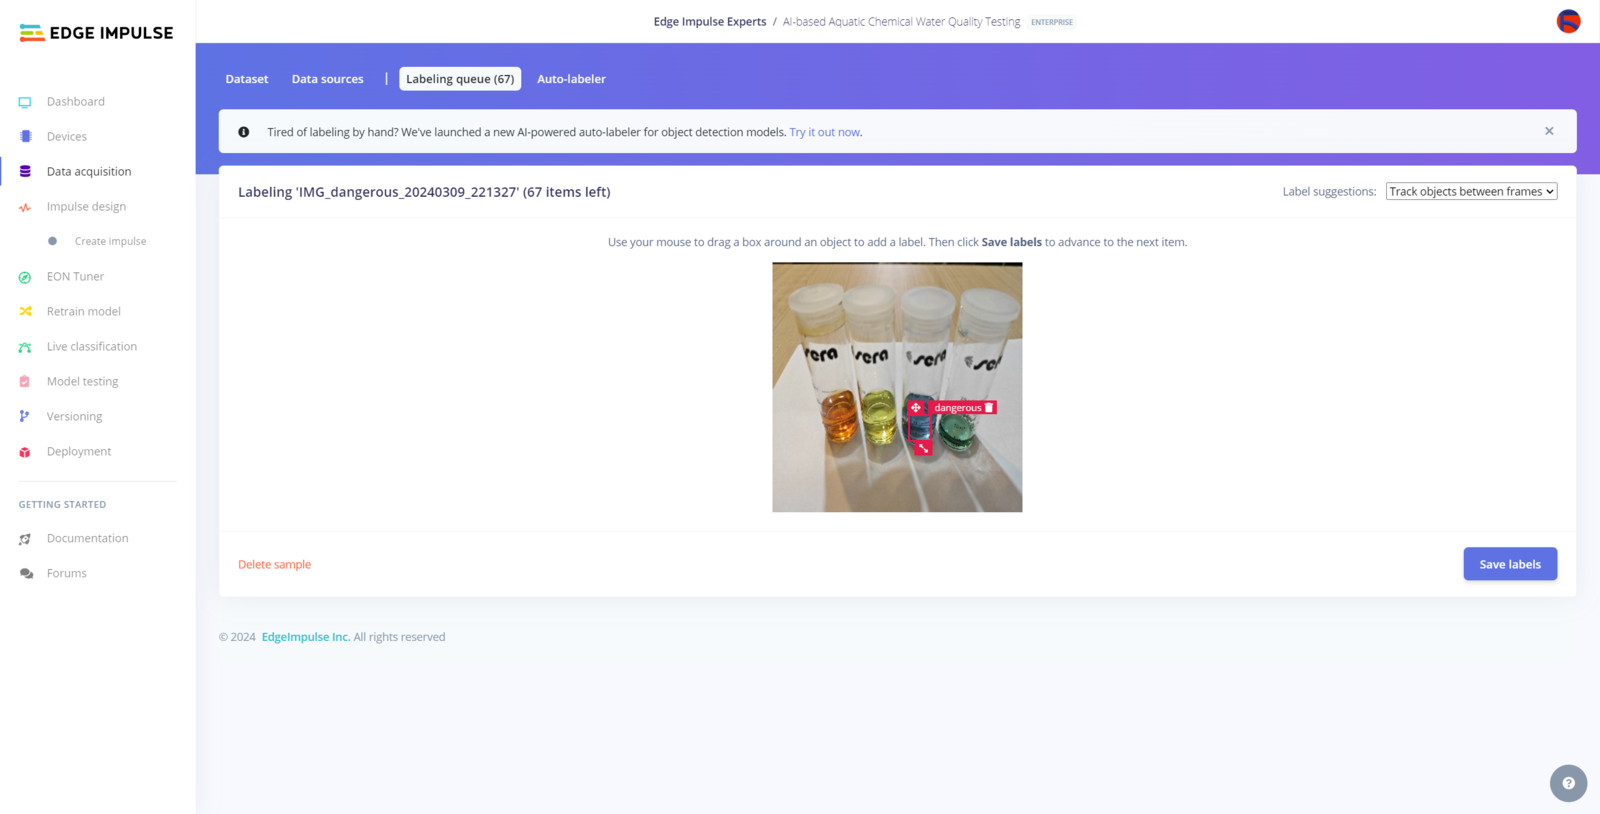
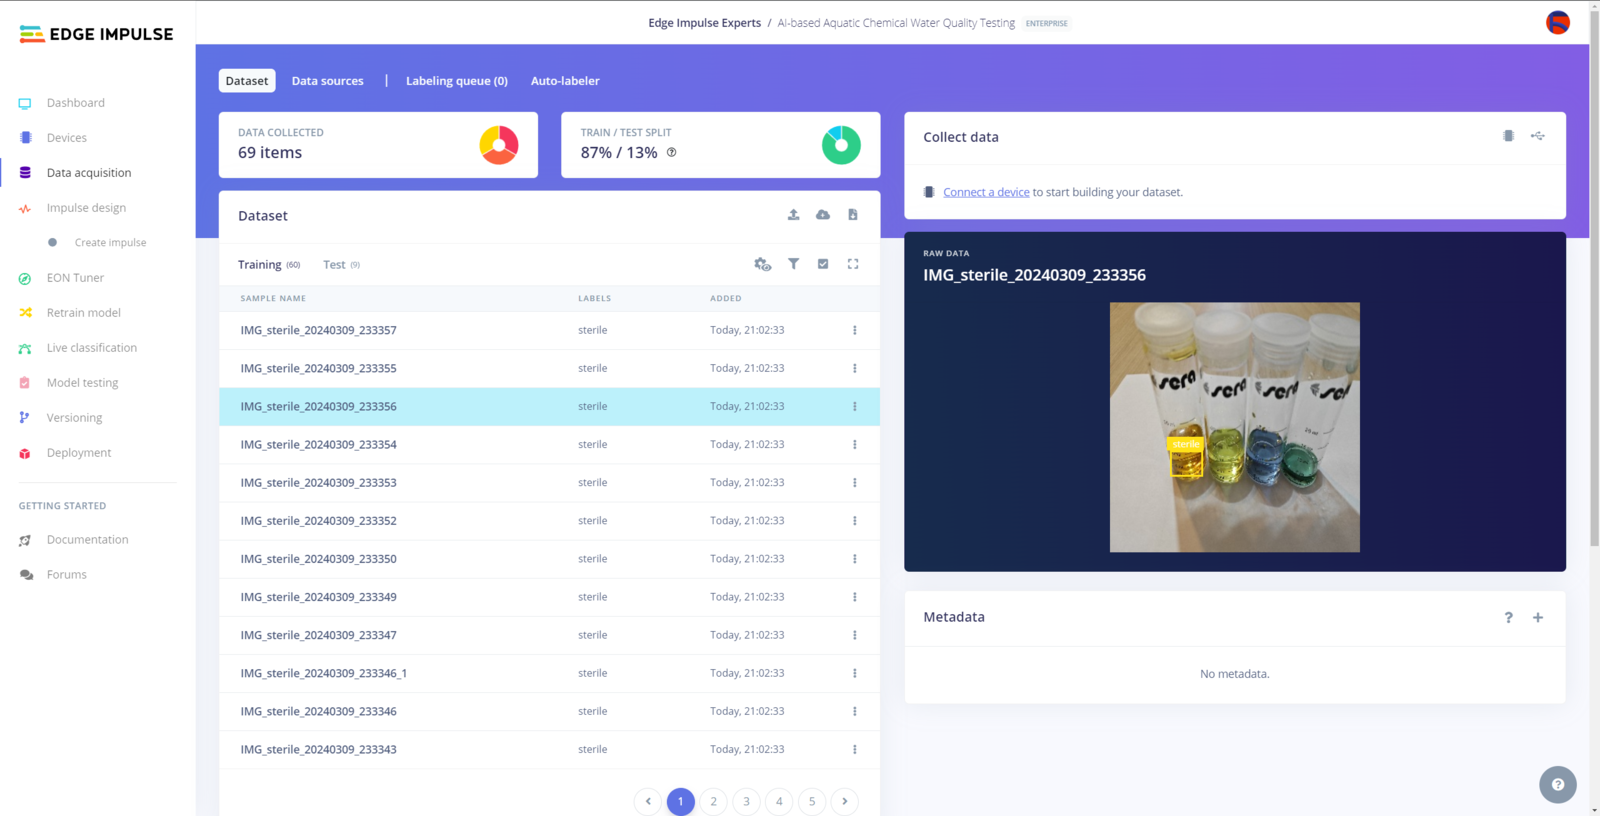
Step 11.1: Uploading images (samples) and labeling objects
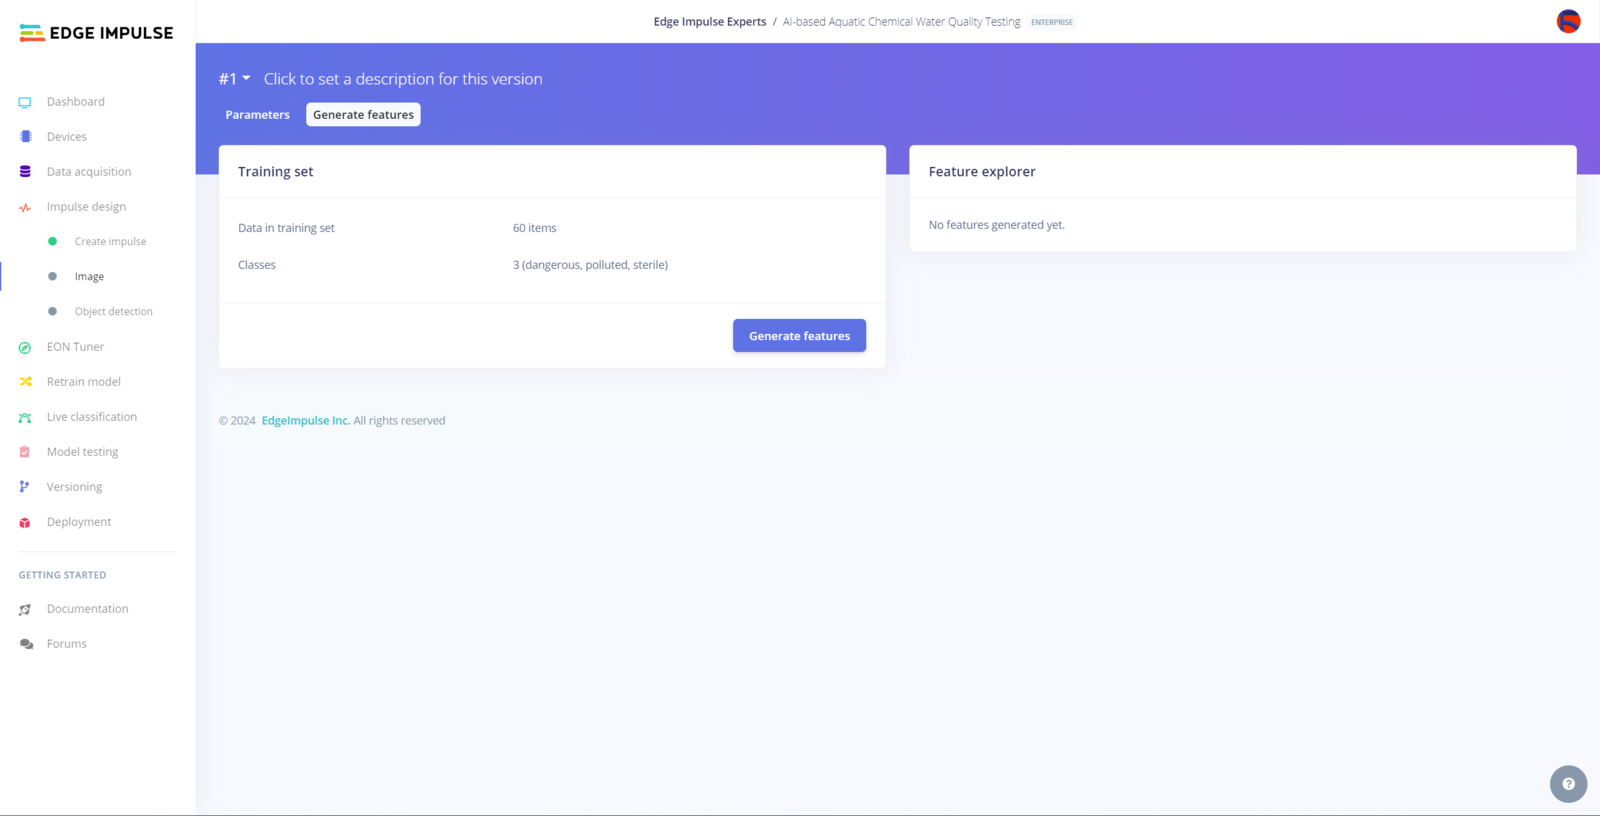
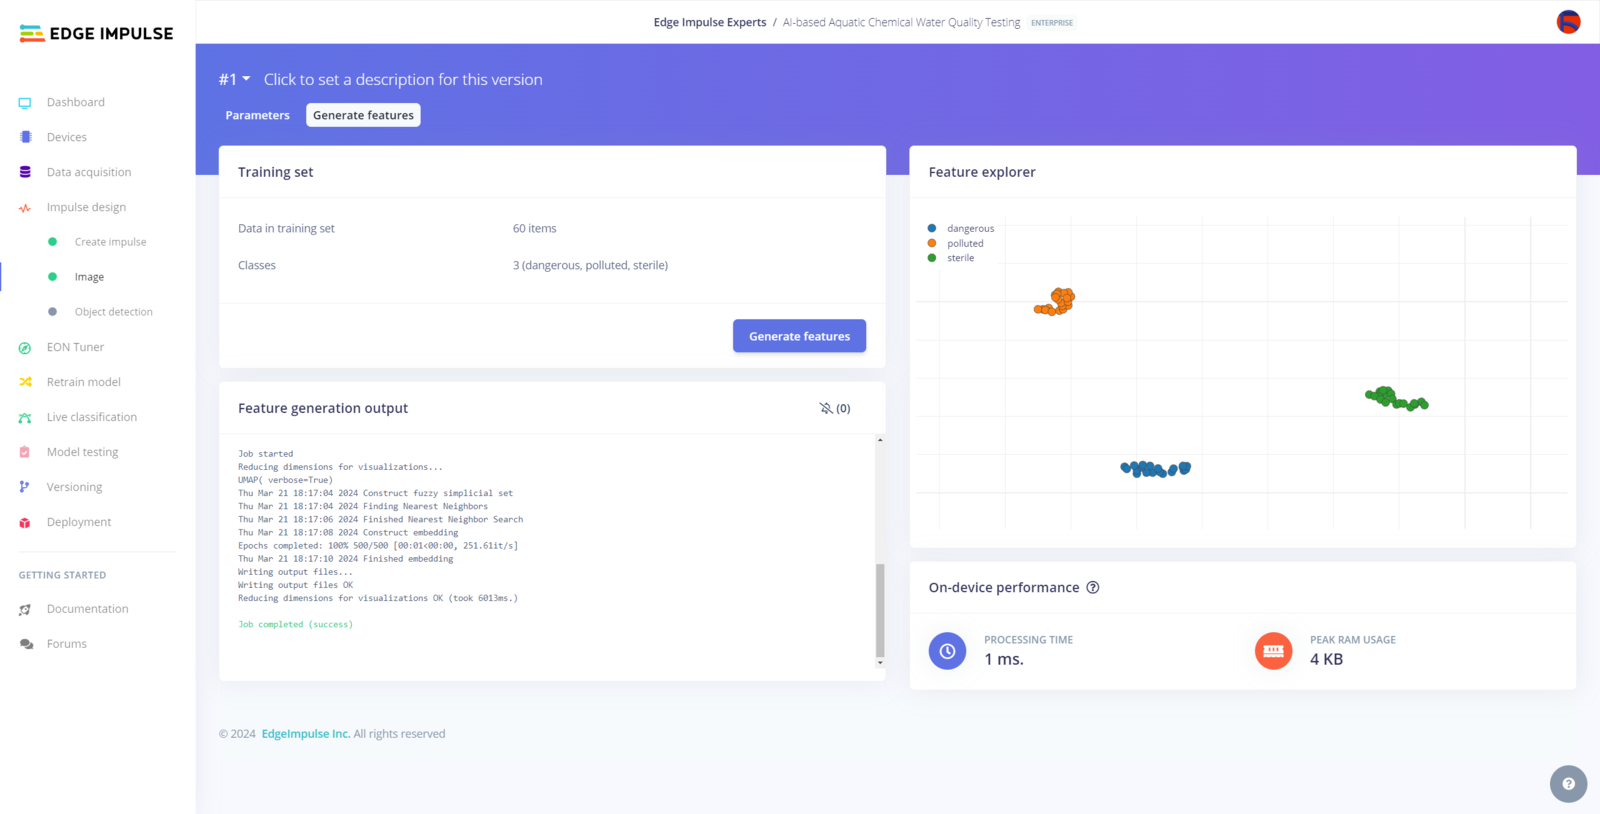
After collecting training and testing image samples, I uploaded them to my project on Edge Impulse. Then, I labeled each target object on the image samples. :hash: First of all, to utilize the incorporated tools for advanced AI applications, sign up for Edge Impulse Enterprise. :hash: Then, create a new project under your organization.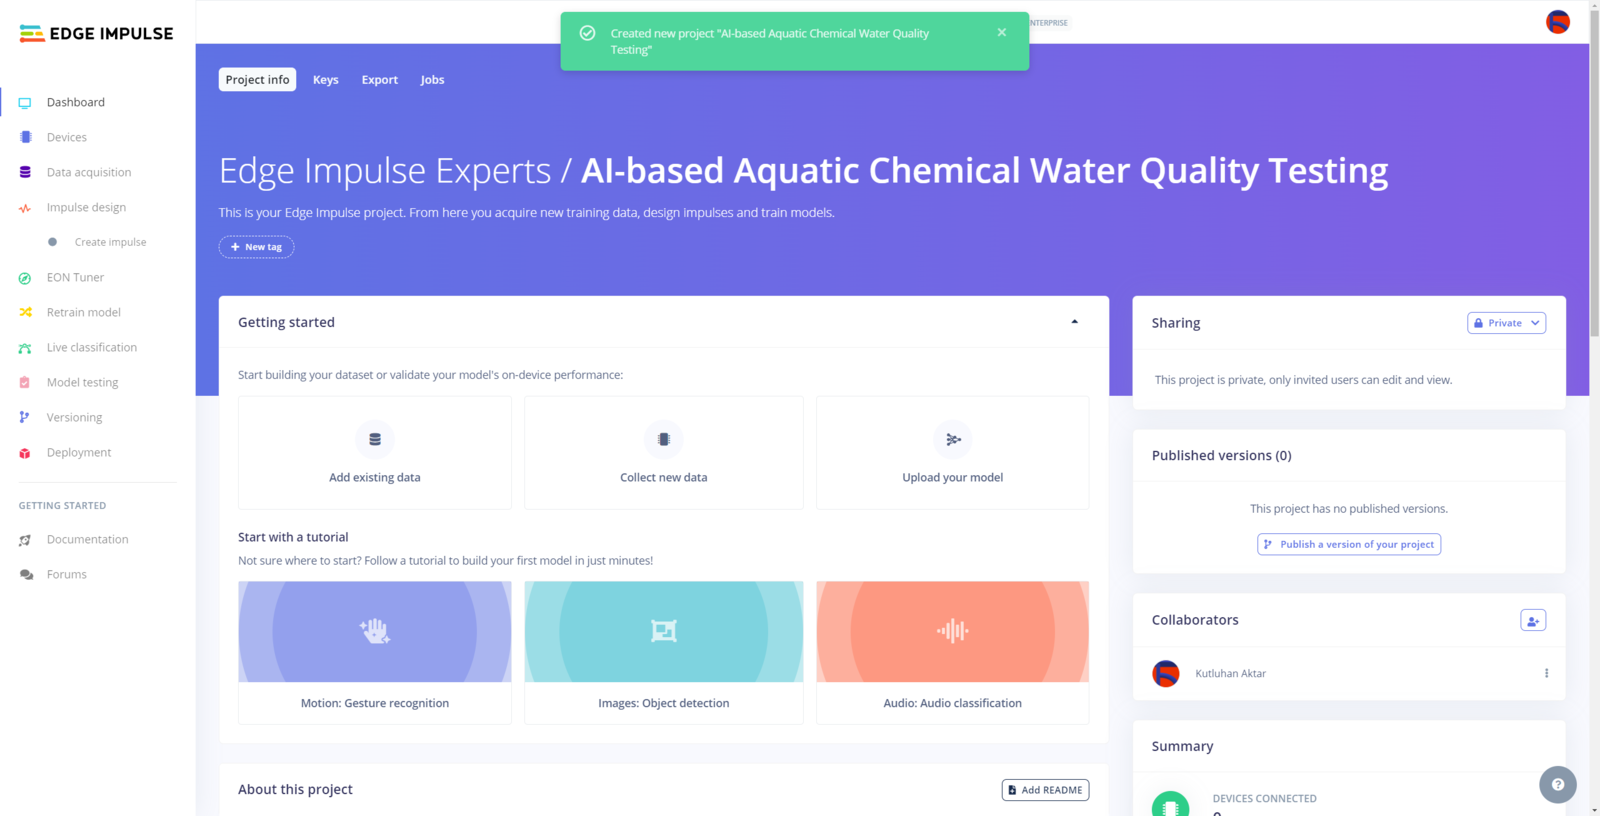


Step 11.2: Training the RetinaNet model on the water quality test images
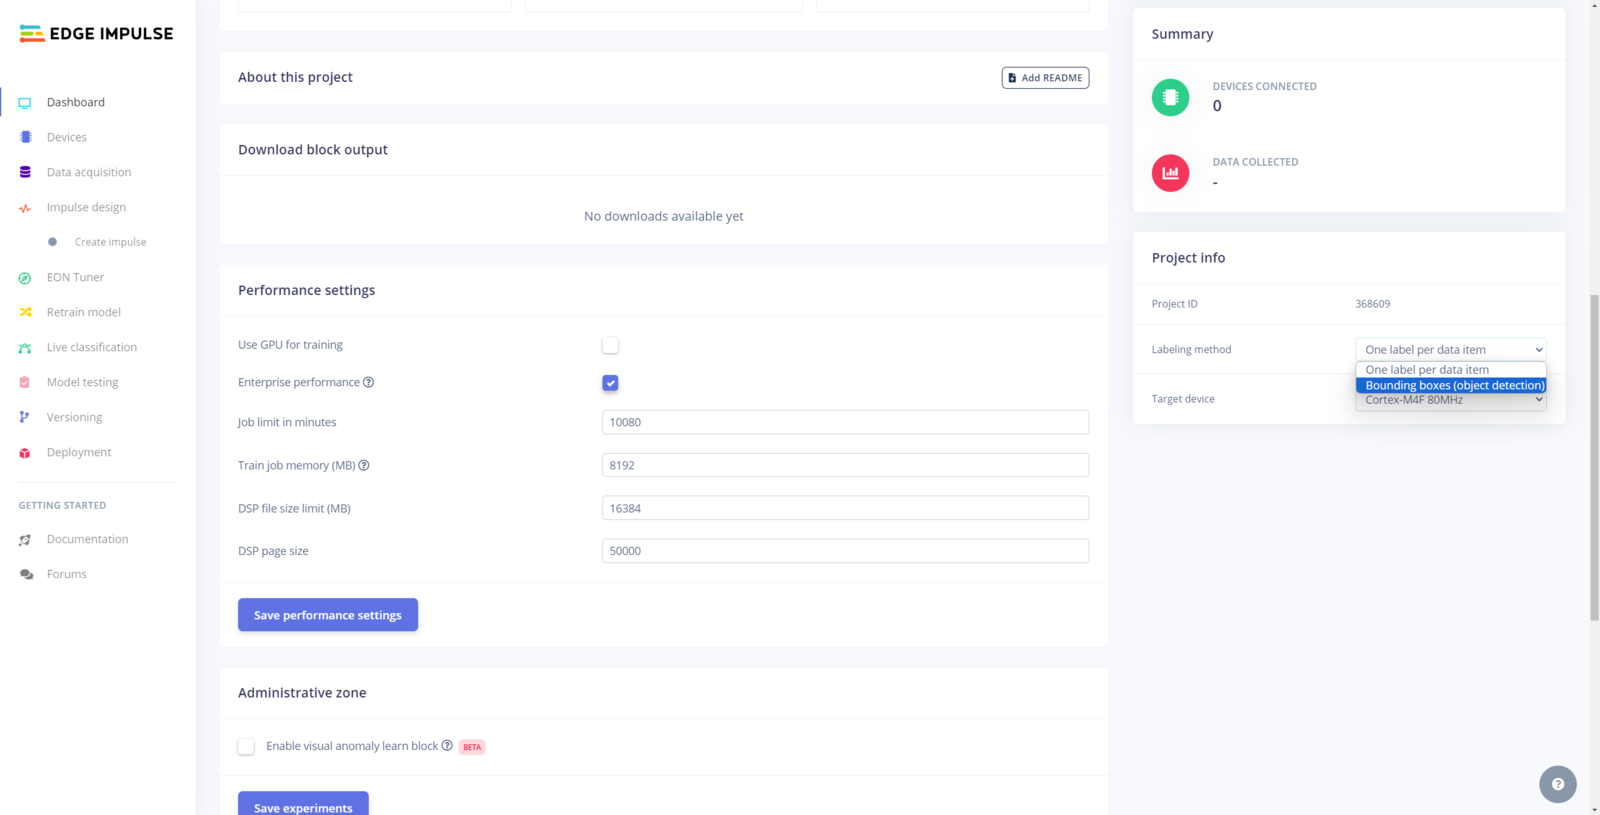
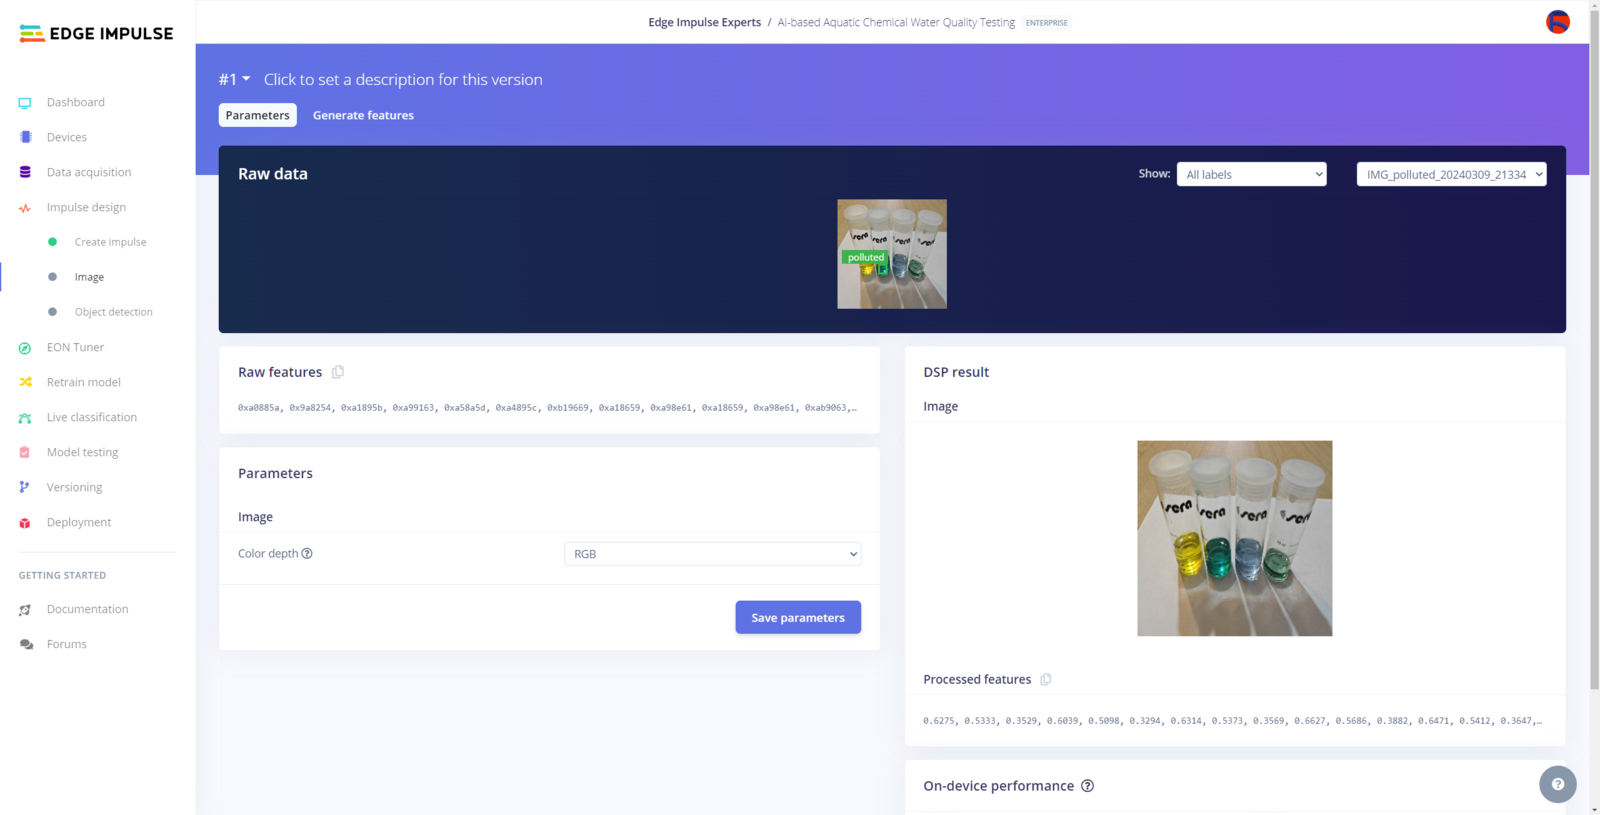
After labeling target objects on my training and testing samples successfully, I designed an impulse and trained the model on detecting water pollution levels based on the applied chemical water quality tests. An impulse is a custom neural network model in Edge Impulse. I created my impulse by employing the Image preprocessing block and the Object Detection (Images) learning block. The Image preprocessing block optionally turns the input image format to grayscale or RGB and generates a features array from the raw image. The Object Detection (Images) learning block represents a machine learning algorithm that detects objects on the given image, distinguished between model labels. In this case, I configured the input image format as RGB since the applied chemical water quality tests highly rely on color codes to distinguish quality levels. Due to the NVIDIA TAO vision model requirements, the image width and height must be multiples of 32 while configuring the impulse. :hash: Go to the Create impulse page and set image width and height parameters to 320. Then, select the resize mode parameter as Fit shortest axis so as to scale (resize) given training and testing image samples. :hash: Select the Image preprocessing block and the Object Detection (Images) learning block. Finally, click Save Impulse.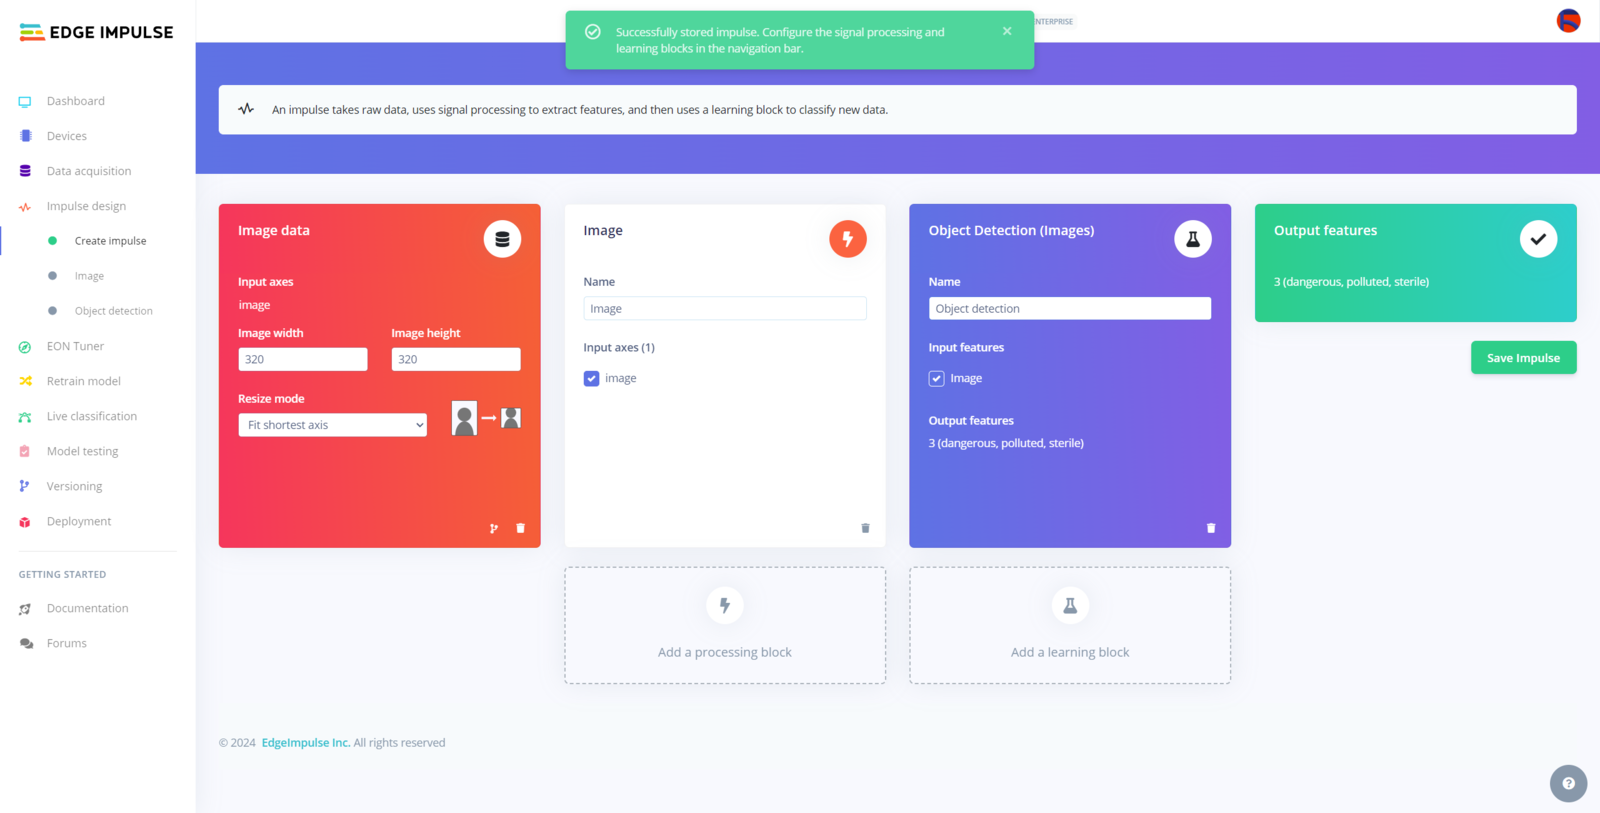
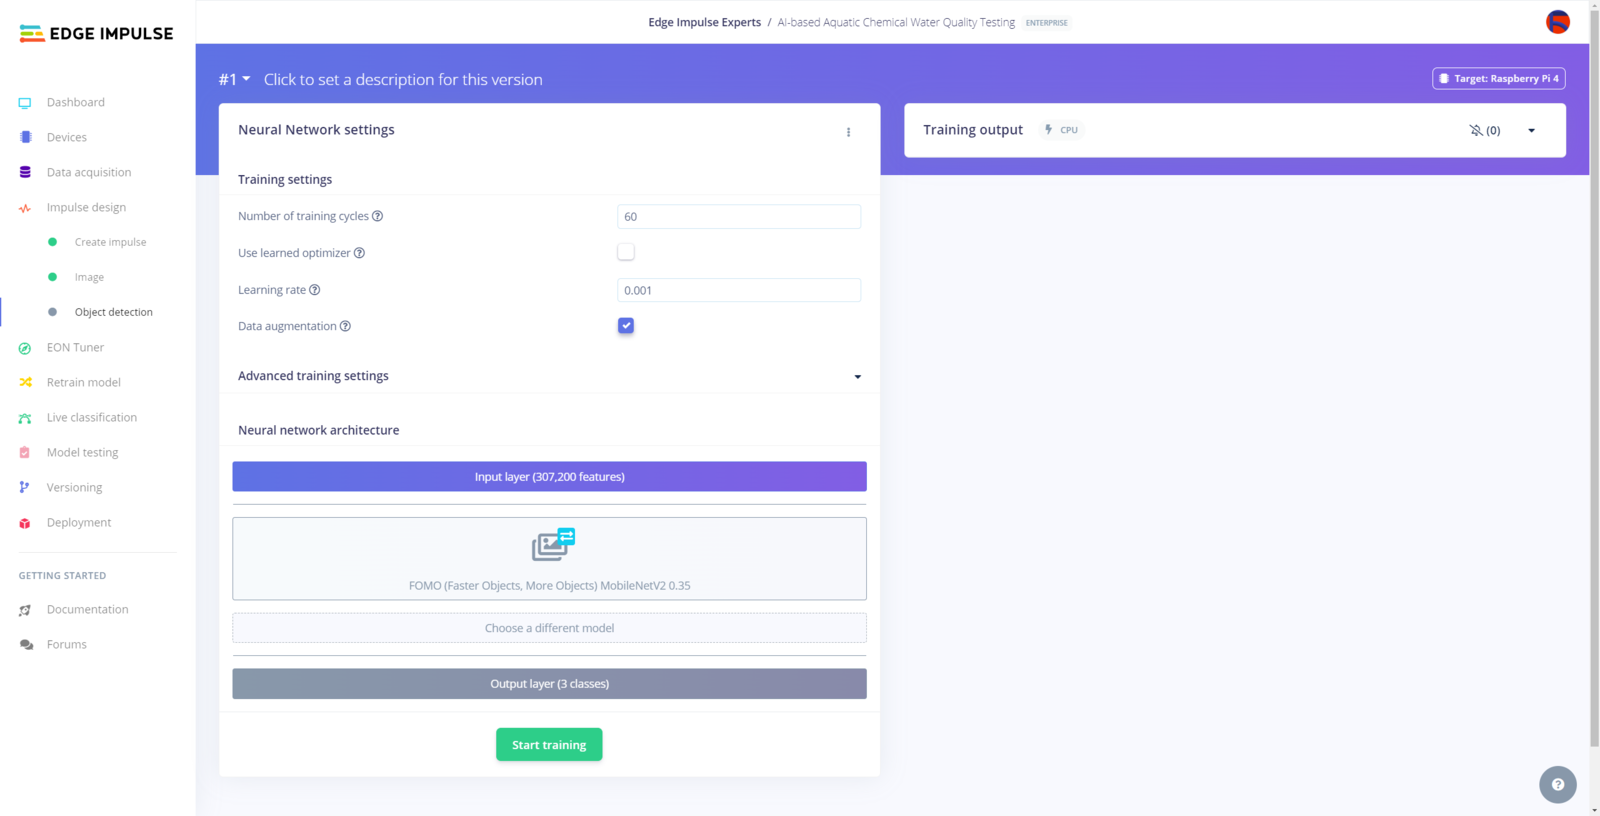
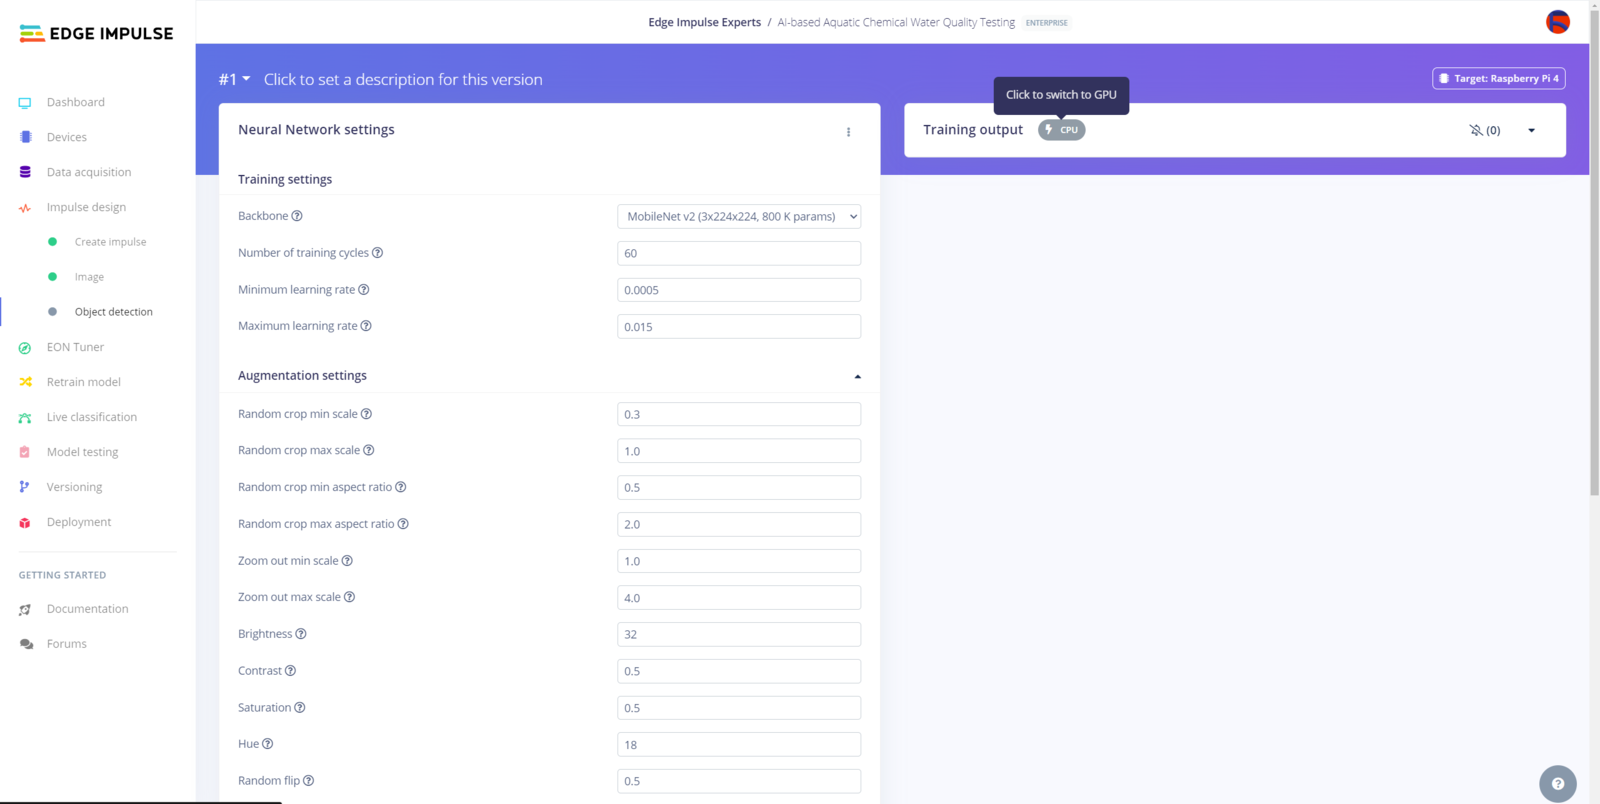
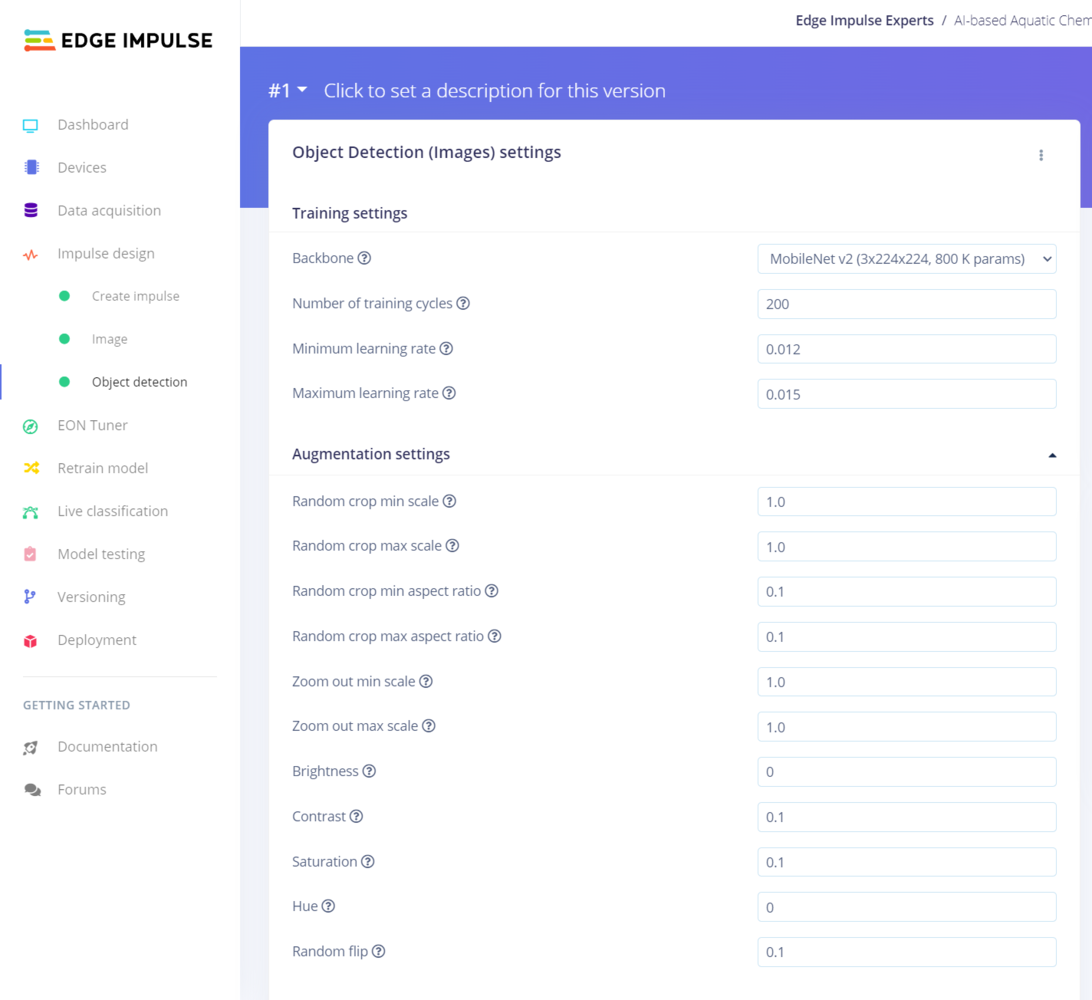
- Backbone ➡ MobileNet v2 (3x224x224, 800 K params)
- Number of training cycles ➡ 200
- Minimum learning rate ➡ 0.012
- Maximum learning rate ➡ 0.015
- Random crop min scale ➡ 1.0
- Random crop max scale ➡ 1.0
- Random crop min aspect ratio ➡ 0.1
- Random crop max aspect ratio ➡ 0.1
- Zoom out min scale ➡ 1.0
- Zoom out max scale ➡ 1.0
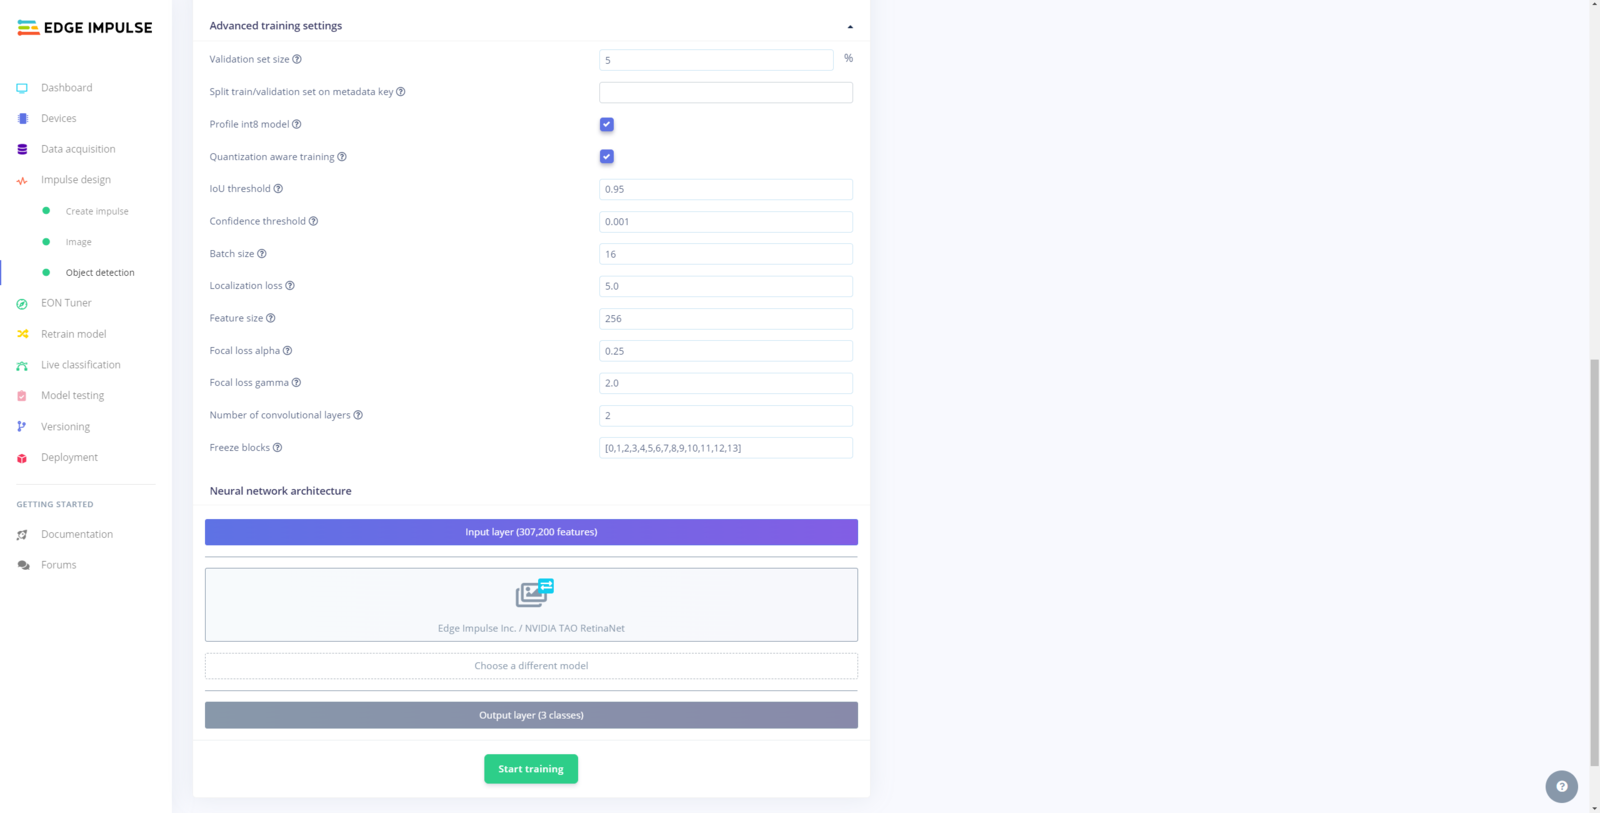
- Validation set size ➡ 5
- IoU threshold ➡ 0.95
- Confidence threshold ➡ 0.001
- Batch size ➡ 16
- NVIDIA TAO RetinaNet (ENTERPRISE)
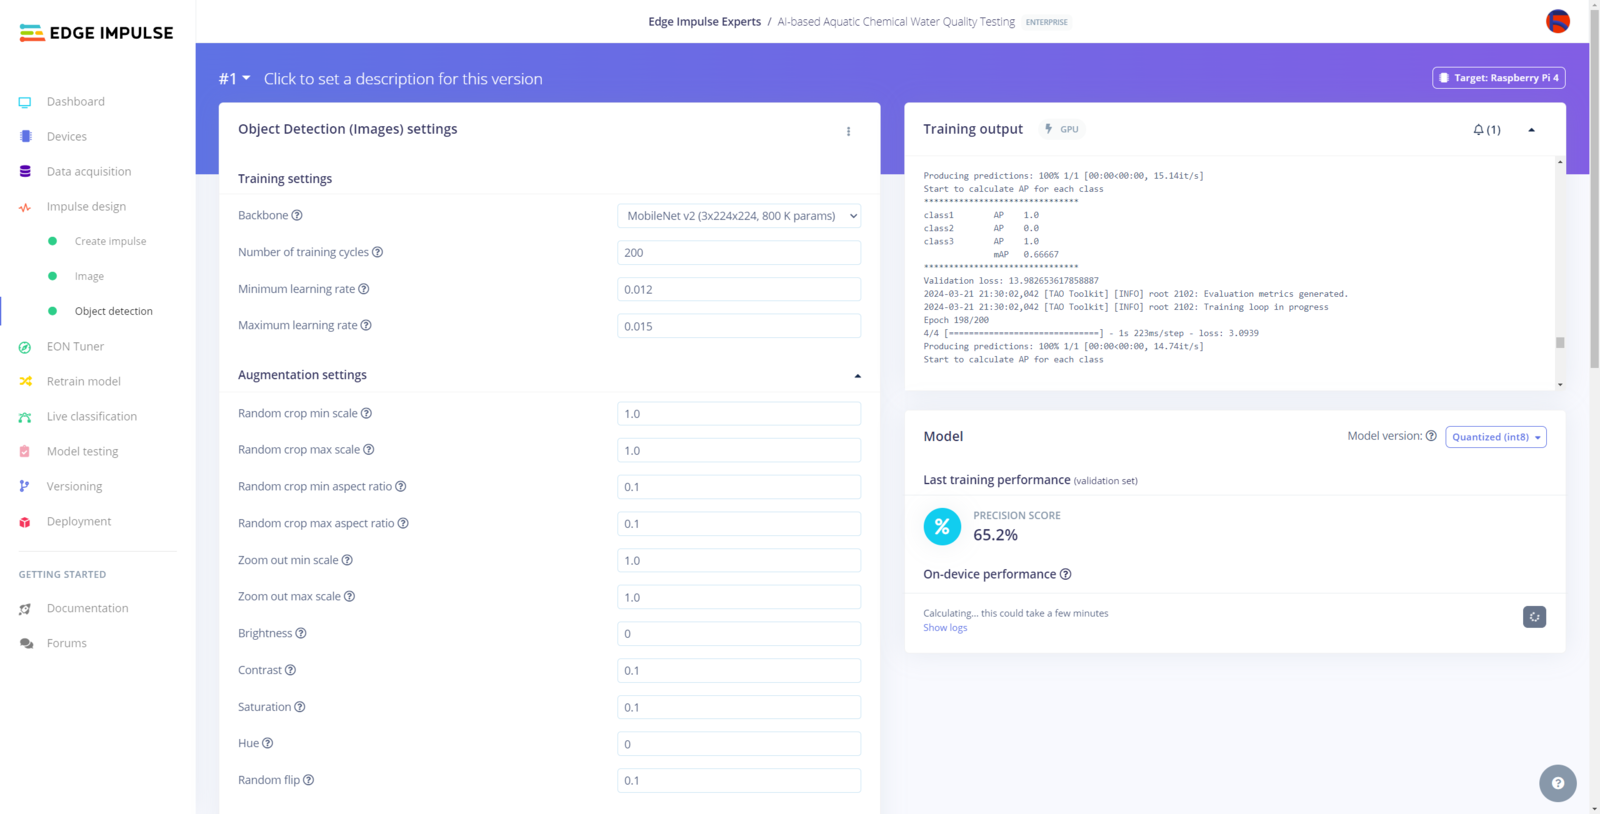
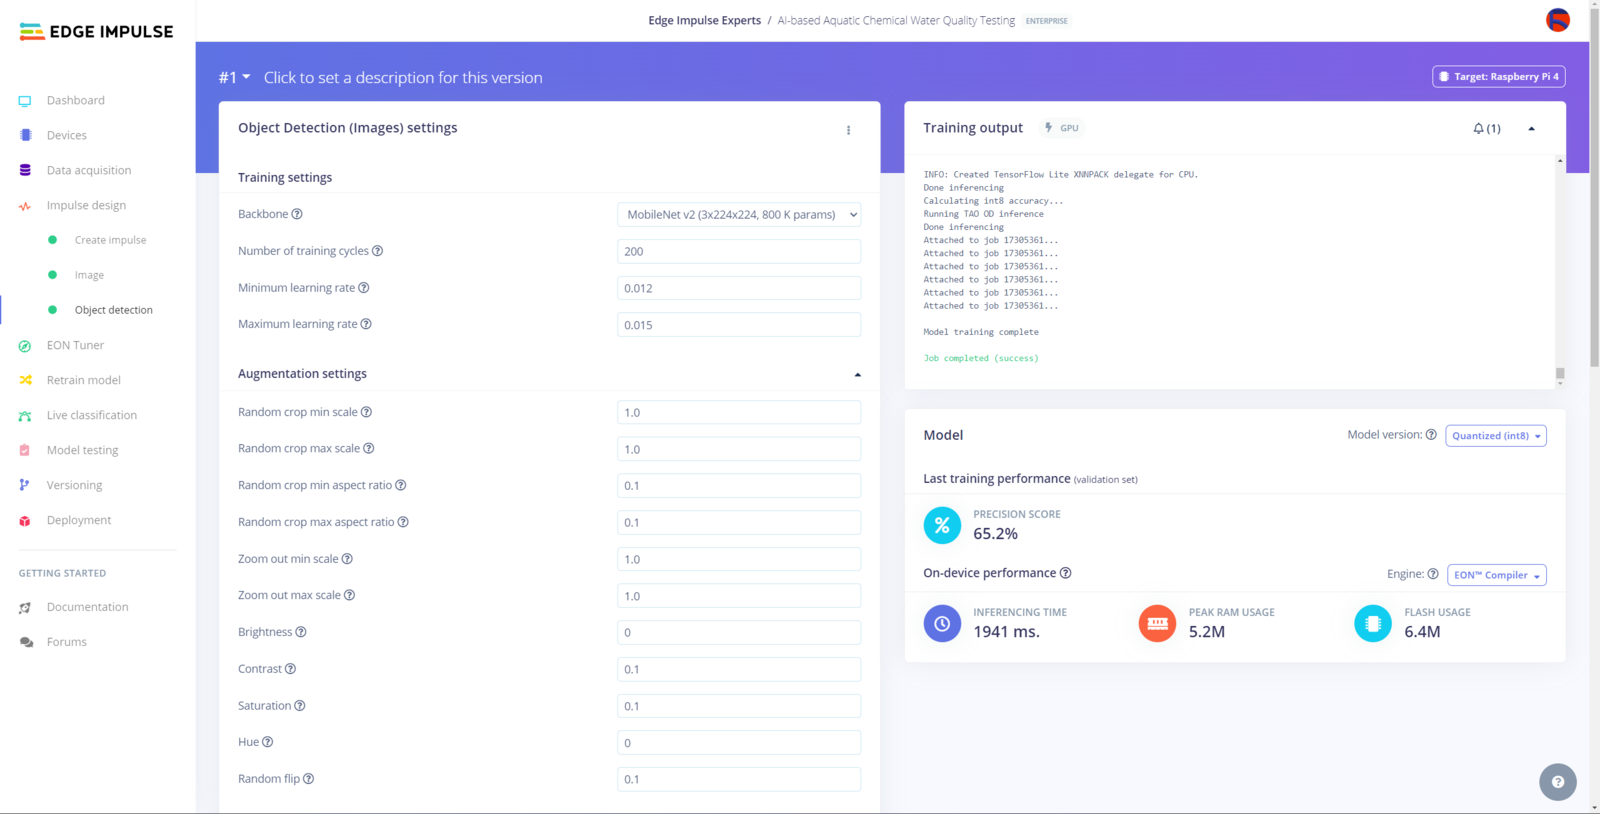
Step 11.3: Evaluating the model accuracy and deploying the optimized model
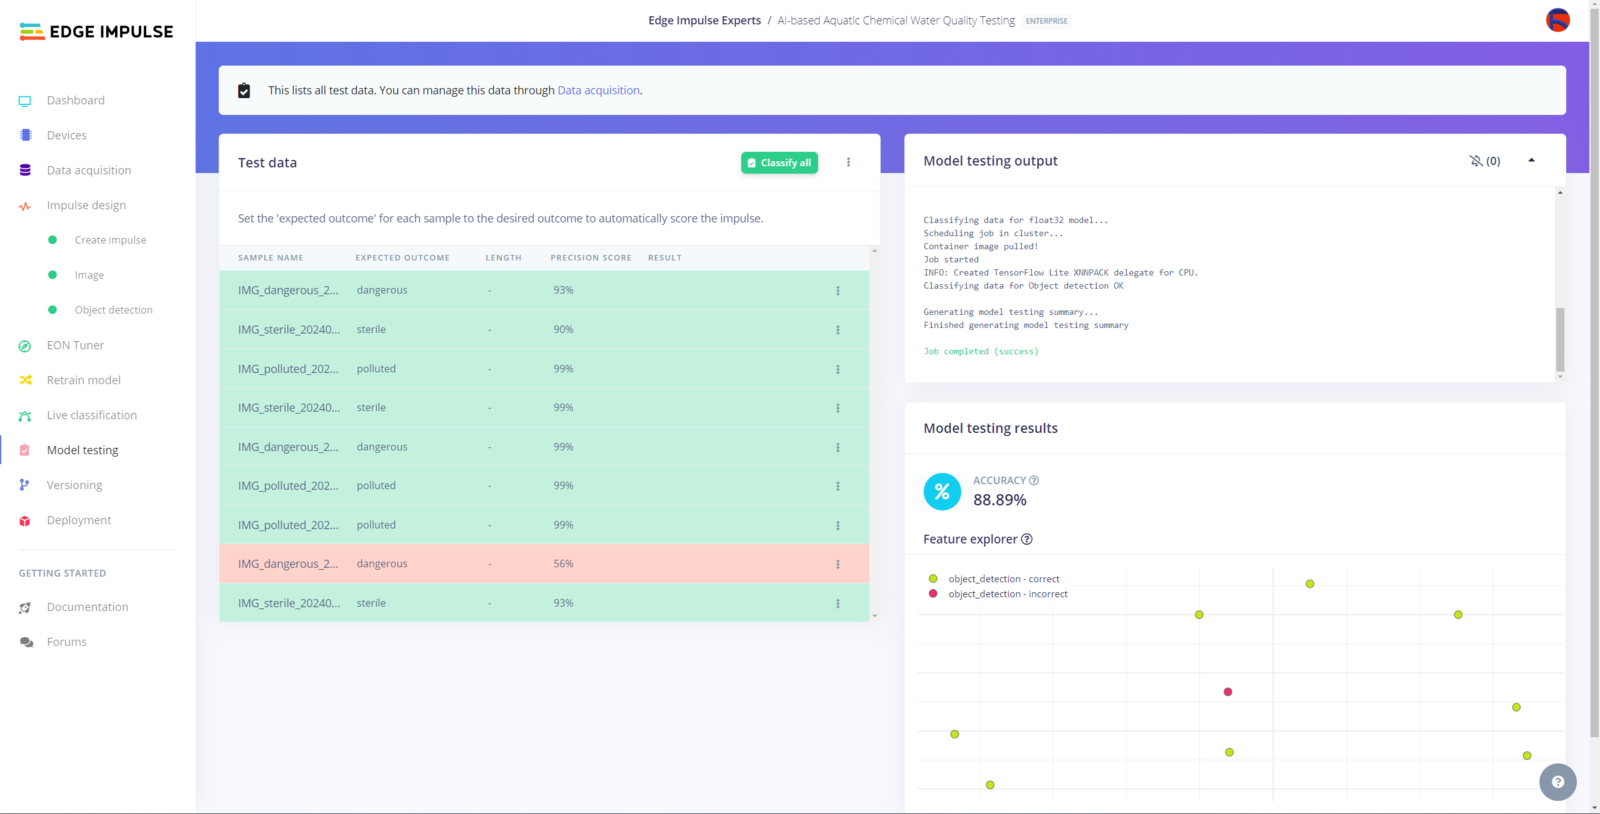
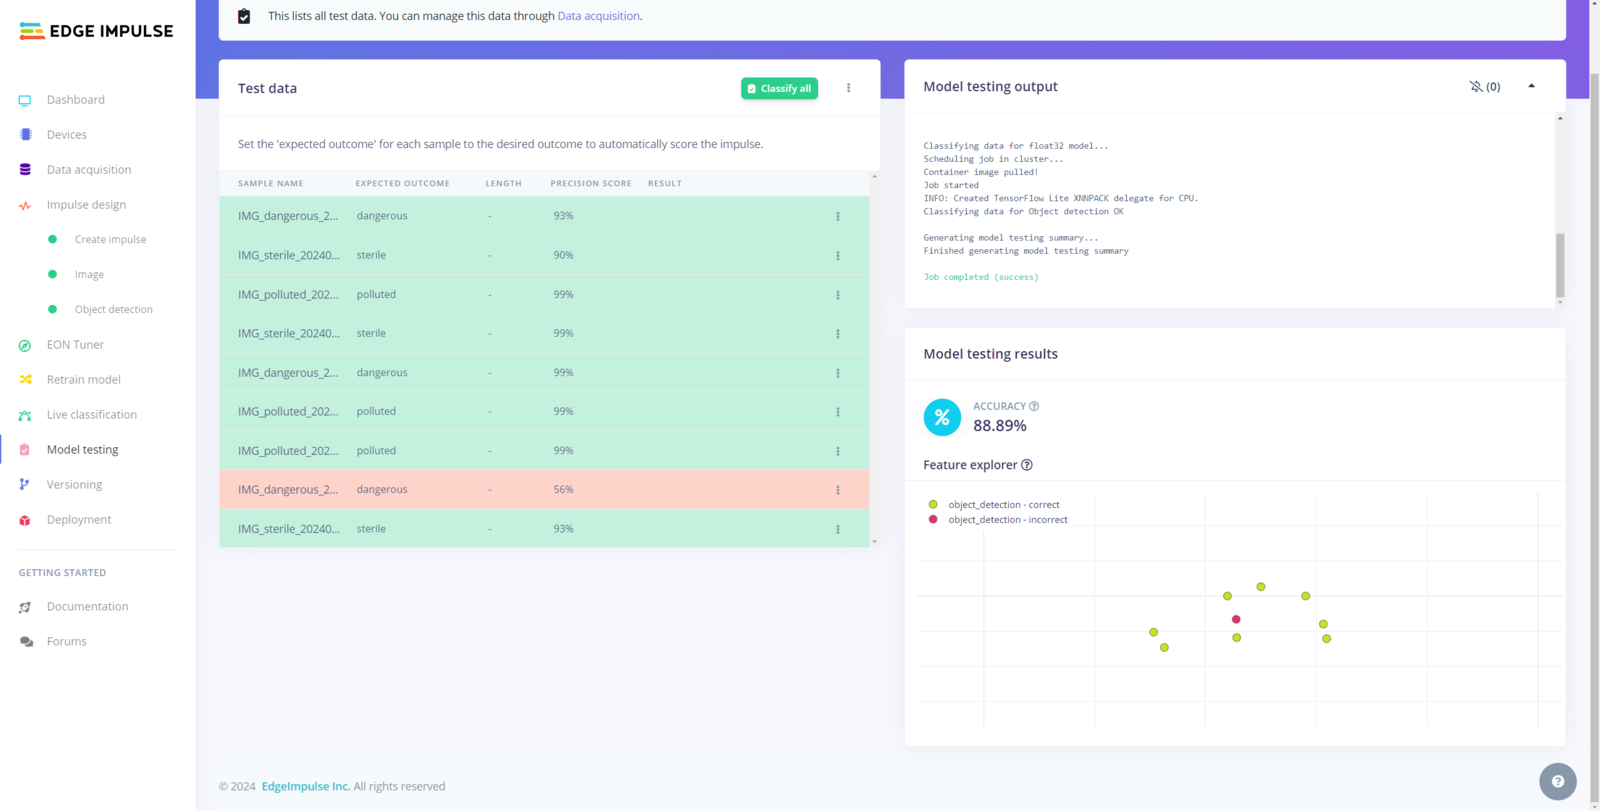
After building and training my RetinaNet object detection model, I tested its accuracy and validity by utilizing testing image samples. The evaluated accuracy of the model is 88.89%. :hash: To validate the trained model, go to the Model testing page and click Classify all.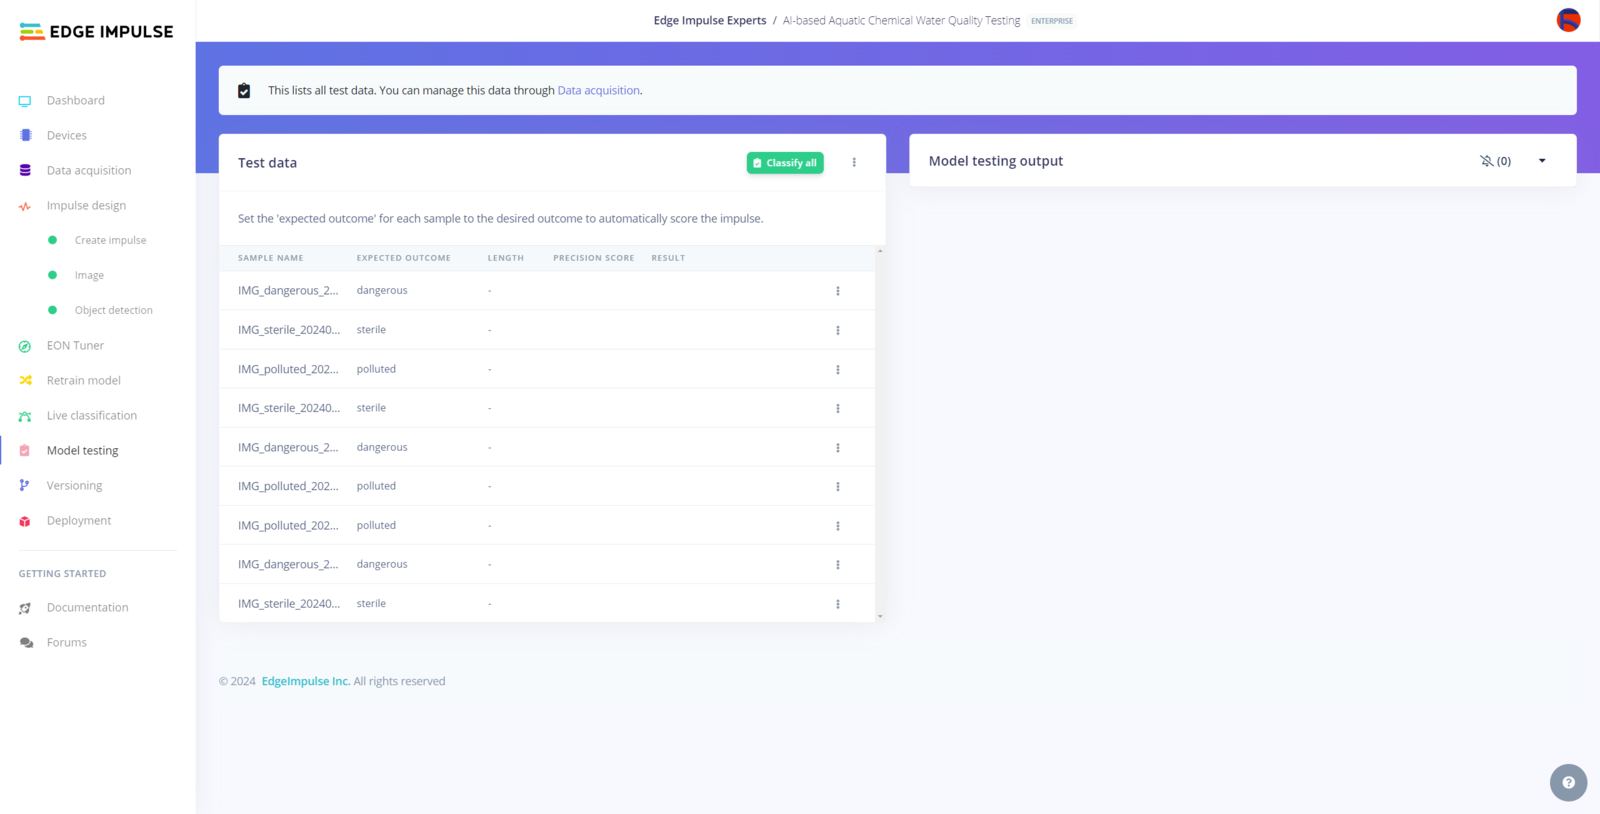
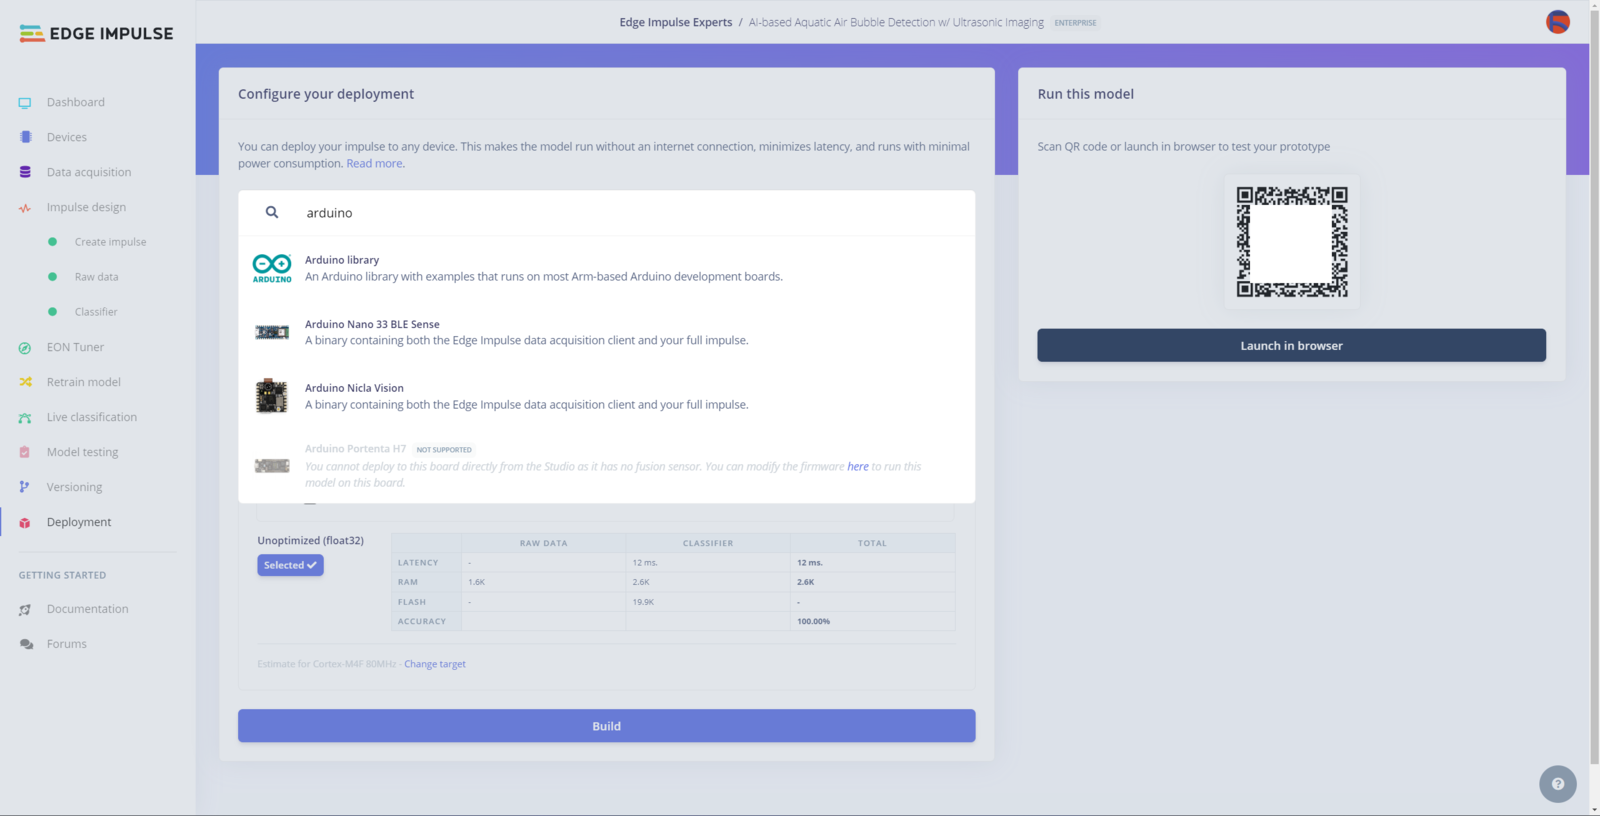
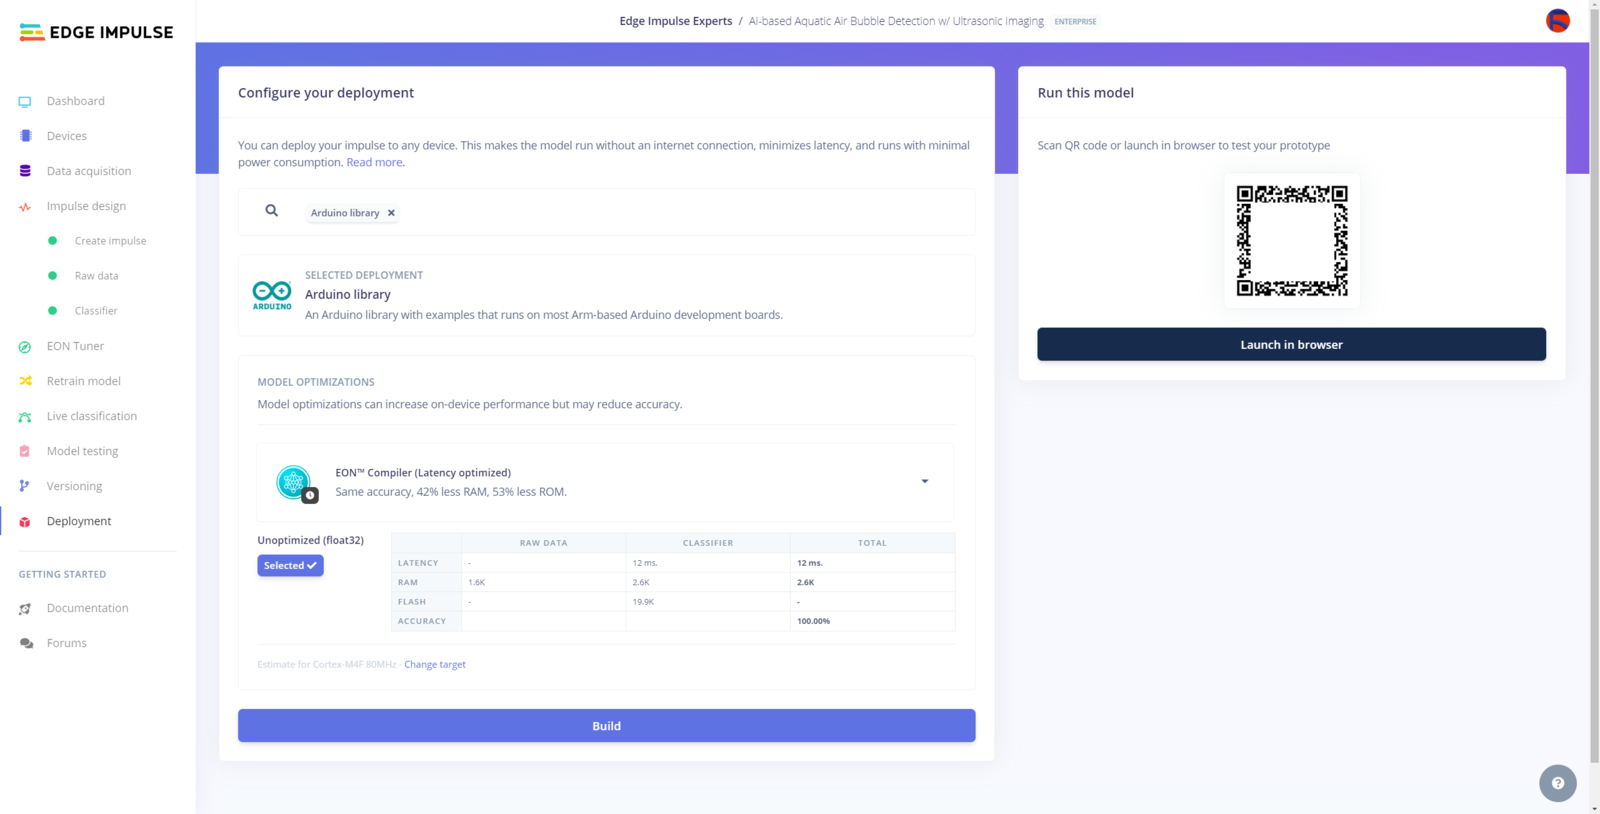
Step 12: Setting up the neural network model on Nano ESP32
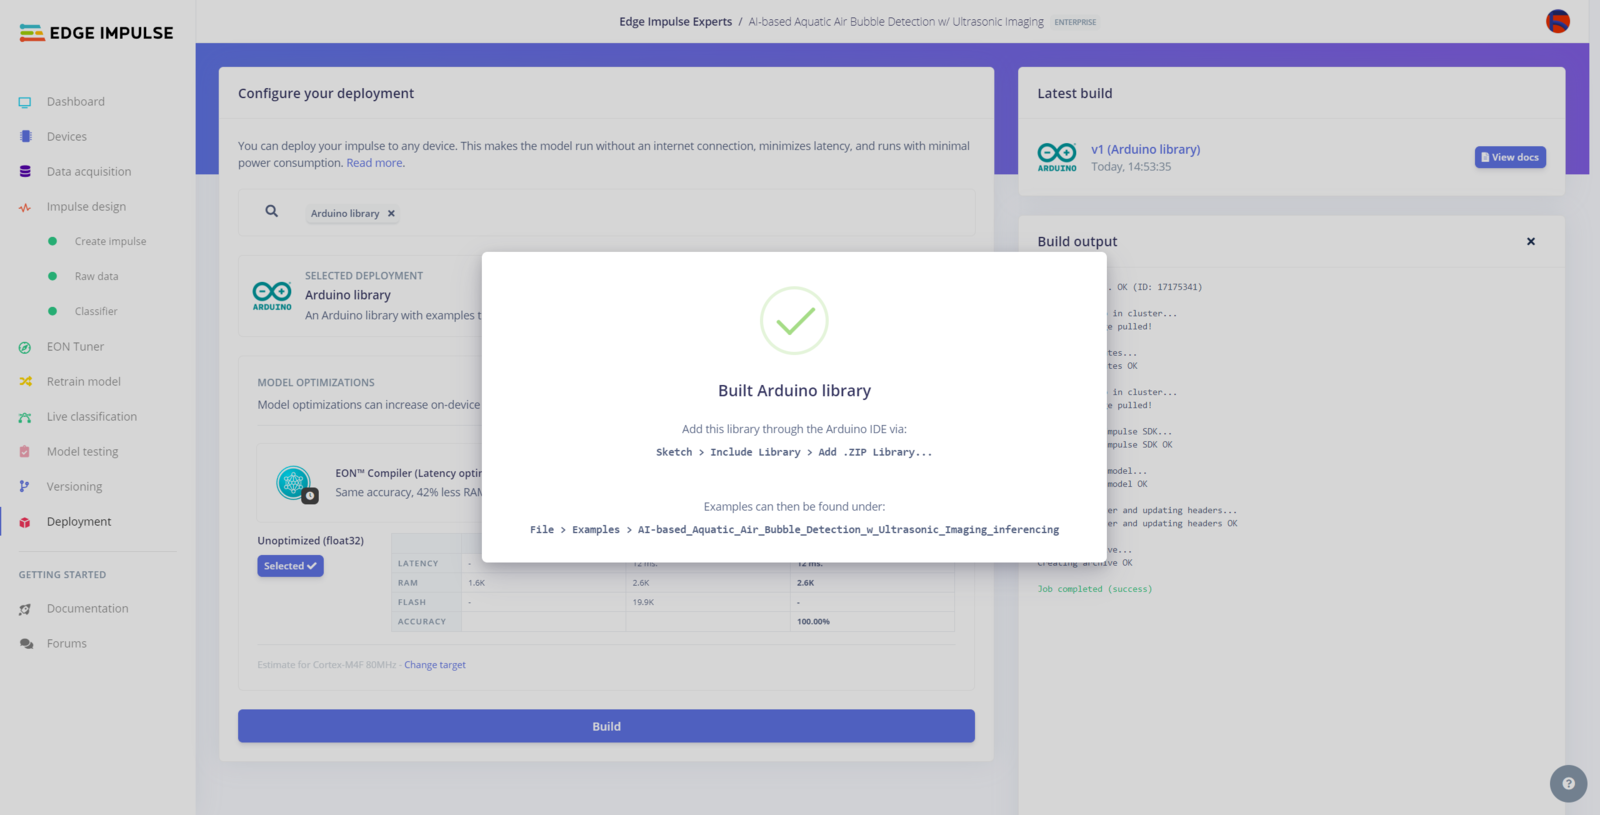
After building, training, and deploying my neural network model with the Ridge classifier as an Arduino library on Edge Impulse, I needed to upload the generated Arduino library on Nano ESP32 to run the optimized model directly so as to identify toxic underwater air bubbles with minimal latency, memory usage, and power consumption. Since Edge Impulse optimizes and formats signal processing, configuration, and learning blocks into a single package while deploying models as Arduino libraries, even for complex machine learning algorithms, I was able to import my advanced model effortlessly to run inferences. :hash: After downloading the model as an Arduino library in the ZIP file format, go to Sketch ➡ Include Library ➡ Add .ZIP Library… :hash: Then, include the Aquatic_Air_Bubble_Detection_inferencing.h file to import the Edge Impulse neural network model with the Ridge classifier.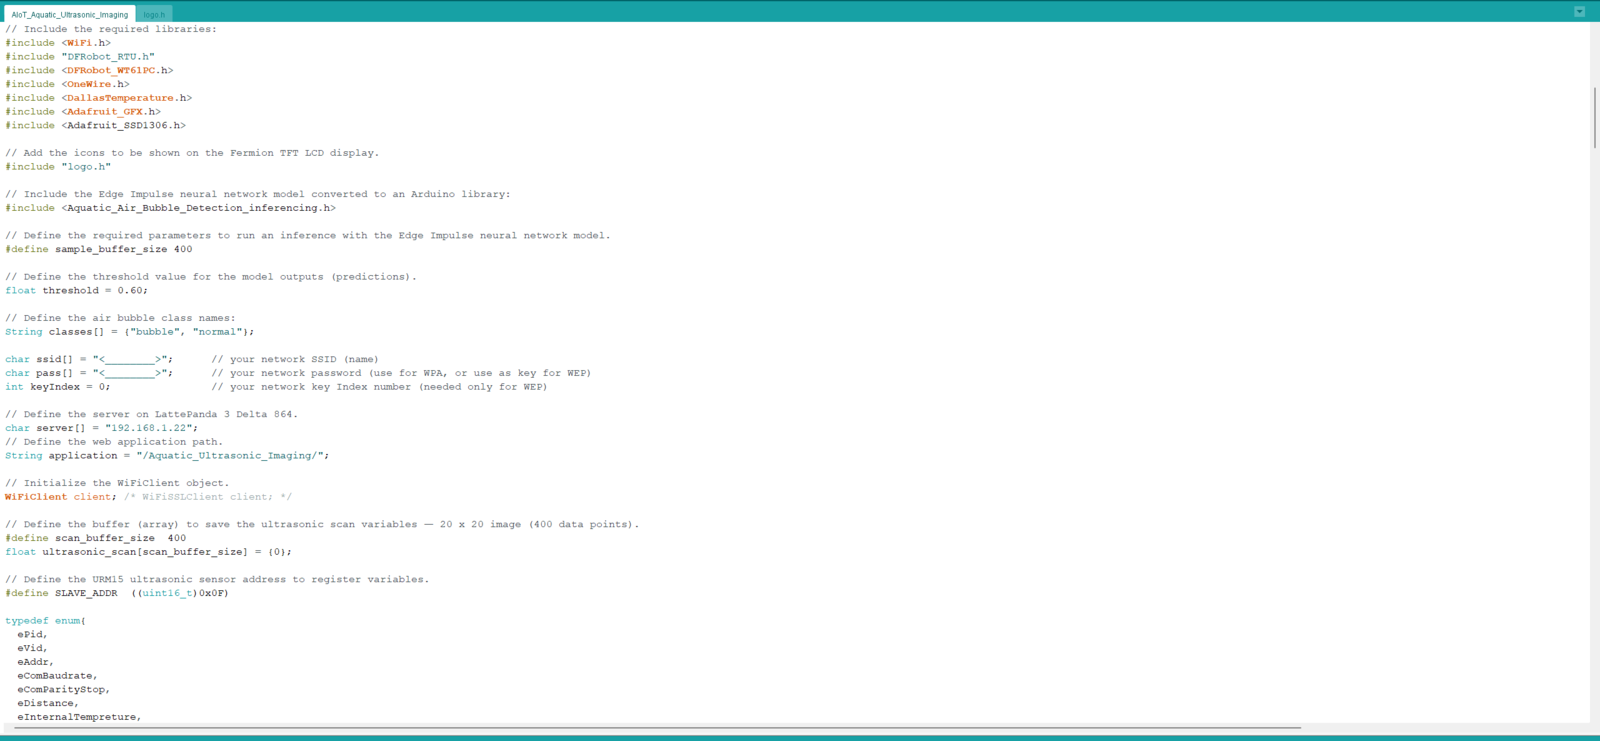
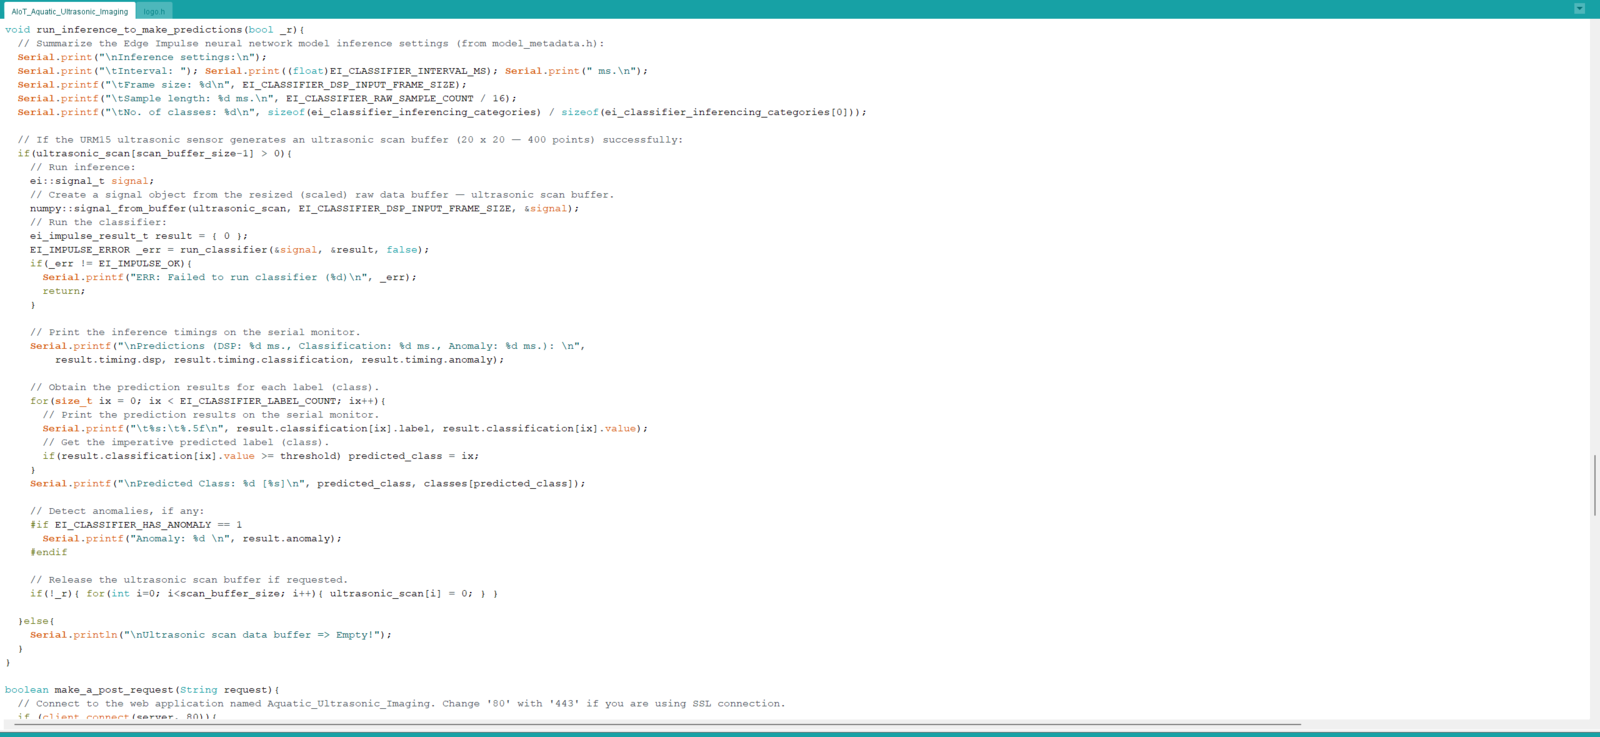
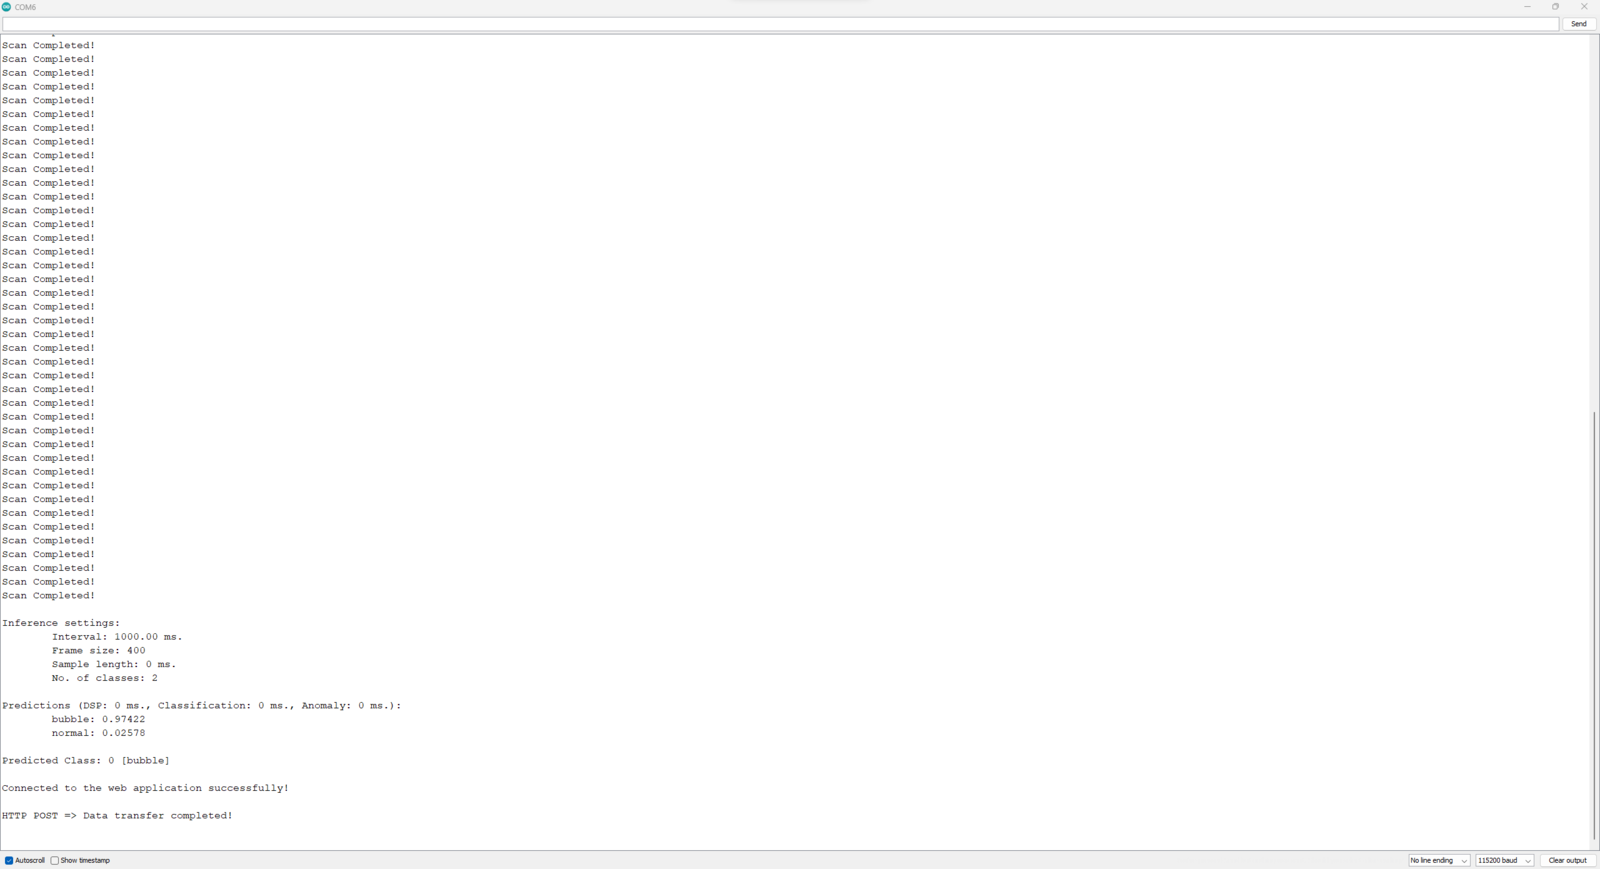
Step 13: Running the neural network model to identify noxious air bubbles
My Edge Impulse neural network model with the Ridge classifier predicts possibilities of labels (air bubble classes) for the passed ultrasonic scan data buffer as an array of 2 numbers. They represent the model’s “confidence” that the given features buffer corresponds to each of the two different air bubble classes [0 - 1], as shown in Step 10:- 0 — bubble
- 1 — normal
- A) Run Inference
- C) Send: Pending
- detection_normal__2024_04_03_10_15_35.txt
- detection_bubble__2024_04_03_10_20_52.txt

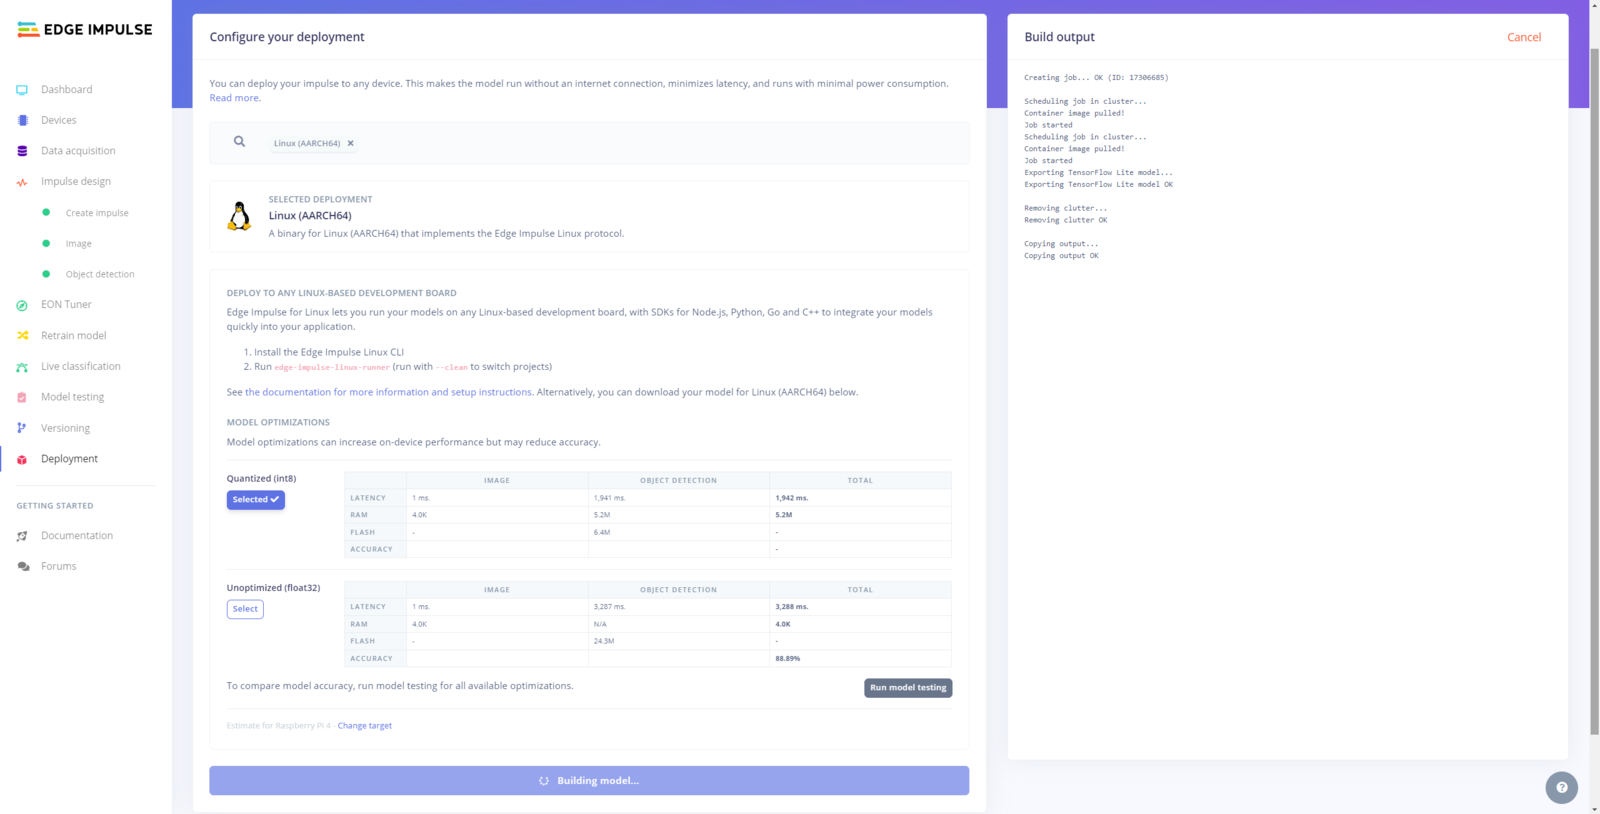
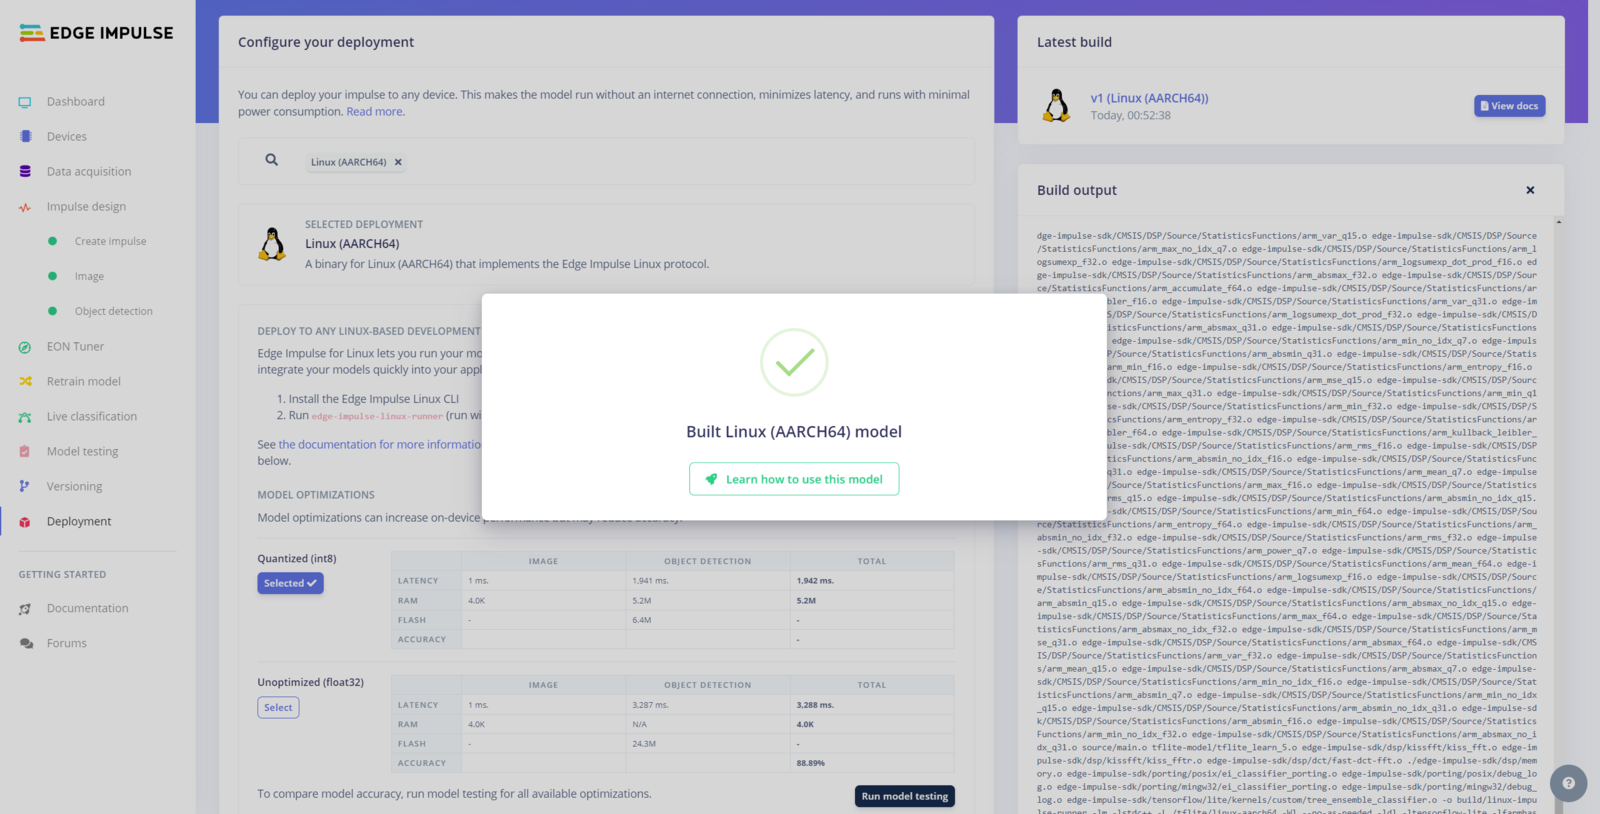
Step 14: Setting up the object detection model on UNIHIKER
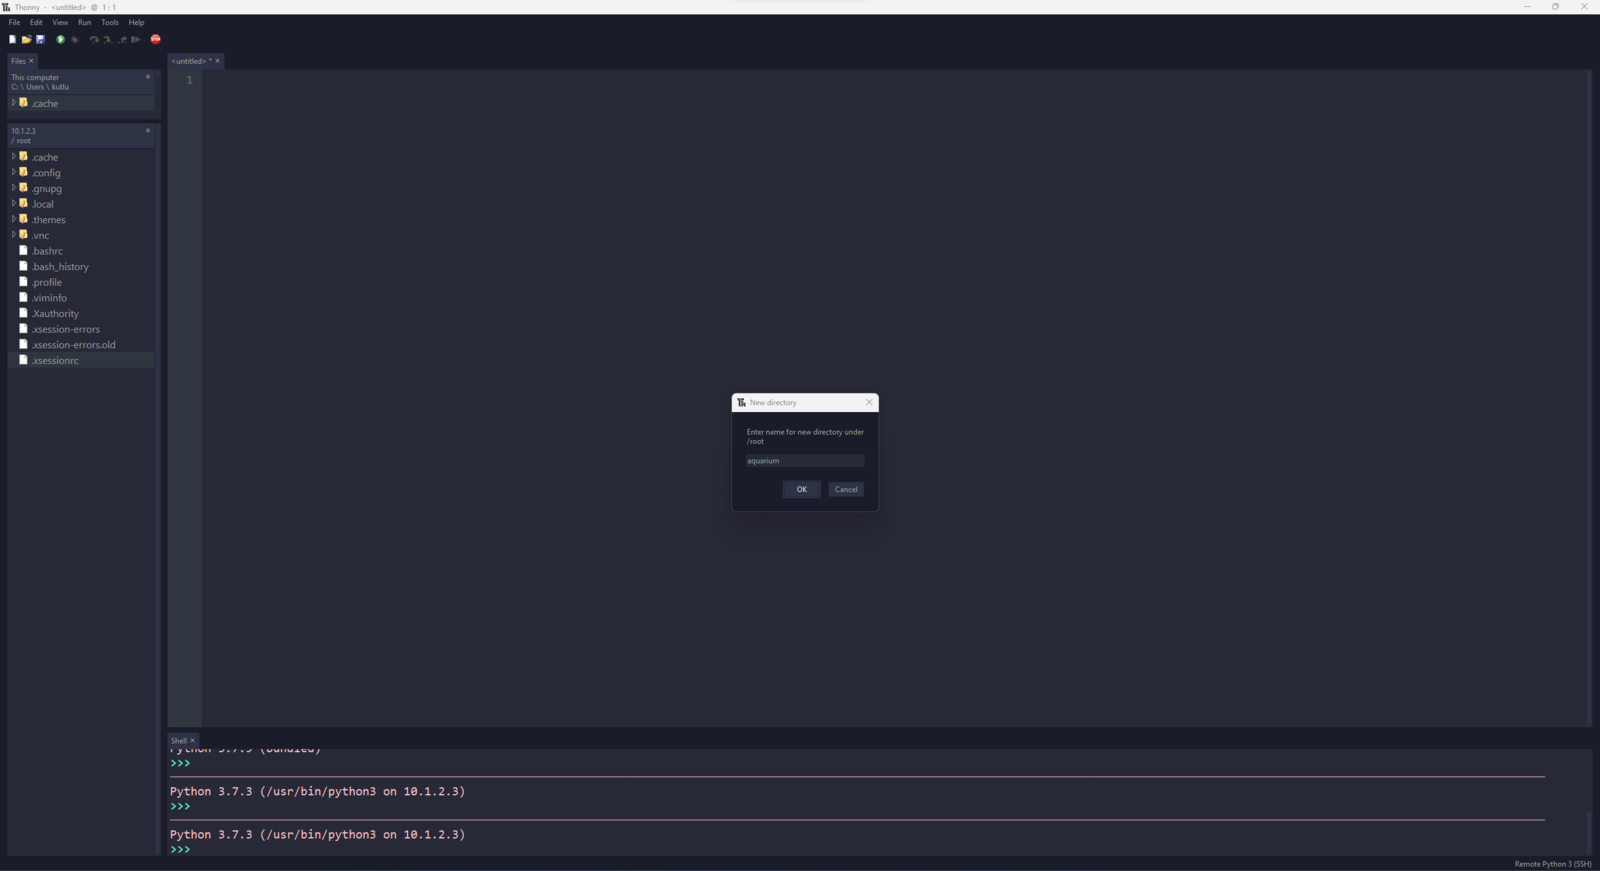
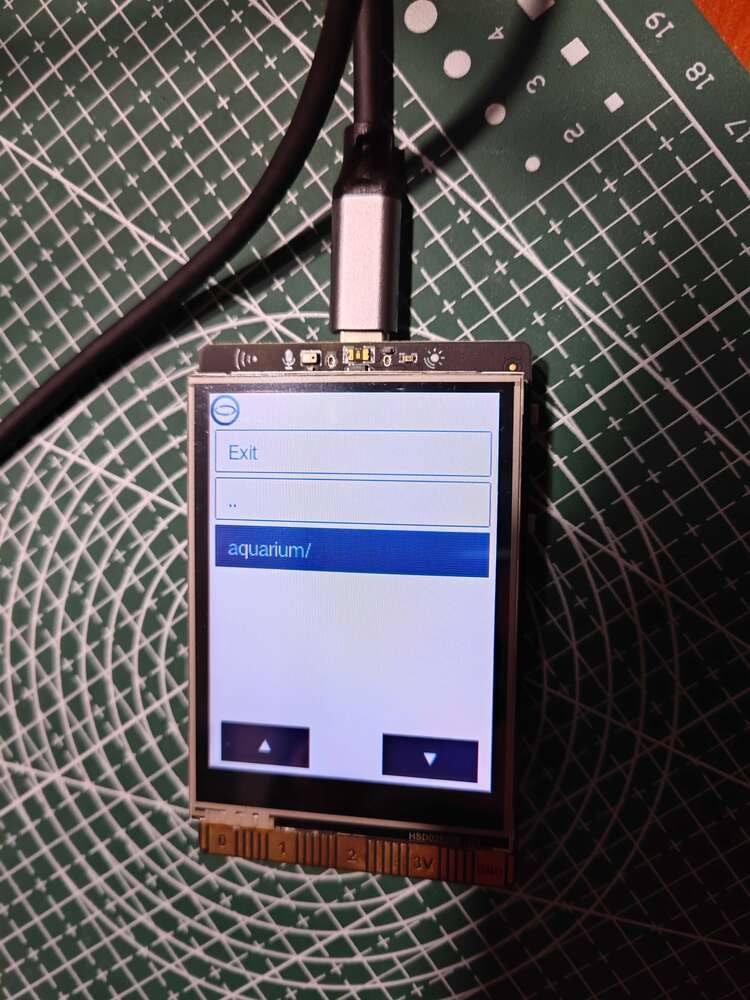
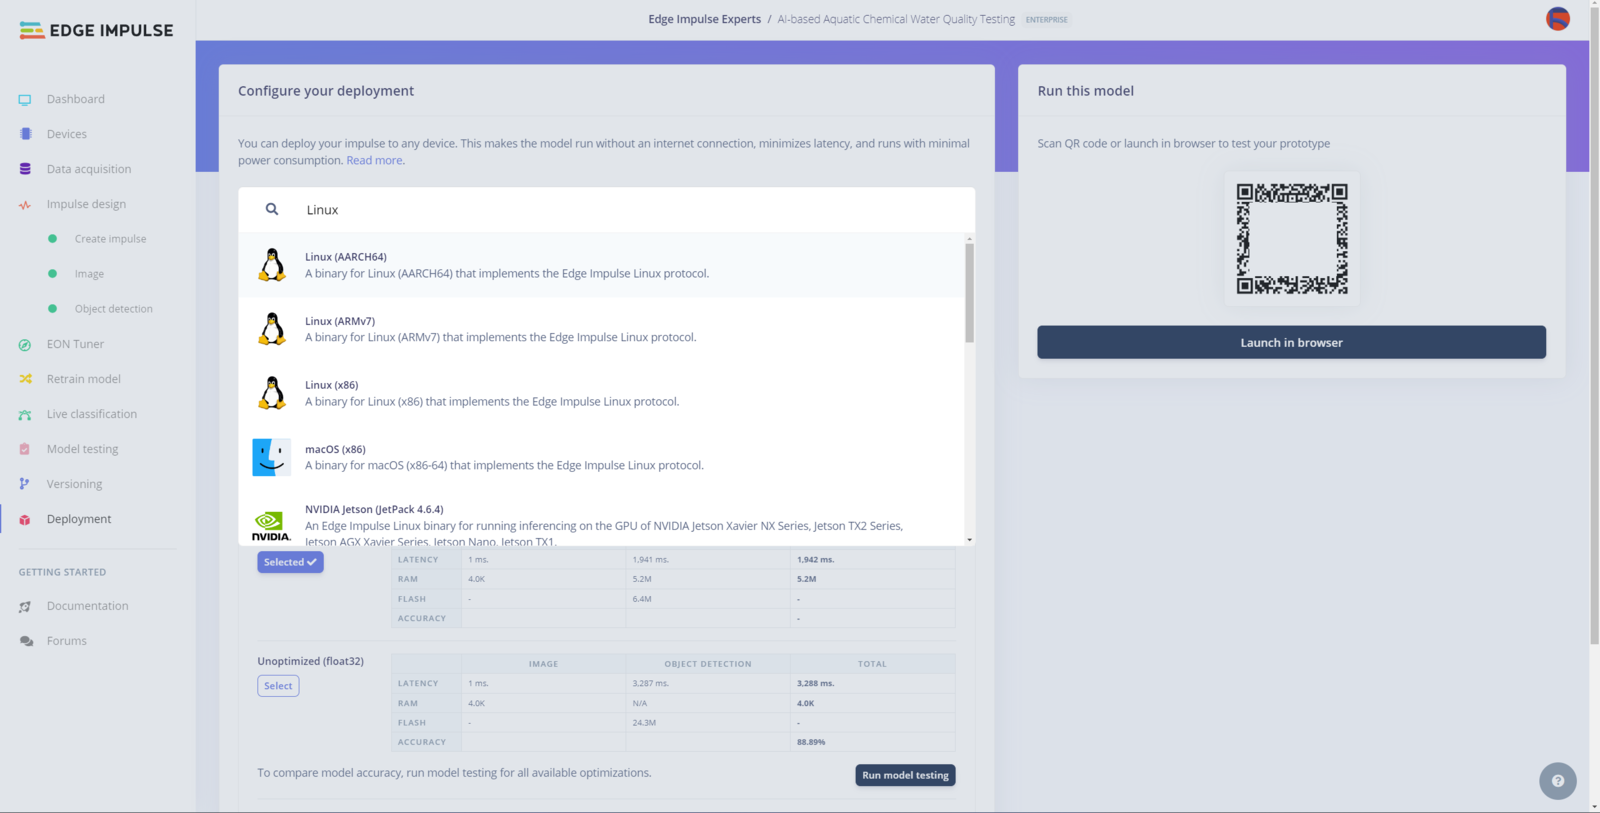
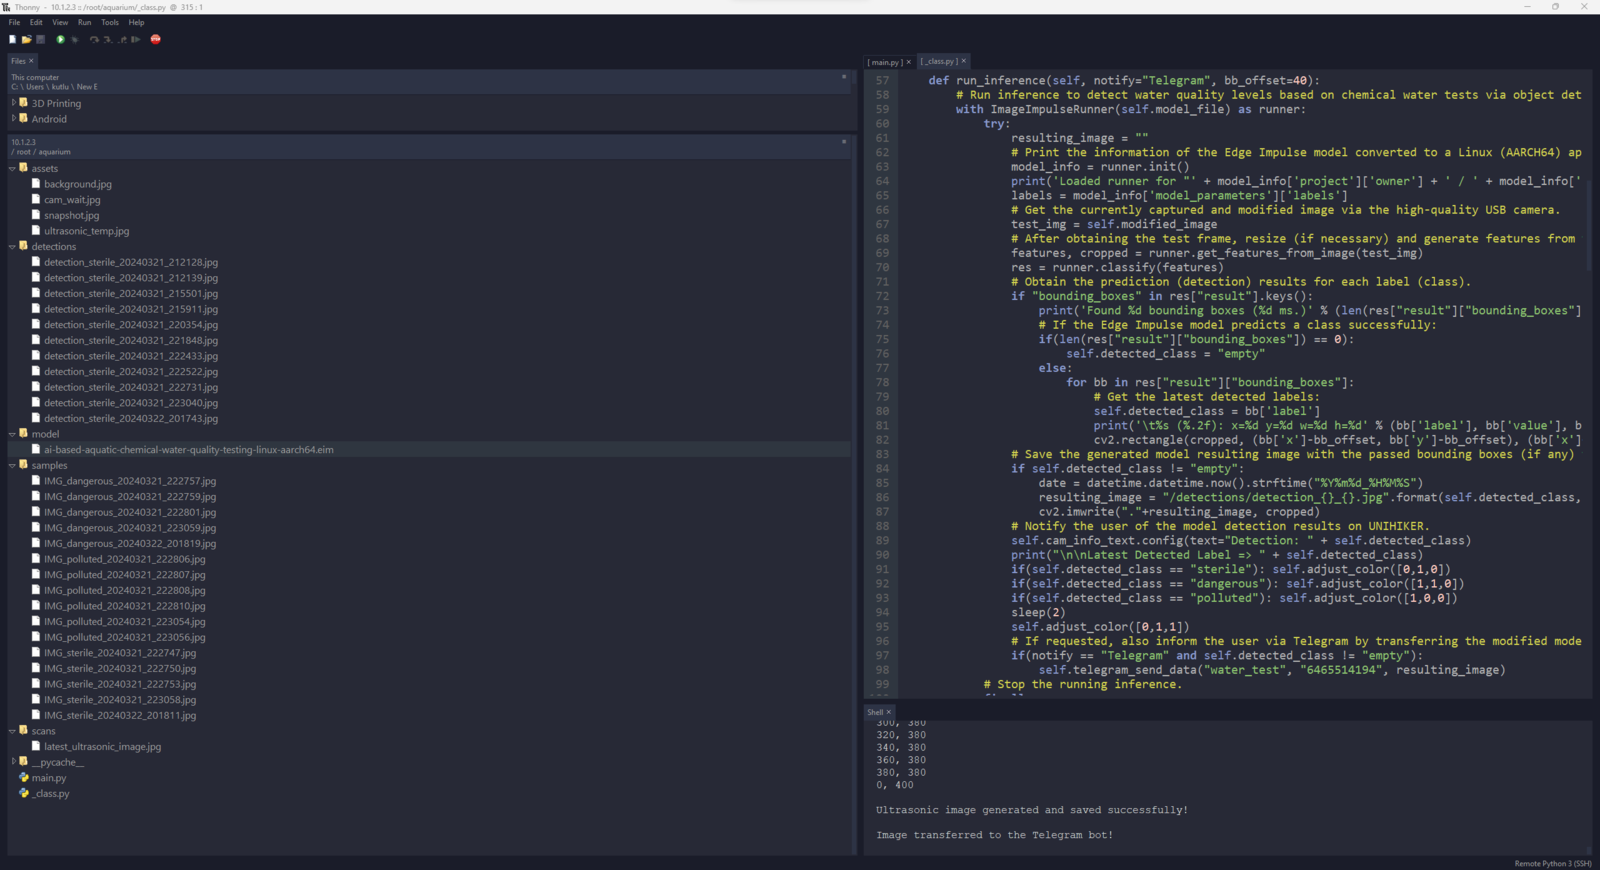
After building, training, and deploying my RetinaNet object detection model as a Linux (AARCH64) application on Edge Impulse, I needed to upload the generated Linux application to UNIHIKER to run the optimized model directly via the Linux Python SDK so as to create an accessible AI-powered water pollution detection device operating with minimal latency, memory usage, and power consumption. Since Edge Impulse optimizes and formats signal processing, configuration, and learning blocks into a single EIM file while deploying models as a Linux (AARCH64) application, even for complex computer vision models from NVIDIA TAO, I was able to import my advanced model effortlessly to run inferences in Python. :hash: After downloading the generated Linux (AARCH64) application to the model folder and installing the required modules via SSH, make sure to change the file permissions via the terminal on MobaXterm to be able to execute the model file. sudo chmod 777 /root/aquarium/model/ai-based-aquatic-chemical-water-quality-testing-linux-aarch64.eim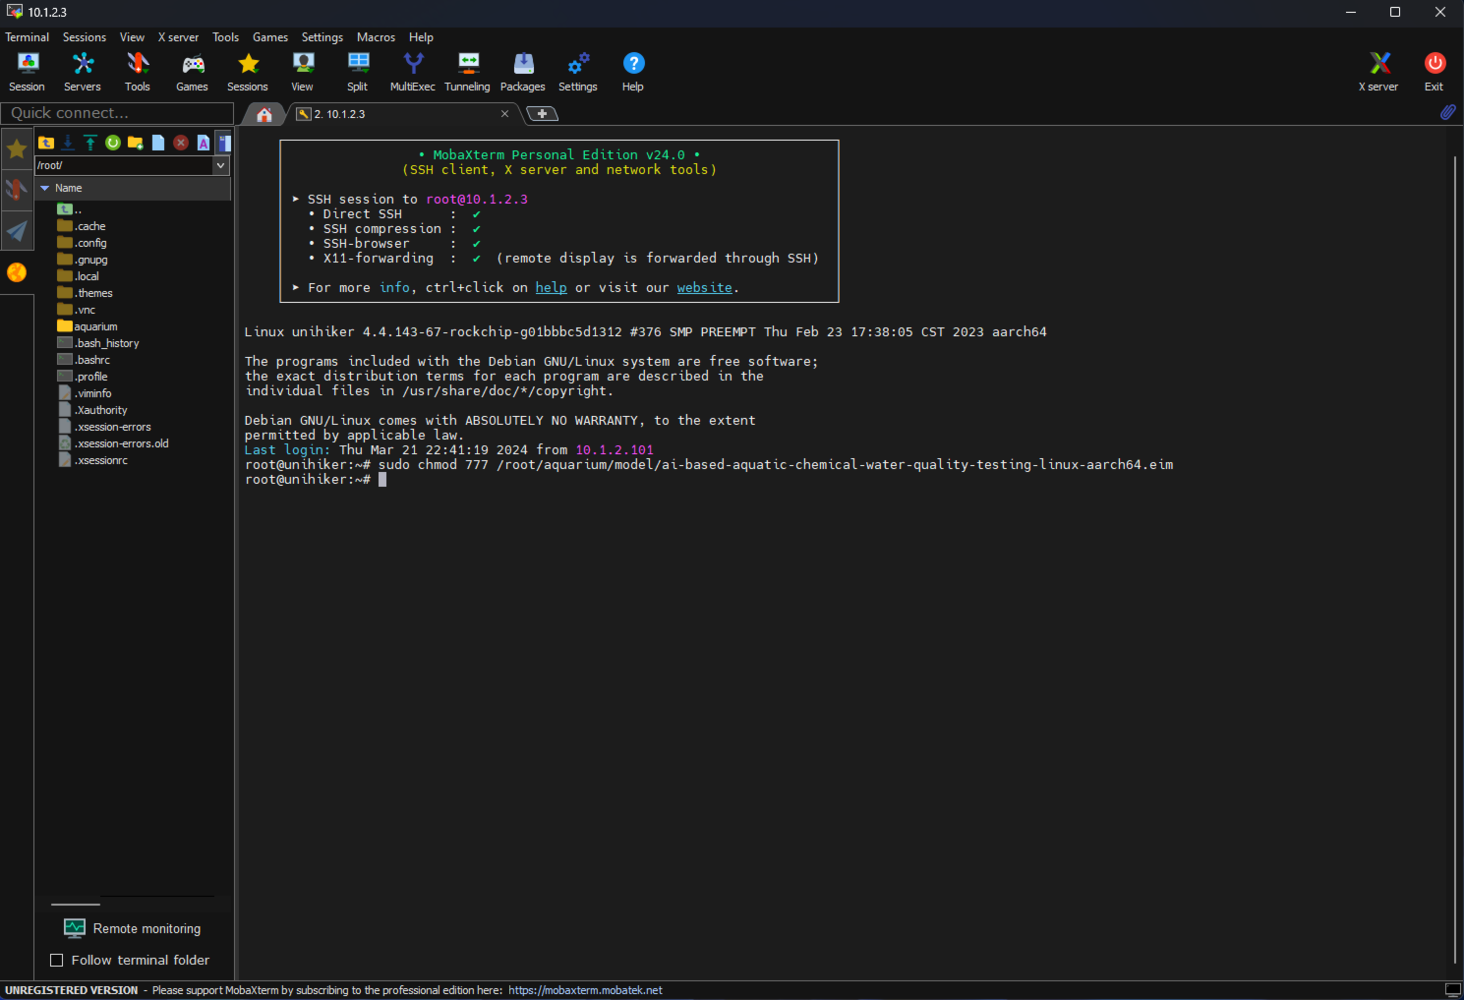
- /assets
- /detections
- /model
- /samples
- /scans
- main.py
- _class.py
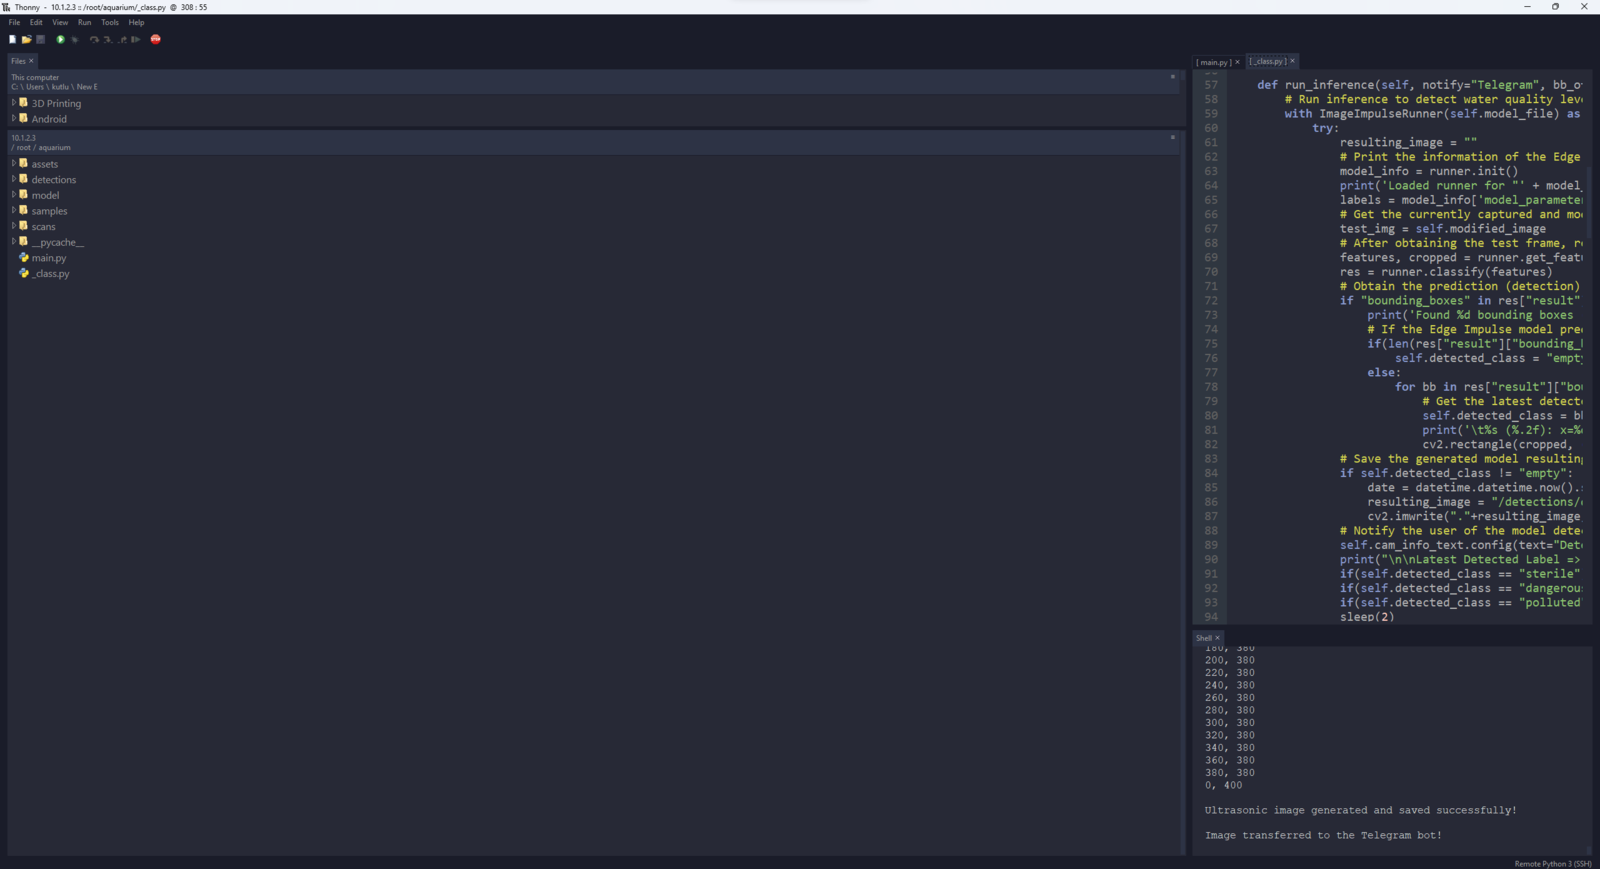
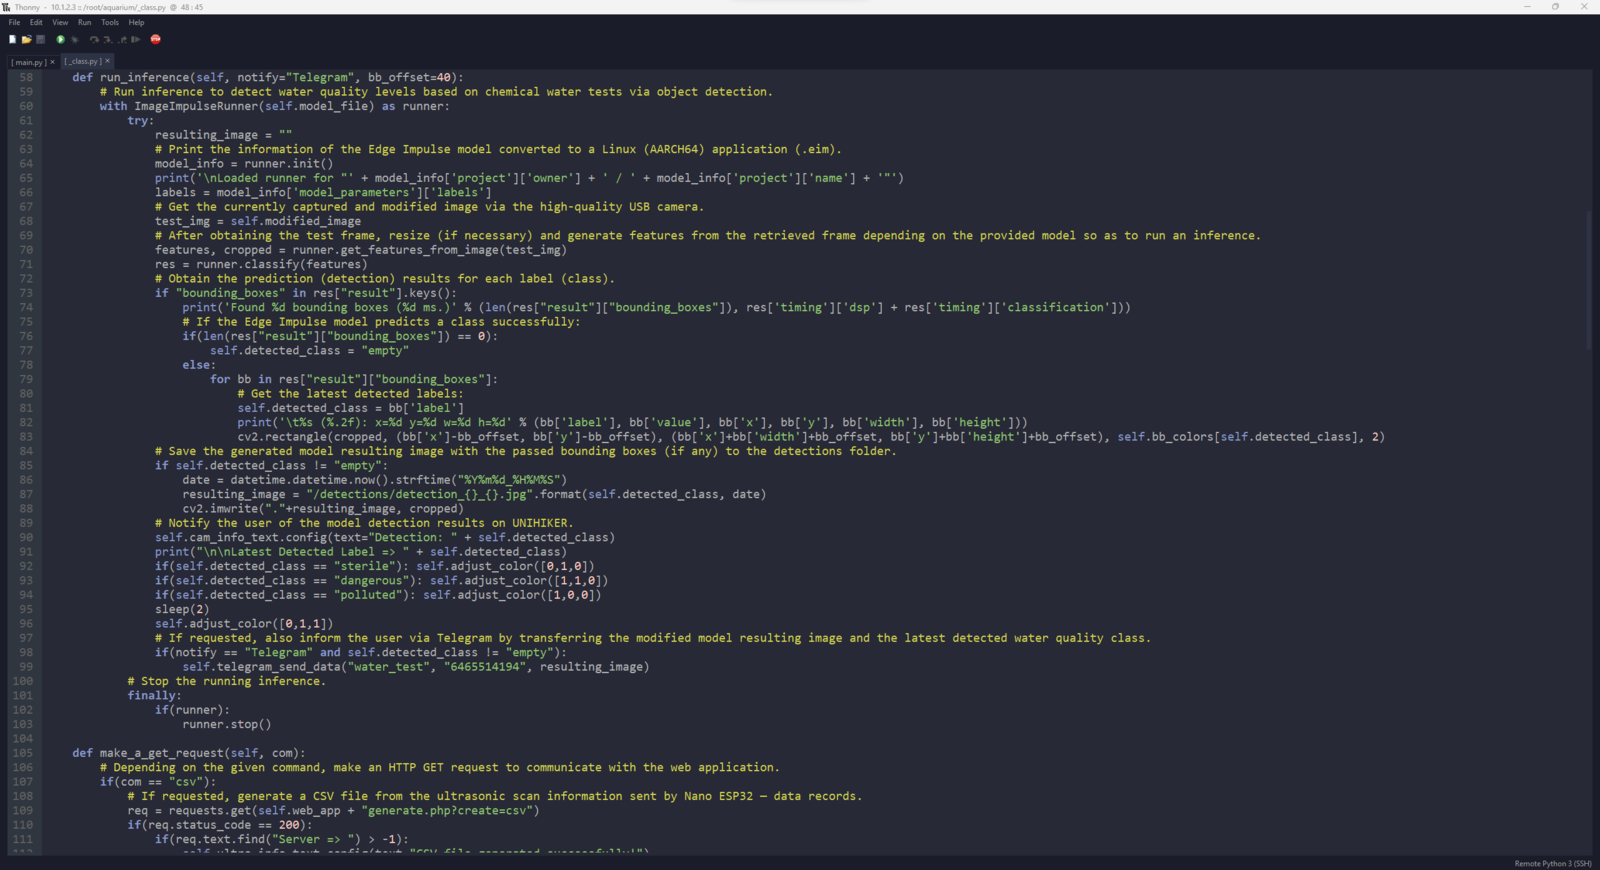
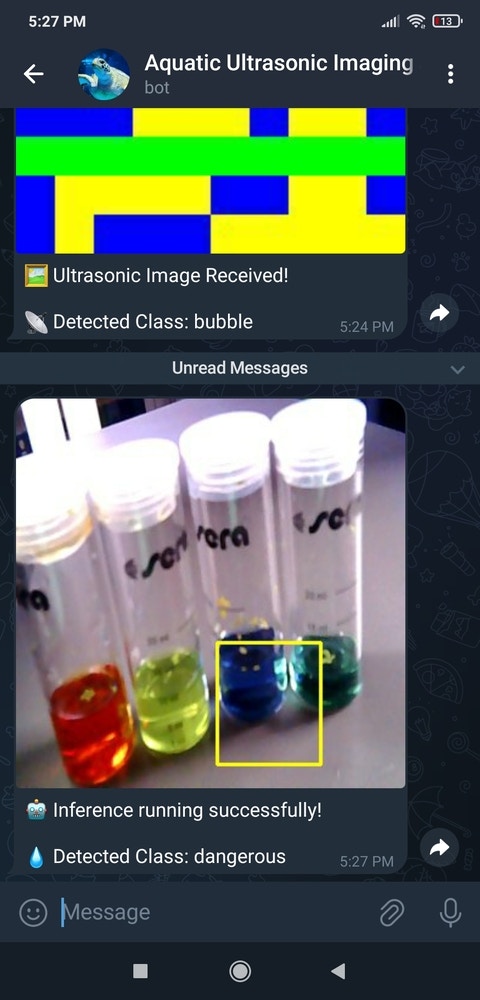
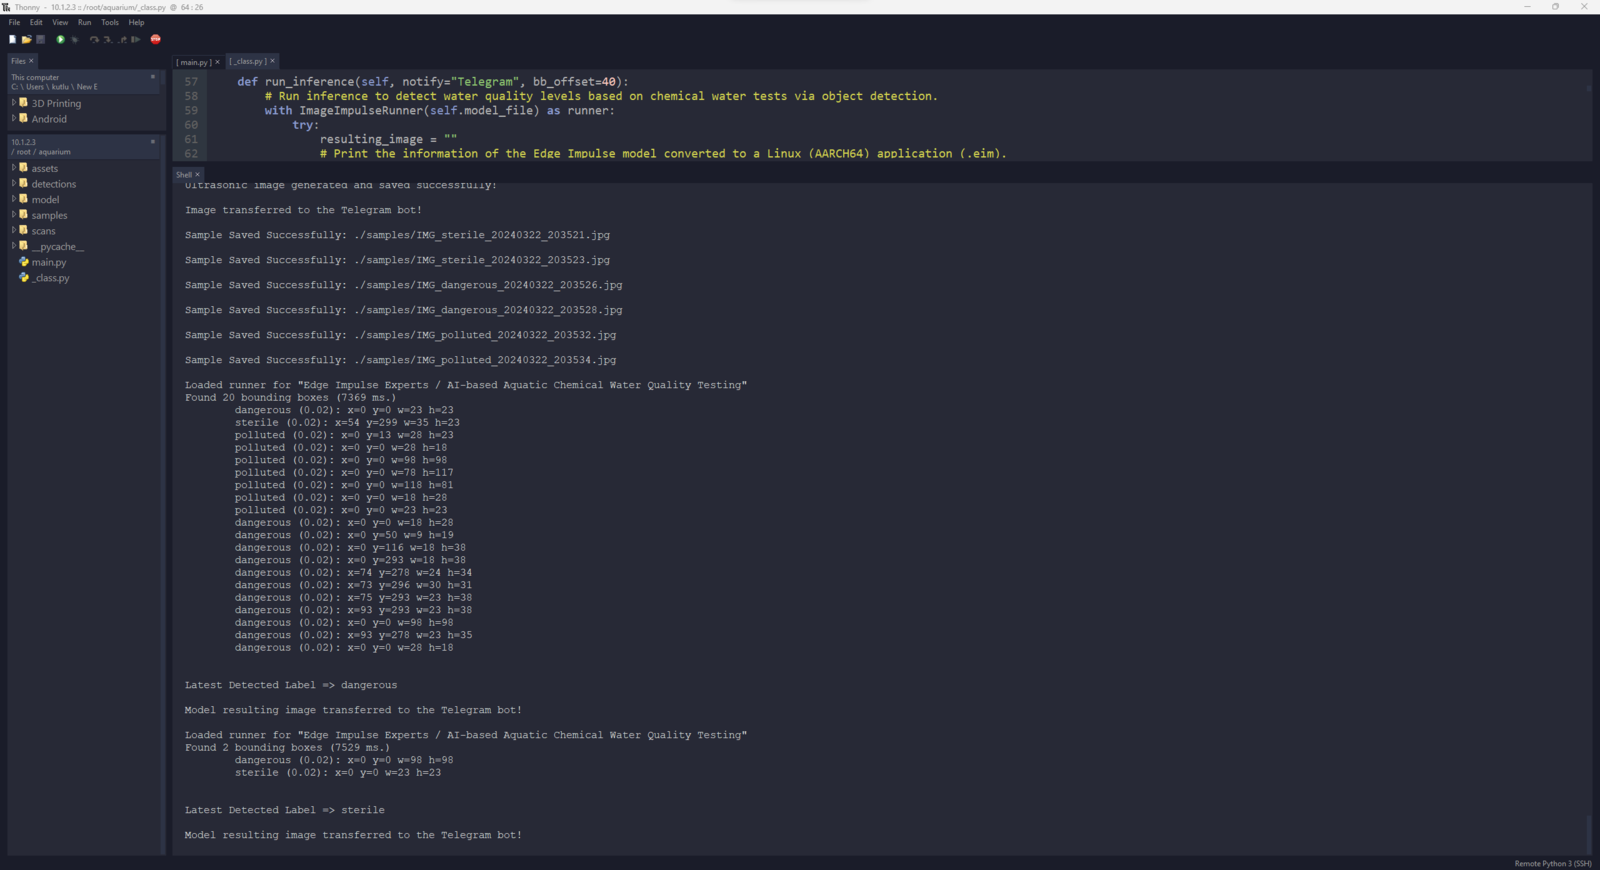
Step 15: Running the RetinaNet model to assess water pollution levels and inform the user via Telegram
My Edge Impulse object detection (NVIDIA TAO RetinaNet) model scans a captured image frame and predicts the possibilities of trained labels to recognize a target object on the given picture. The prediction result (score) represents the model’s “confidence” that the detected target object corresponds to each of the three different labels (classes) [0 - 2], as shown in Step 11:- 0 — dangerous
- 1 — polluted
- 2 — sterile
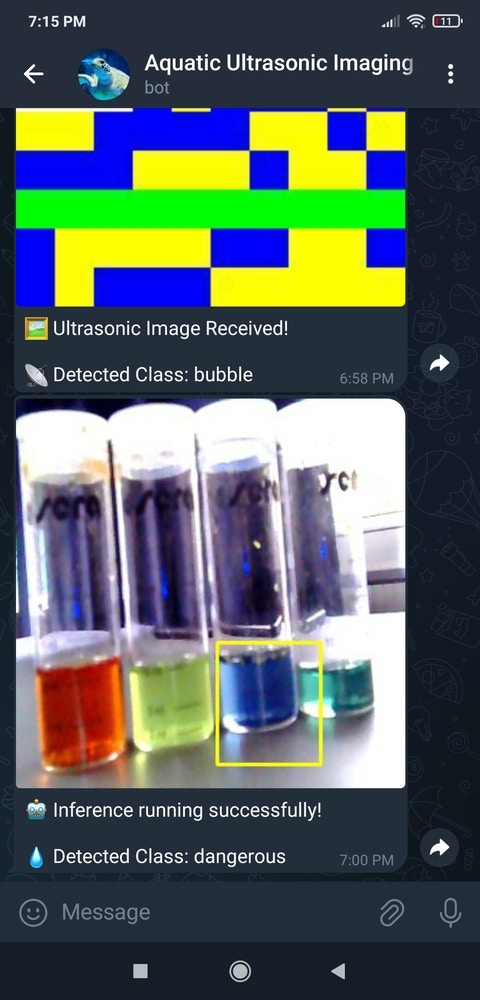
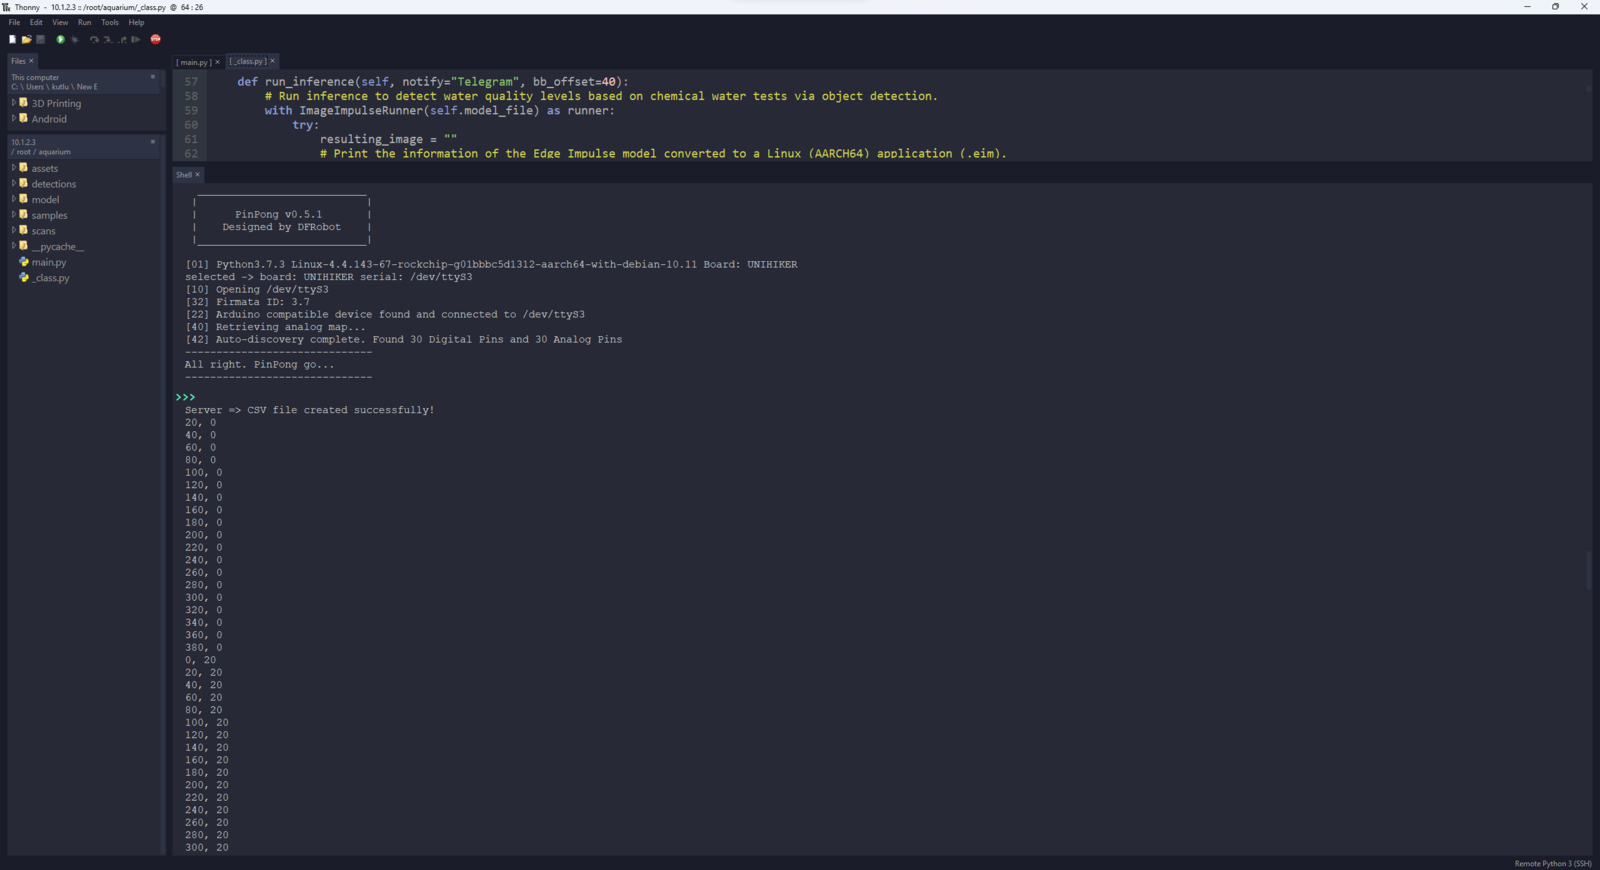
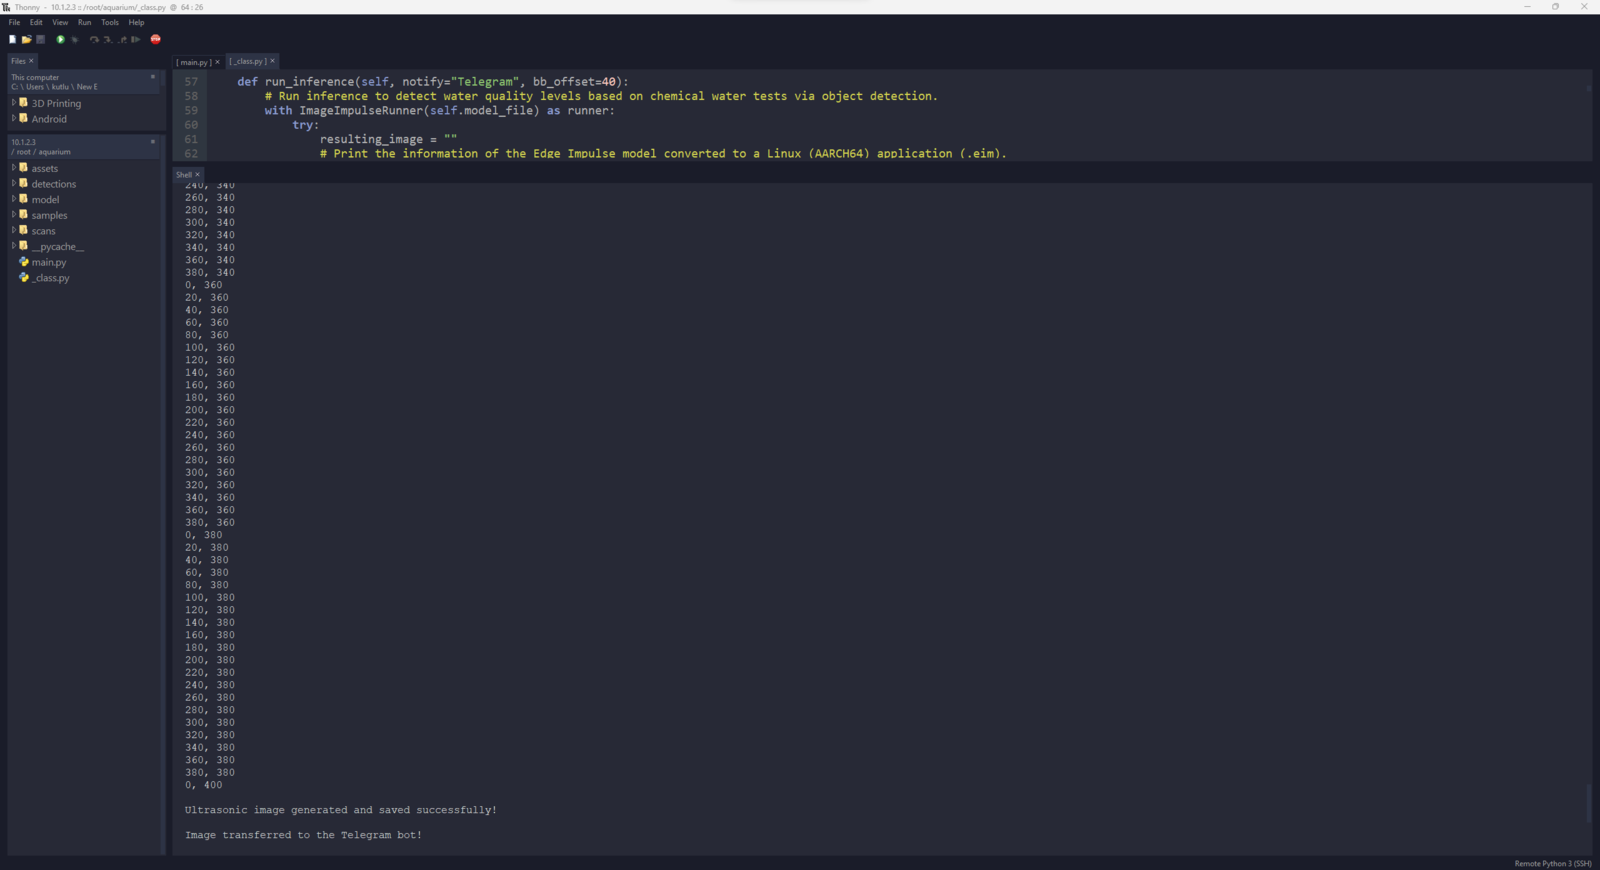
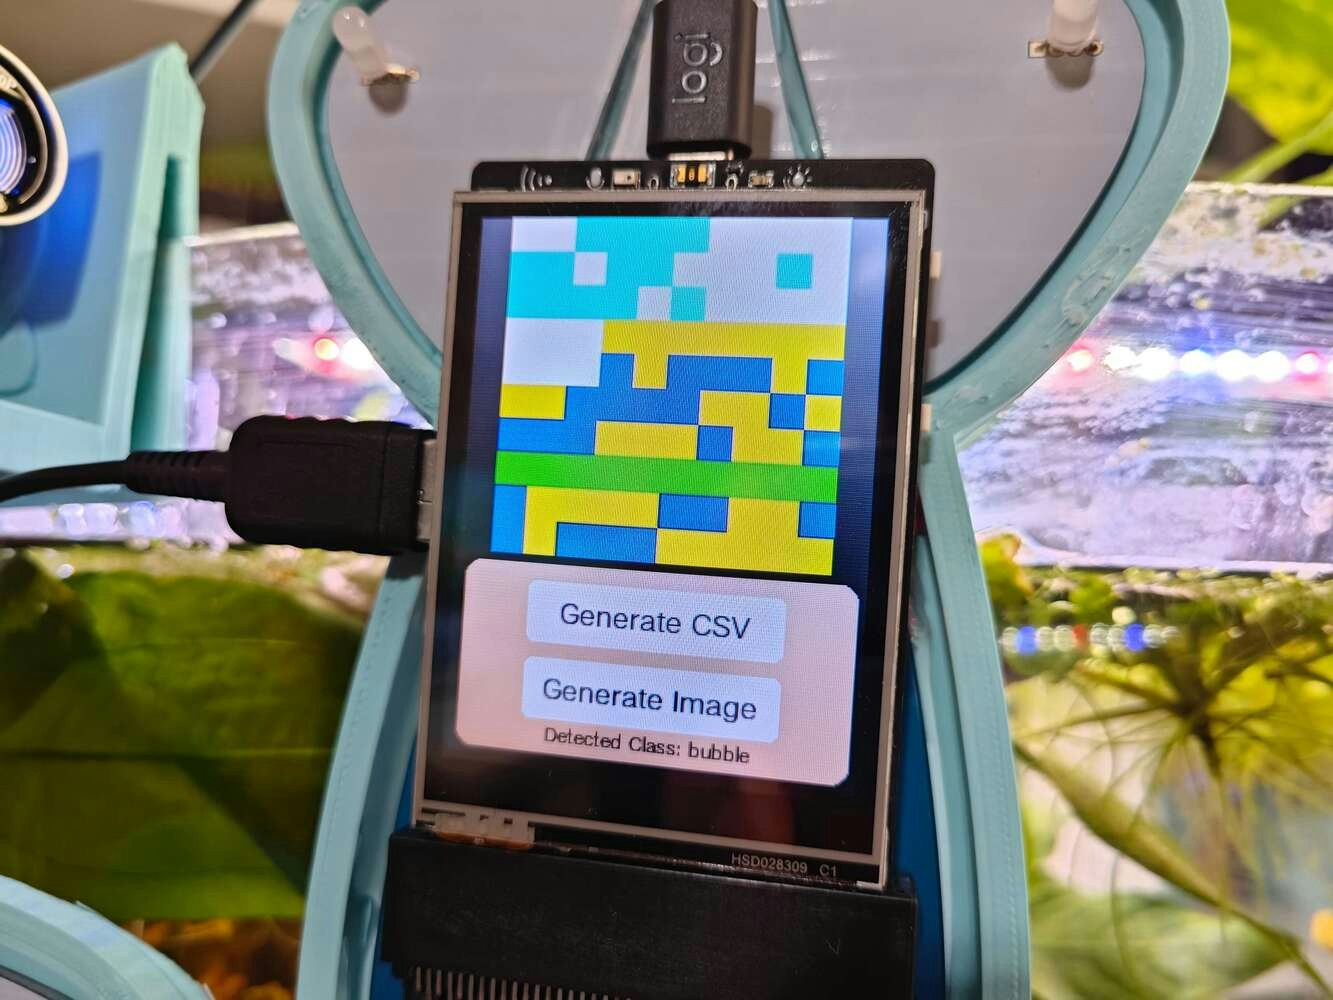
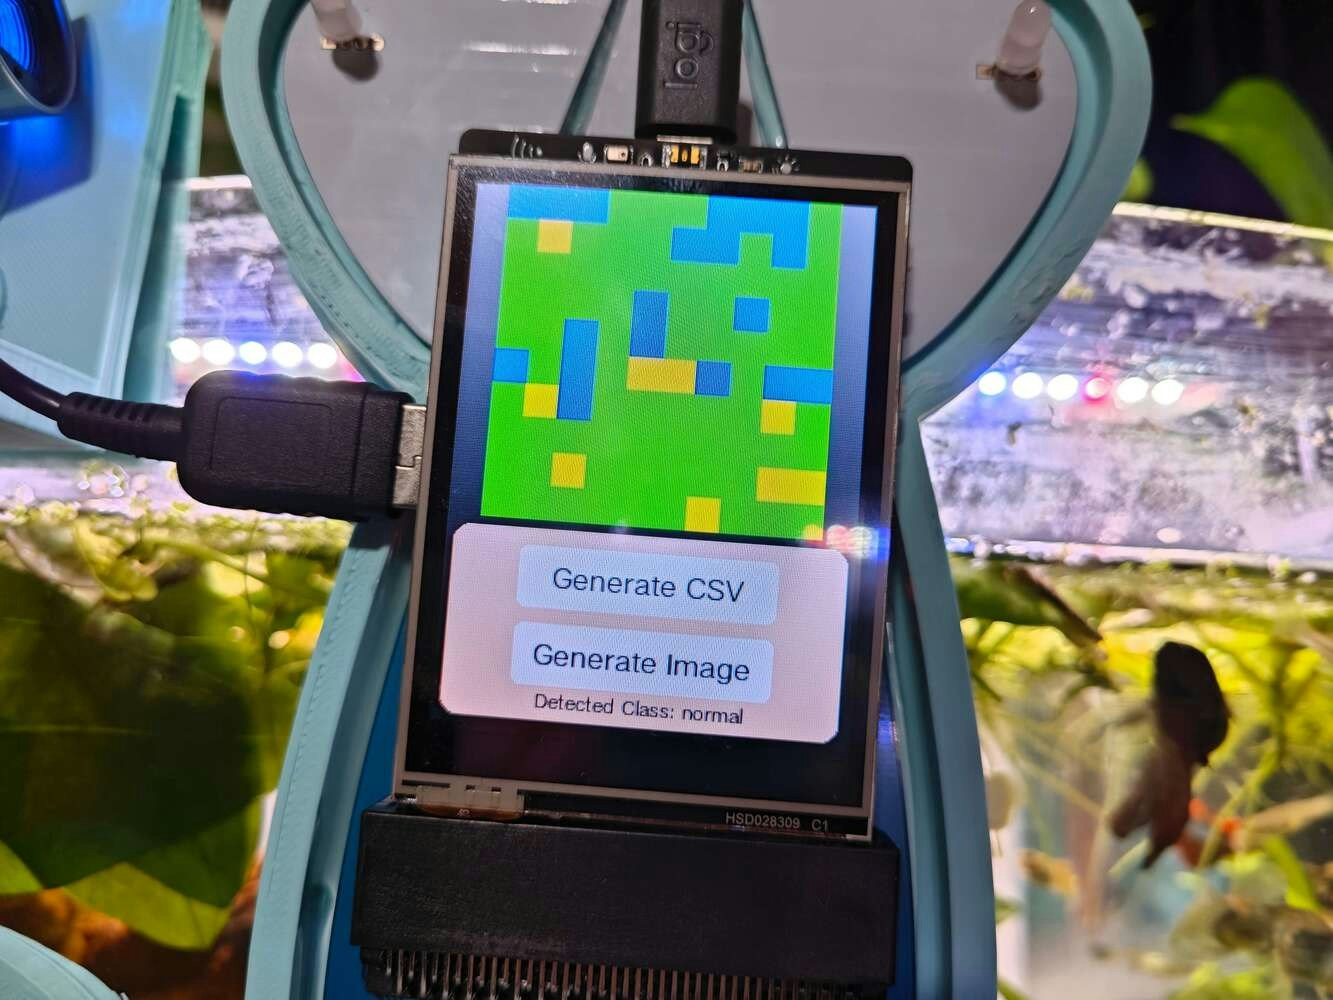
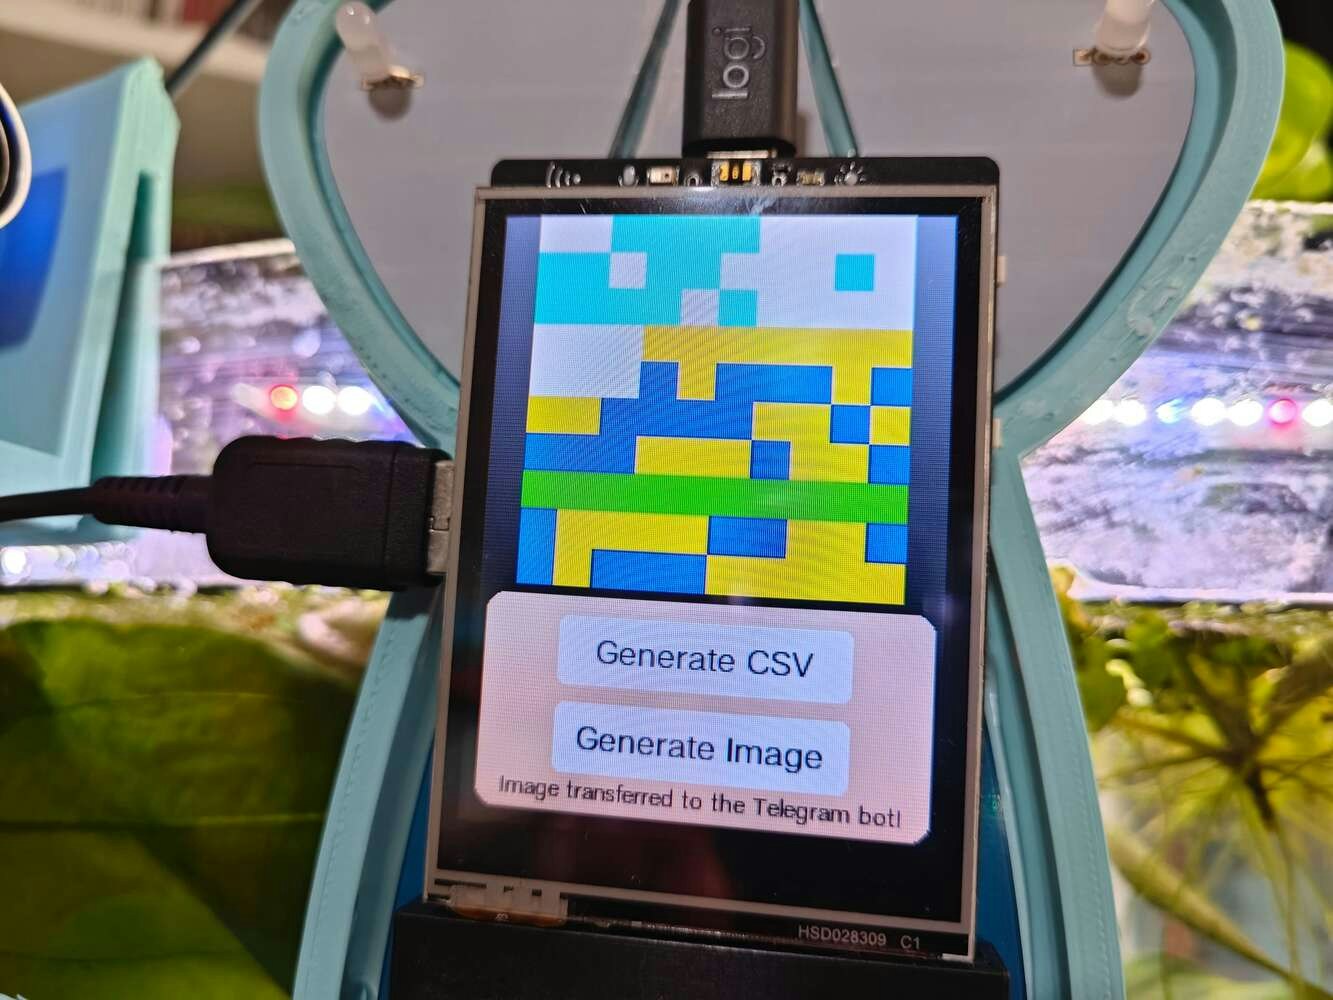
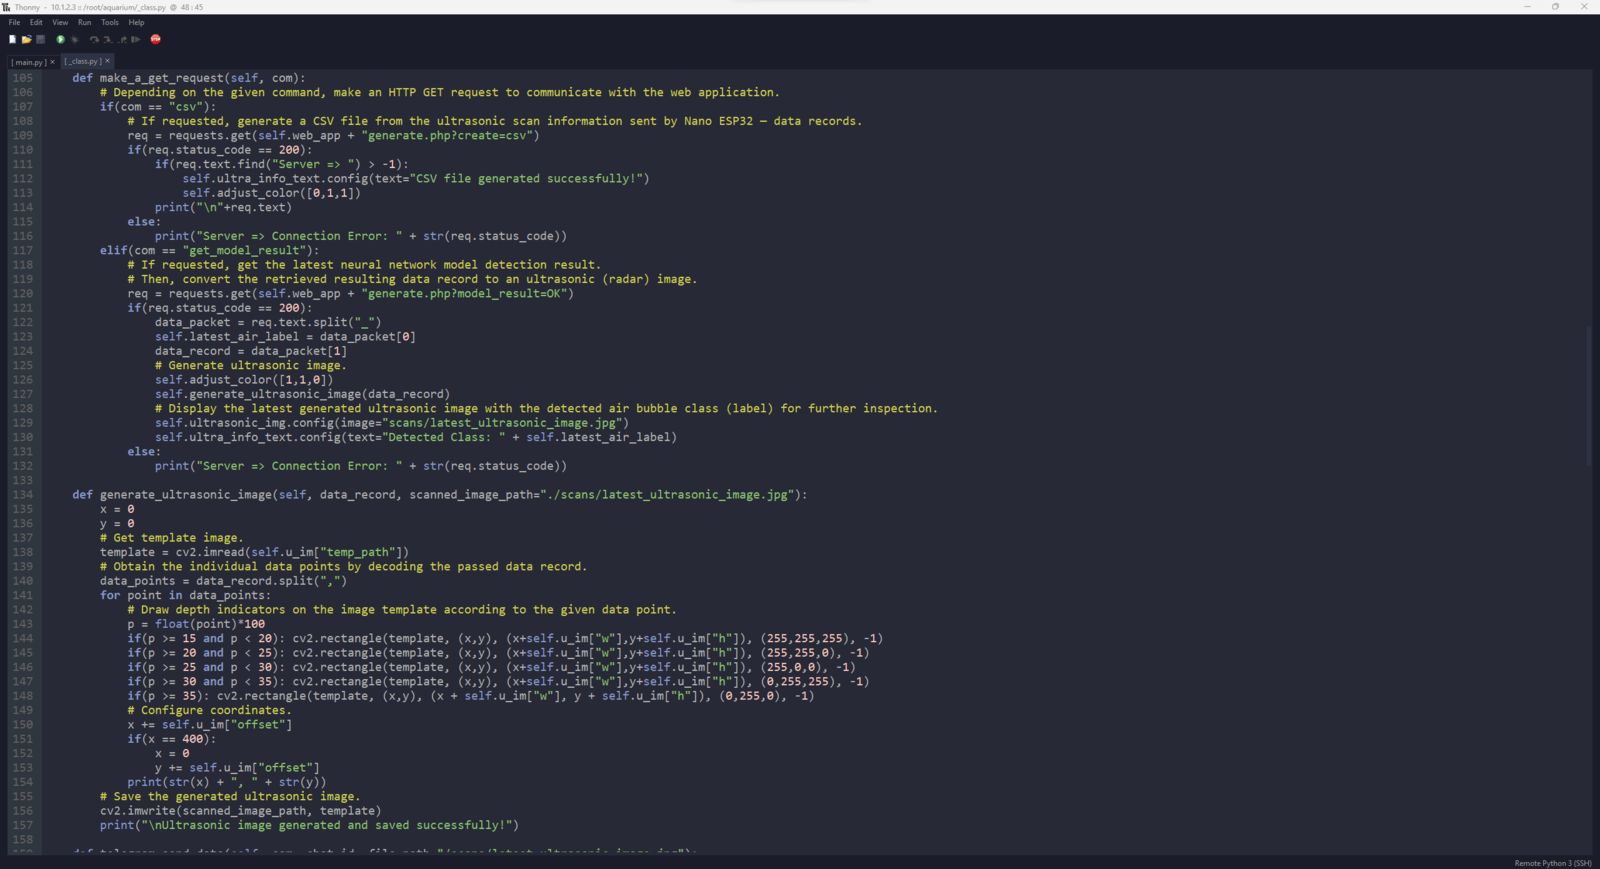
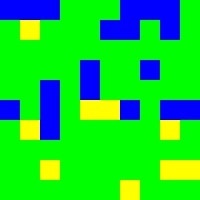
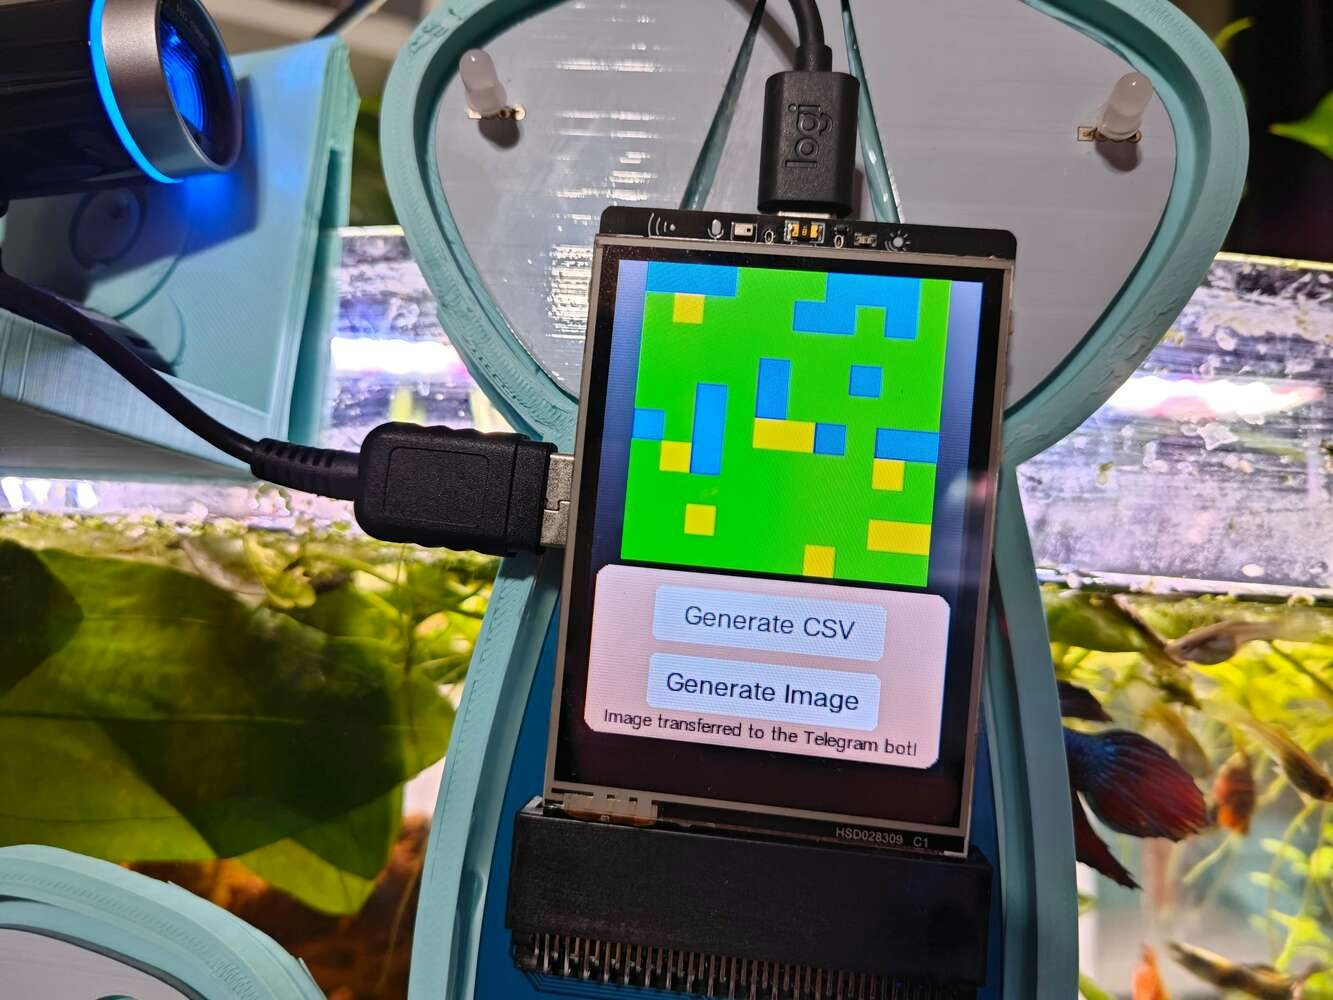
Step 15.1: Producing aquatic ultrasonic images from buffers to visualize harmful air bubbles
As mentioned repeatedly, Nano ESP32 cannot convert the produced ultrasonic scan buffers to ultrasonic images after running the neural network model. Thus, I provided additional features via the UNIHIKER user interface (GUI) so as to enable UNIHIKER to access the neural network model results via the web application. 🐠📡💧📊 If the user clicks the Aquatic Ultrasonic Scan button, the device opens the Aquatic Ultrasonic Scan section.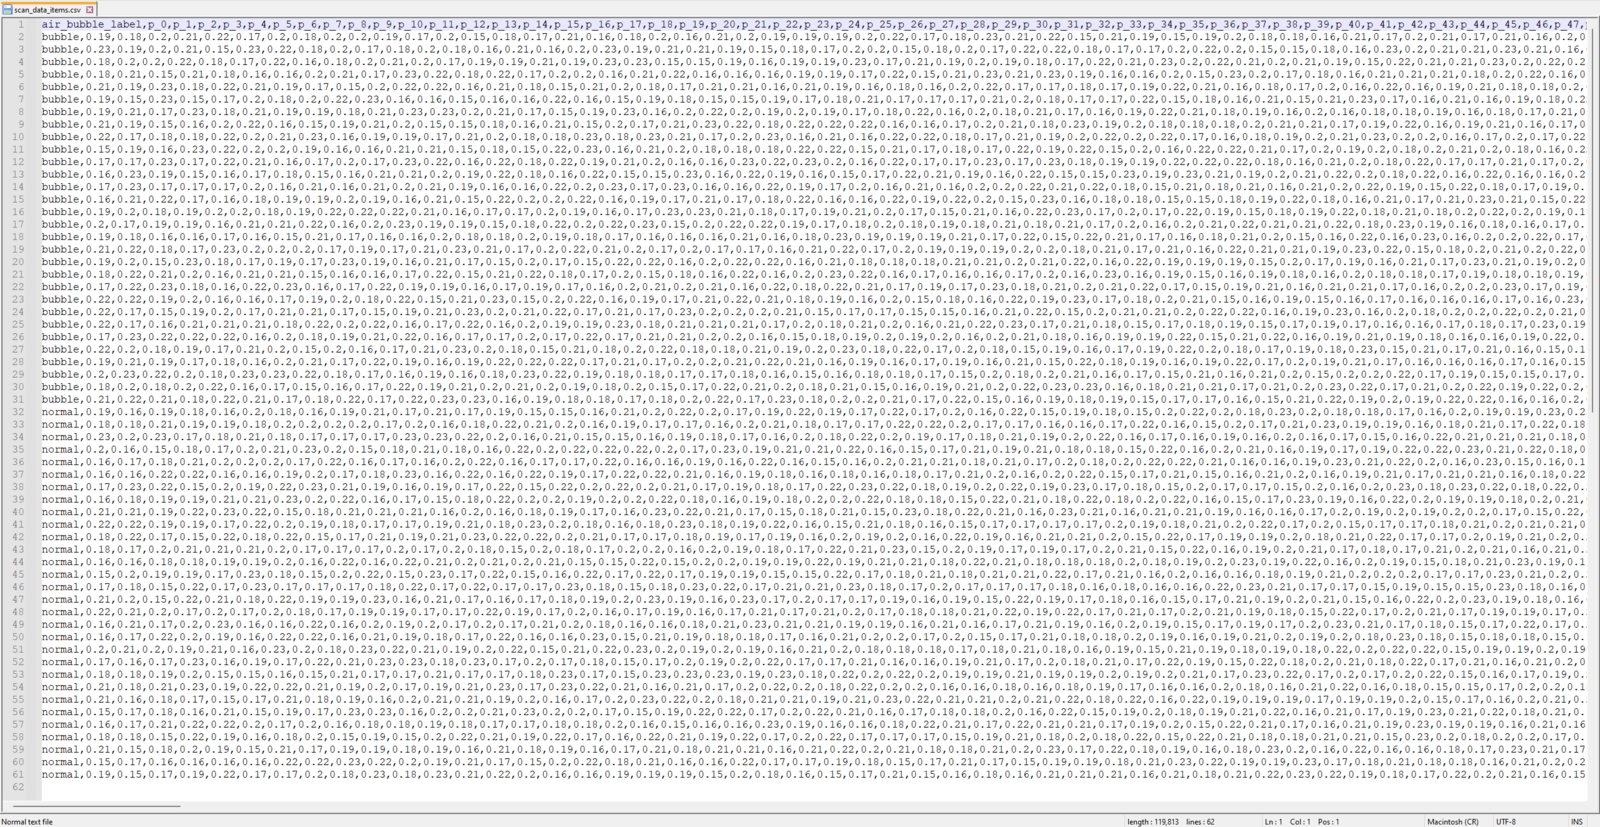
- 15 <= p < 20 ➡ (255,255,255)
- 20 <= p < 25 ➡ (255,255,0)
- 5 <= p < 30 ➡ (255,0,0)
- 30 <= p < 35 ➡ (0,255,255)
- p >= 35 ➡ (0,255,0)

Videos and Conclusion
Aquarium Progression (Time-lapse) | AI-based Aquatic Ultrasonic Imaging & Chemical Water Testing Toxic Underwater Air Bubbles | AI-based Aquatic Ultrasonic Imaging & Chemical Water Testing Water Pollution Assessment | AI-based Aquatic Ultrasonic Imaging & Chemical Water TestingFurther Discussions
By applying advanced AI-powered multi-algorithm detection methods to identify toxic underwater air bubbles and assess water pollution based on chemical water quality tests, we can achieve to: 🐠📡💧📊 employ ultrasonic imaging as a nondestructive inspection method to identify air gaps and assess water pollution consecutively to find any underlying conditions of accumulating harmful underwater waste, 🐠📡💧📊 prevent contaminants from impinging on aquatic life, 🐠📡💧📊 avert algal blooms, hypoxia (dead zones), and expanding barren lands, 🐠📡💧📊 detect the surge of toxic air bubbles to preclude potential environmental hazards, 🐠📡💧📊 assist commercial aquaculture facilities in protecting aquatic life acclimatized to the enclosed water bodies, 🐠📡💧📊 help retail fish farms increase their profit and survival rates.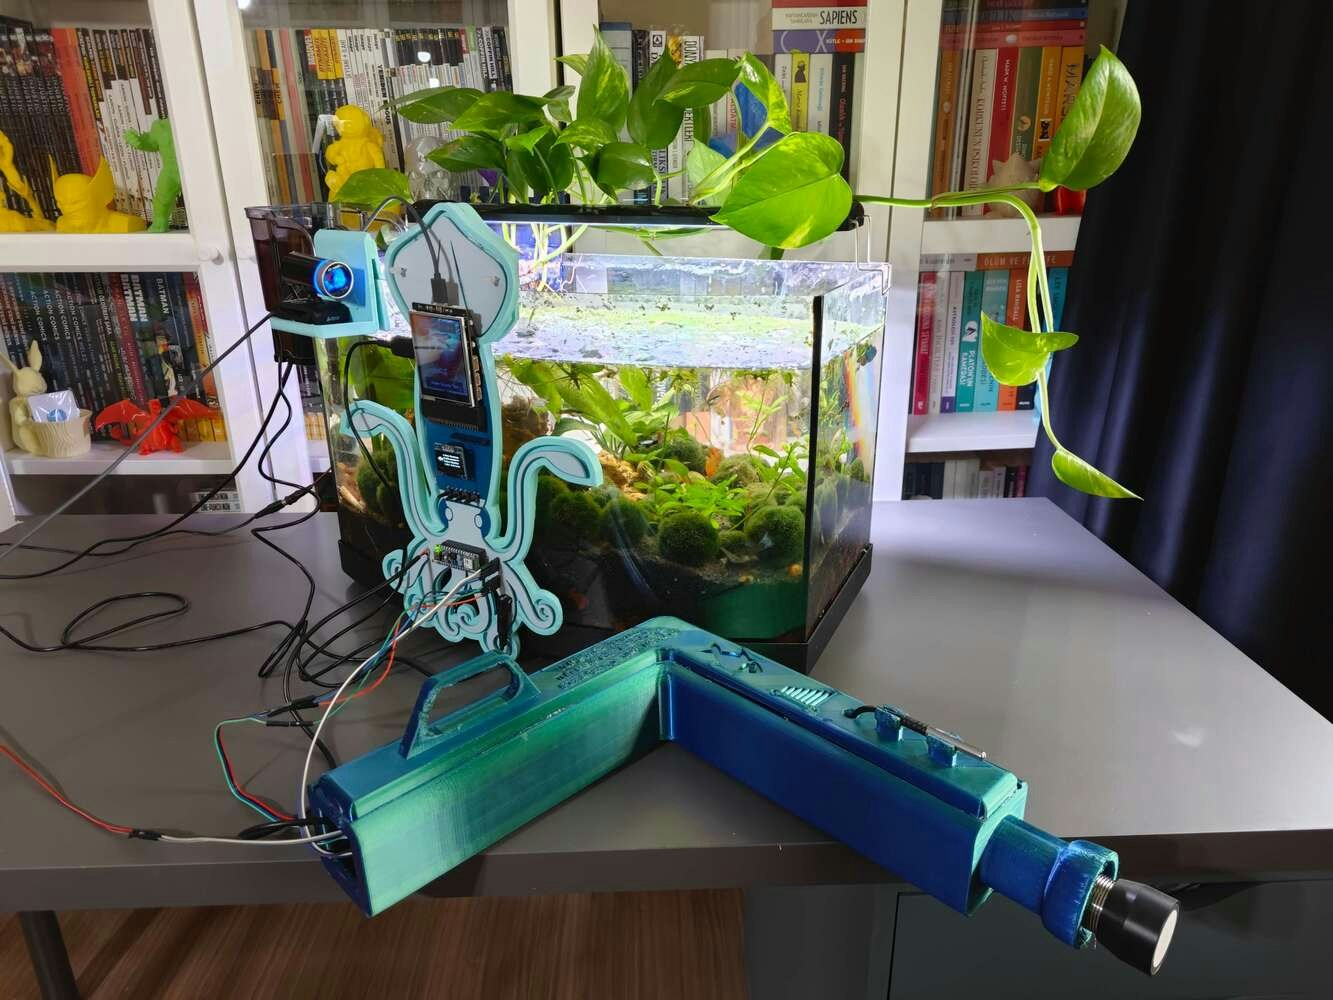
References
[^1] Ocean pollution and marine debris, National Oceanic and Atmospheric Administration, https://www.noaa.gov/education/resource-collections/ocean-coasts/ocean-pollution. [^2] Engler, Richard. (2012). The Complex Interaction between Marine Debris and Toxic Chemicals in the Ocean. Environmental science & technology. https://www.researchgate.net/publication/232609179_The_Complex_Interaction_between_Marine_Debris_and_Toxic_Chemicals_in_the_Ocean.Schematics