Description
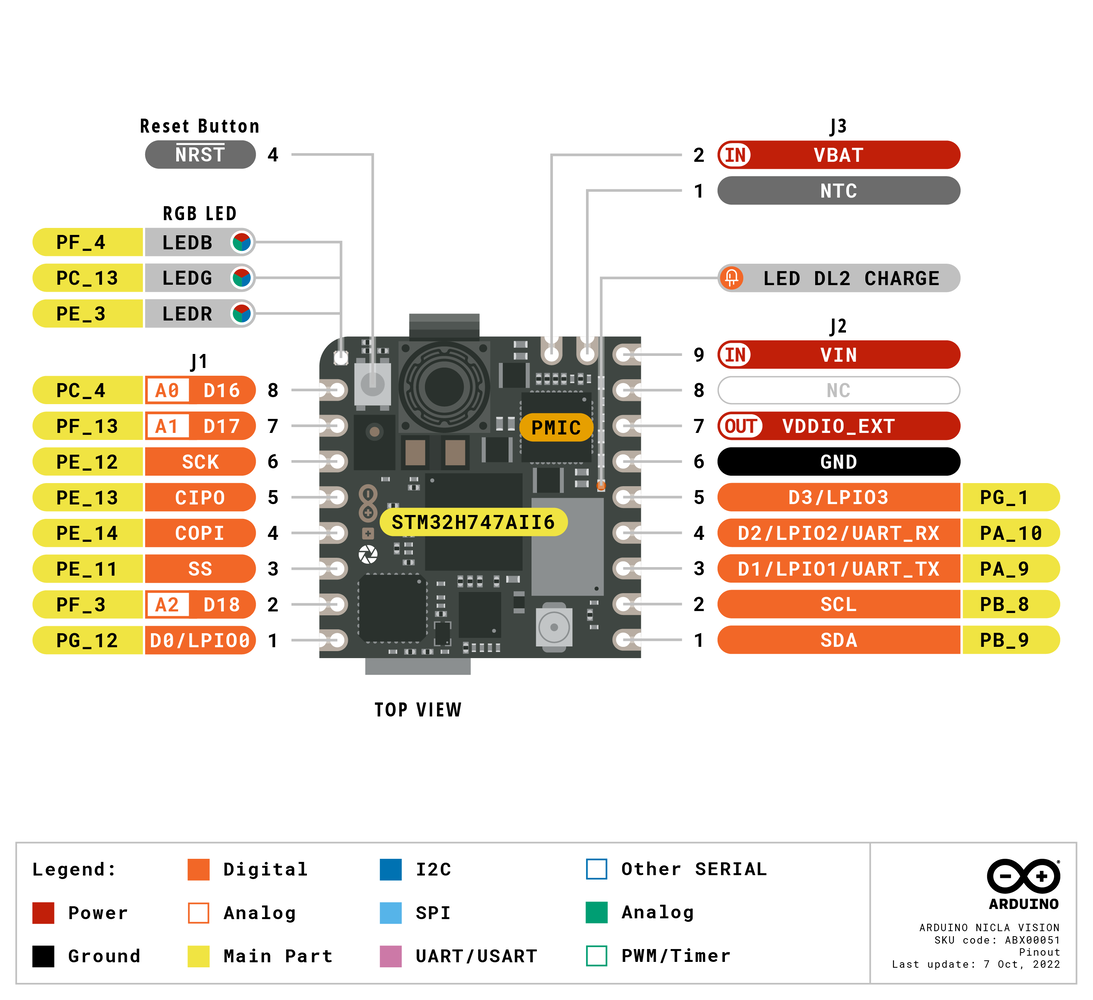
Since the beginning of the industrial revolution, accurate pipeline system maintenance has been crucial to keeping machine operations sustainable, profitable, and stable. Even though all machine parts and control units evolved from occupying rooms to fitting in our packets, pipeline system maintenance is still one of the most important aspects of keeping machines healthy while running automated manufacturing operations. From cooling processors with water on motherboards to supplying liquefied metal alloy or plastic for injection molding processes, a faulty pipeline system can engender various manufacturing problems while running machine operations, especially for small businesses with limited budgets not enough to cover expensive overhauling costs. Therefore, establishing an efficient and accurate pipeline diagnostics mechanism conforming to general maintenance regulations can assist technicians in keeping machines durable far more than anticipated and prevent companies from squandering their resources on replacing or repairing high-value machine components due to the omission of proper pipeline diagnostics. Pipe cracks are one of the most common defects while transferring liquids, especially with differing thermal conditions. During machine operations, mechanical and thermal stress cause minute defects in pipelines due to fatigue. When these small defects accumulate, the outcome mostly results in a varying inside turbulent pressure, which leads to slight form (shape) disfigurations, resulting in gradual deficiency over time due to tension. Furthermore, depending on operation processes and environment, there are lots of possible pipeline defects in addition to cracks, such as corrosion, abrasion, clogged joints due to chemical residue, leaking connection points due to high gas emissions, etc. Although there are different external pipeline inspection devices utilizing computer vision (camera), magnetic field measurements, and acoustic detection (microphone)[^1], these methods cannot be applied interchangeably to different pipeline systems. For instance, a device utilizing object detection with a thermal camera may not be able to detect internal crystals due to high gas permeability in a pipeline system transporting antifreeze to cool components. Nonetheless, some groundbreaking new methods aim to detect potential pipeline system failures by examining changes in the vibration characteristics. Since accumulating stress due to pipeline defects affects material integrity and structure gradually, these failures can be detected by inspecting fluctuating vibrations as a non-destructive testing and evaluation (NDT&E) mechanism. For example, in recent examinations, researchers applied ground penetrating radar (GPR) to detect cracks in a buried pipe[^2] and microwave-based synthetic aperture radar (SAR) to inspect pipeline defects[^3]. After perusing recent research papers on pipeline diagnostics based on vibrations, I noticed there are nearly no appliances focusing on collecting data from a mmWave radar module to extract data parameters, detecting potential pipeline defects, and providing real-time detection results with captured images of the deformed pipes for further examination. Therefore, I decided to build a budget-friendly and compact mechanism to diagnose pipeline defects with machine learning and inform the user of the model detection results with captured images of the deformed pipes simultaneously, in the hope of assisting businesses in keeping machines durable and stable by eliminating basic pipeline defects. To diagnose different pipeline defects, I needed to collect accurate vibration measurements from a pipeline system so as to train my neural network model with notable validity. Therefore, I decided to build a simple pipeline system by utilizing pipes and fittings (adapters) with mediocre thermal conductivity, demonstrating three different pipeline defects in each primary section — color-coded. Since Seeed Studio provides mmWave radar modules with built-in algorithms to detect minute vibration changes to evaluate respiratory rate, heart rate, and sleep status, I decided to utilize a 60GHz mmWave module to extract my data parameters via the mentioned algorithms. Since Arduino Nicla Vision is a ready-to-use and compact edge device with a 2MP color camera and integrated WiFi/BLE connectivity, I decided to use Nicla Vision so as to run my neural network model, capture images of the deformed pipes, and inform the user of the model detection results with the captured pipe images. Due to architecture and library incompatibilities, I connected the mmWave module to Arduino Nano in order to extract and transmit radar data parameters to Nicla Vision via serial communication. Then, I connected four control buttons to Arduino Nano to send commands with the collected mmWave data parameters to Nicla Vision. Also, I added an ILI9341 TFT LCD screen to display the interface menu, including a custom radar indicator. Since I focused on building a full-fledged AIoT device diagnosing pipeline system defects, I decided to develop a web application from scratch providing various features to the user. Firstly, I employed the web application to obtain the collected mmWave data parameters with the selected label from Nicla Vision via an HTTP GET request, save the received information to a MySQL database table, and display the stored data records on its interface in descending order. Via a single HTML button on the interface, the web application can also generate a pre-formatted CSV file from the stored data records in the database without requiring any additional procedures. After completing my data set by collecting data from the custom pipeline system I assembled, I built my artificial neural network model (ANN) with Edge Impulse to make predictions on pipeline system defects (classes). Since Edge Impulse is nearly compatible with all microcontrollers and development boards, I had not encountered any issues while uploading and running my model on Nicla Vision. As labels, I utilized the three basic pipeline defects manifested by each main line (color-coded on the system):- Clogged
- Cracked
- Leakage
image
image
image
image
image
image
image

image
image
image
image

image
image
image
image
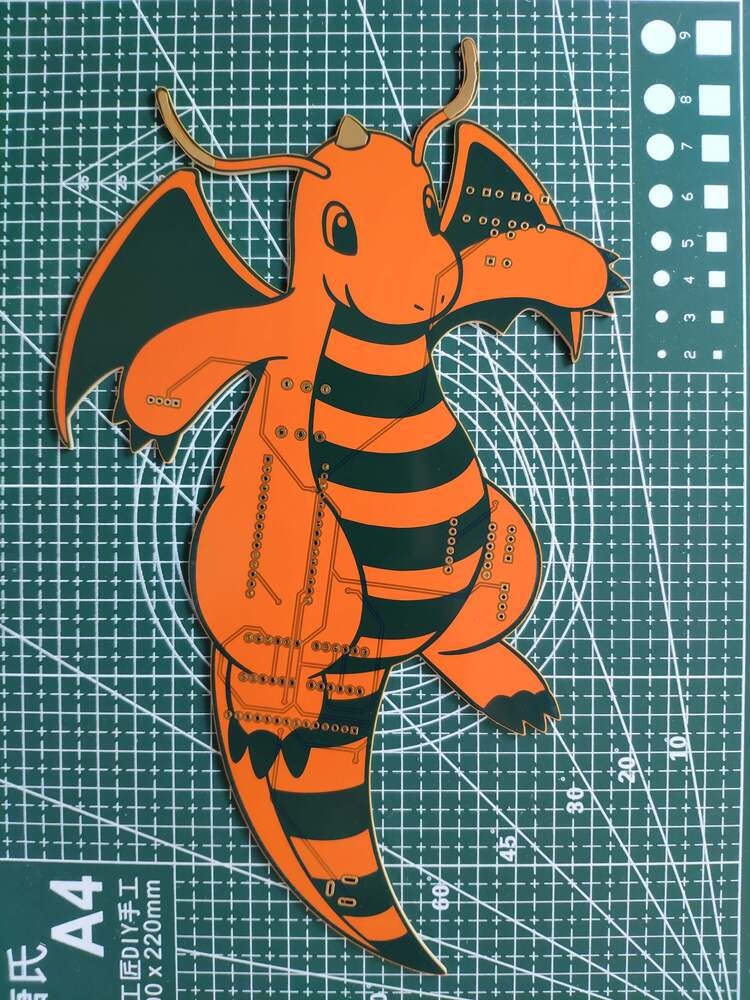
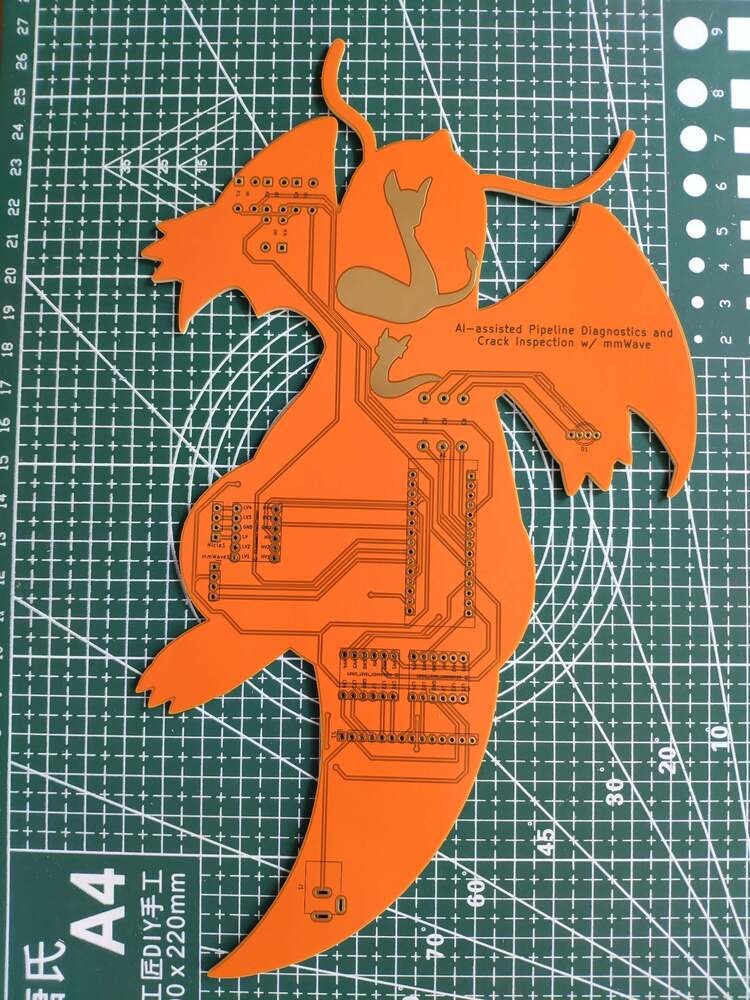
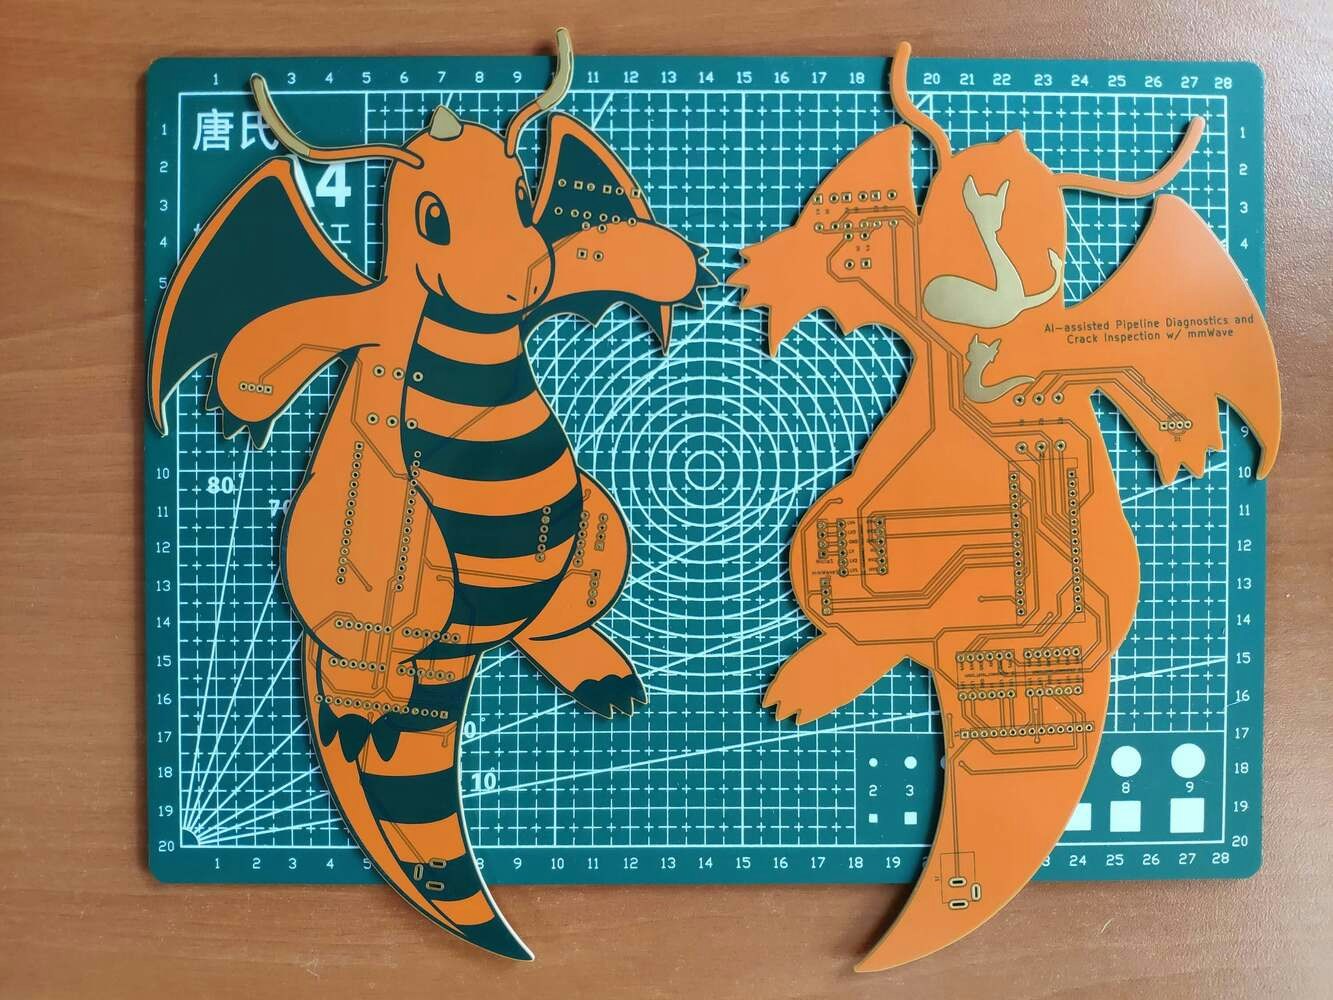
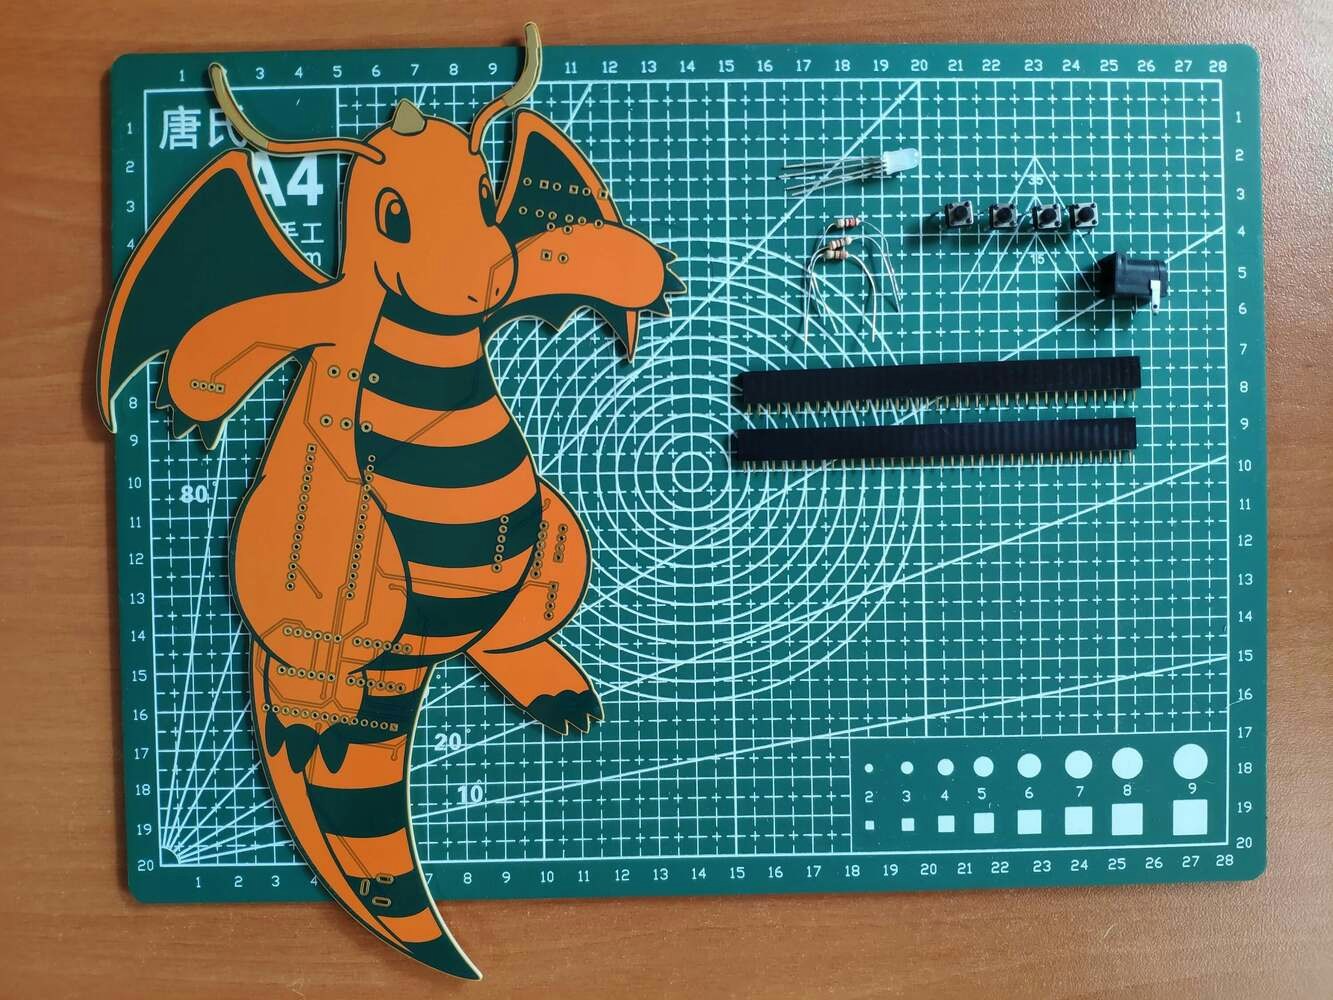
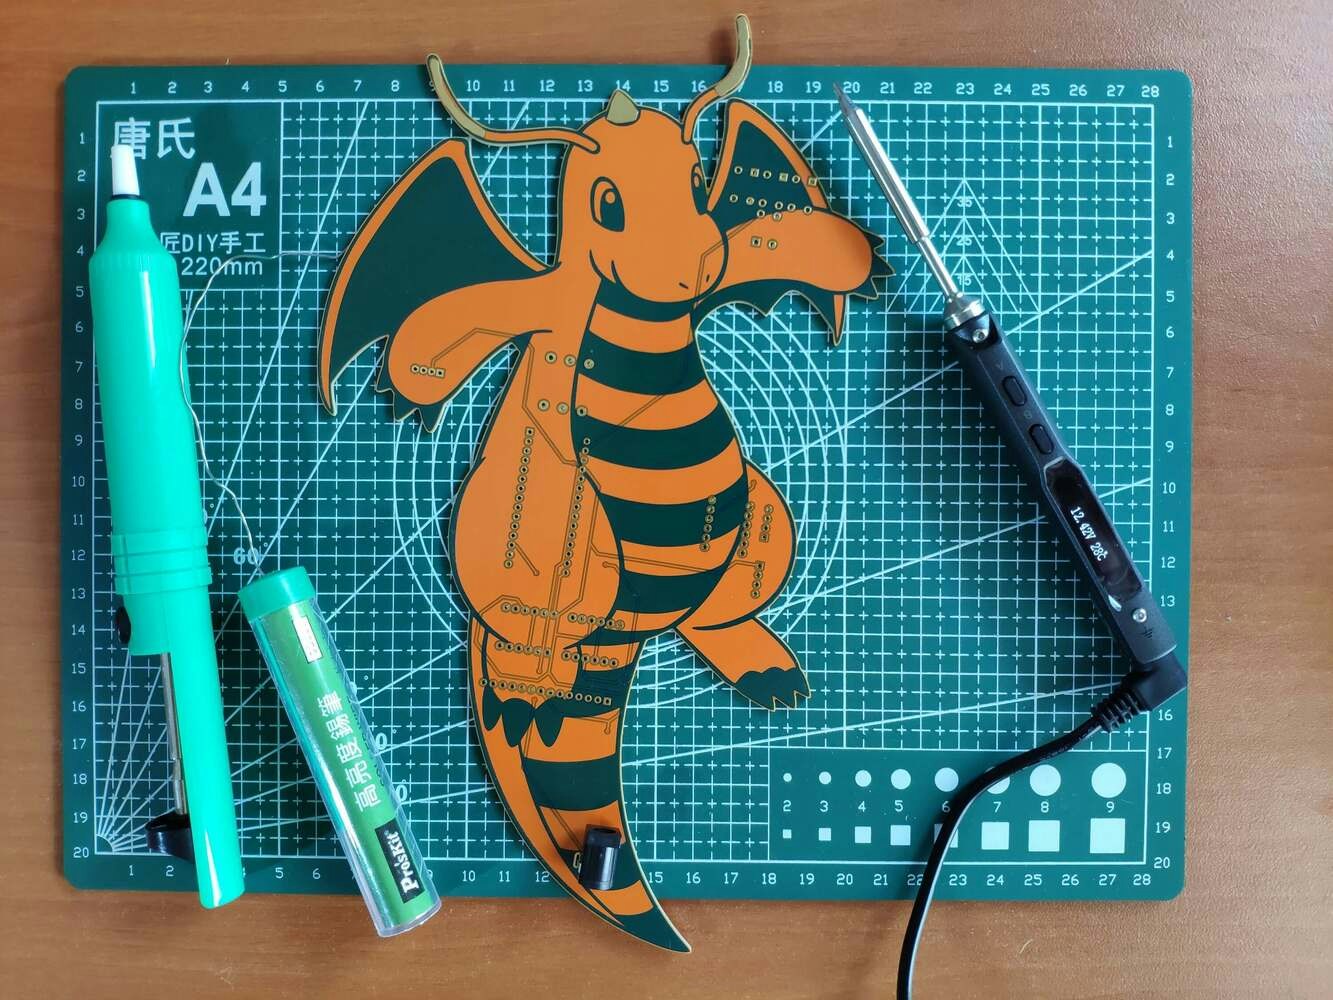
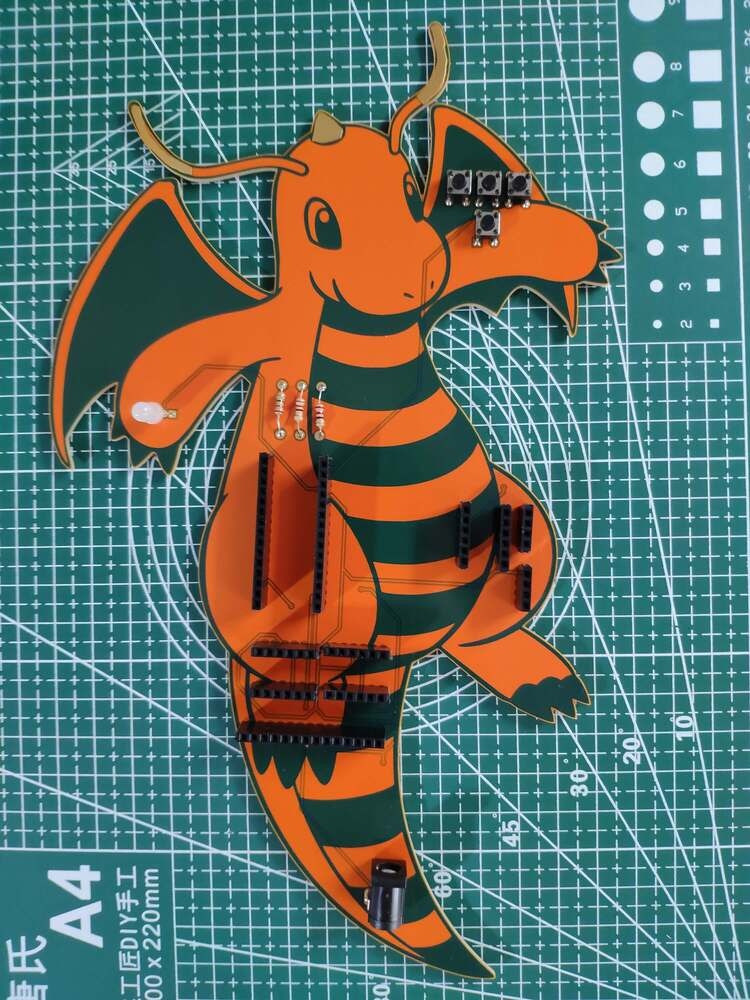
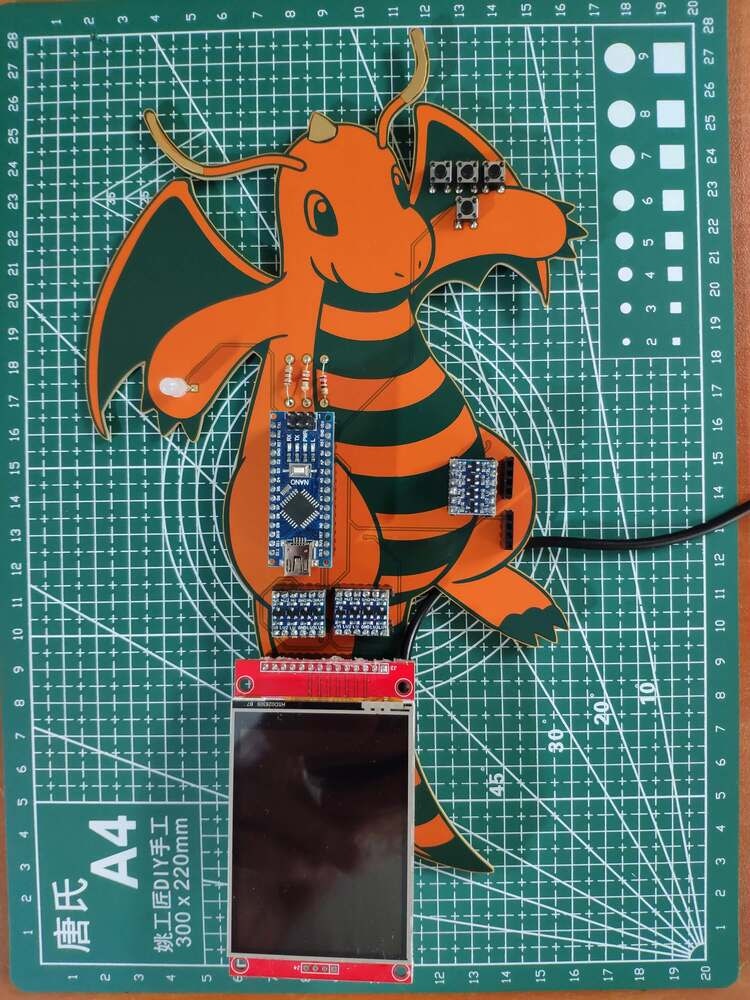
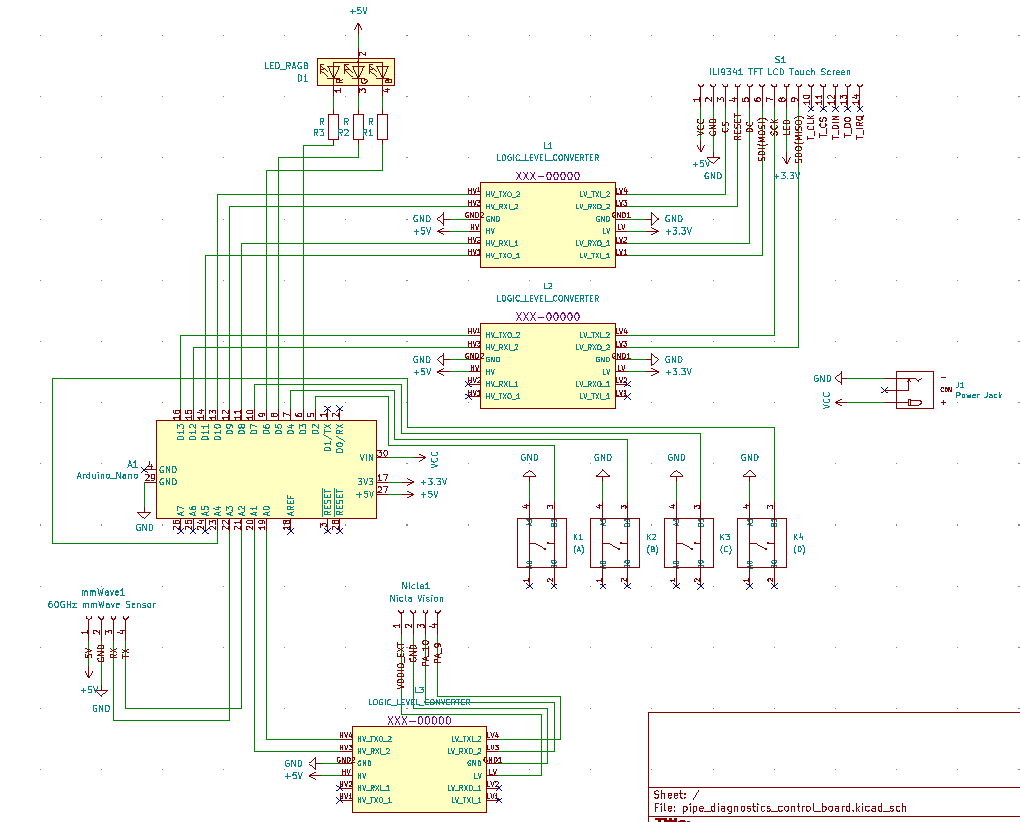
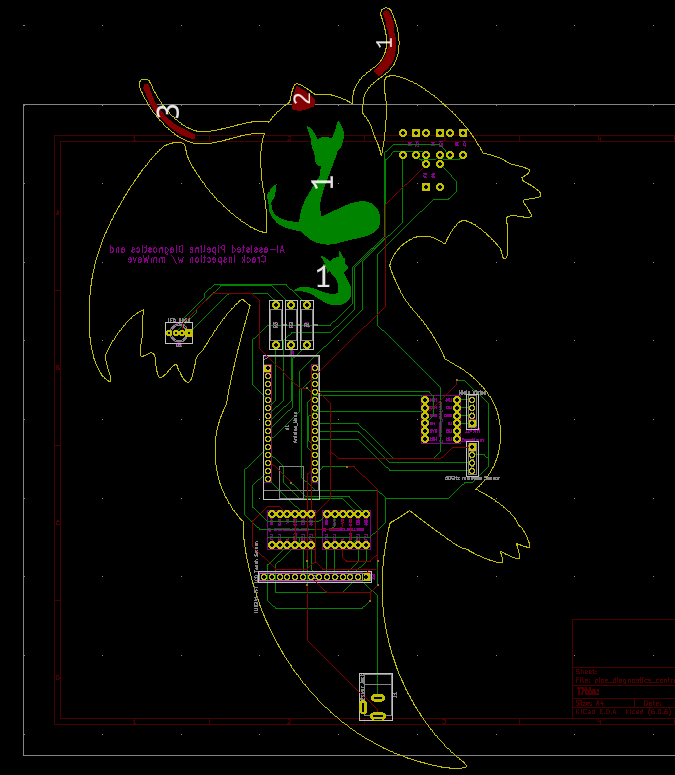
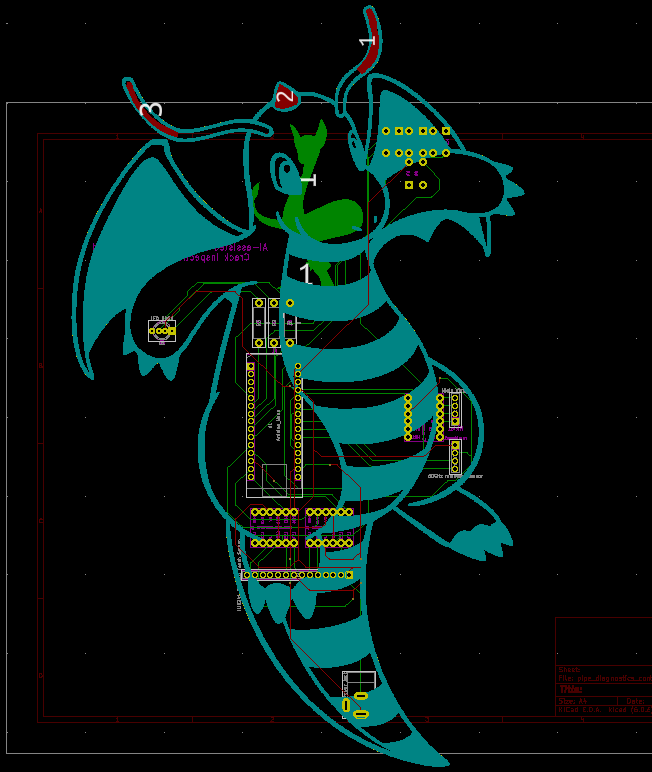
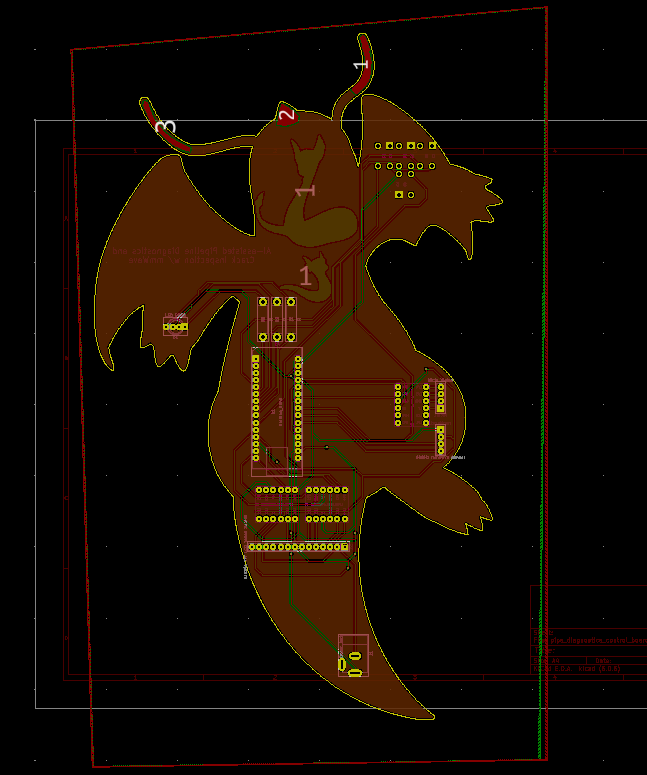
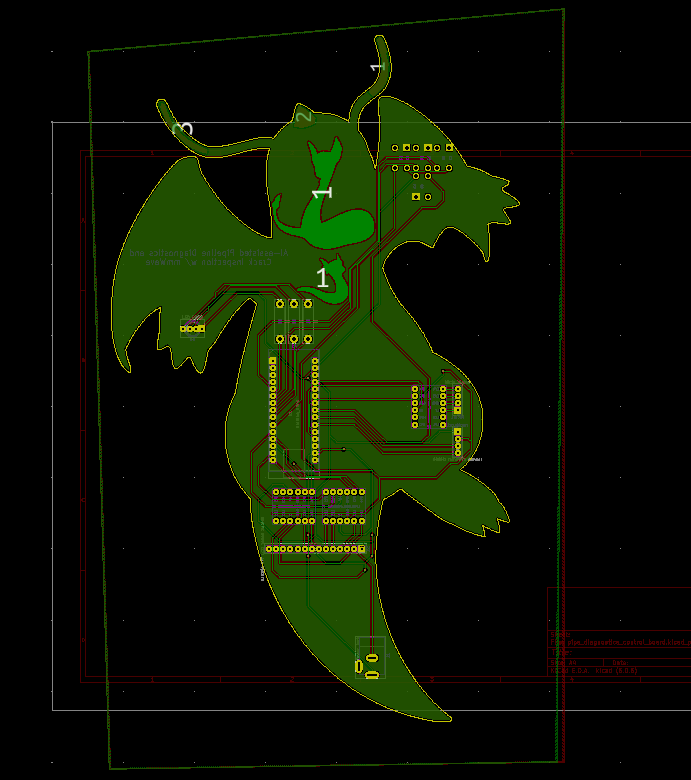
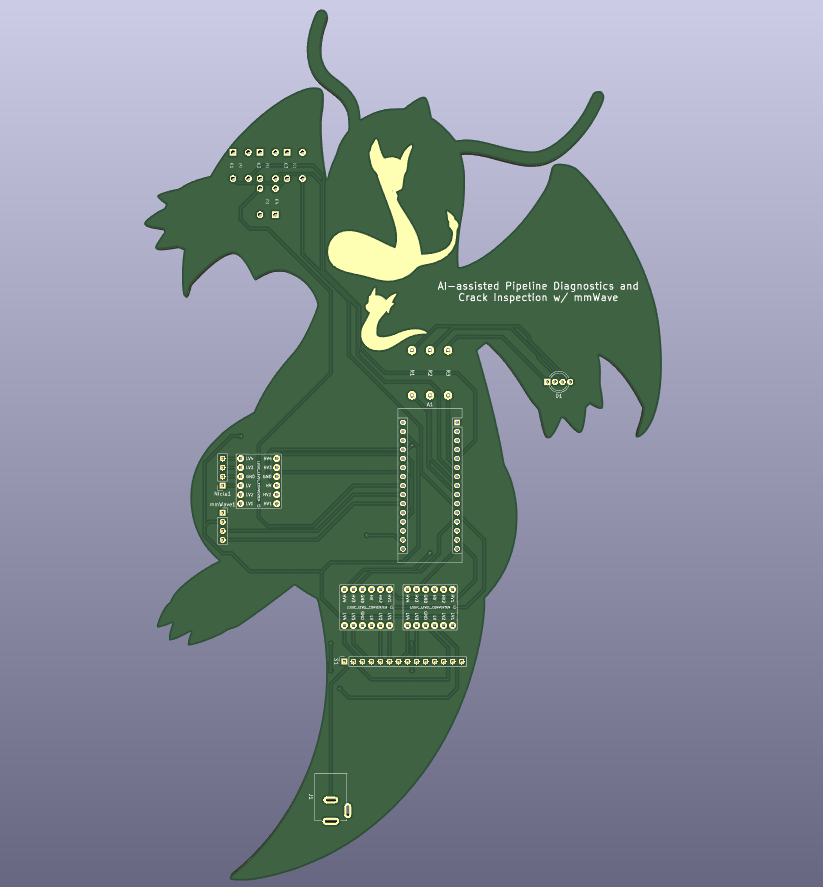
Step 1: Designing and soldering the Dragonite-inspired PCB
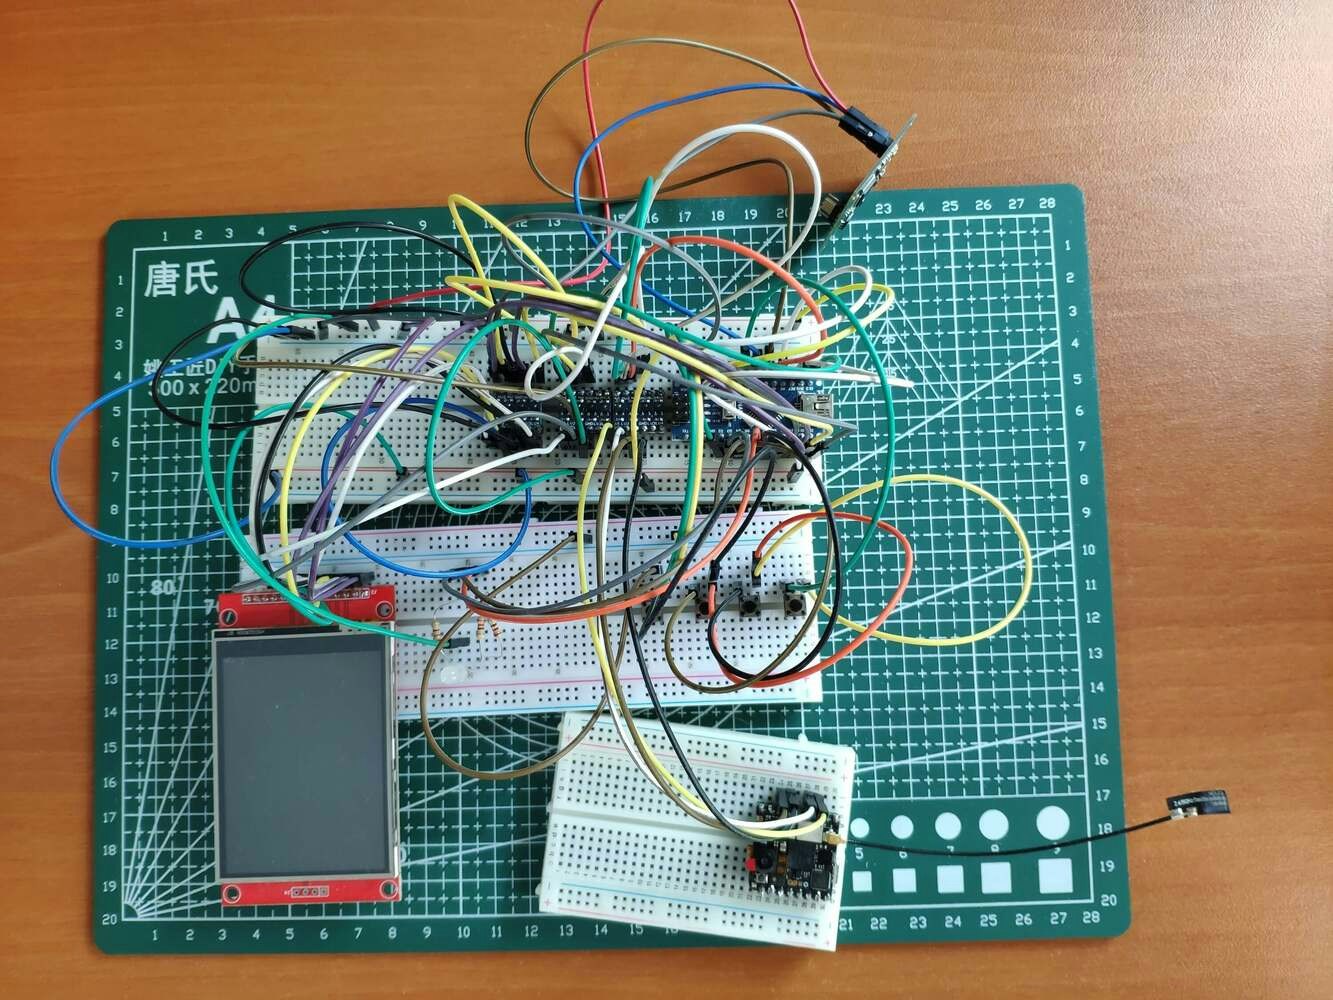
Before prototyping my Dragonite-inspired PCB design, I tested all connections and wiring with Nicla Vision and Arduino Nano. Then, I checked the data transfer processes between Nicla Vision and the web application hosted on LattePanda 3 Delta.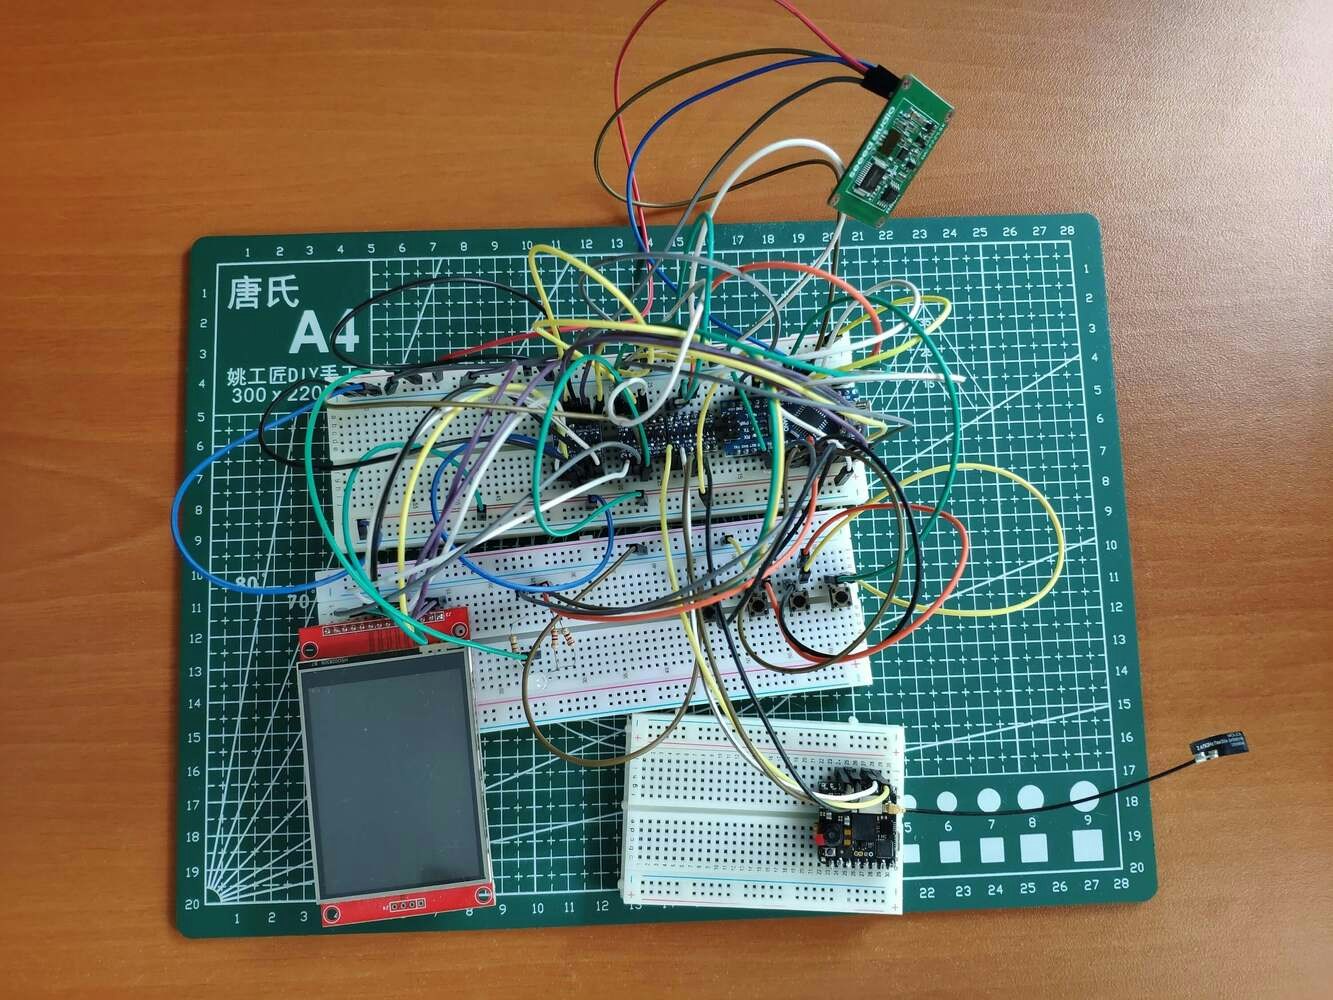
image
image
image
image
image
image
image
image
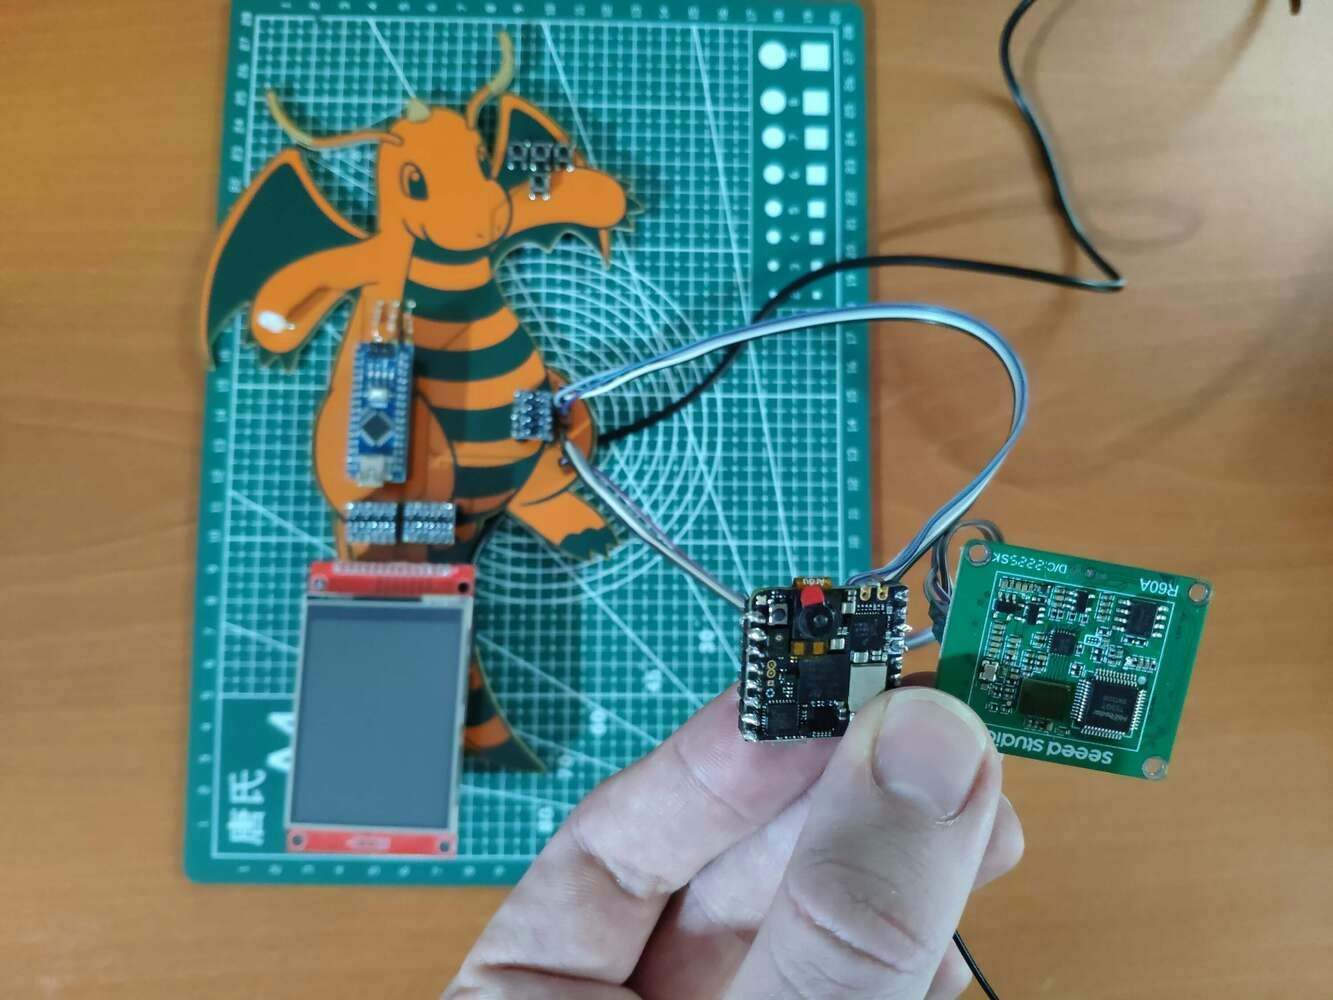
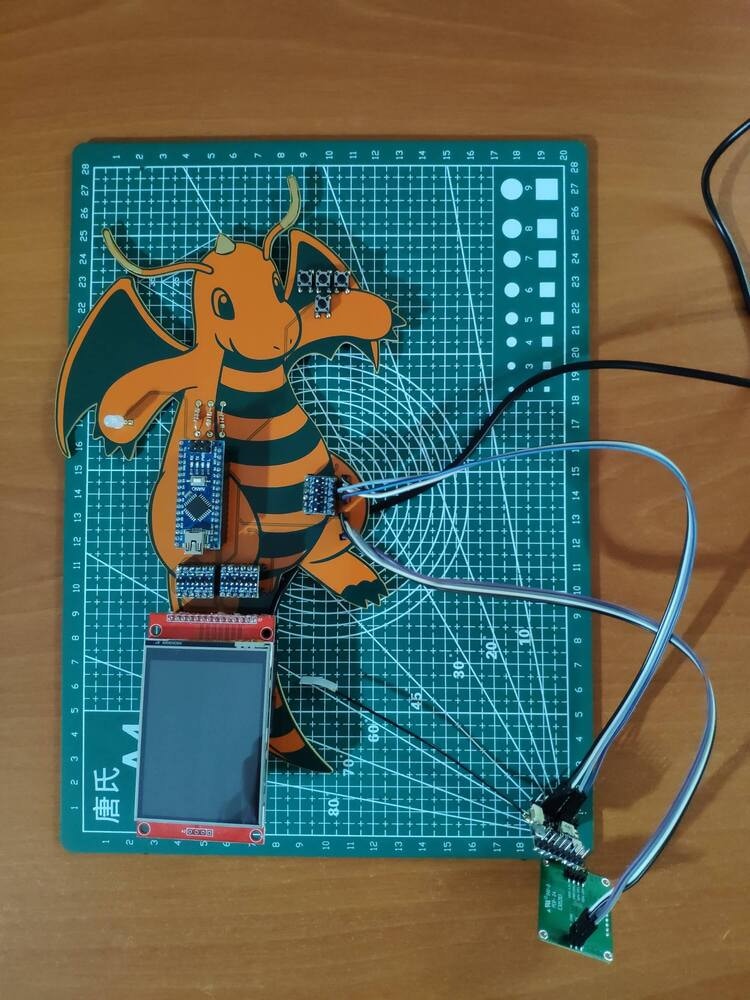
Step 1.1: Making connections and adjustments
image
image
image
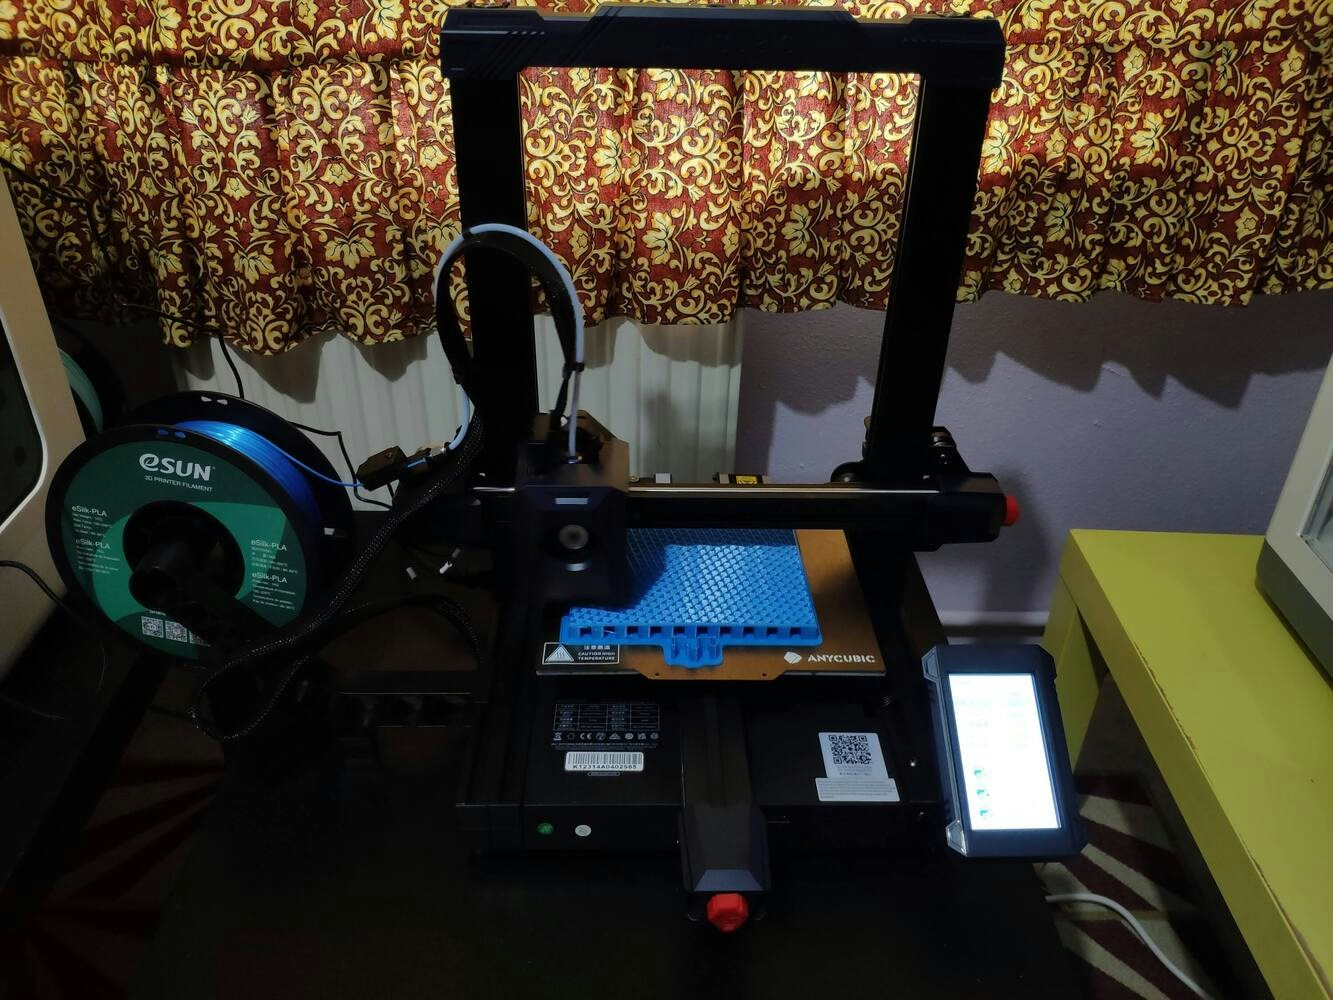
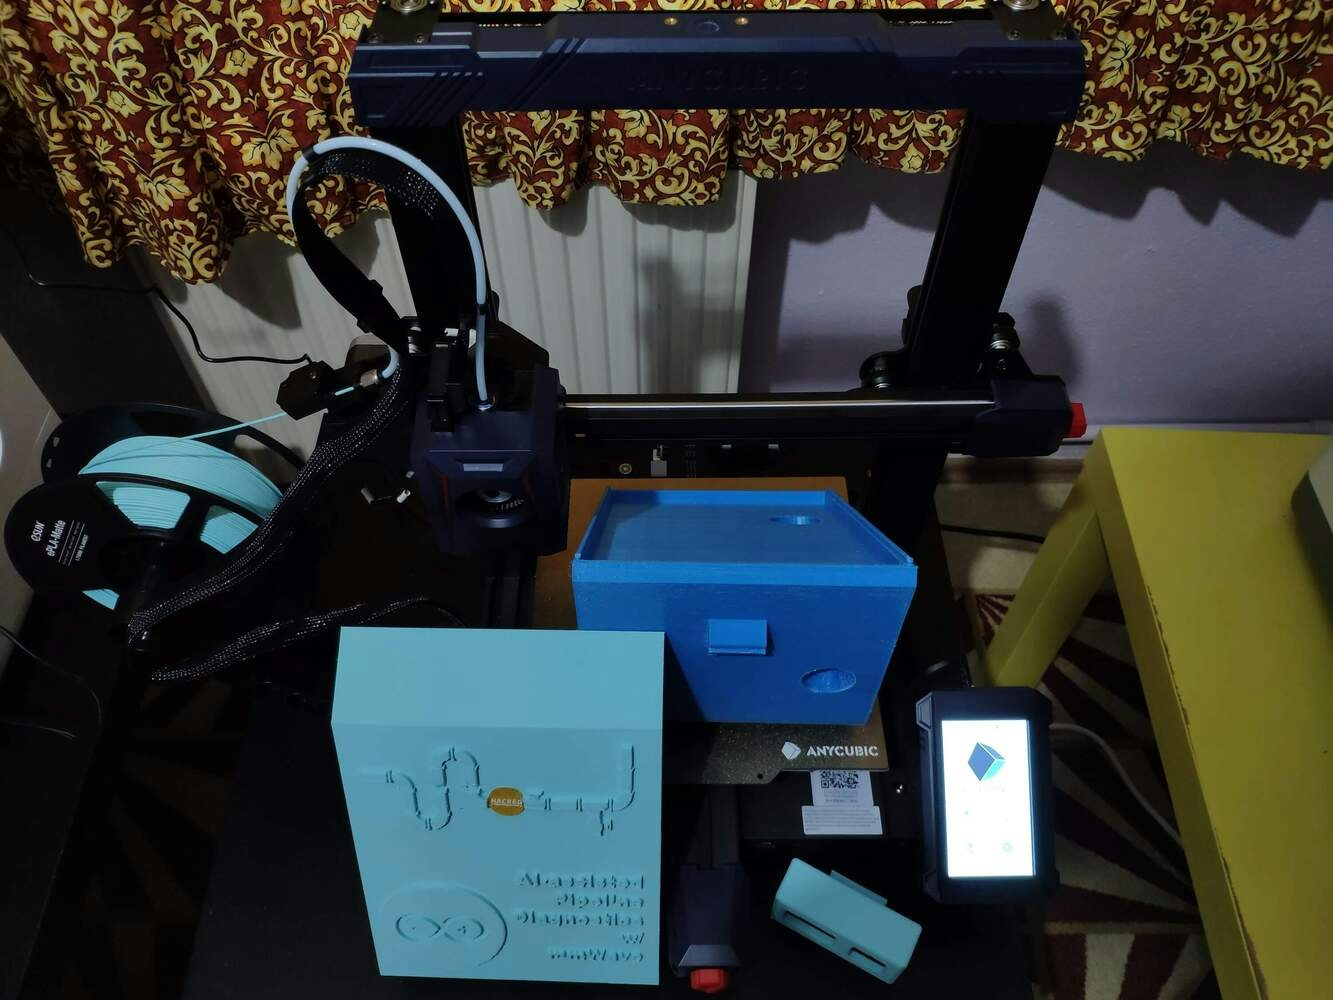
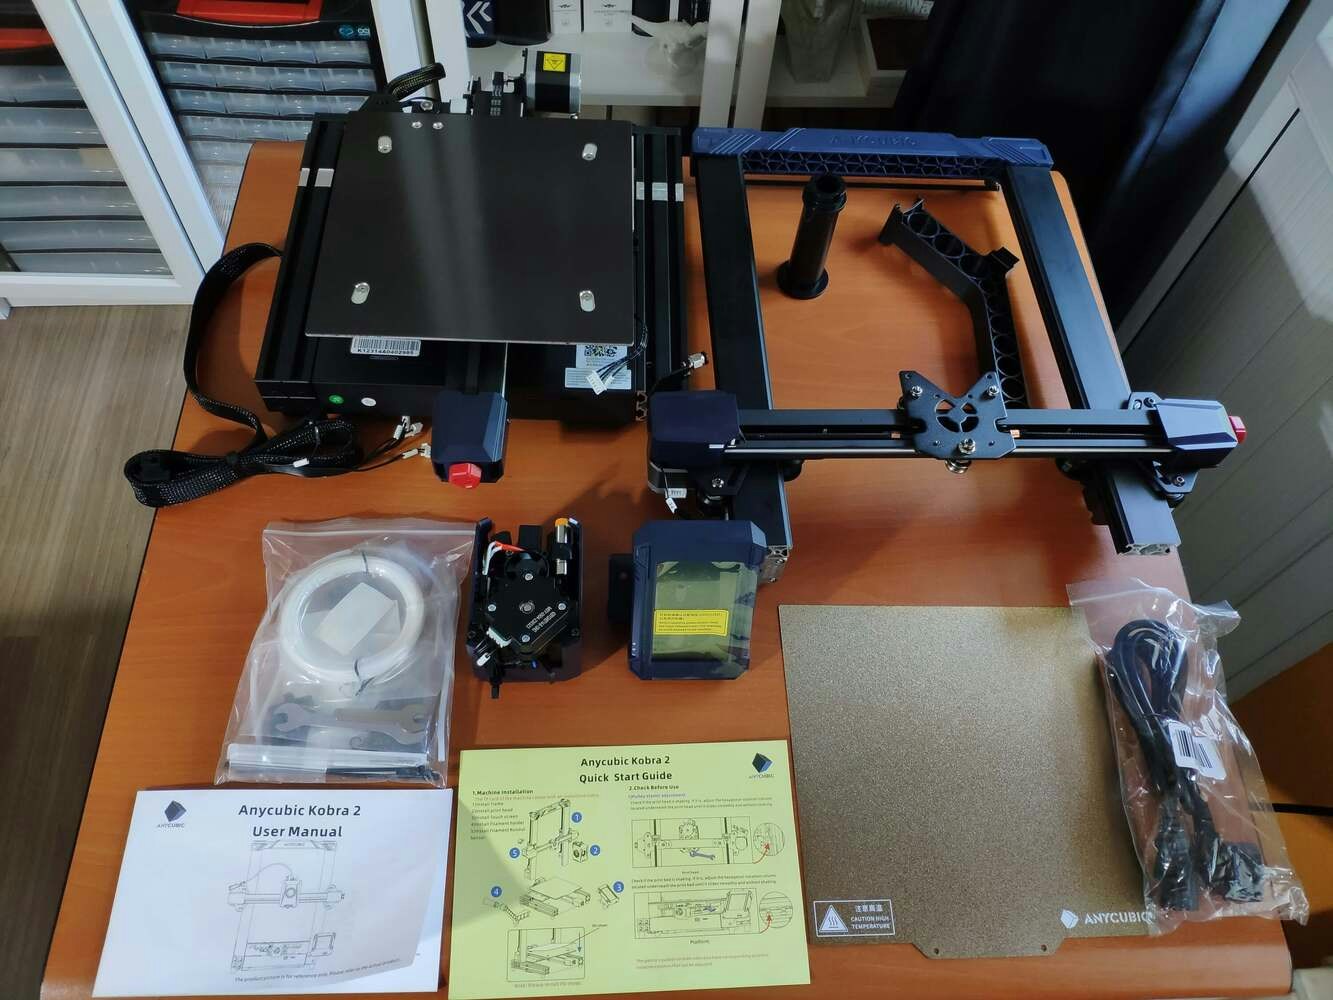
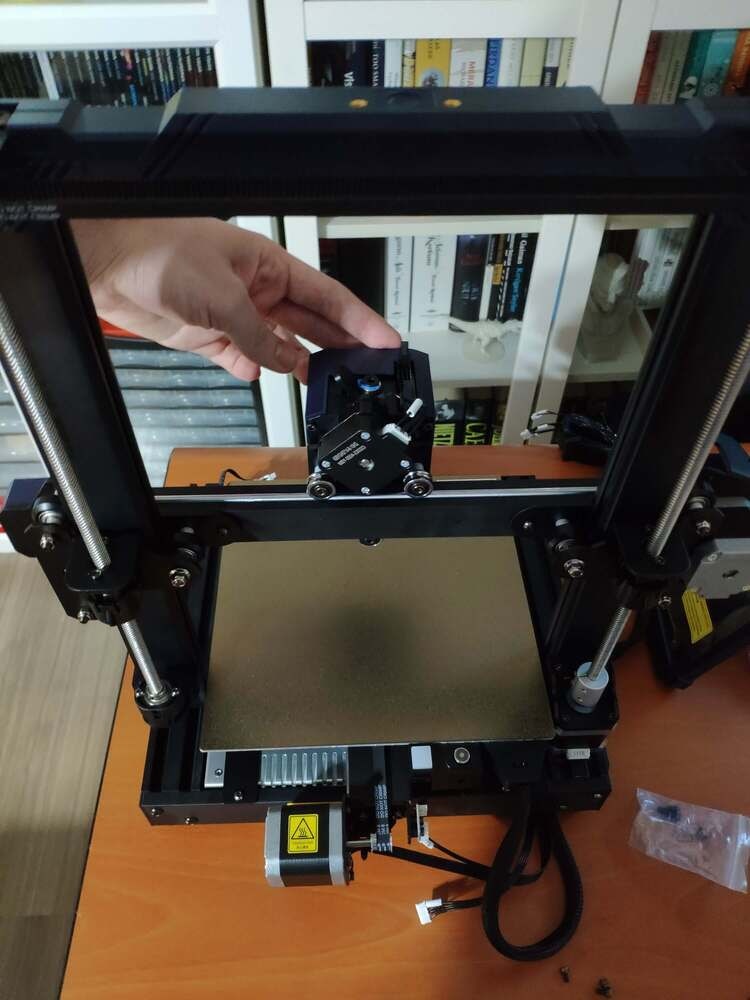
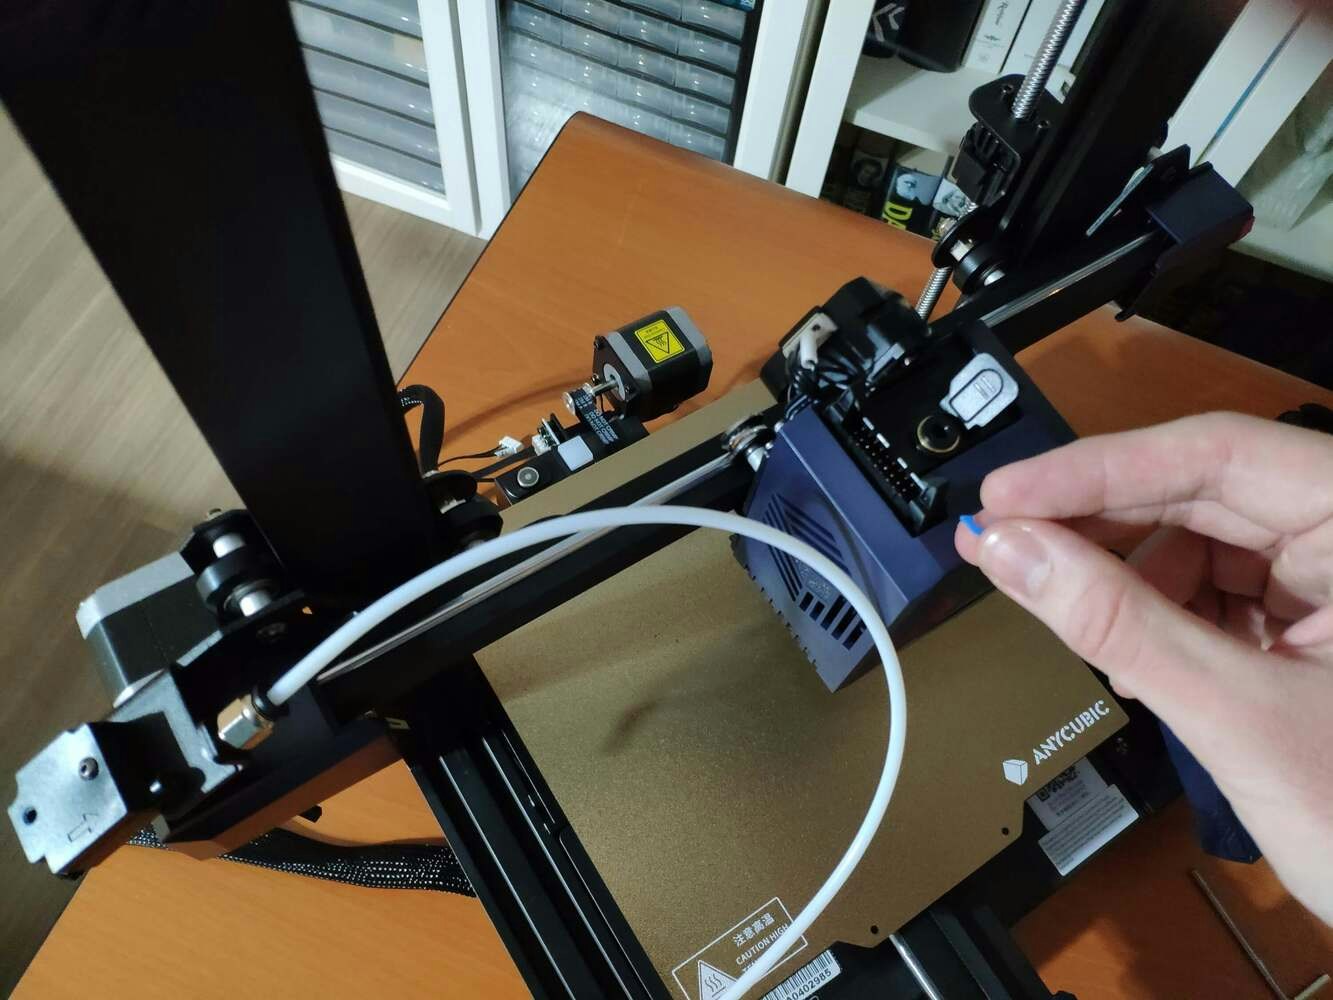
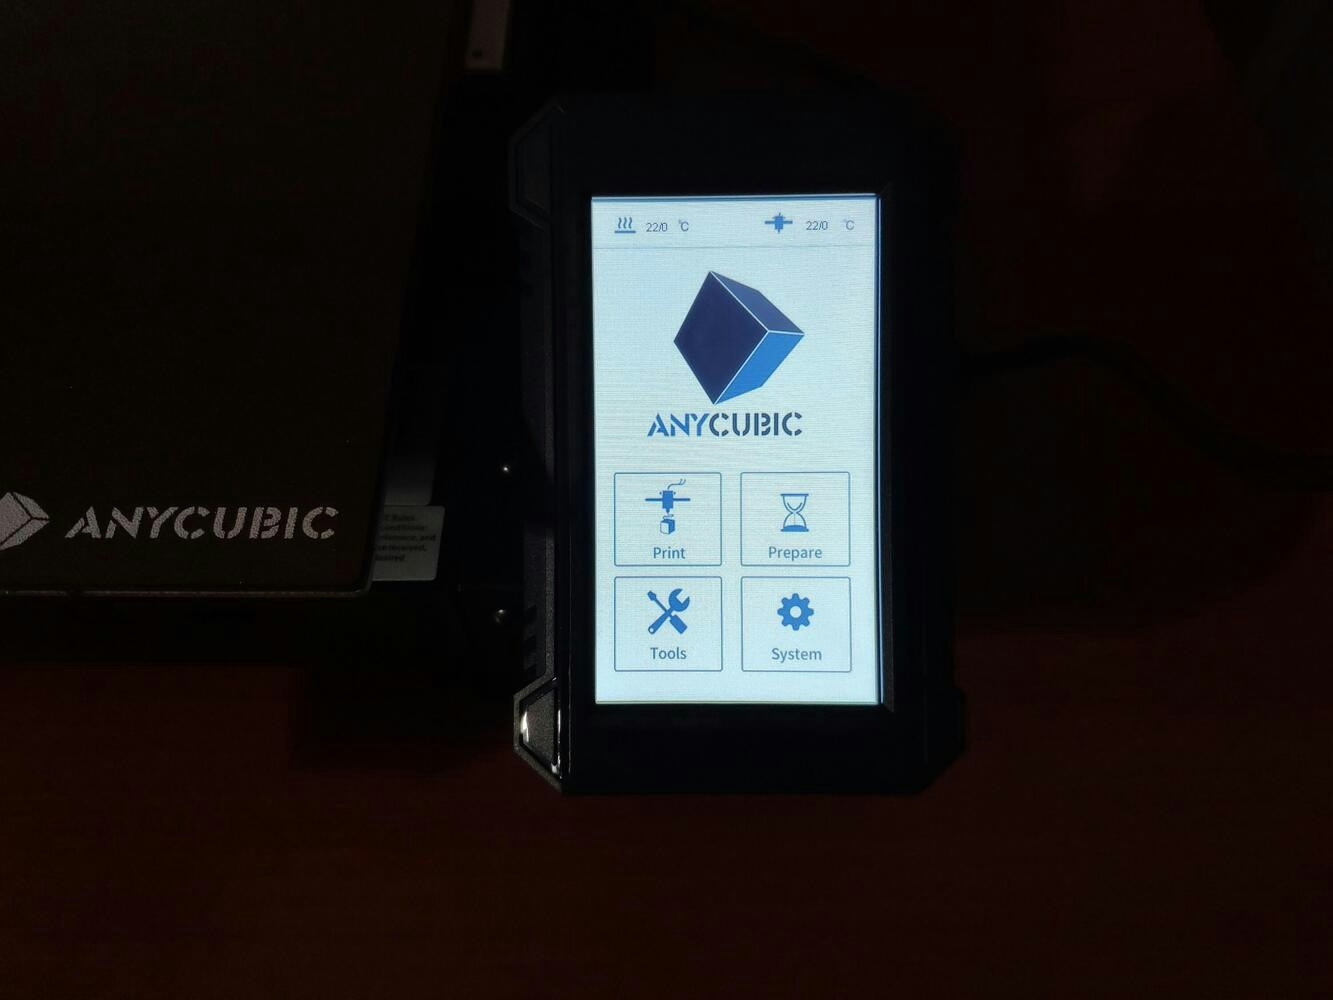
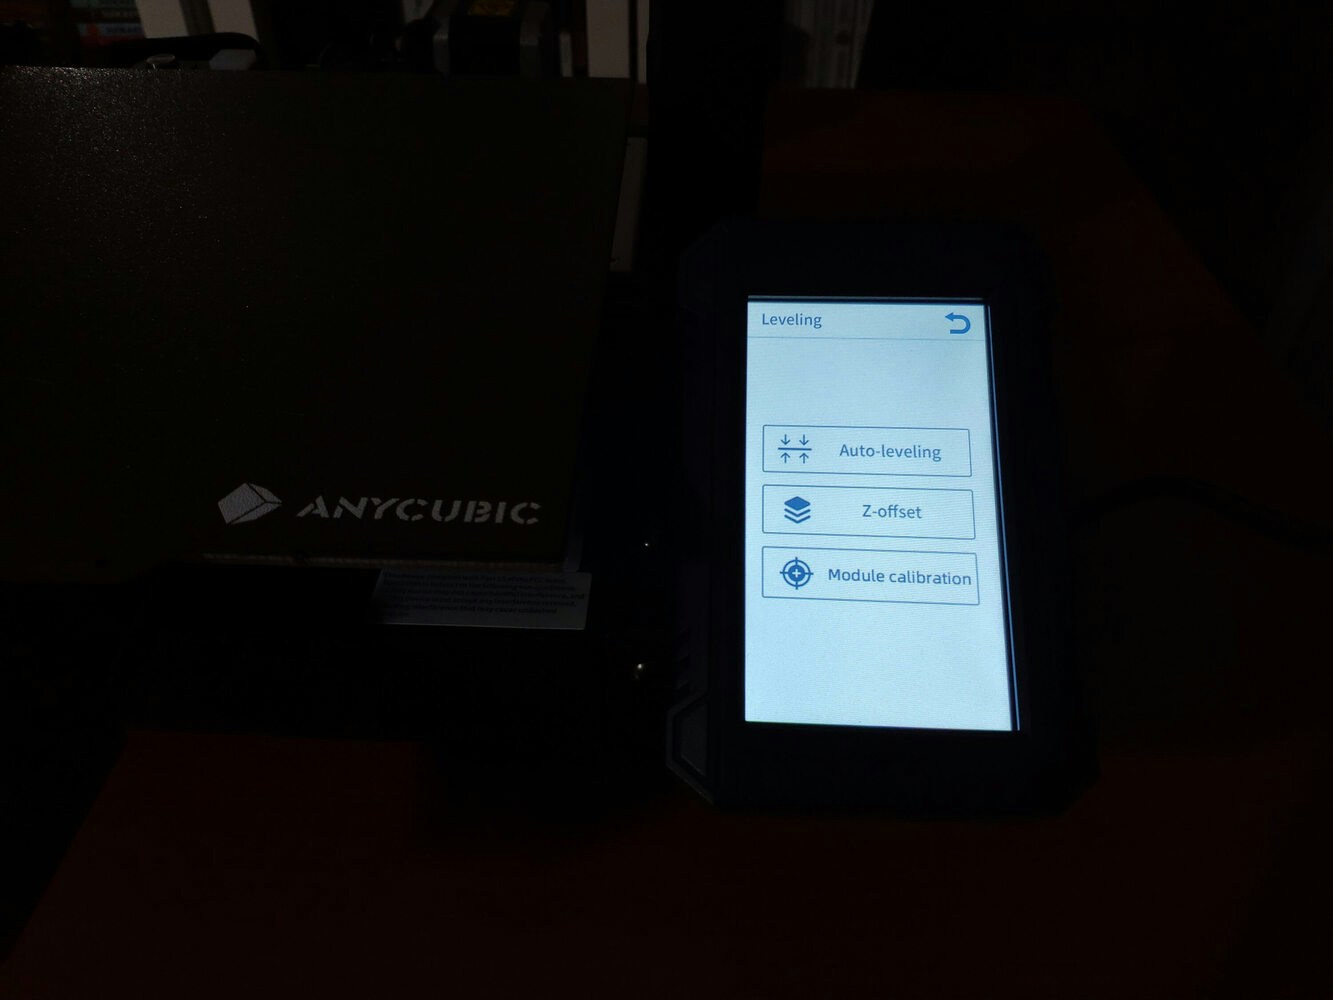
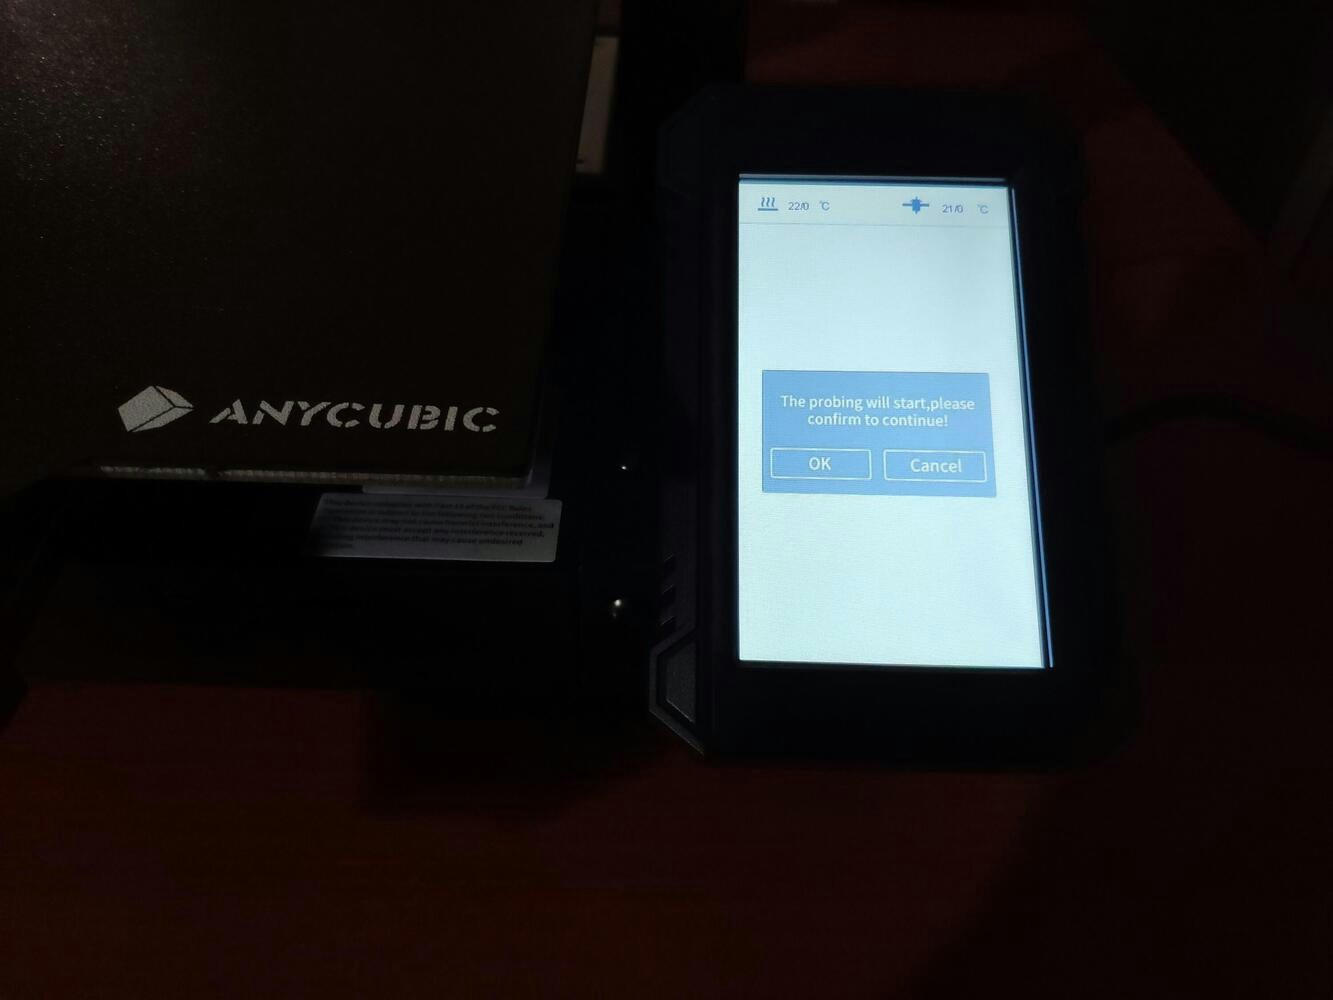
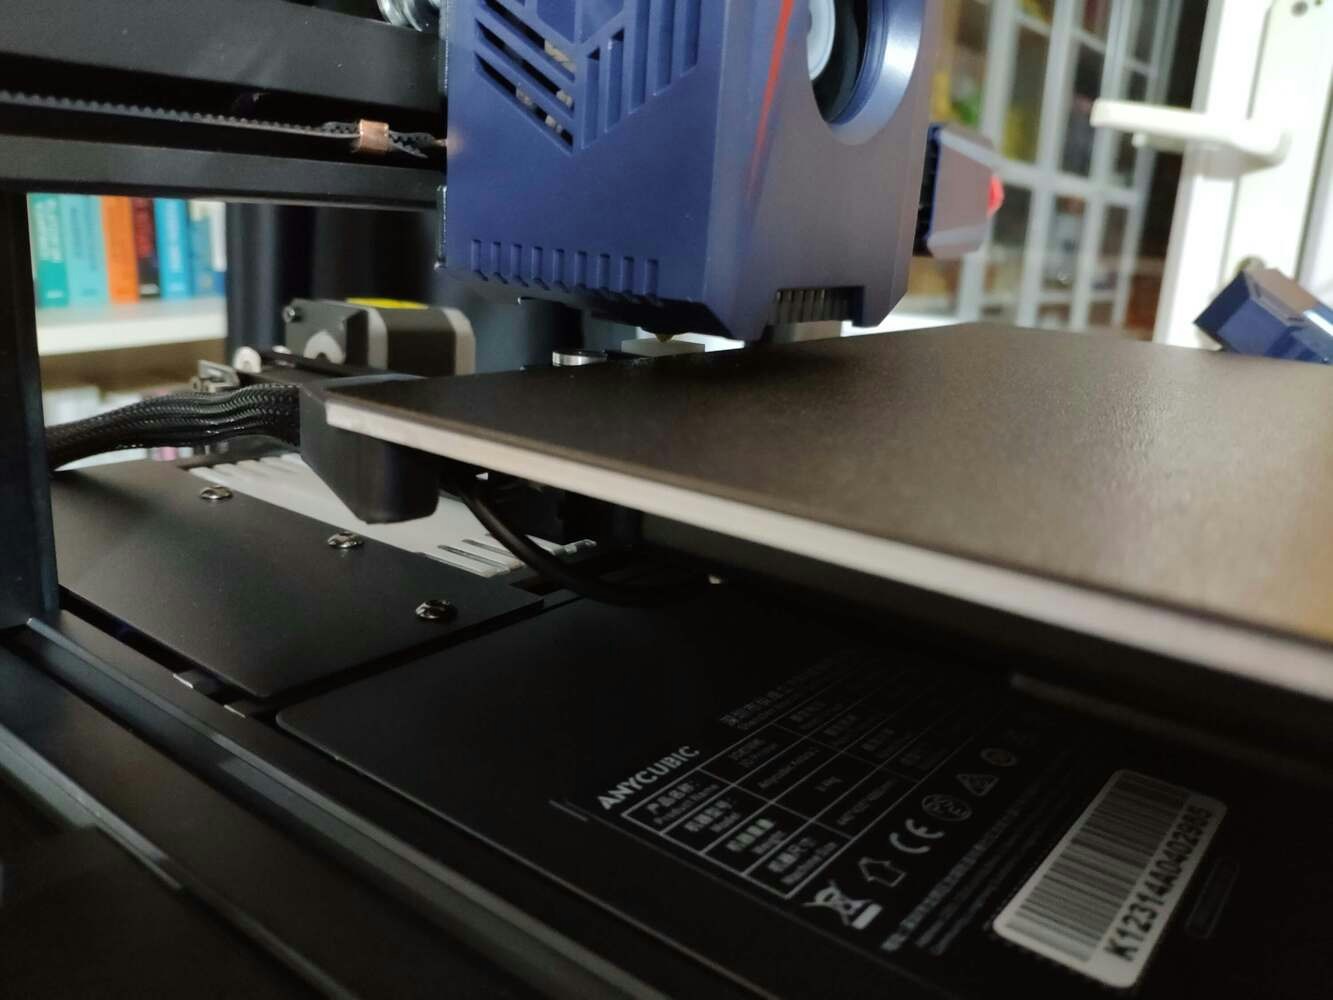
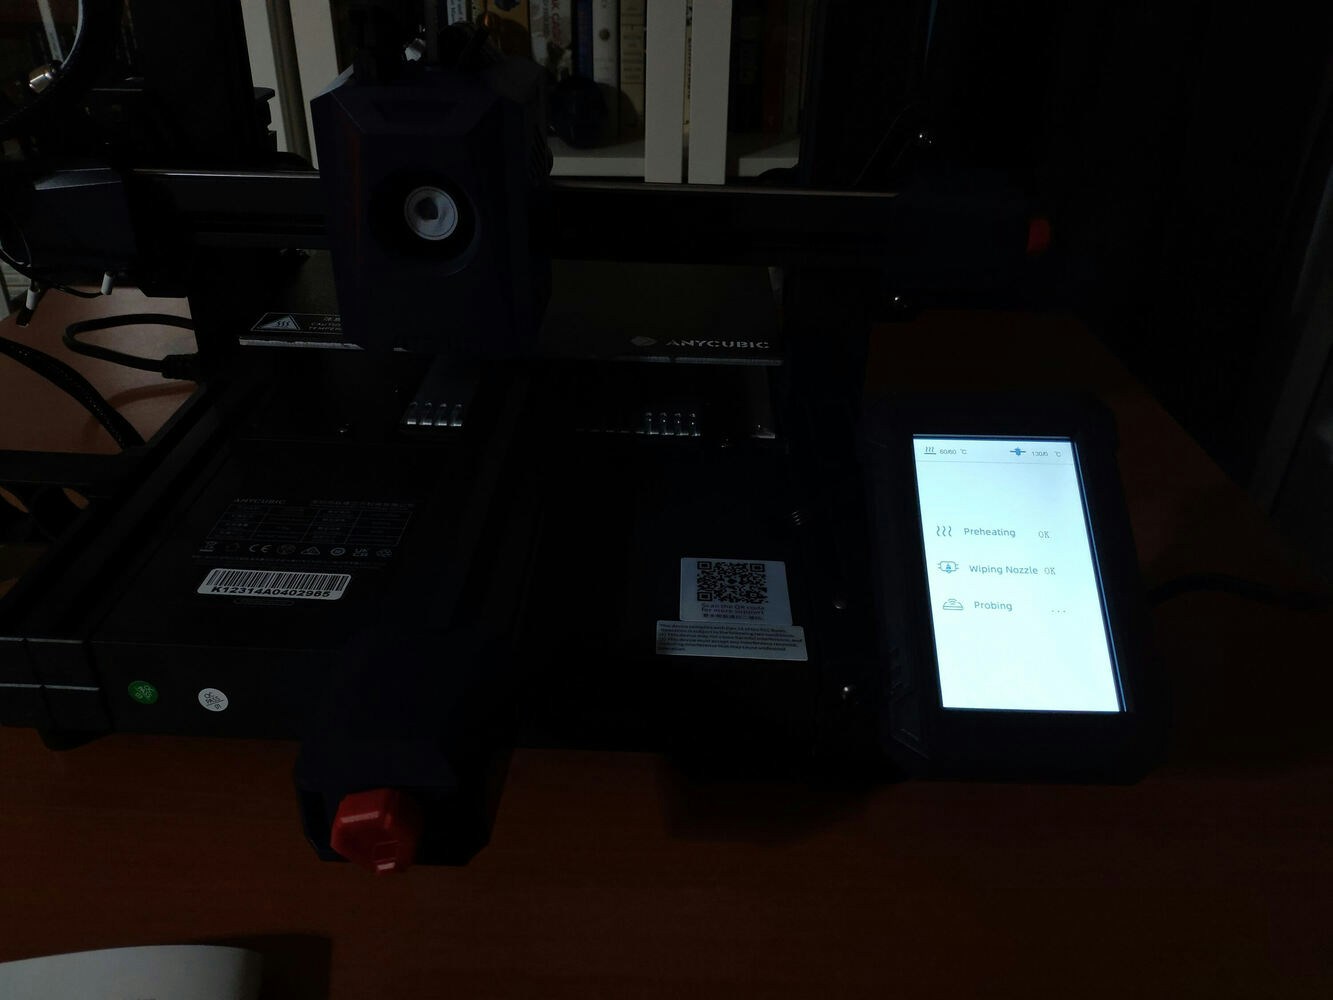
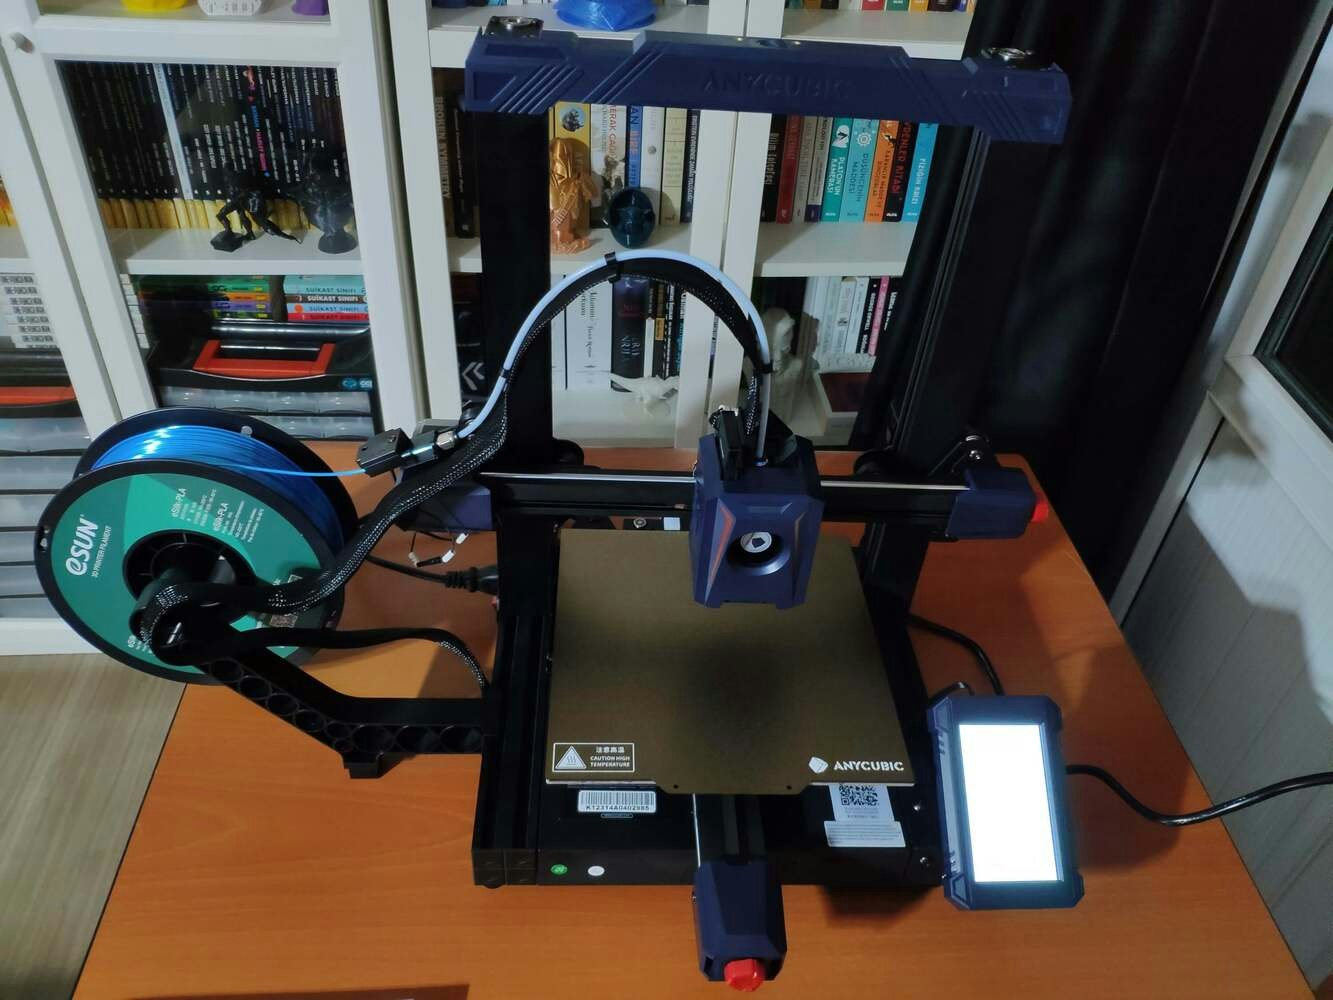
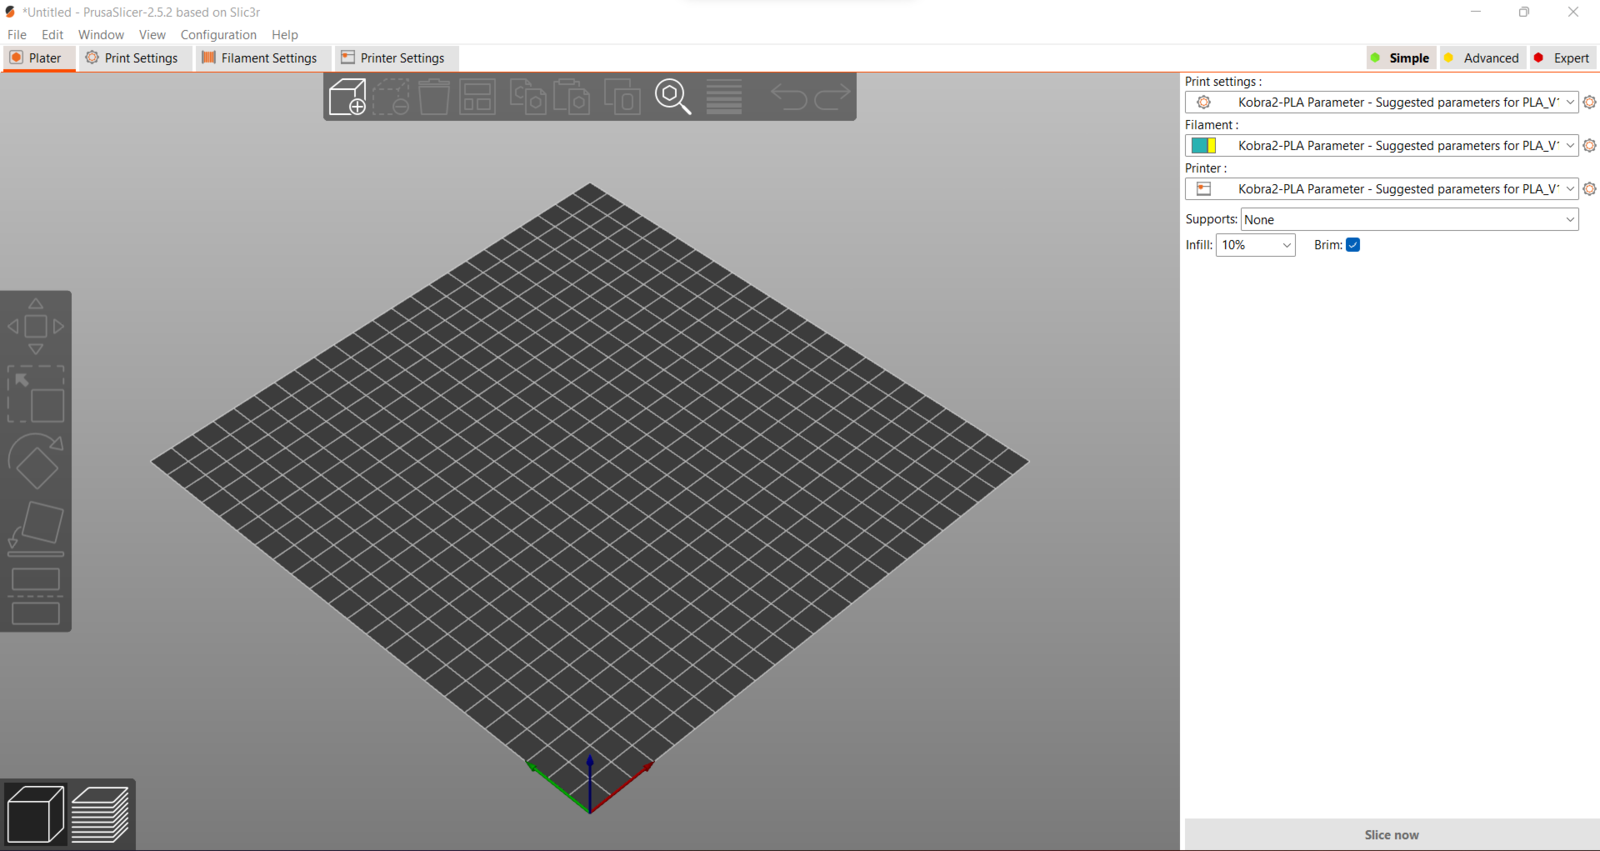
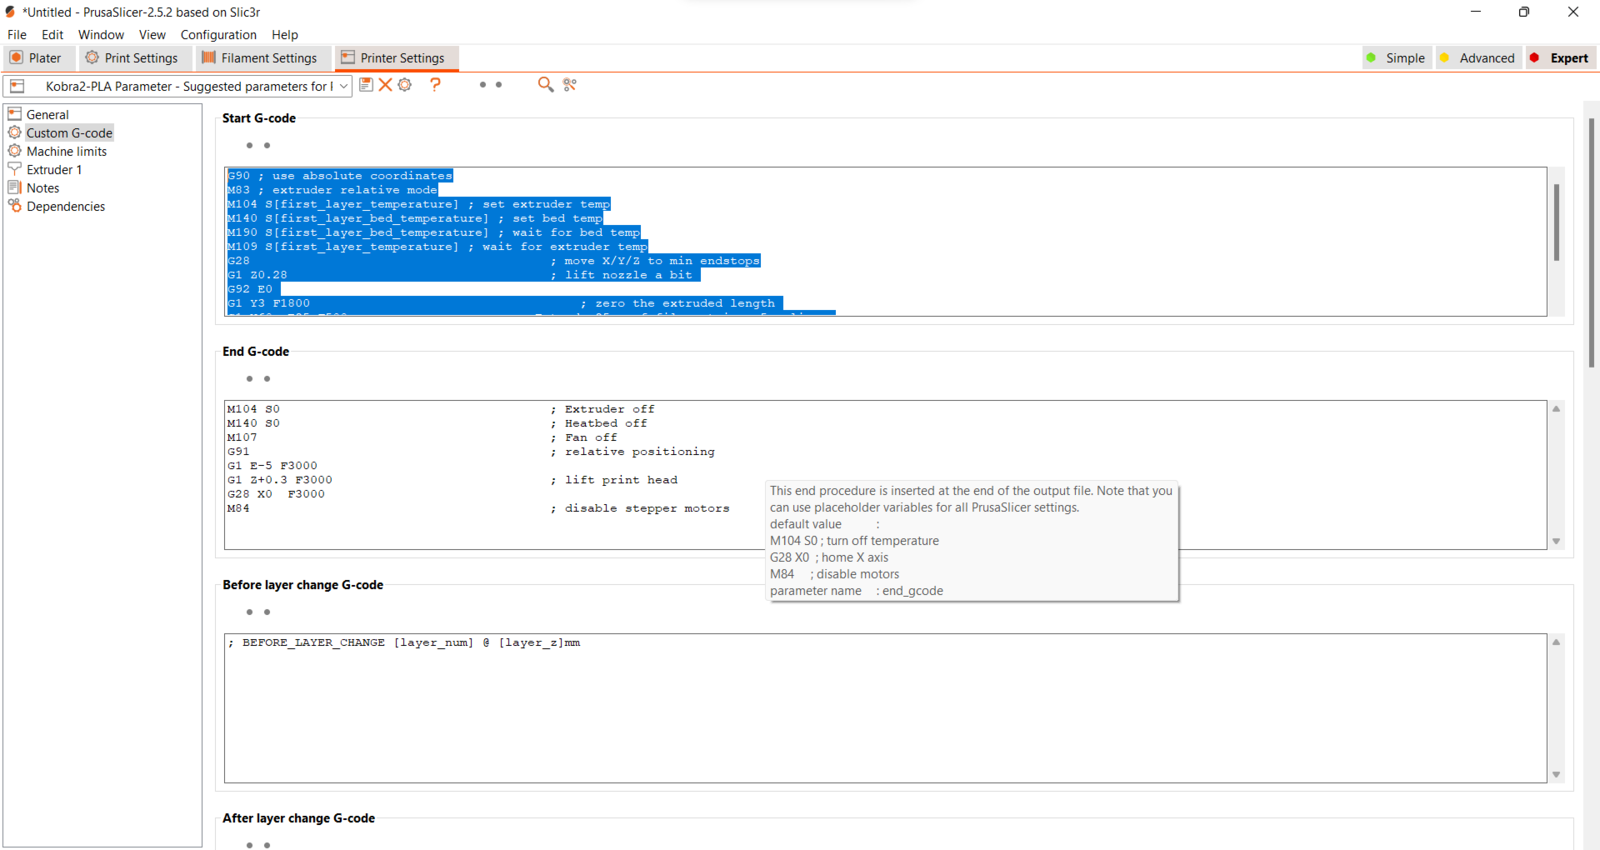
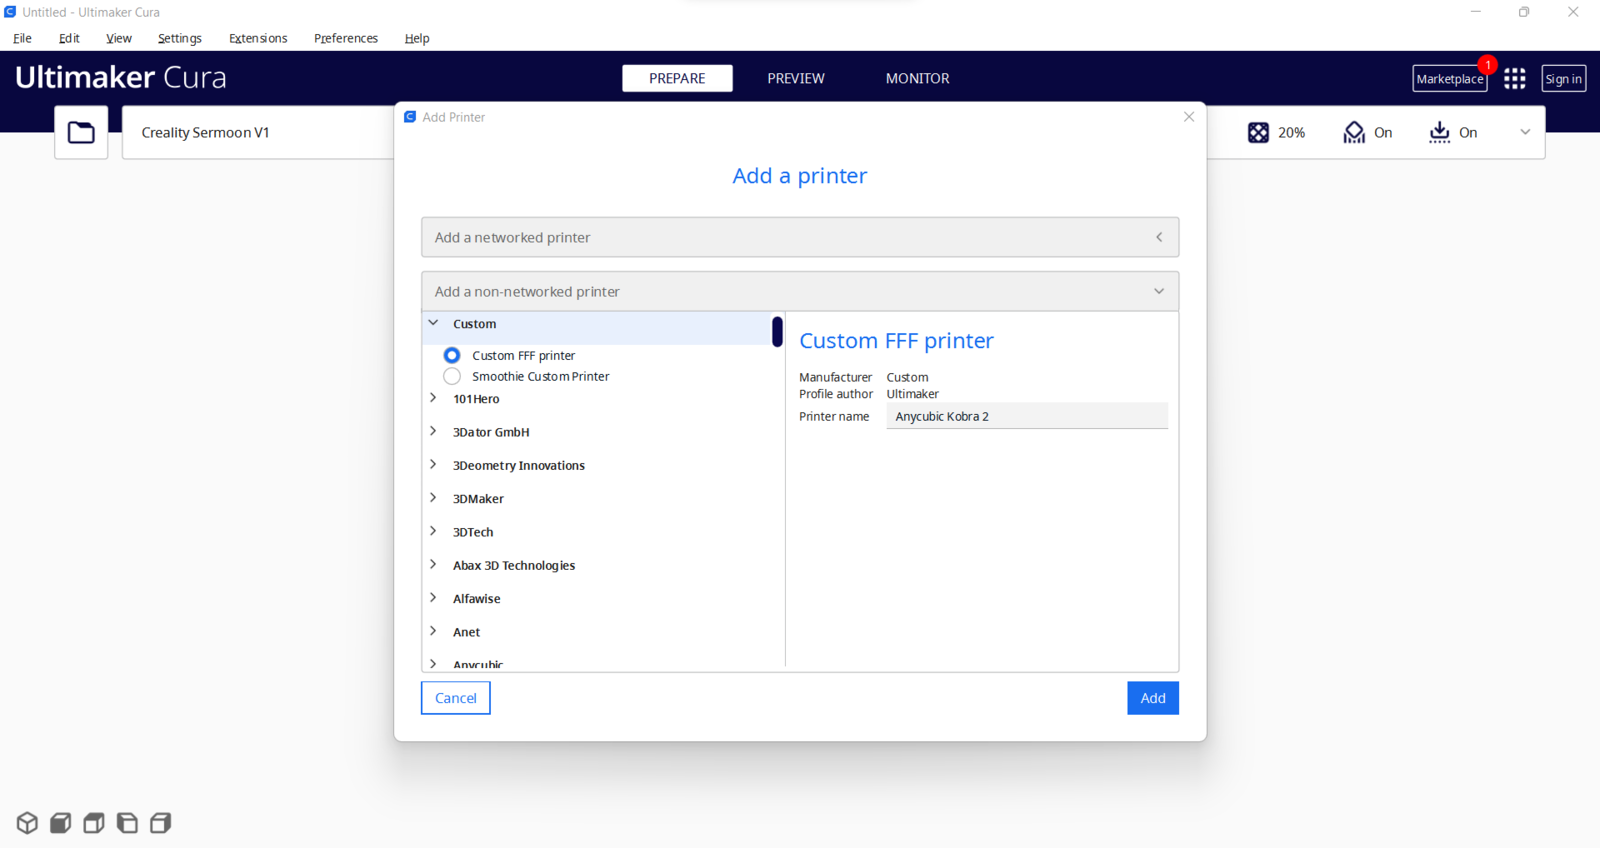
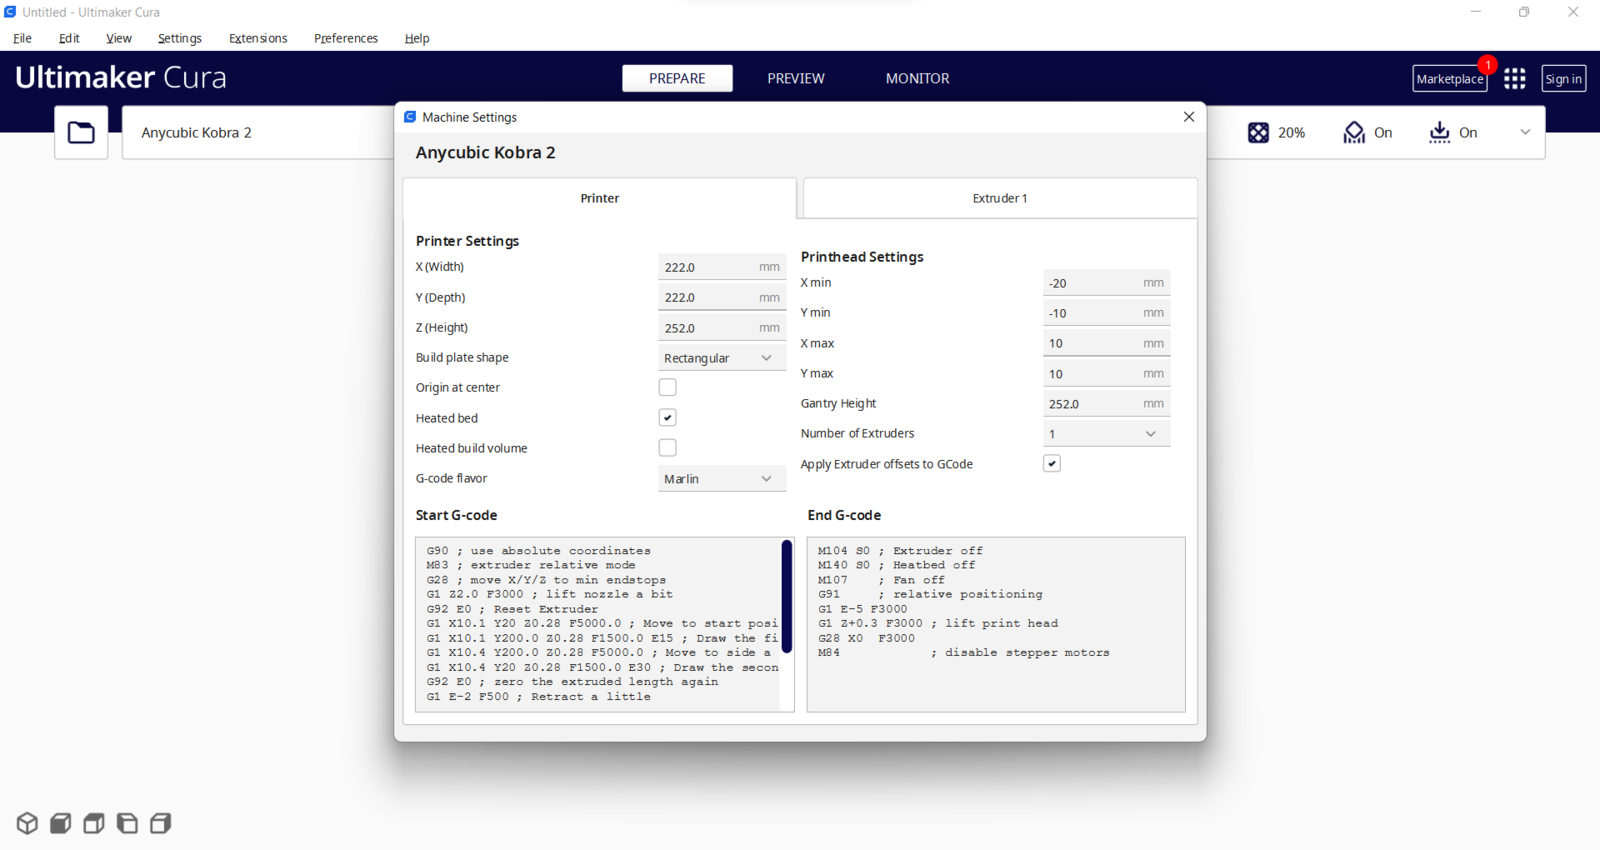
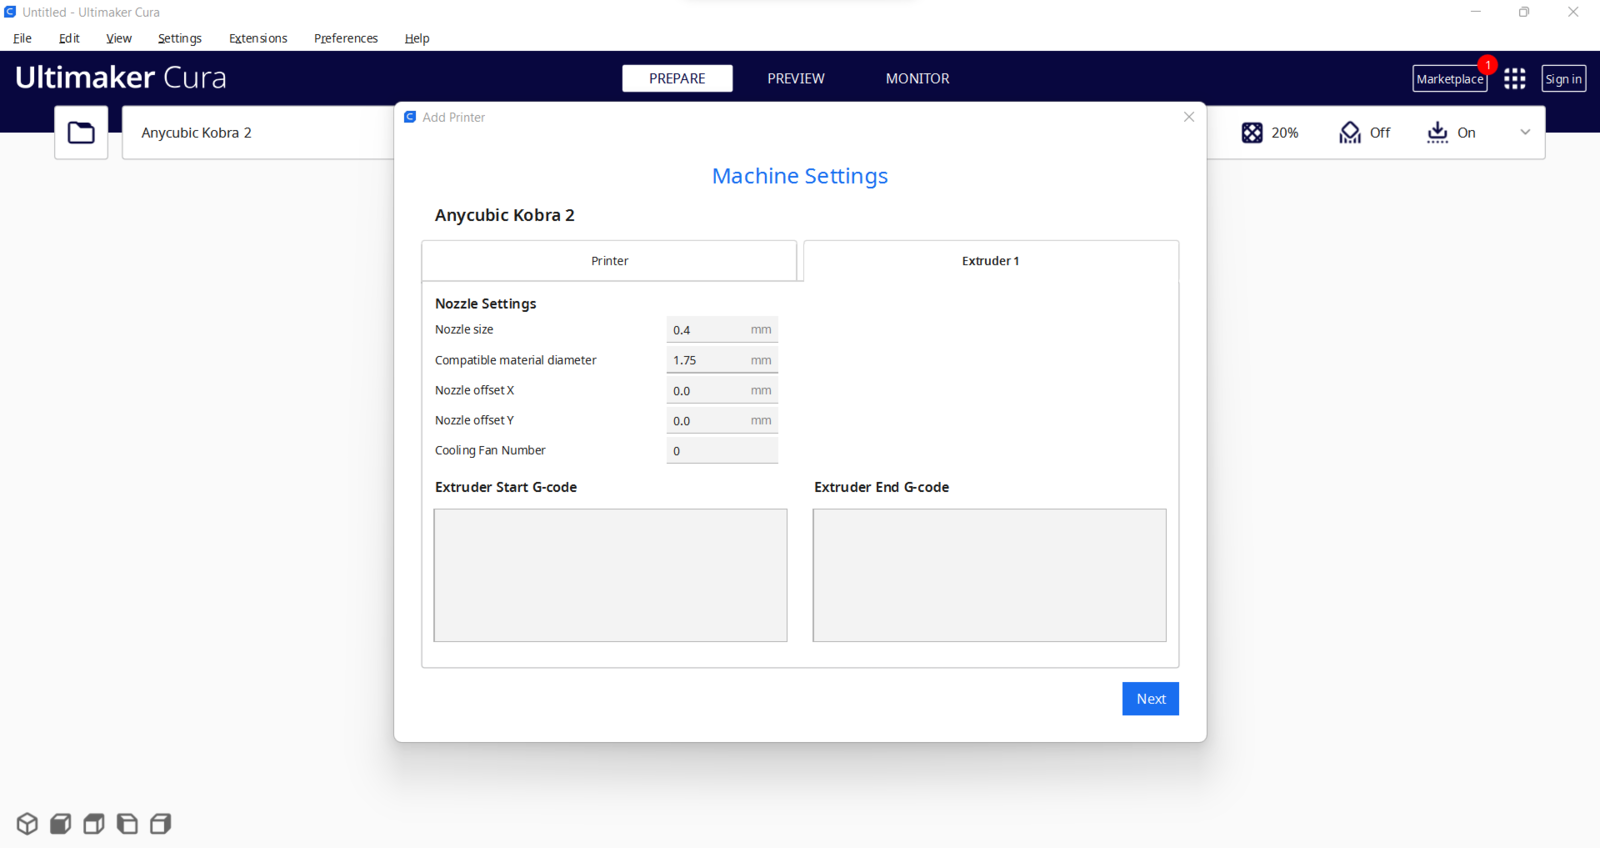
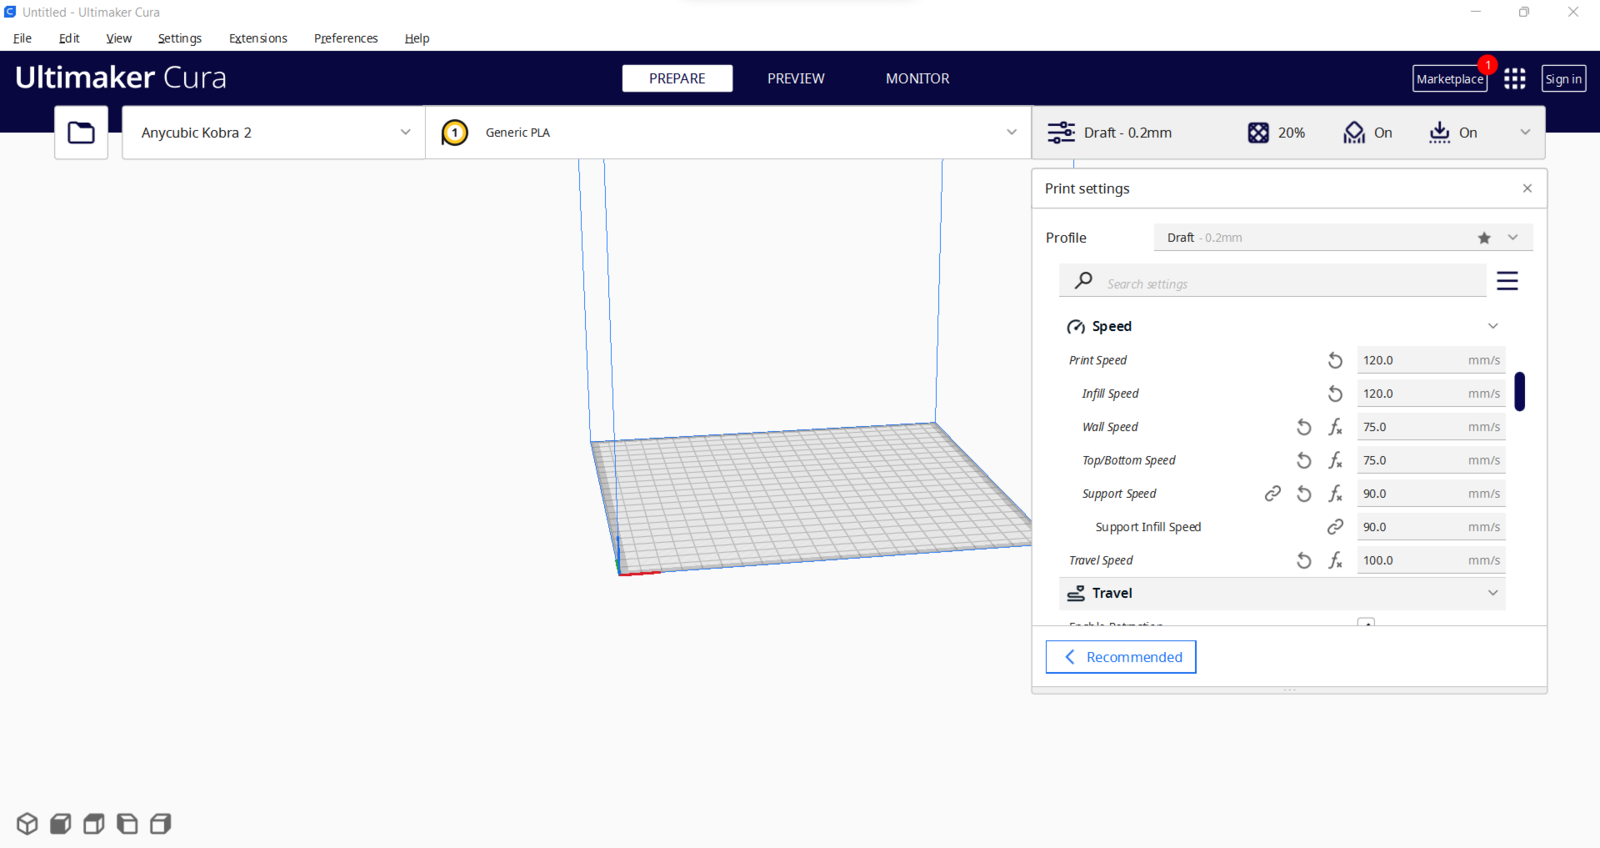
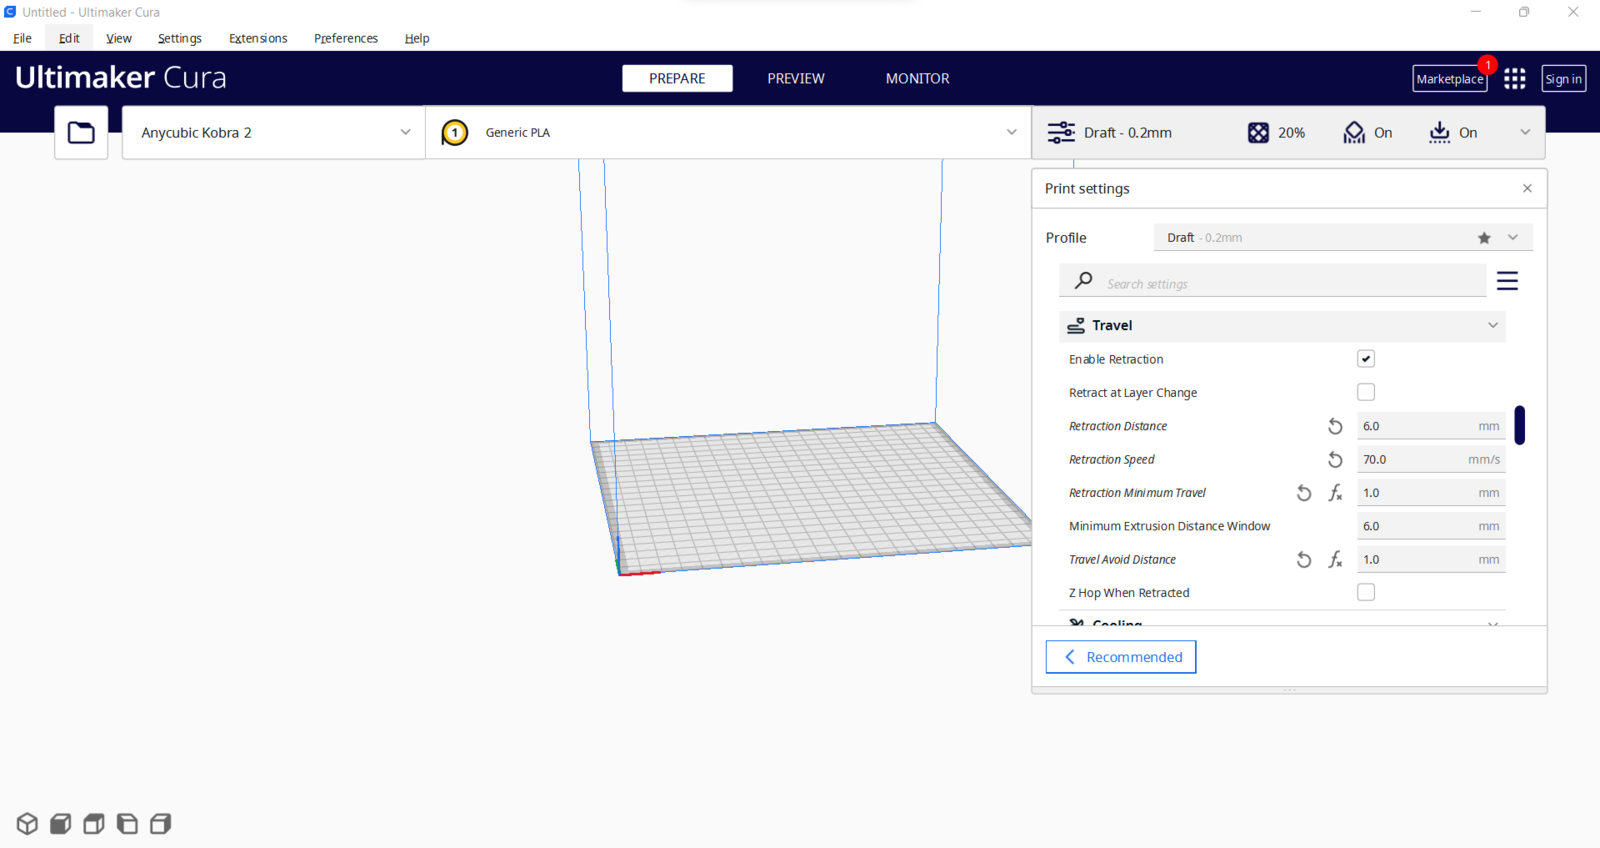
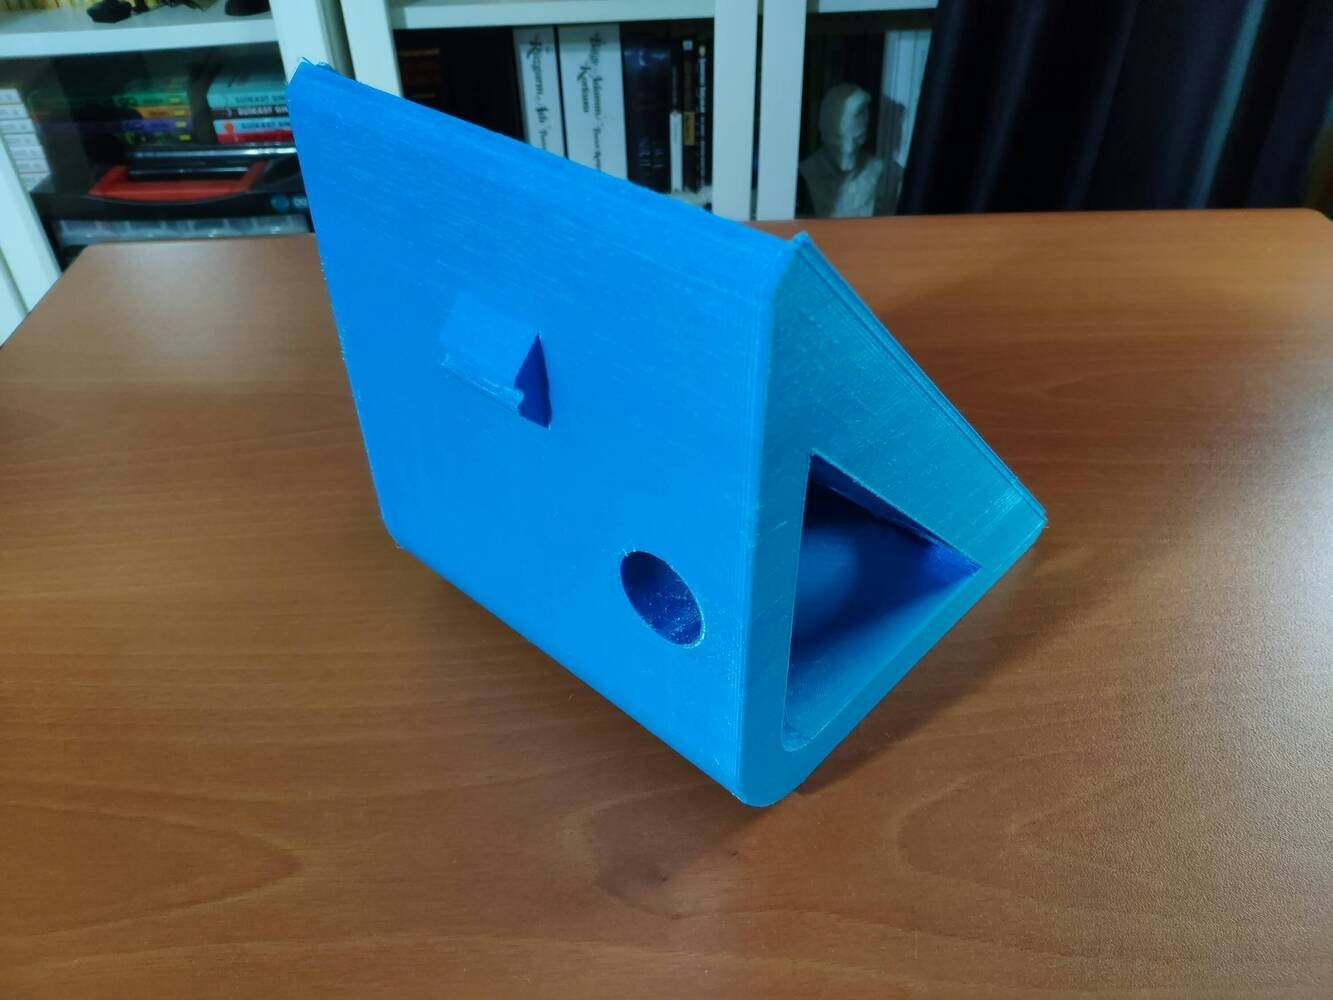
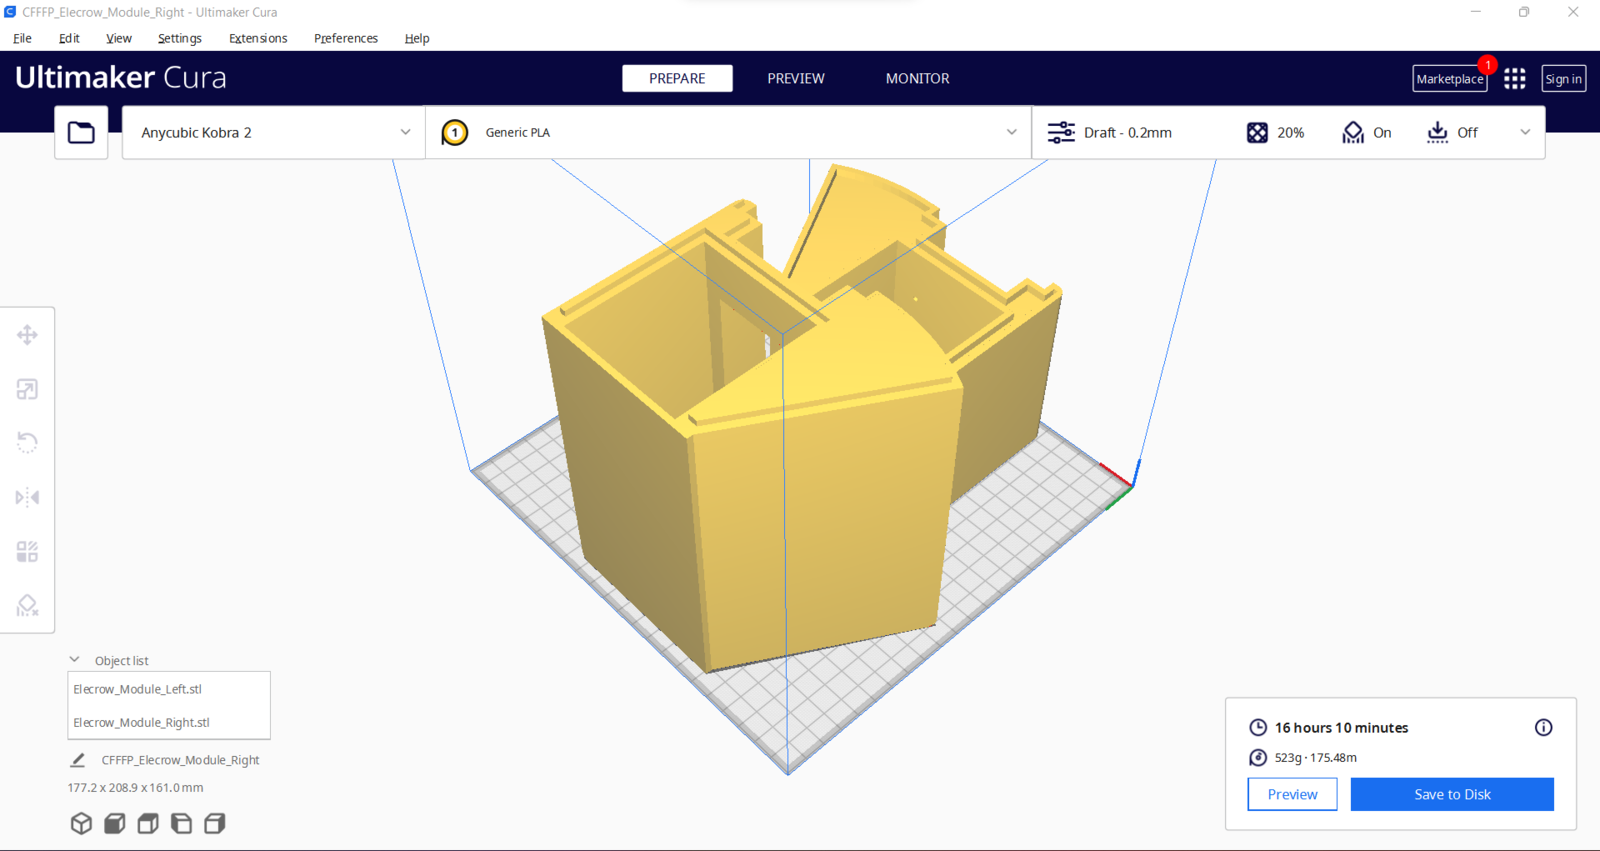
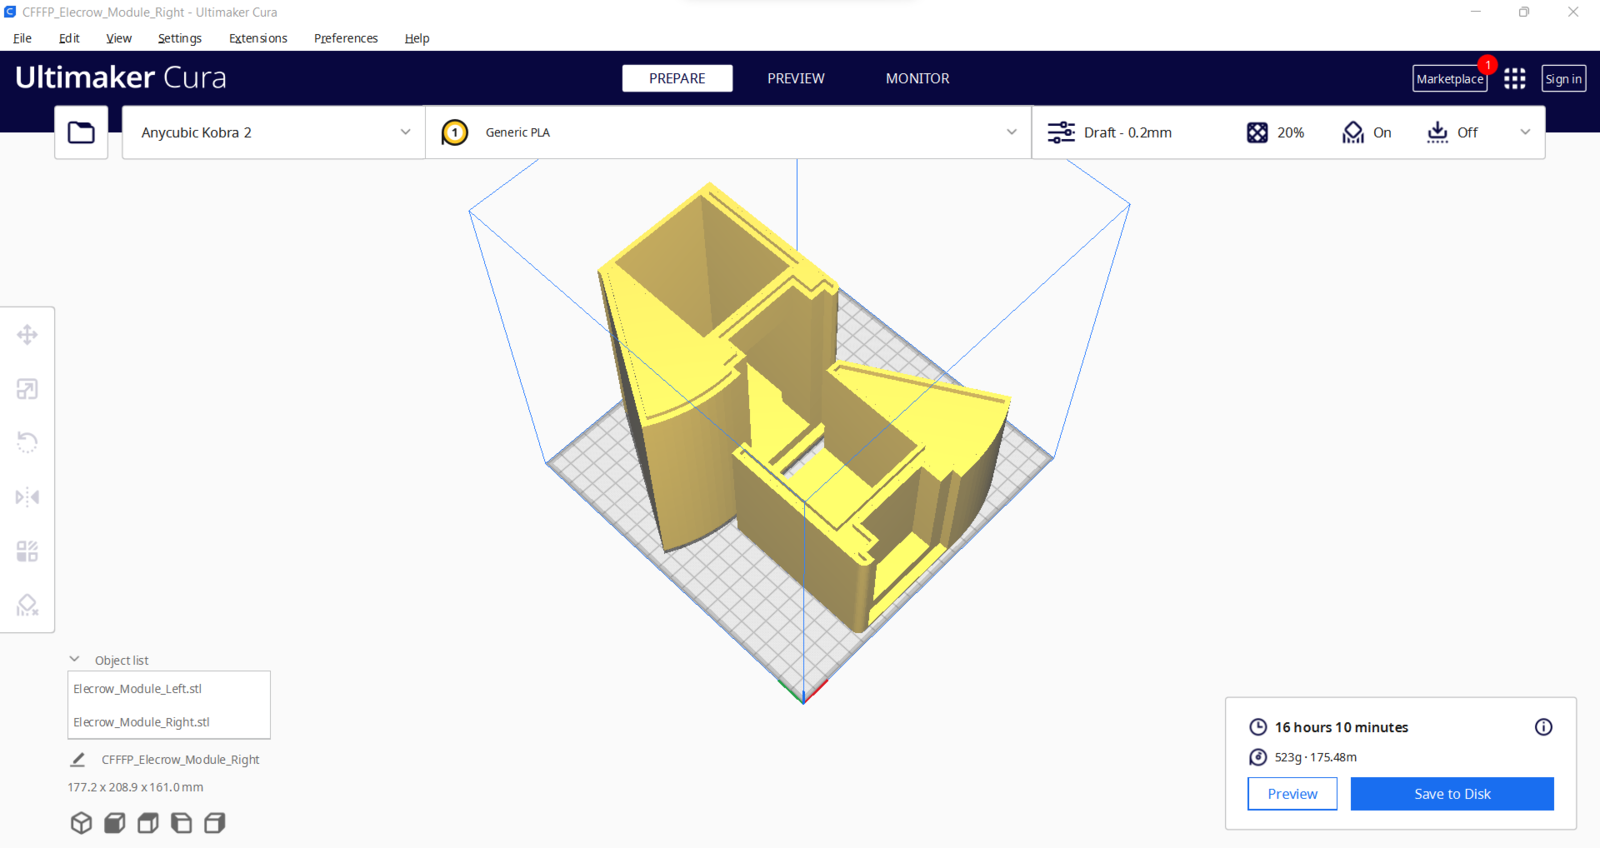
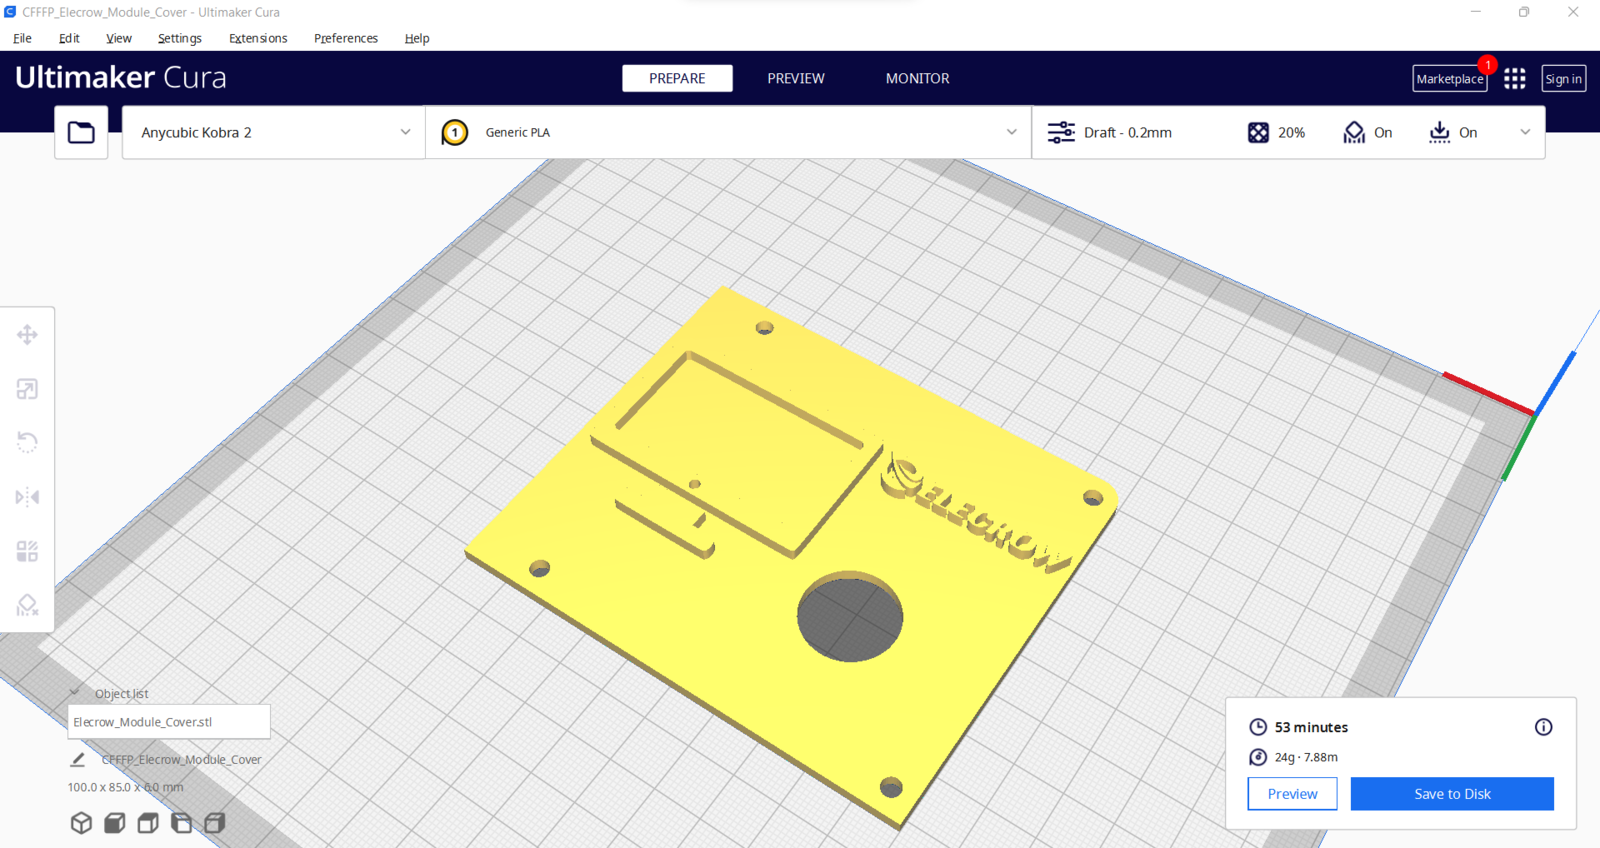
Step 2: Designing and printing a liquid-themed case w/ Anycubic Kobra 2
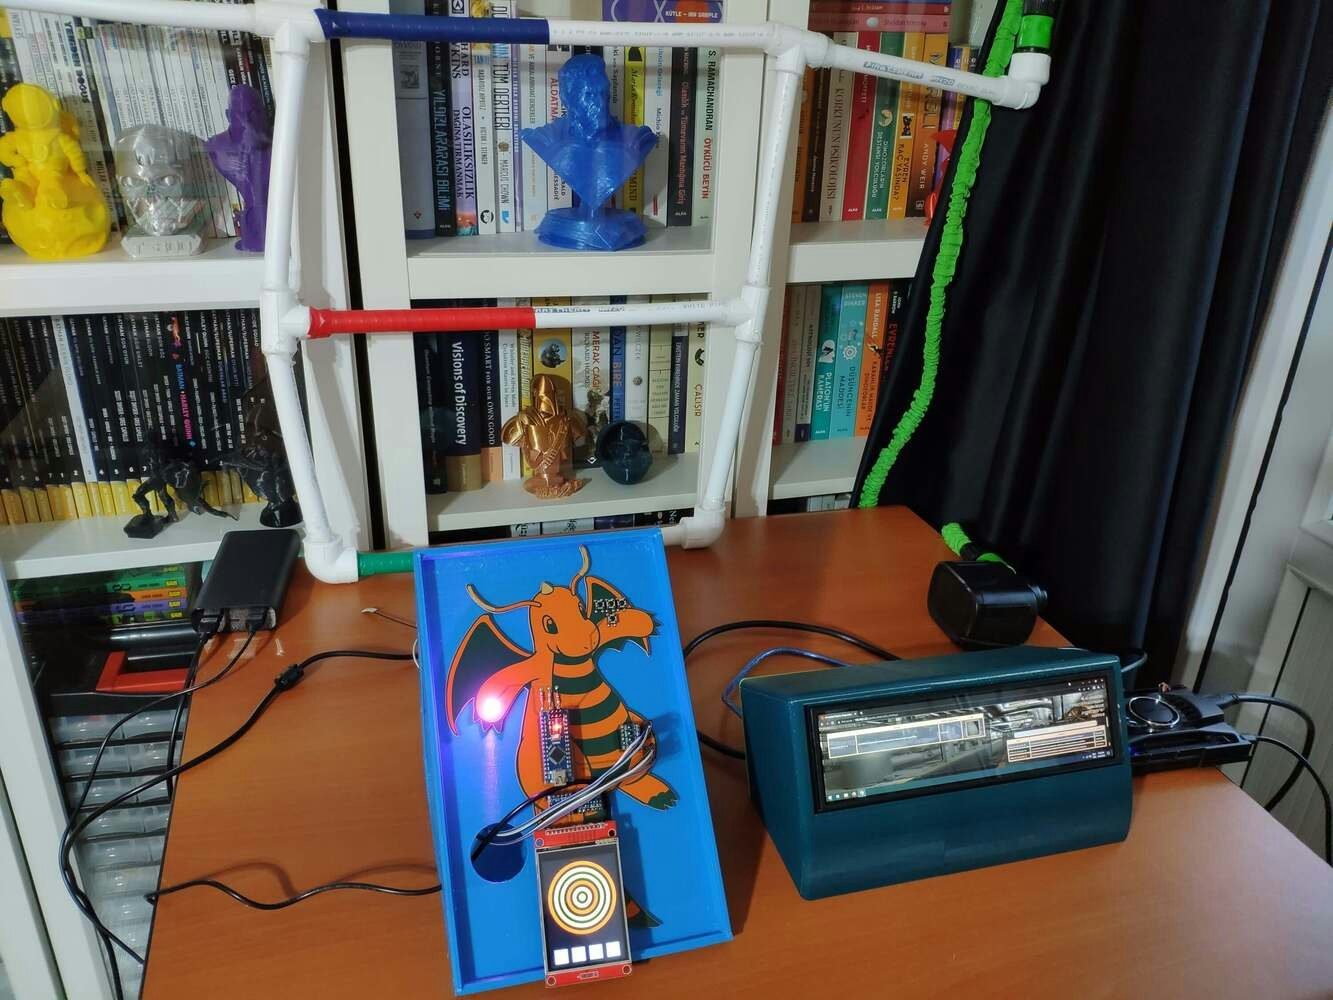
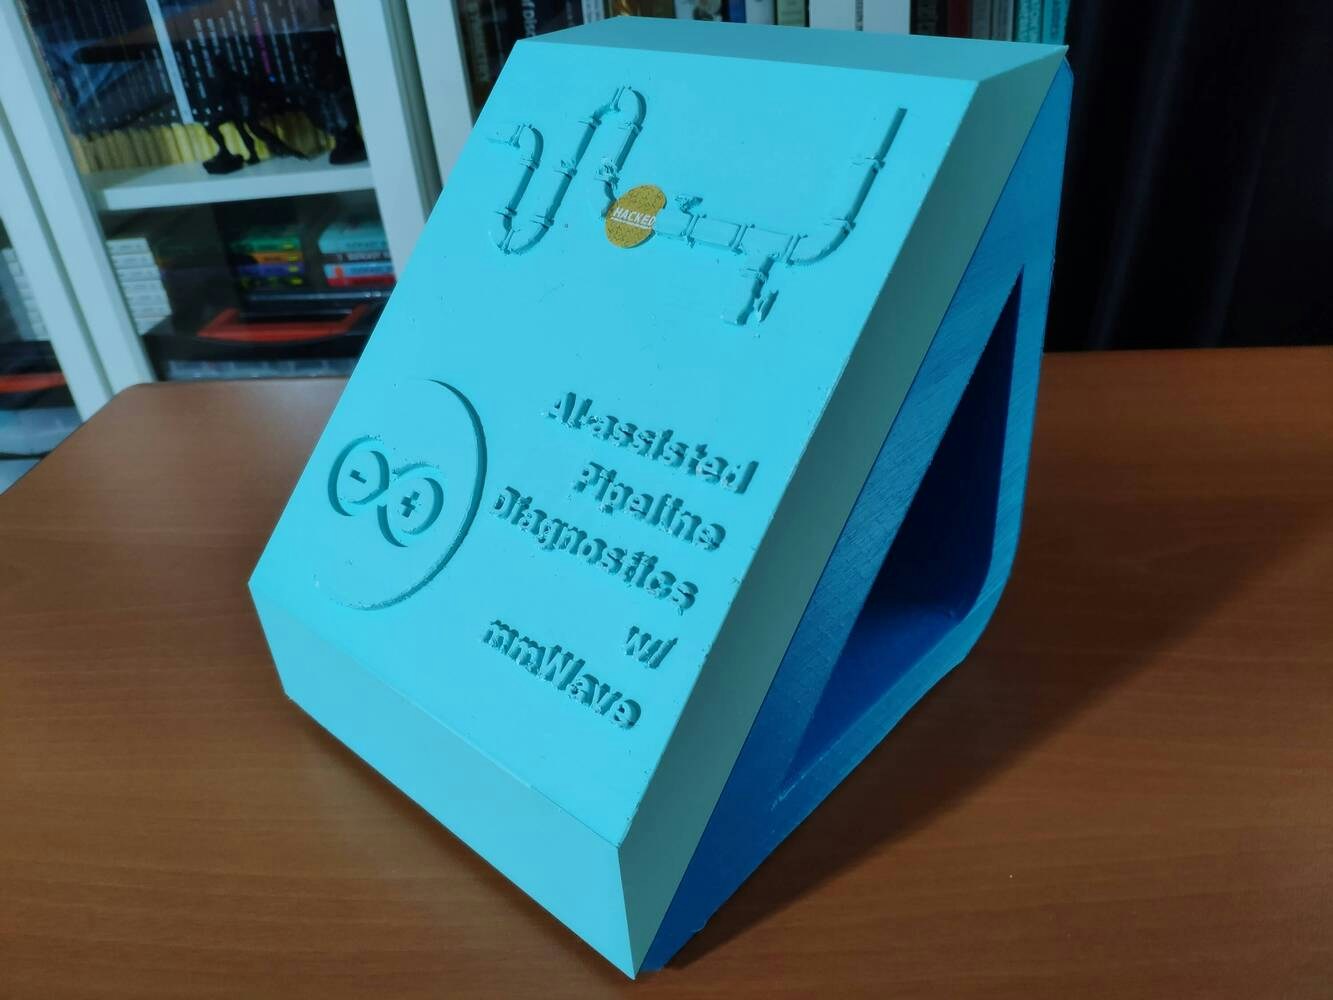
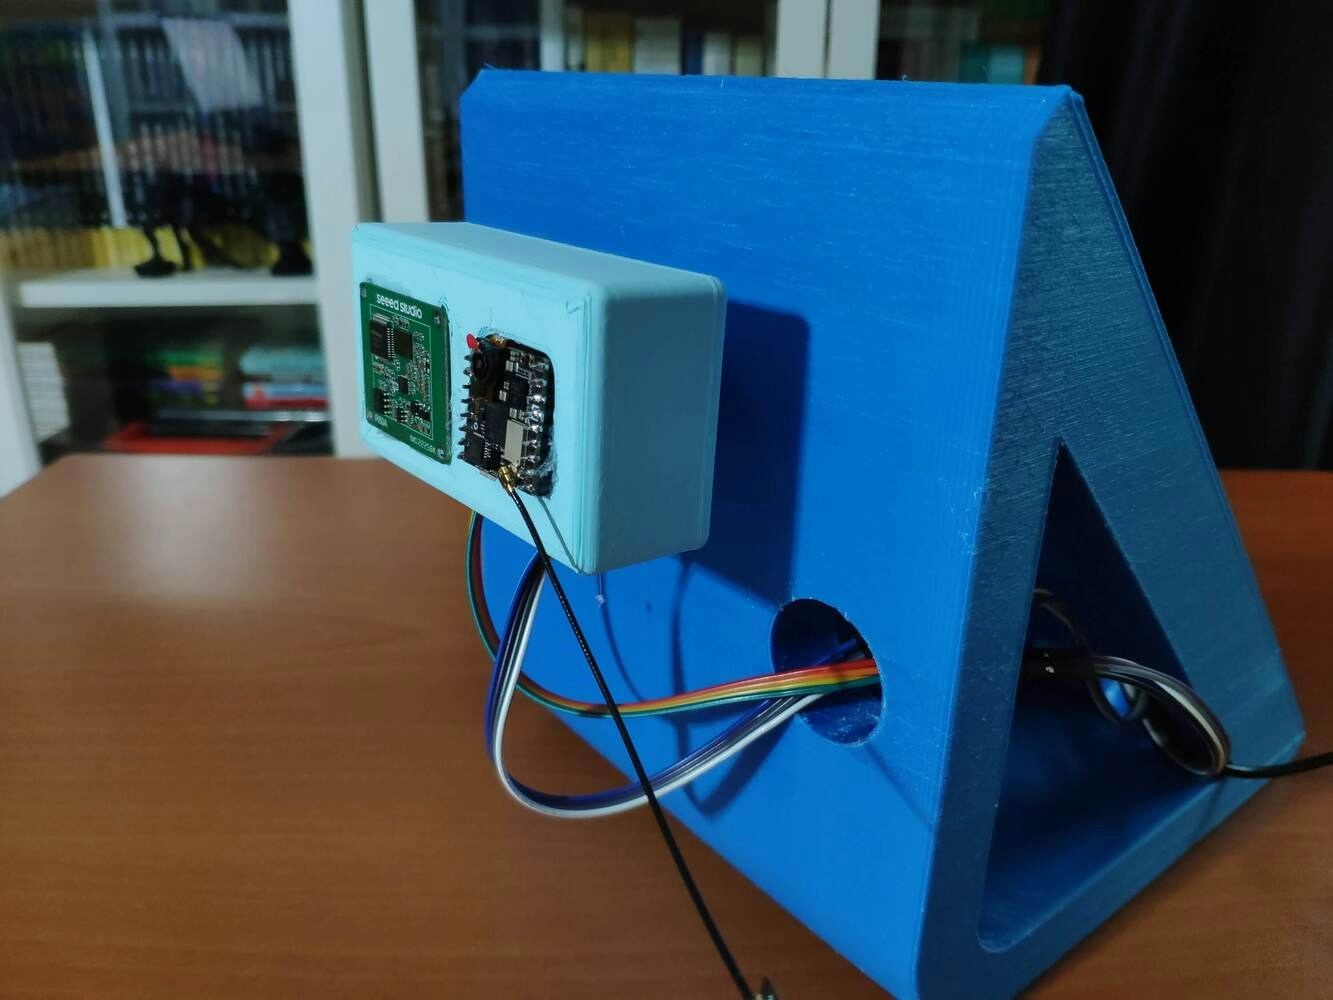
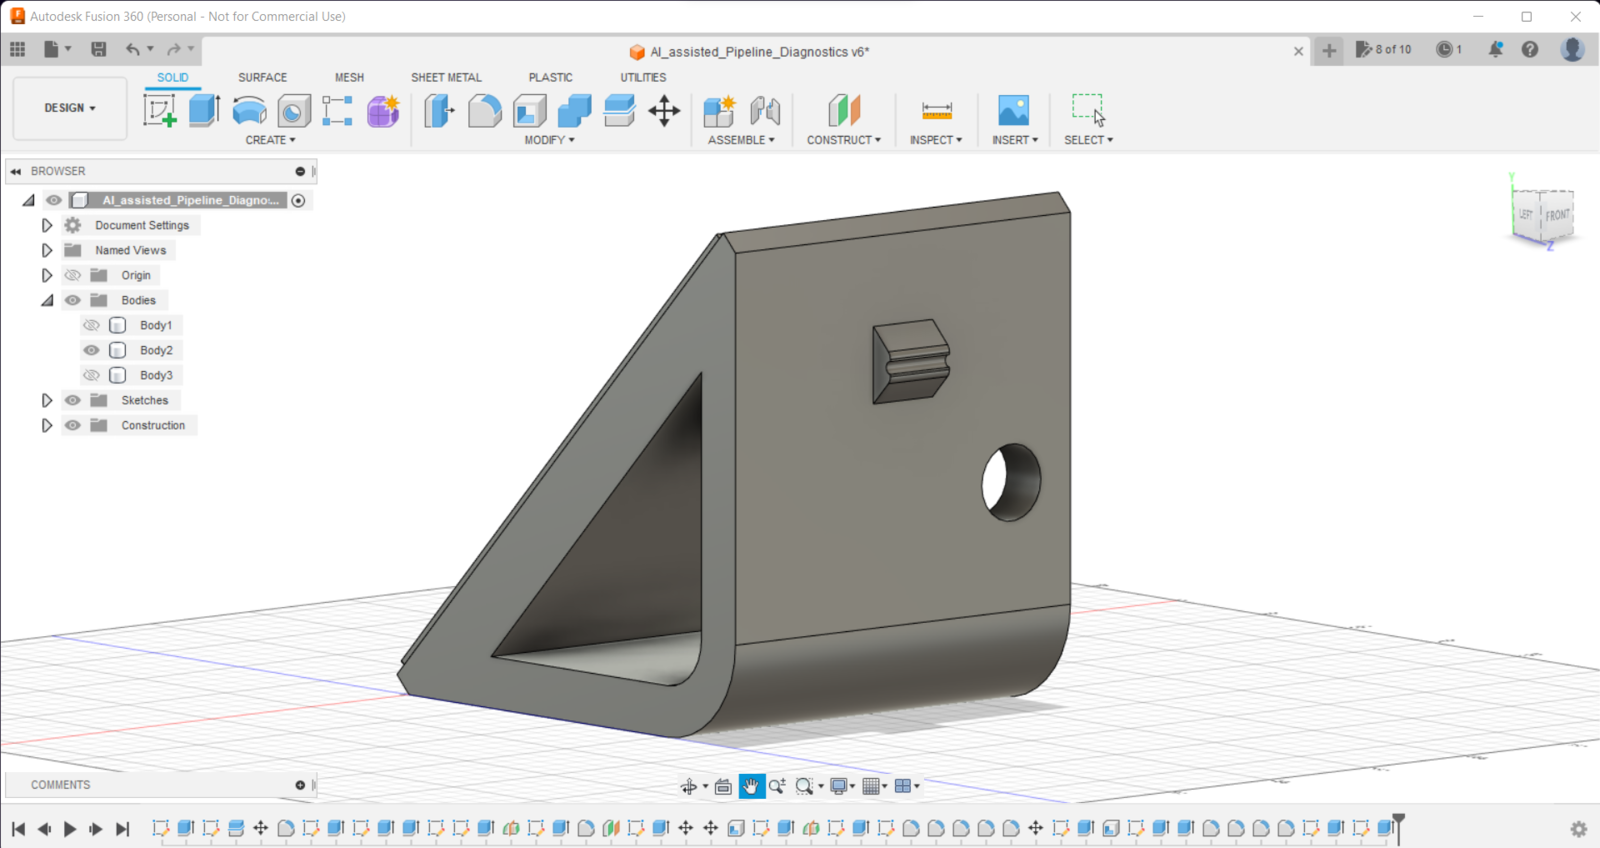
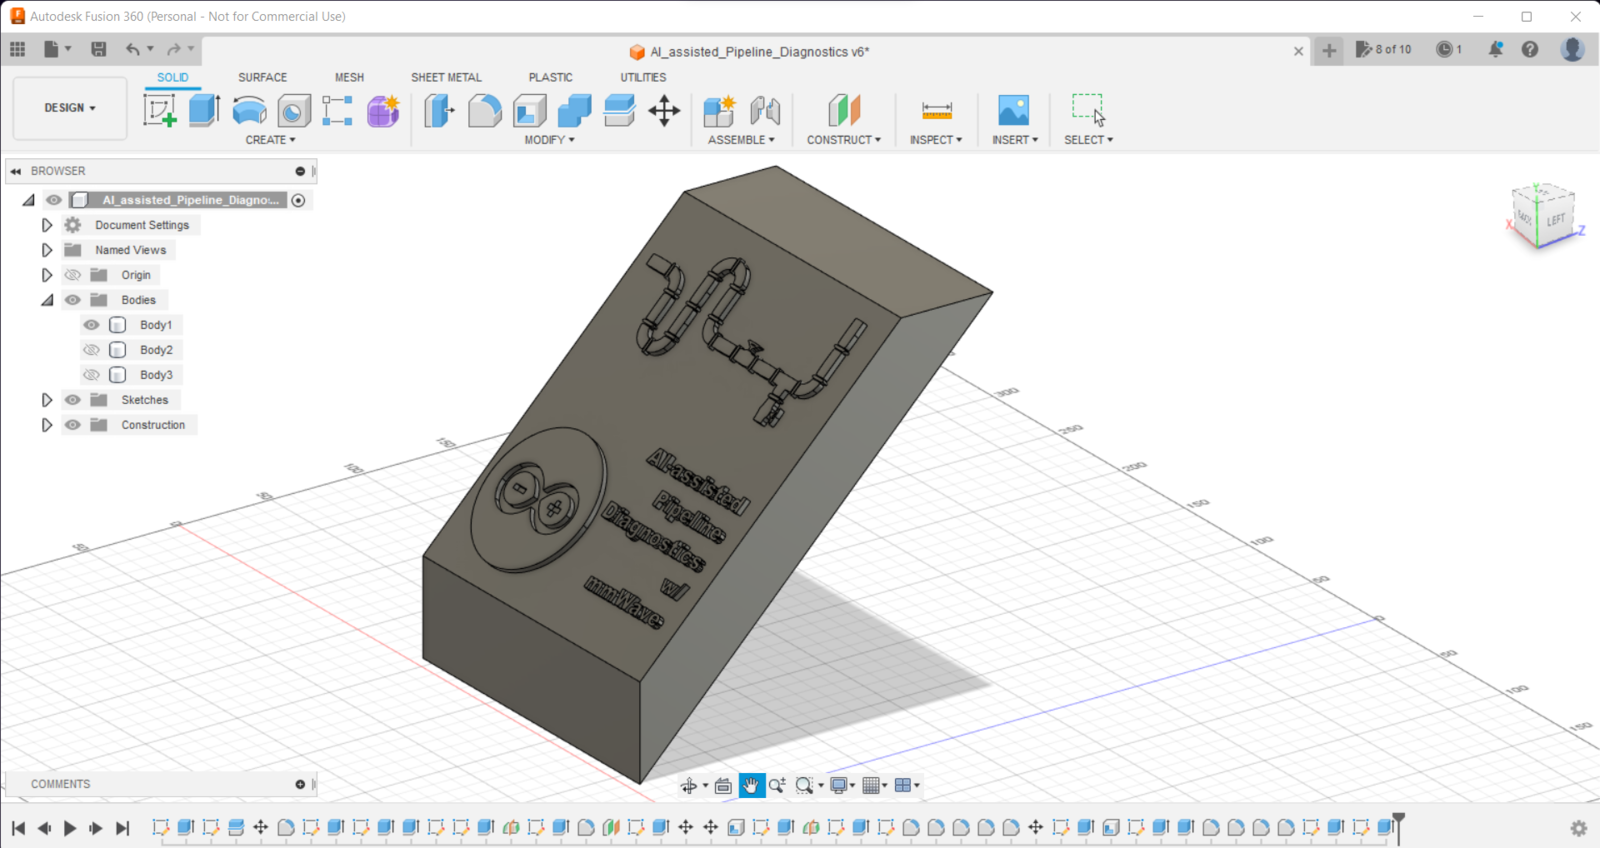
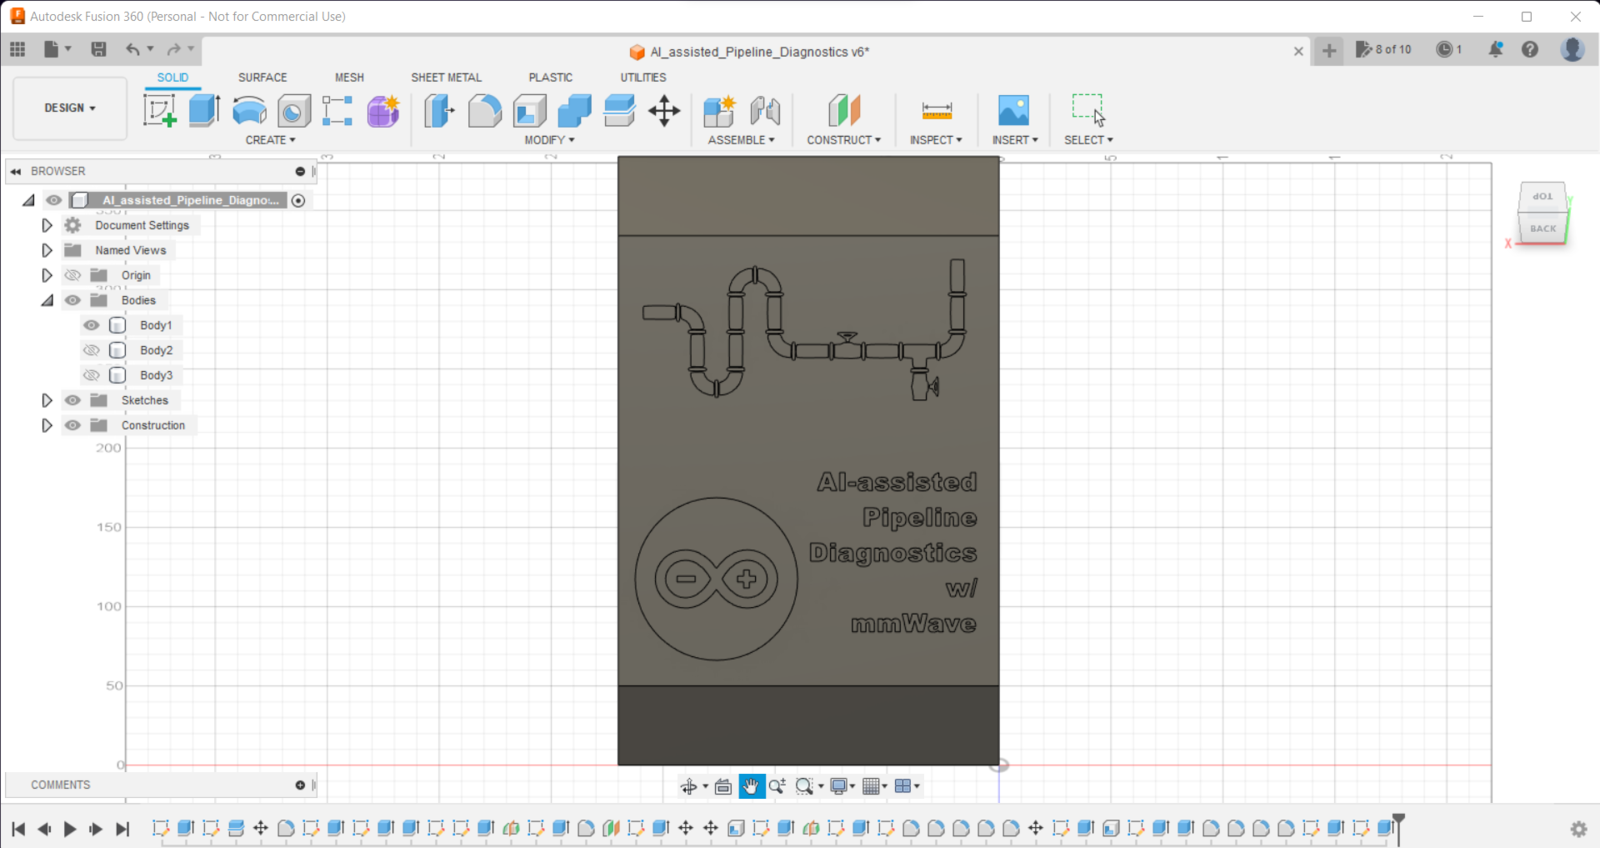
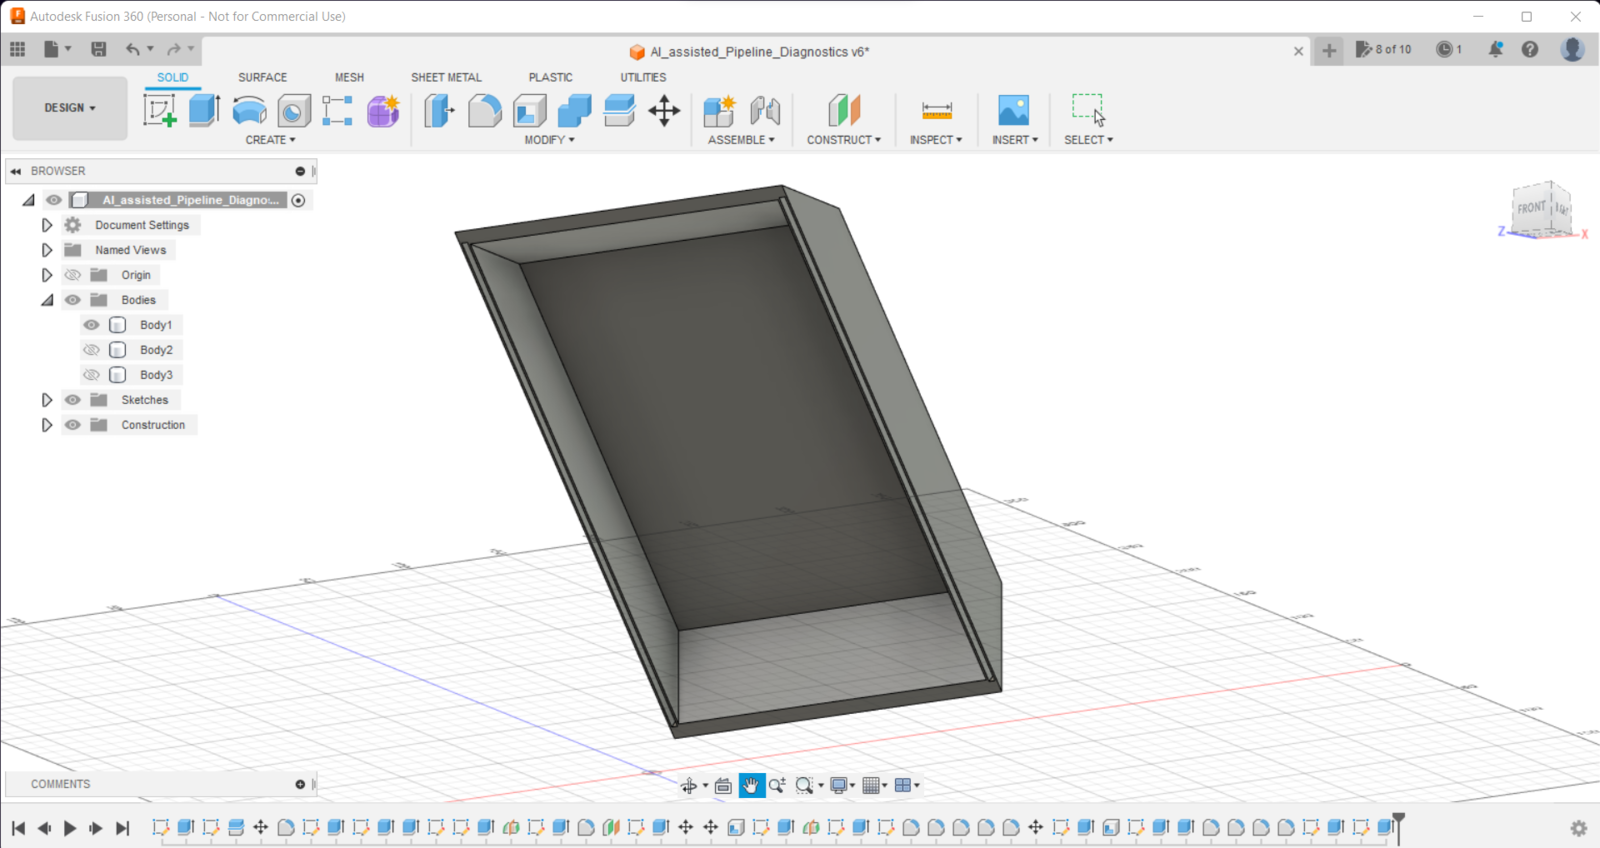
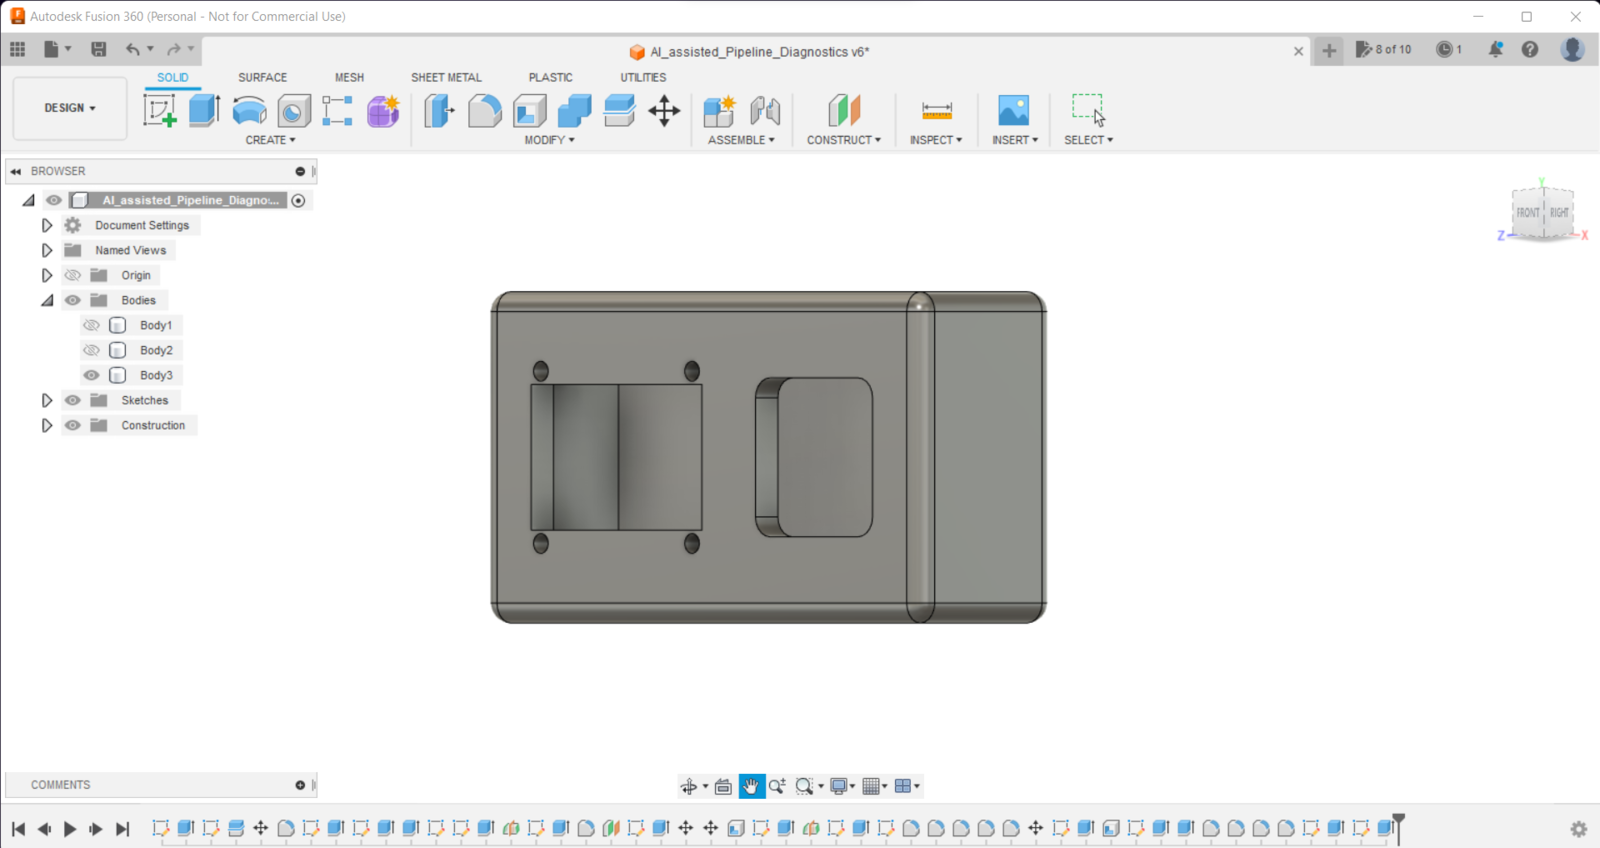
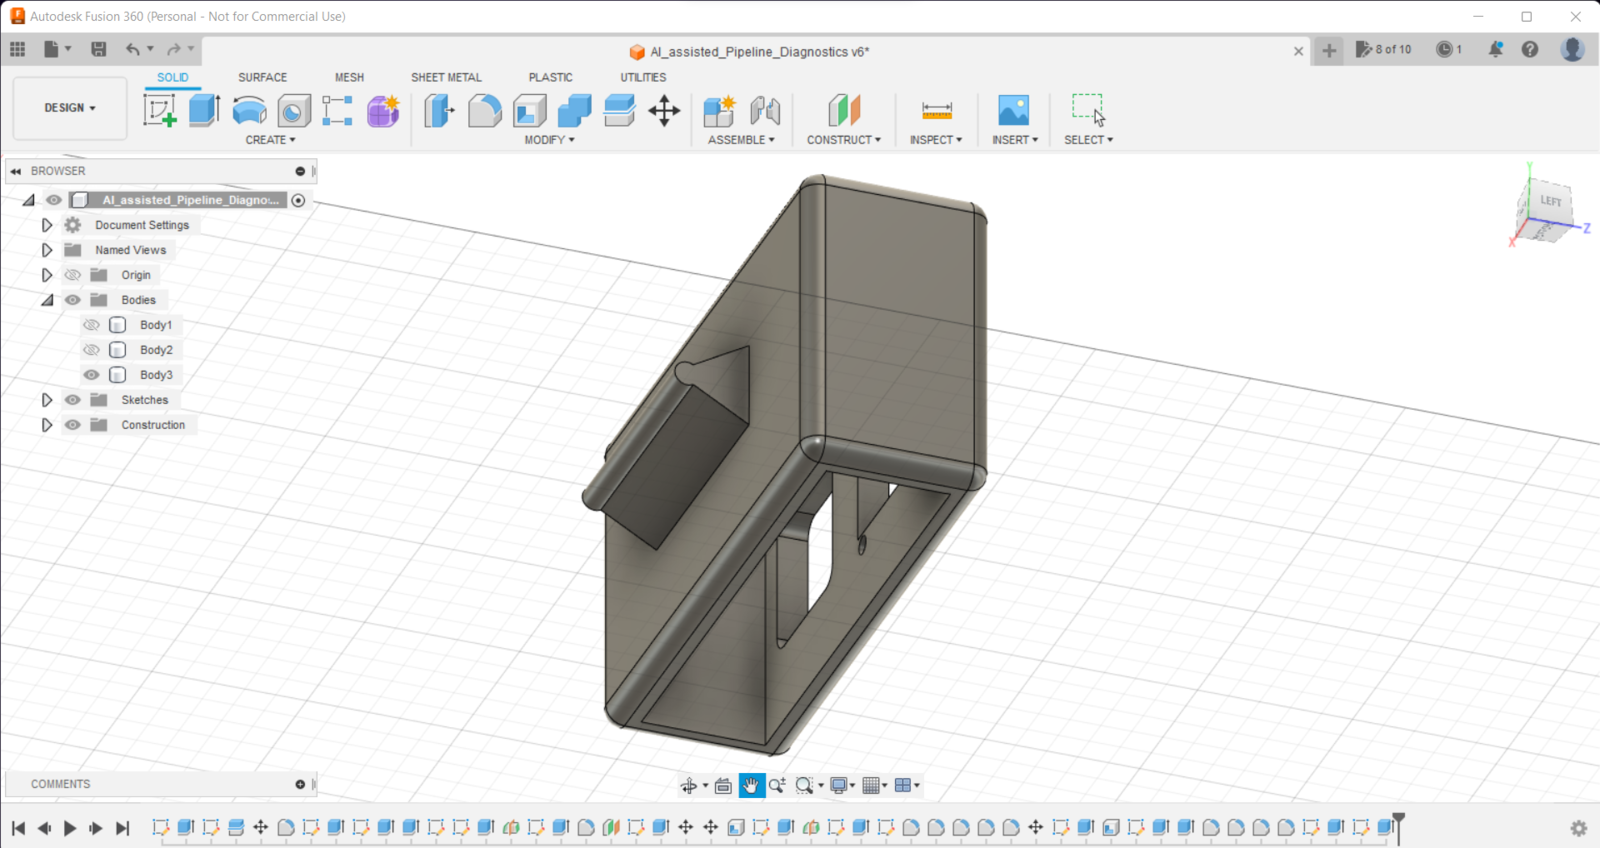
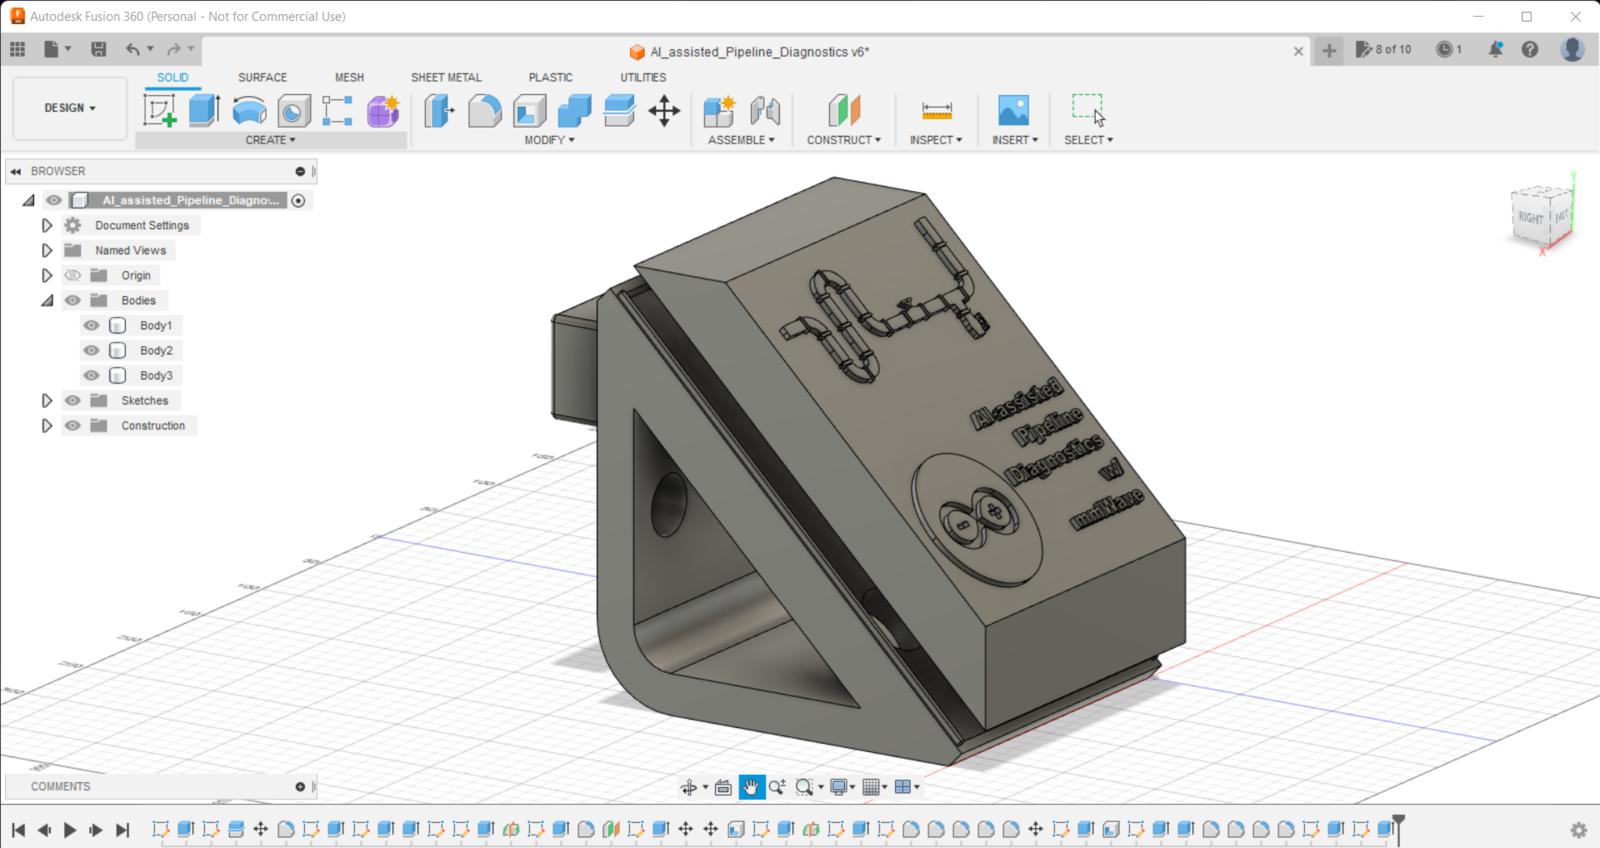
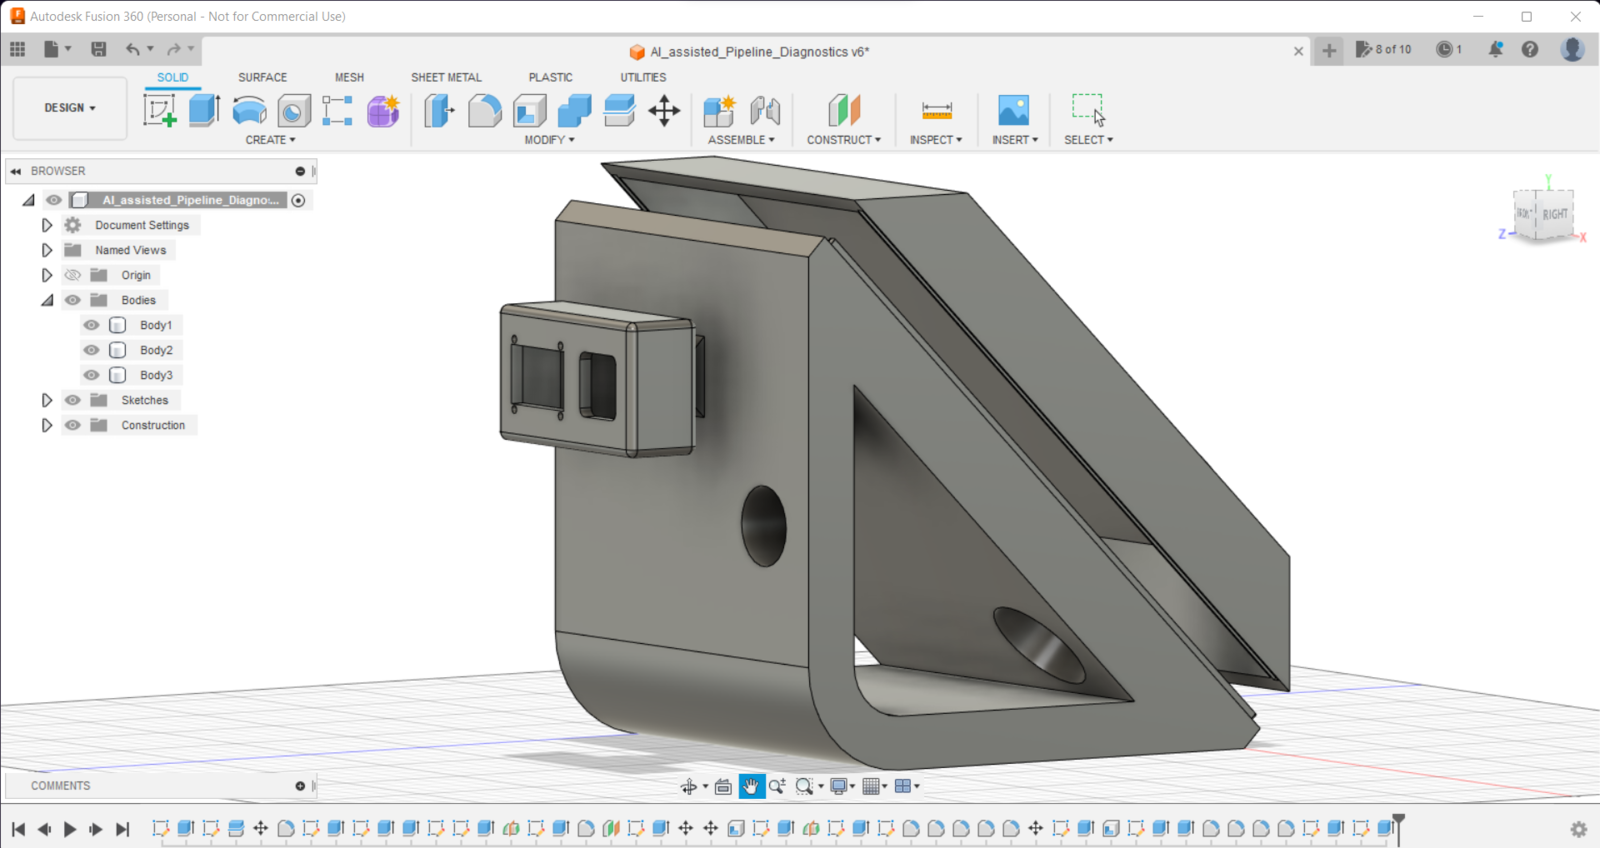
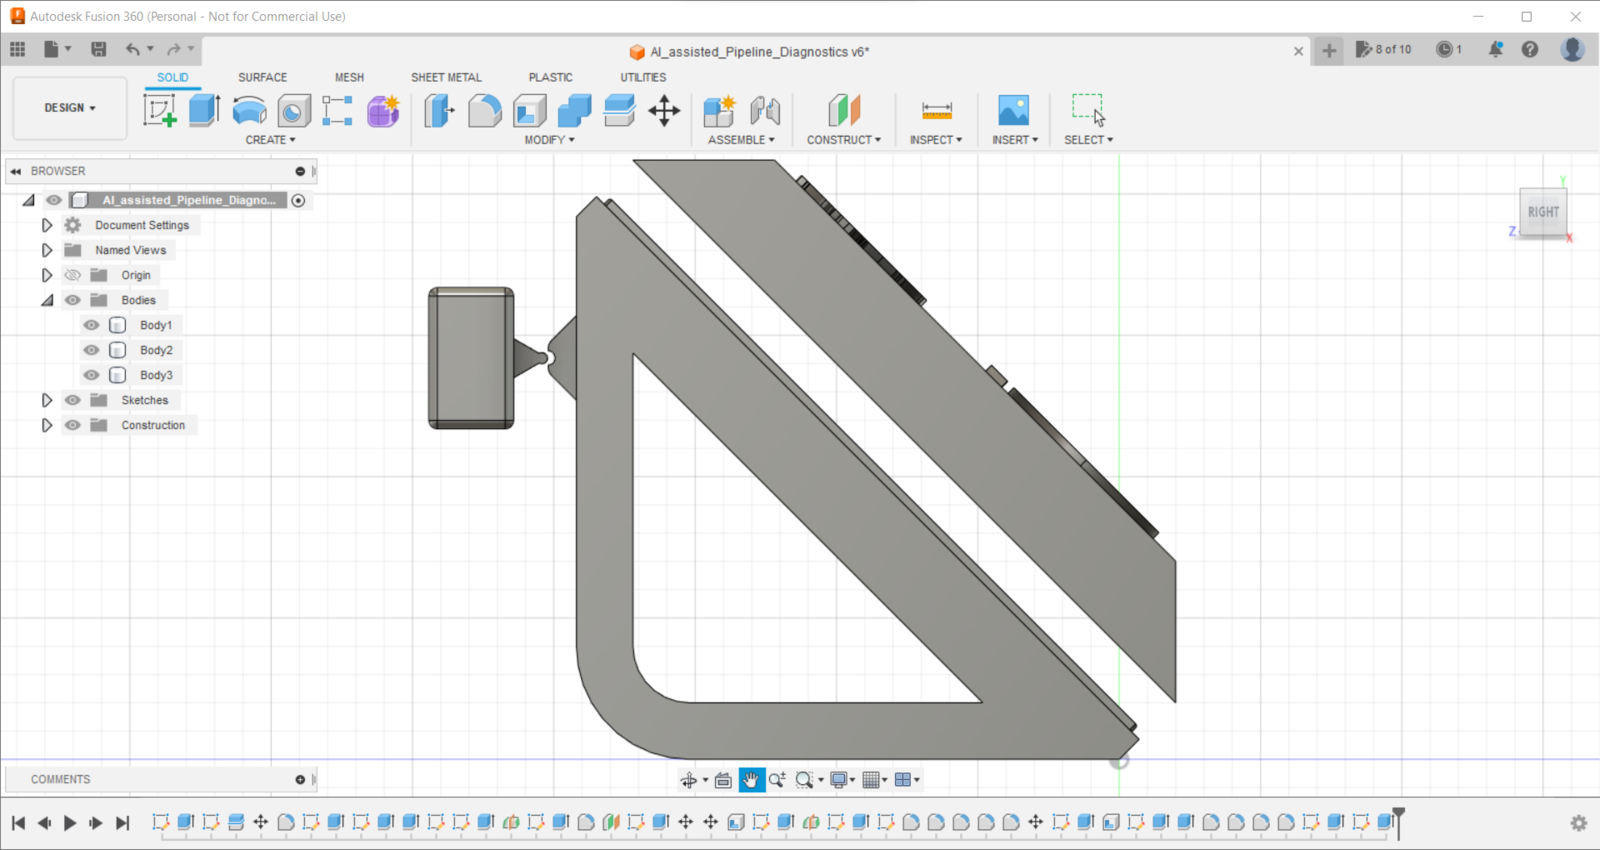
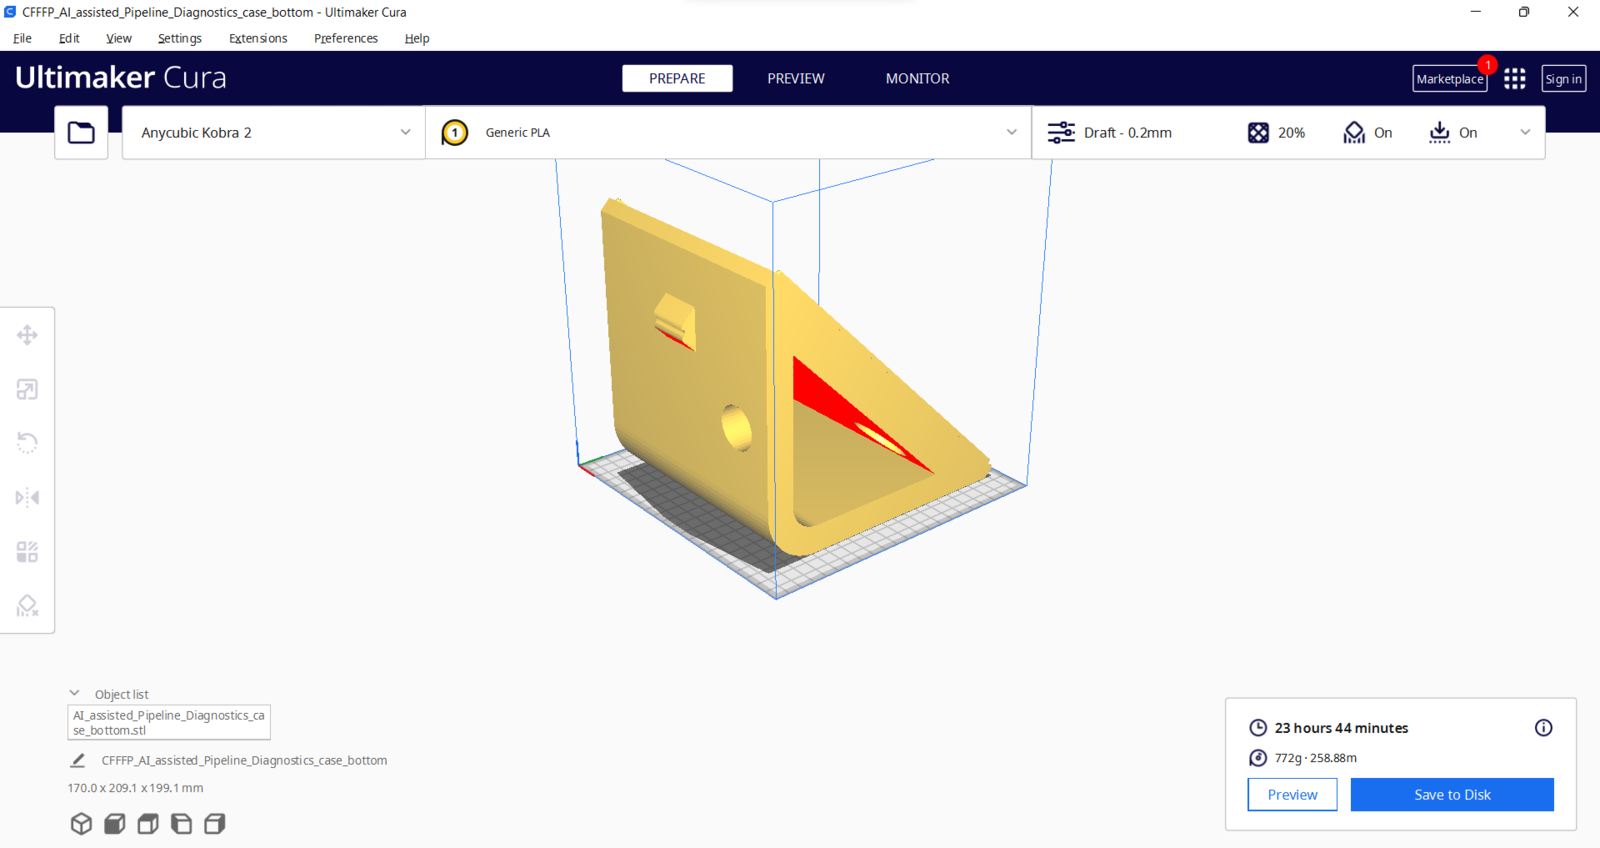
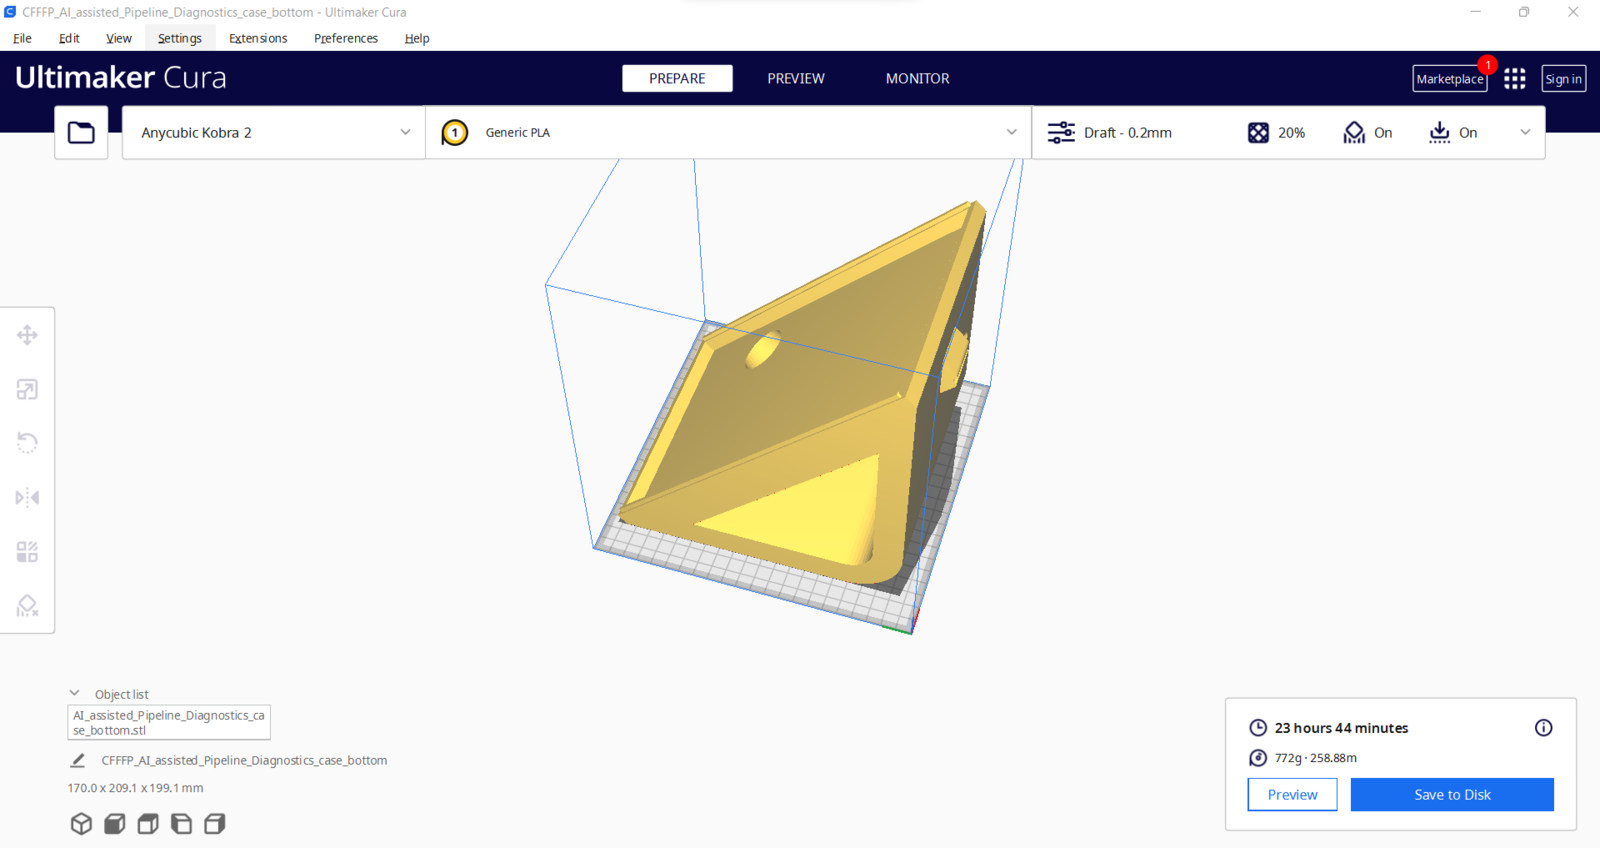
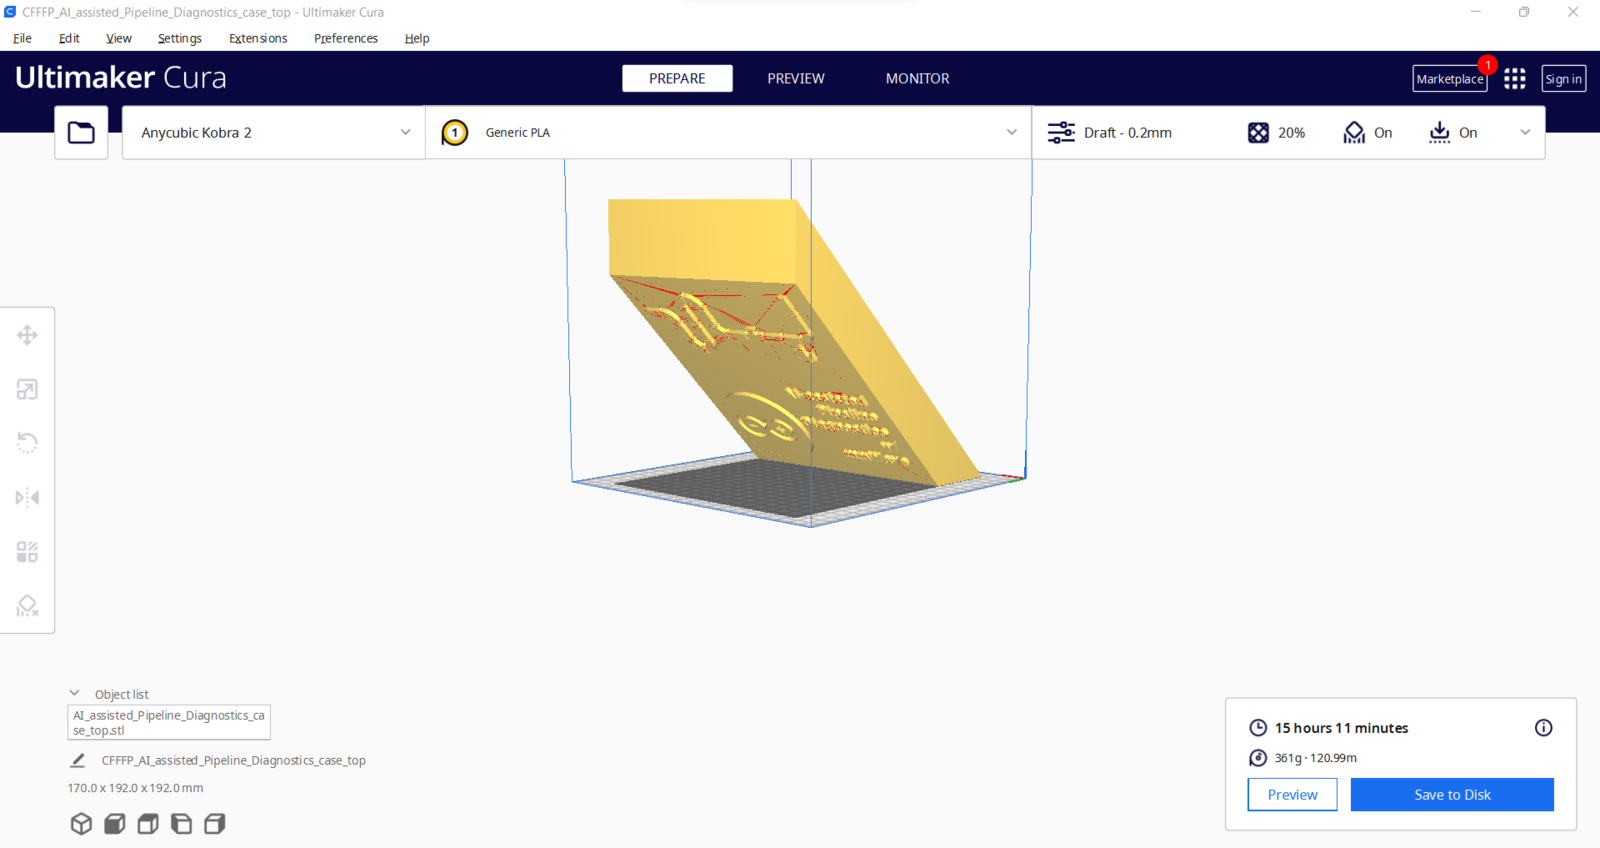
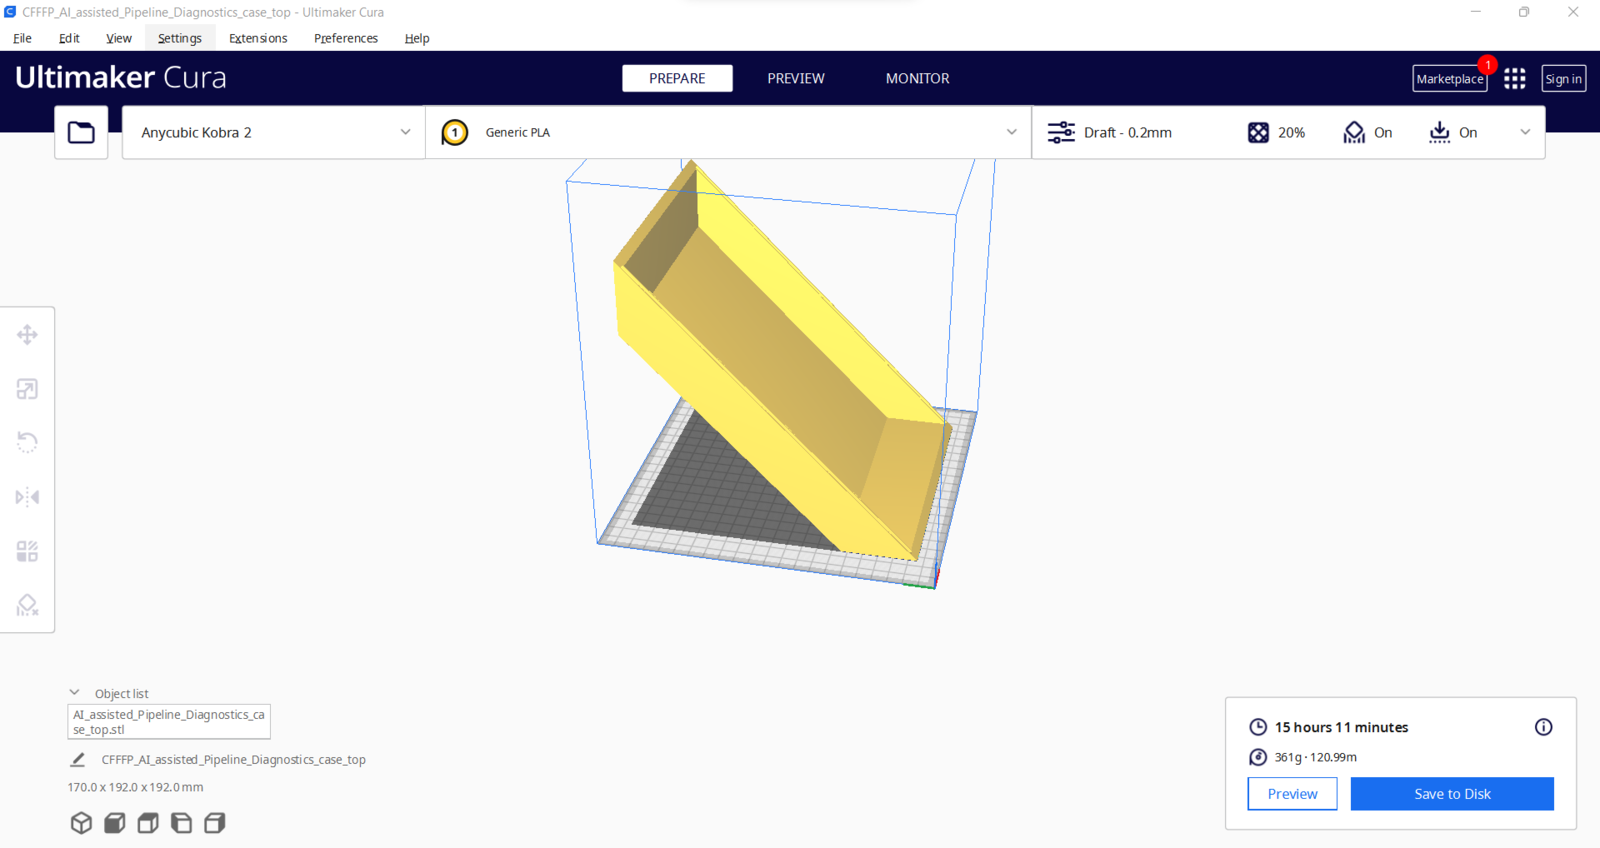
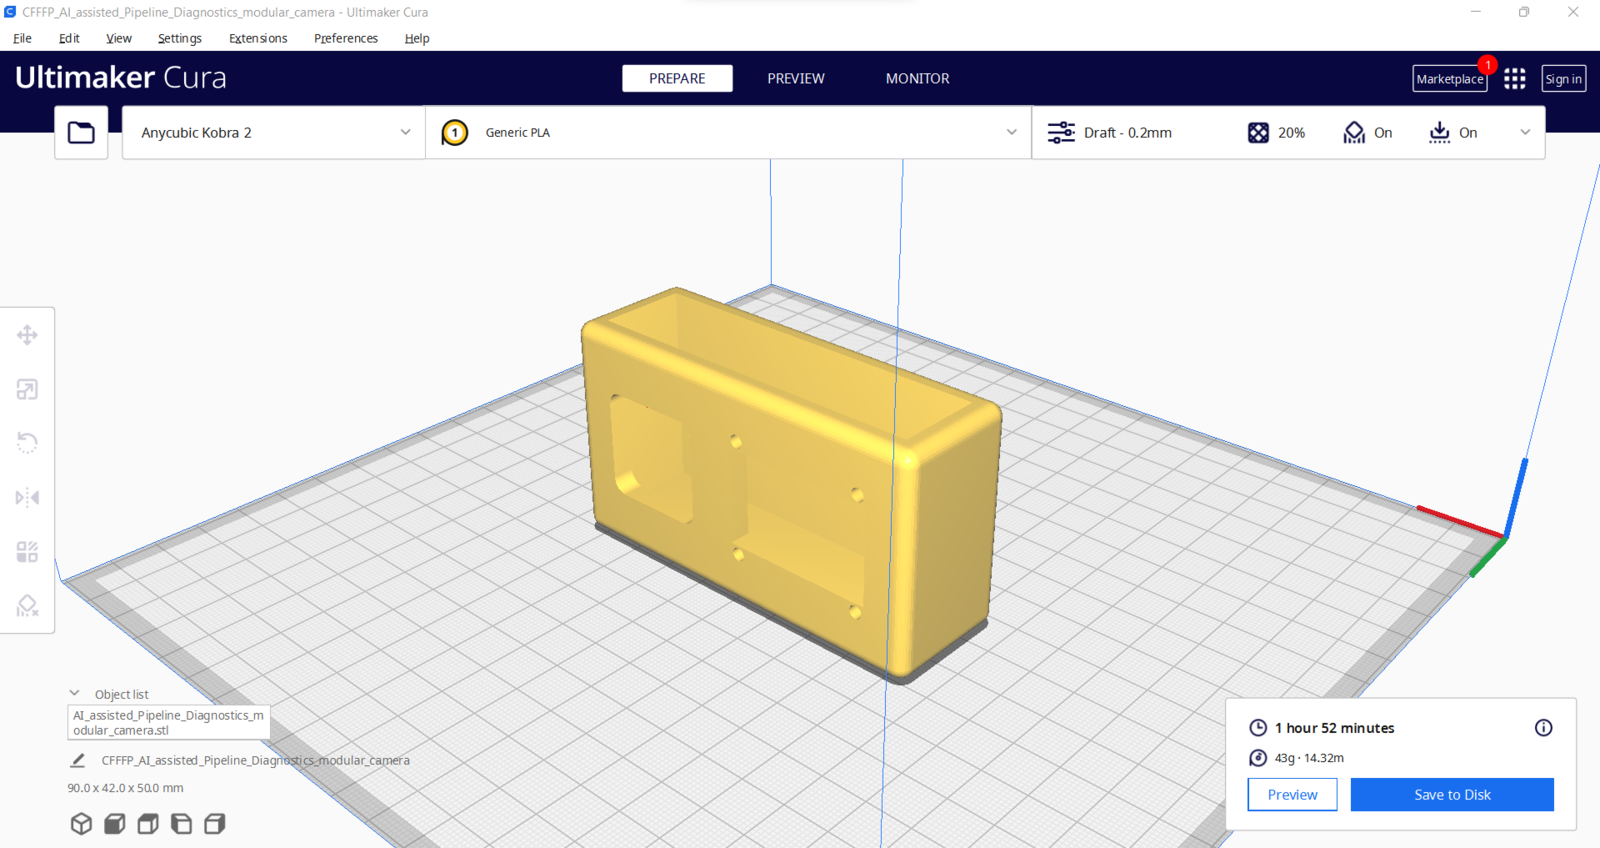
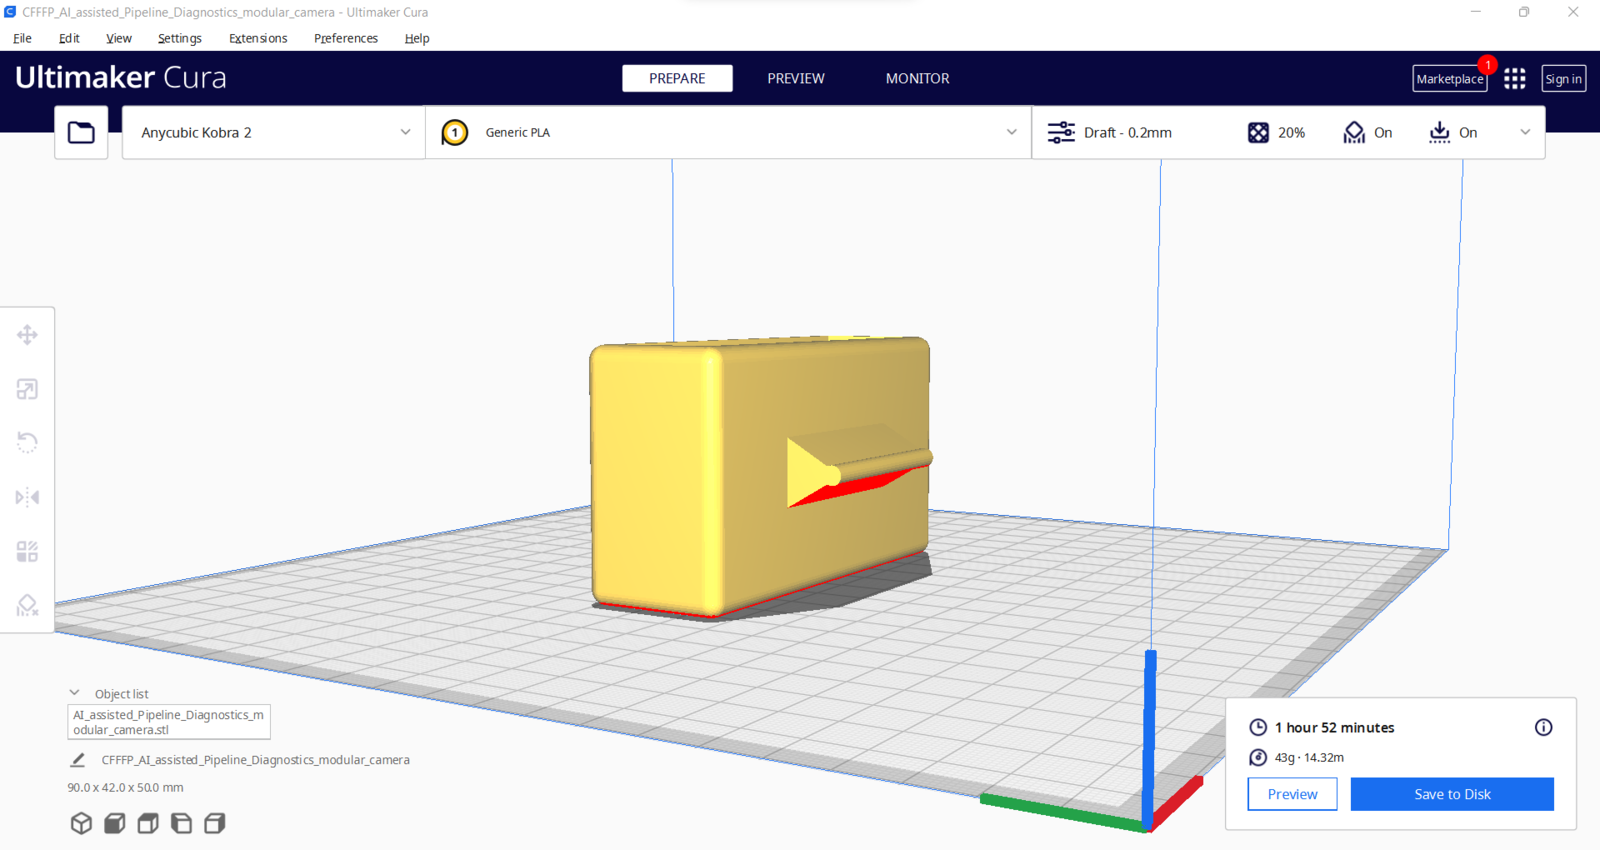
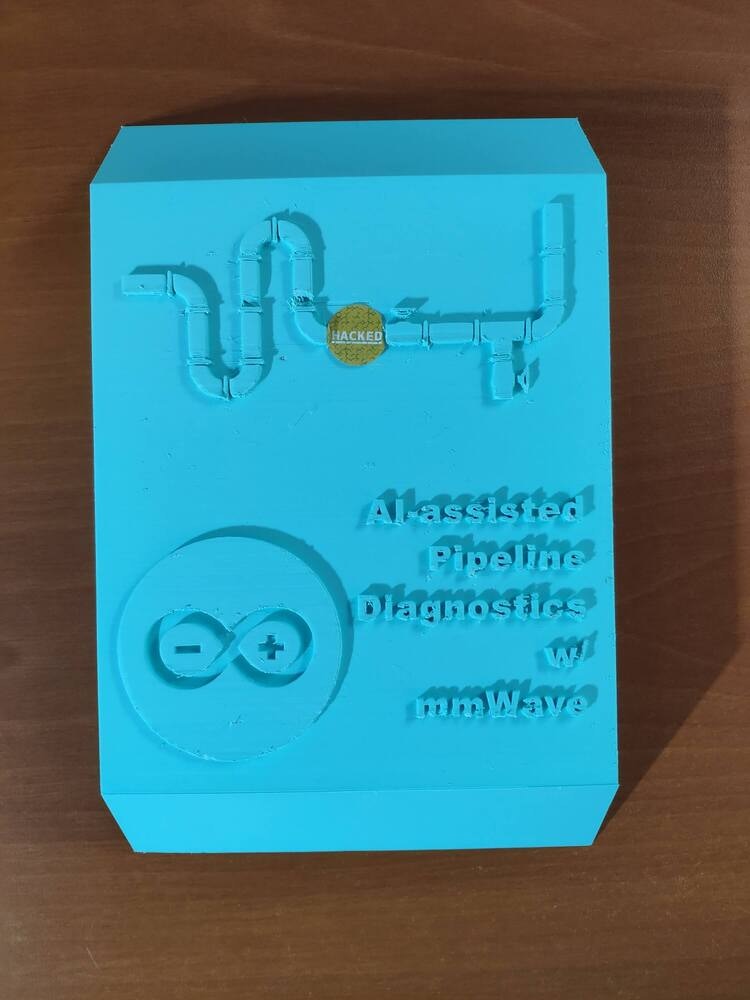
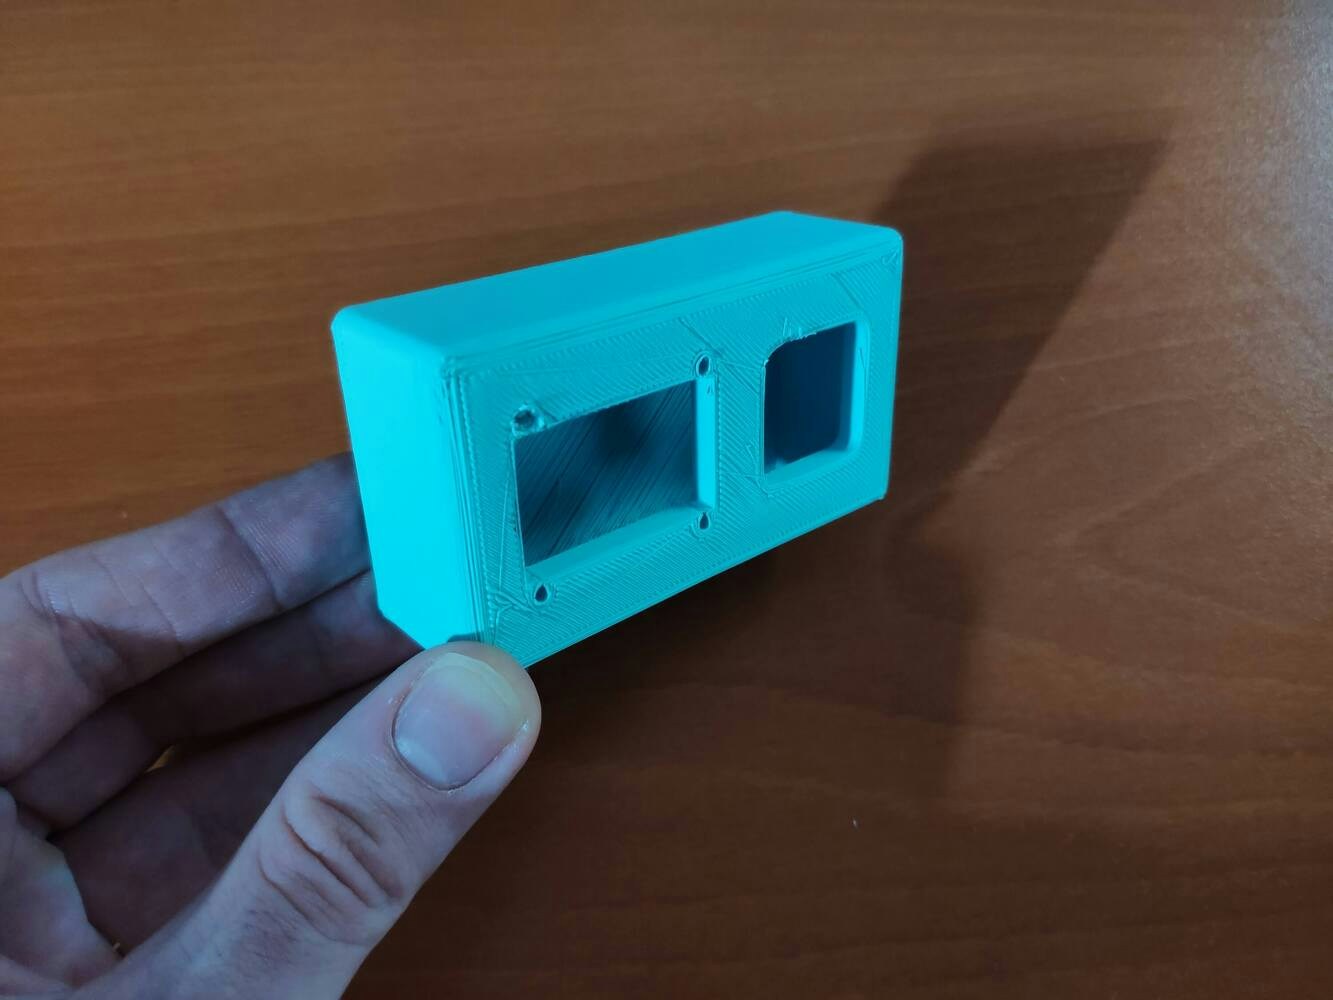
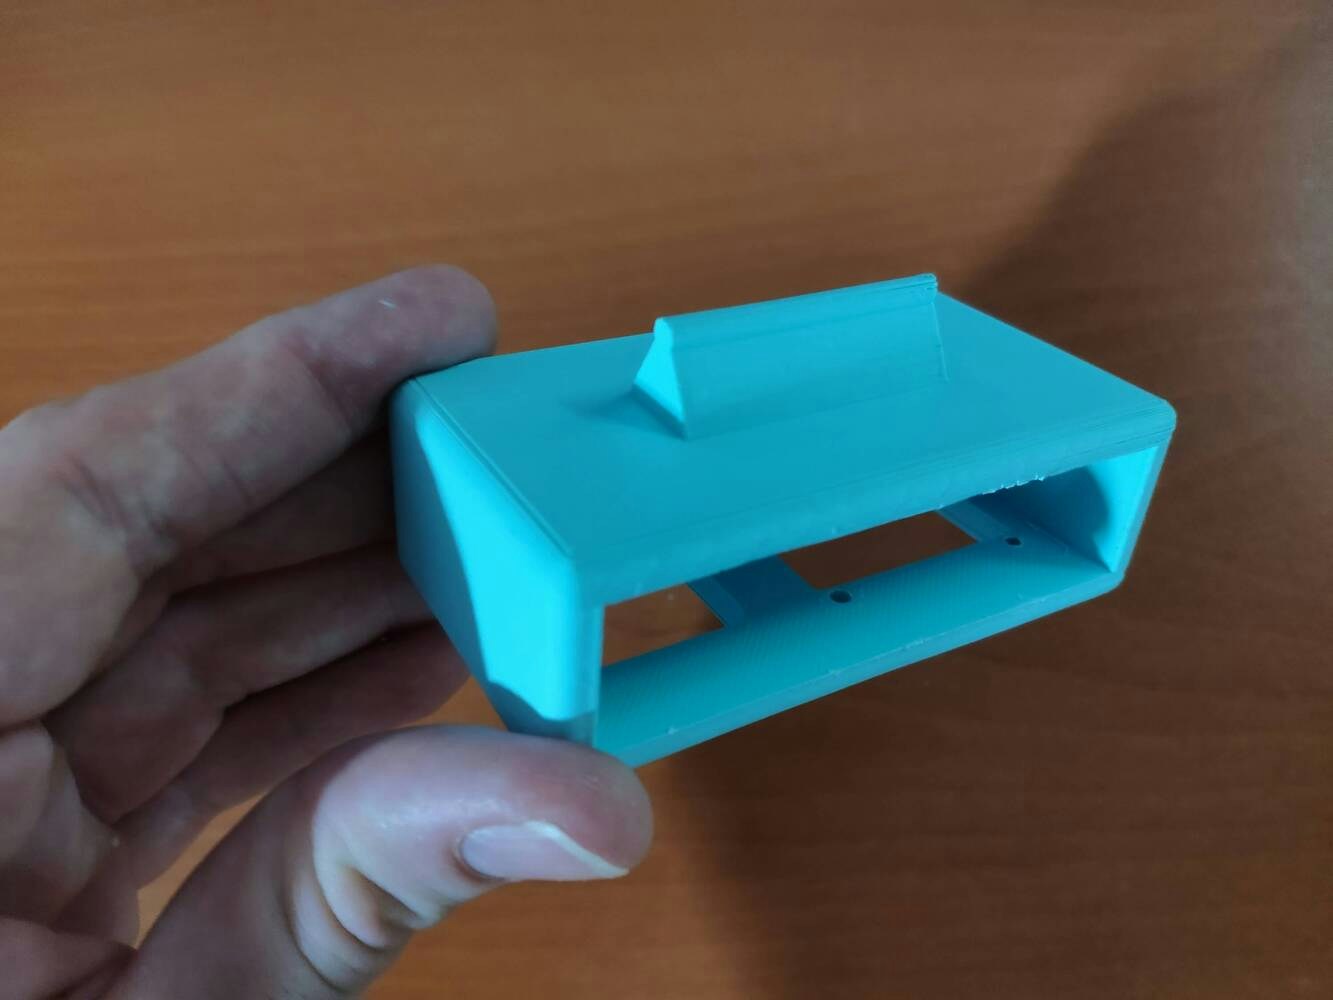
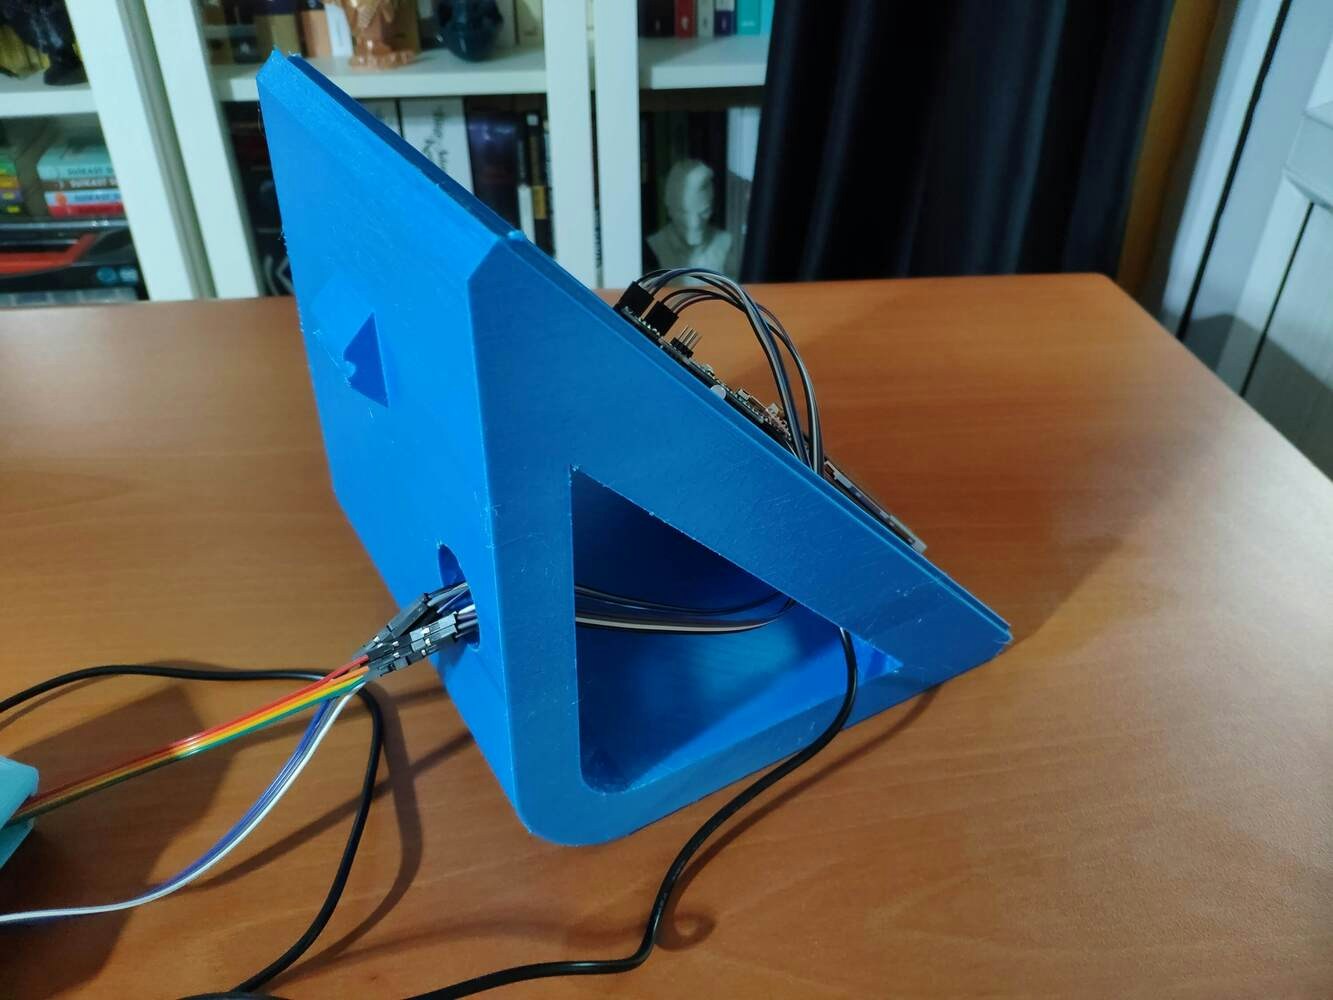
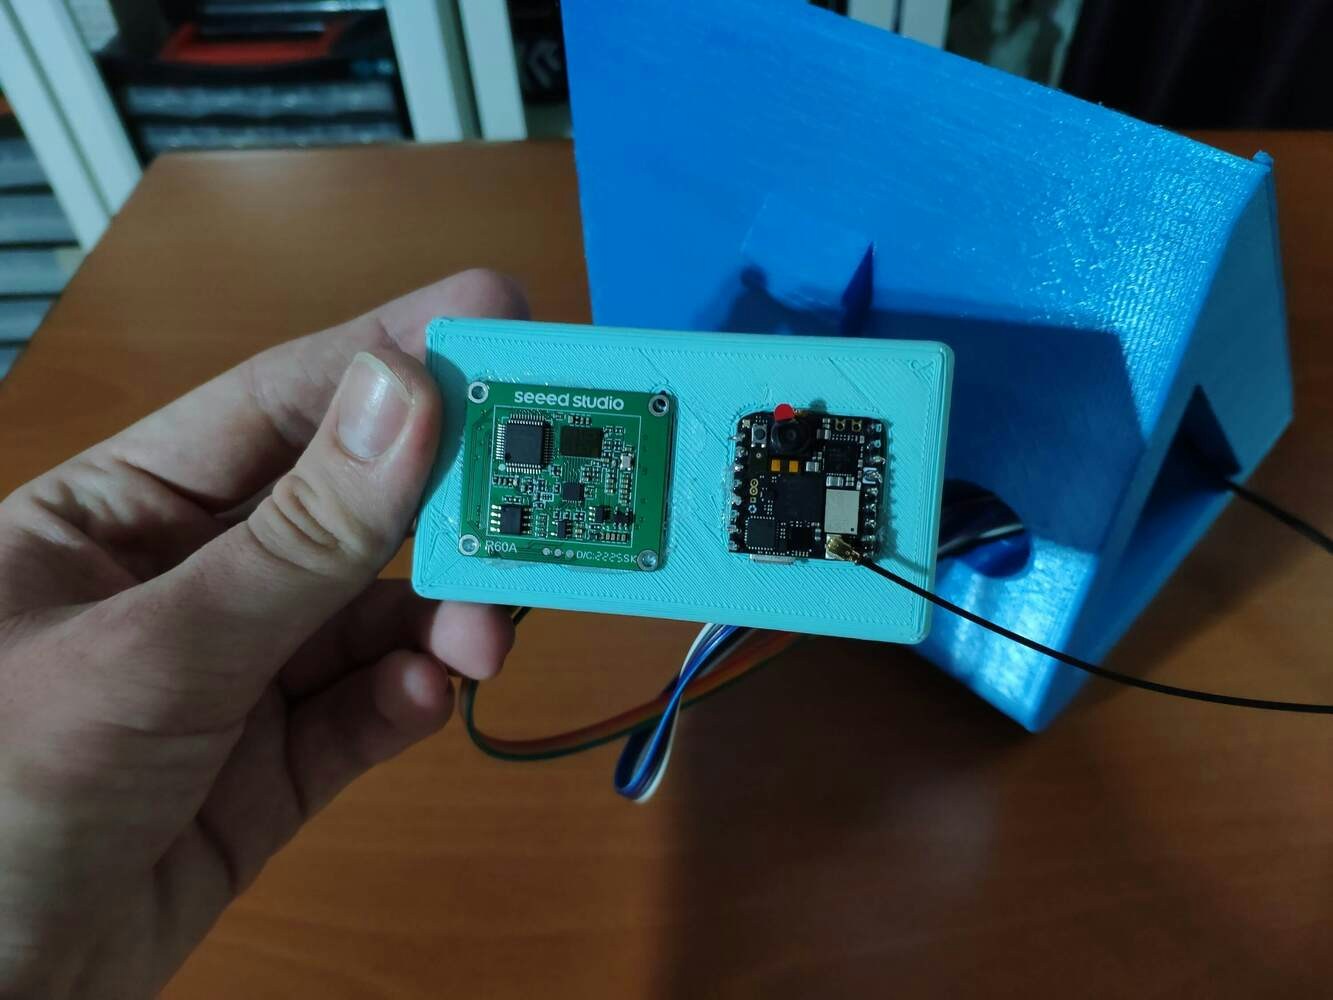
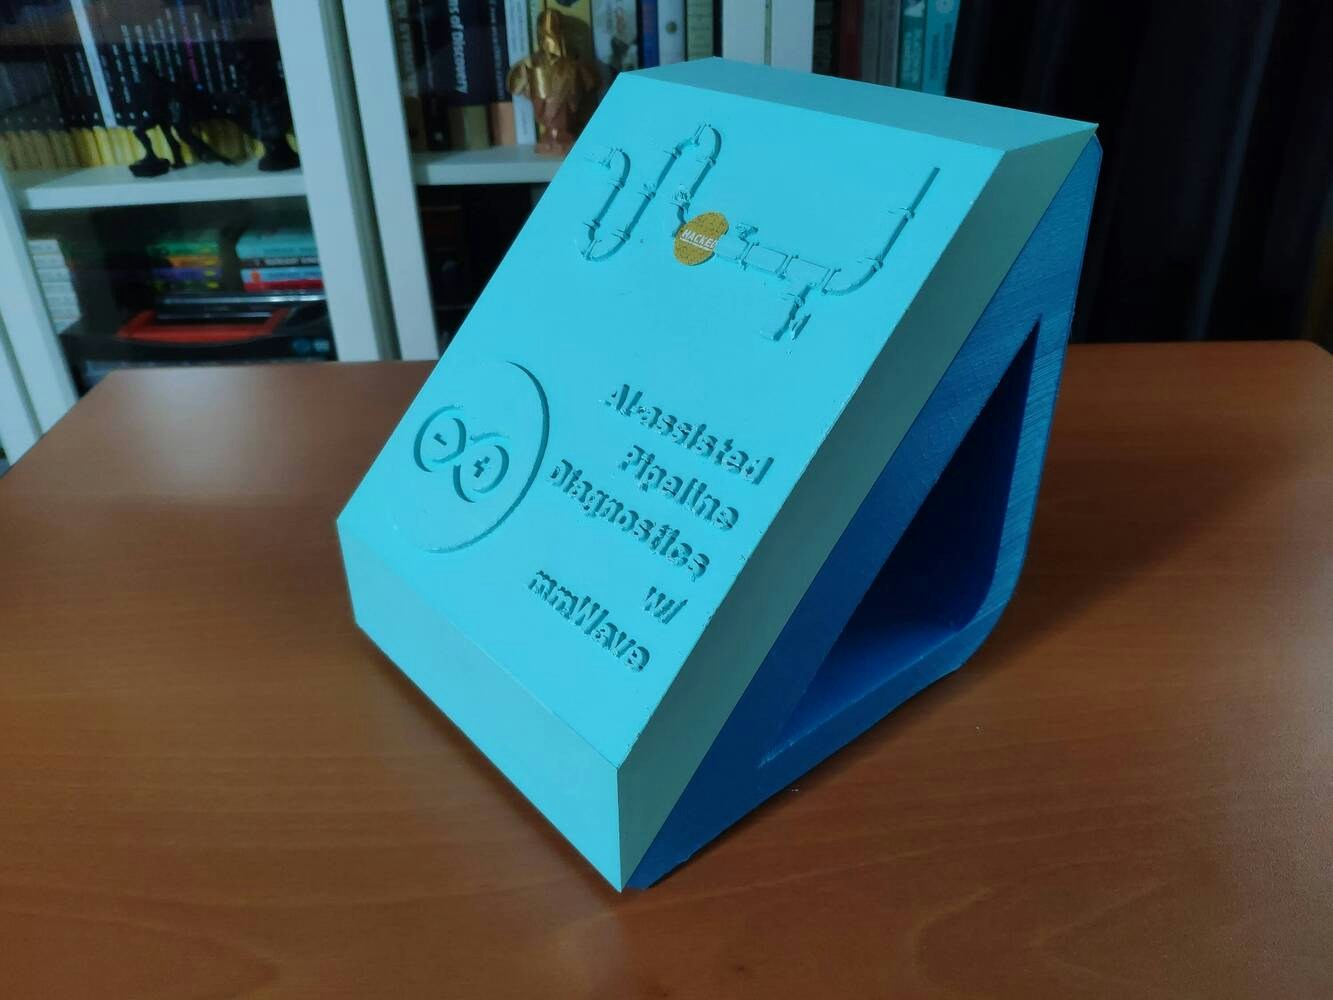
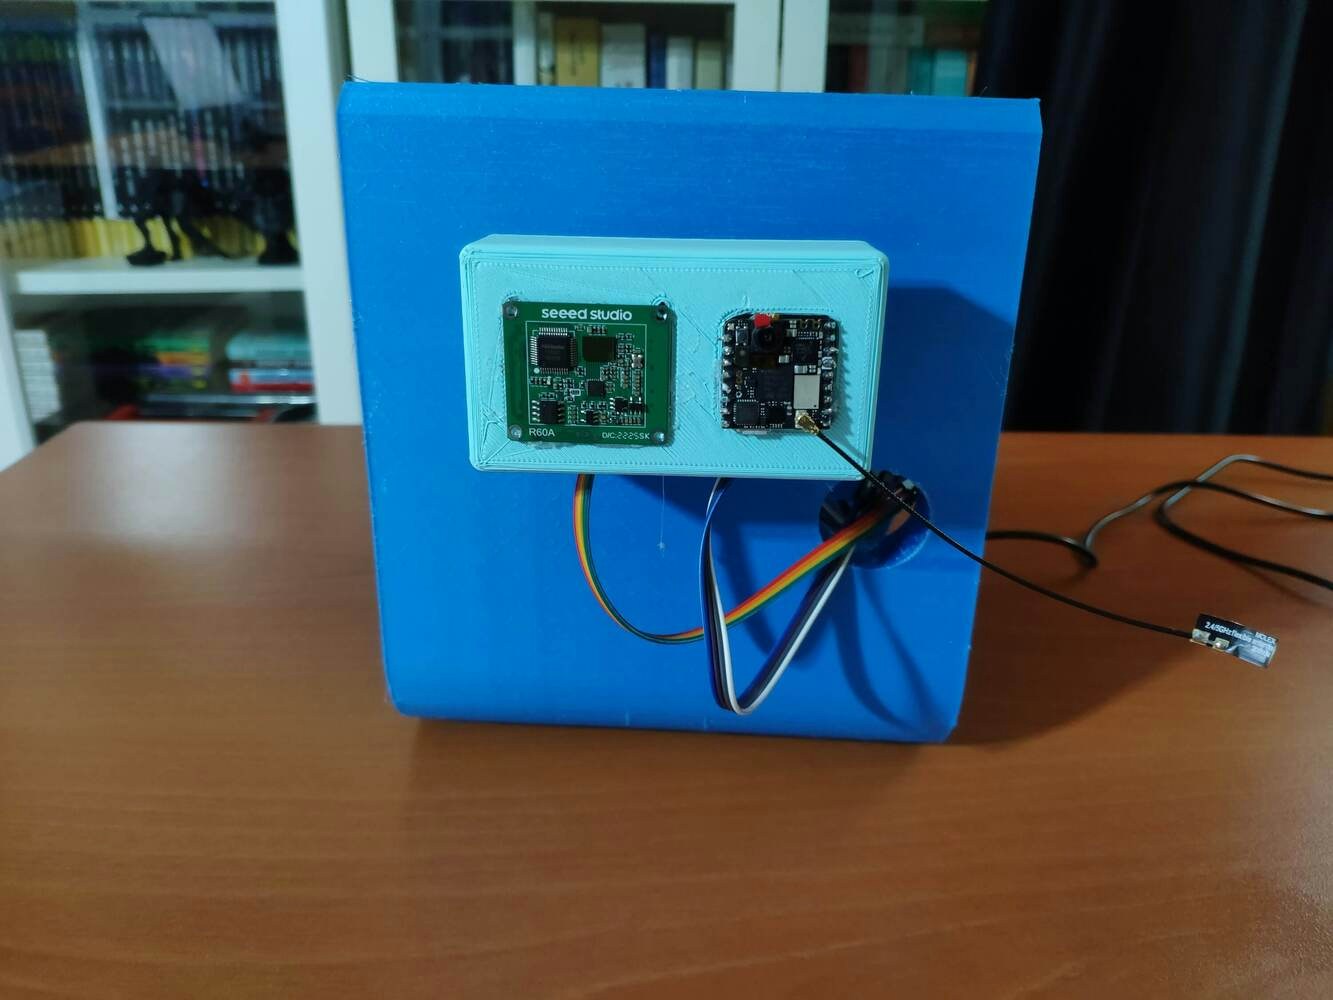
Since I focused on building a user-friendly and accessible mechanism that collects mmWave data parameters and runs a neural network model to inform the user of the diagnosed pipeline defects via a PHP web application, I decided to design a rigid and compact case allowing the user to place the 60GHz mmWave module and position the built-in GC2145 camera on Nicla Vision effortlessly. To avoid overexposure to dust and prevent loose wire connections, I added a sliding front cover aligned proportionally to the diagonal top surface. Then, I designed a modular camera holder mountable to the back of the case via a circular snap-fit joint. Also, I decided to emboss pipe icons and the Arduino symbol on the sliding front cover to emphasize the edge pipeline diagnostic processes. Since I needed to attach the Dragonite PCB to the main case, I decided to design an oblique structure for the case. In that regard, I was able to fit the PCB in the case without enlarging the case dimensions. I designed the main case, its sliding front cover, and the modular camera holder in Autodesk Fusion 360. You can download their STL files below.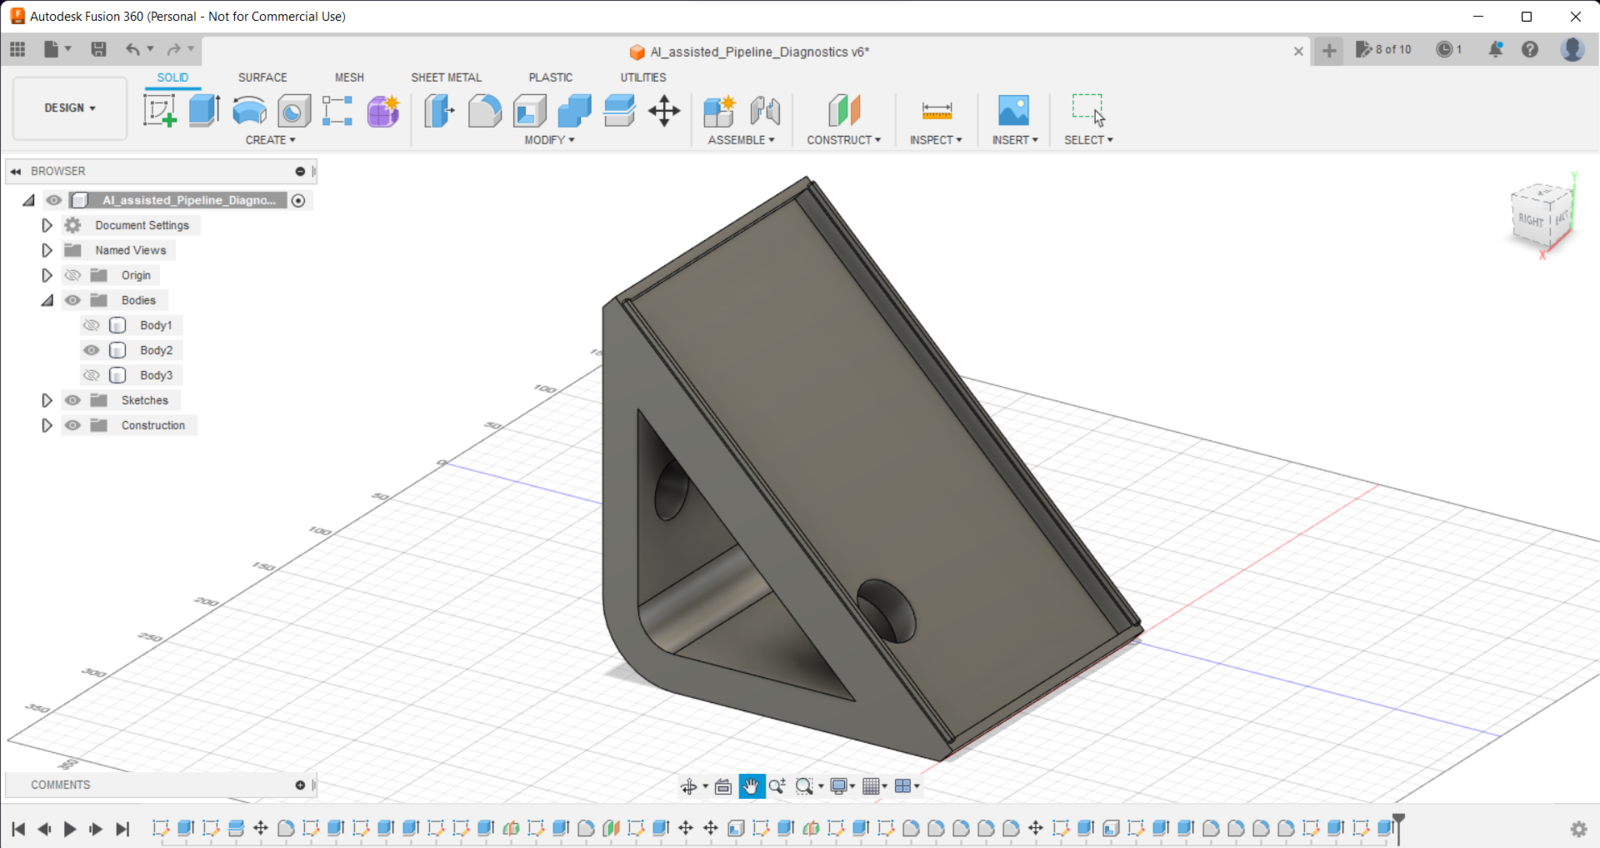
image
image

image
image
image
image
image
image
image
image
image
image
image
image
image
image
image
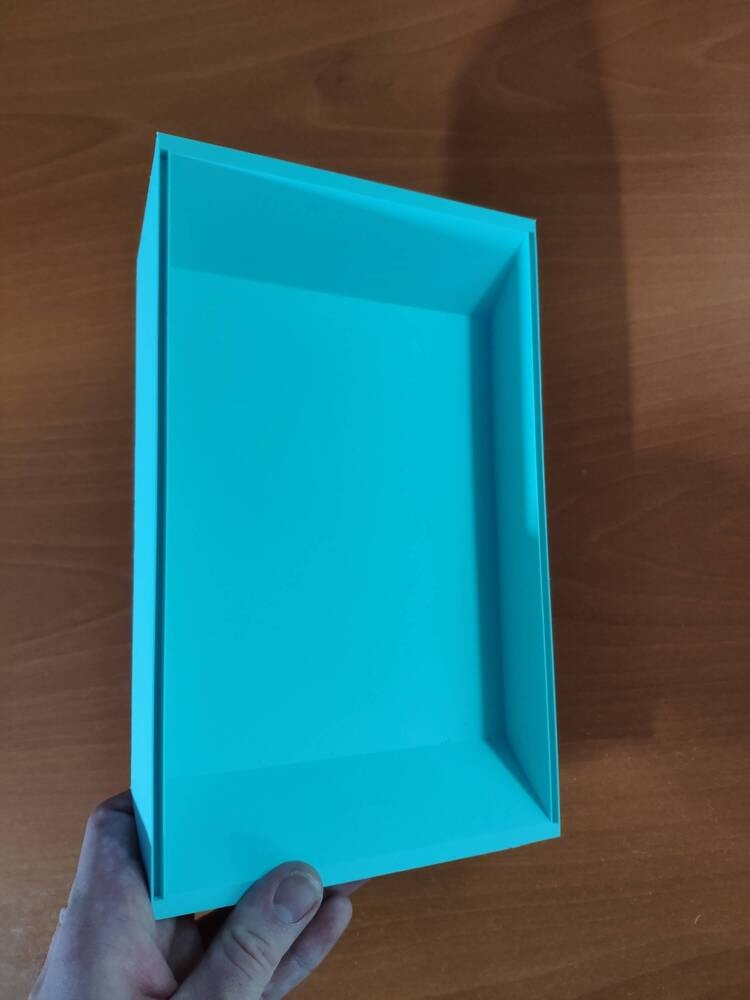
- eSilk Cyan
- ePLA-Matte Light Blue
image
image
image
image
image
image
image
image
image
image
image
image
image
image
image
image
image
image
image
image
image
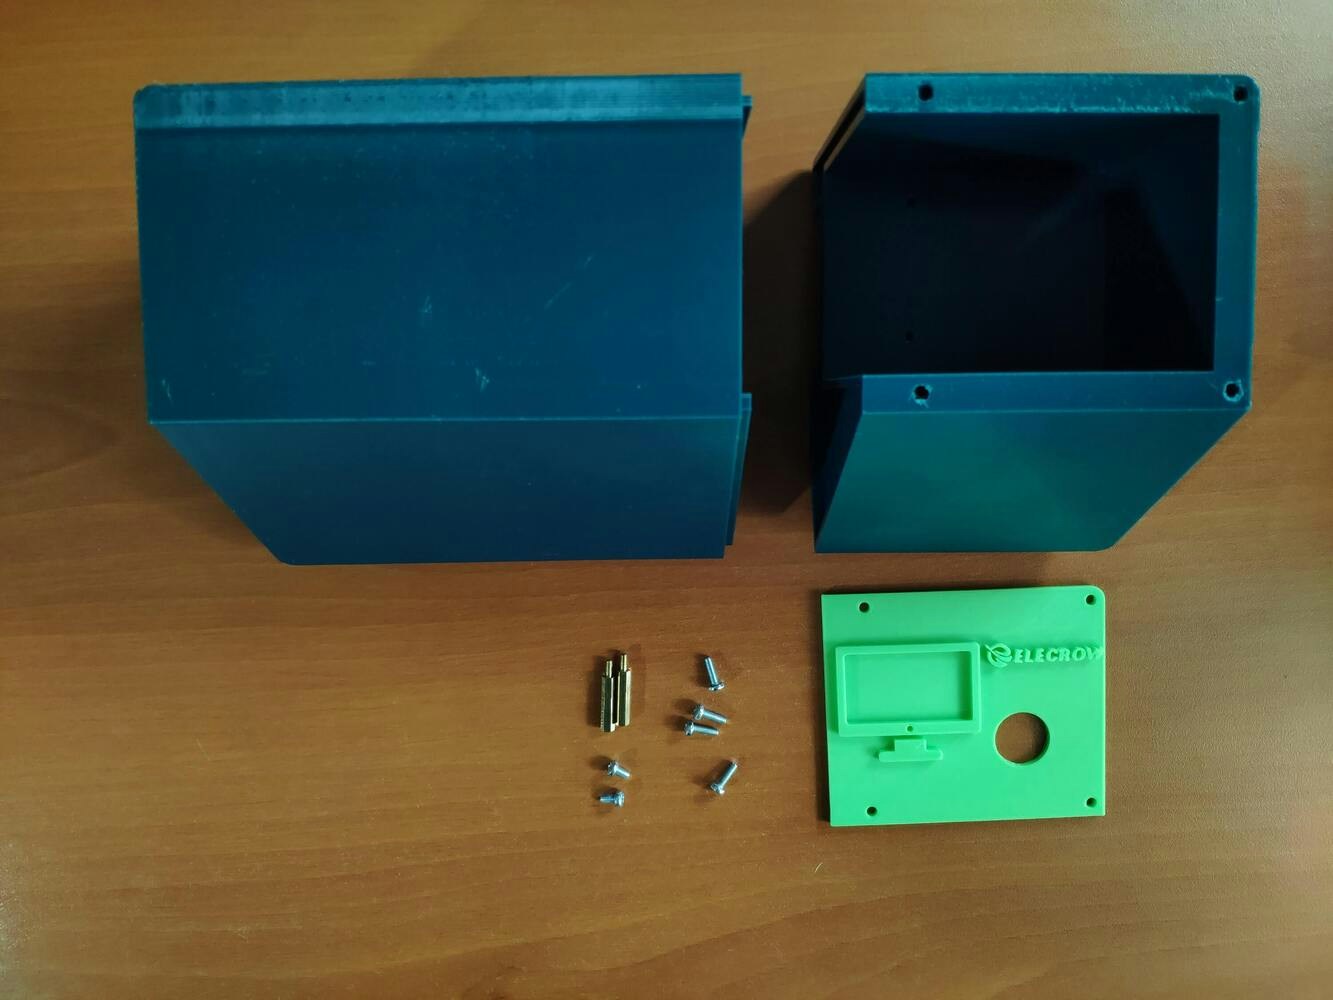
Step 2.1: Assembling the liquid-themed case
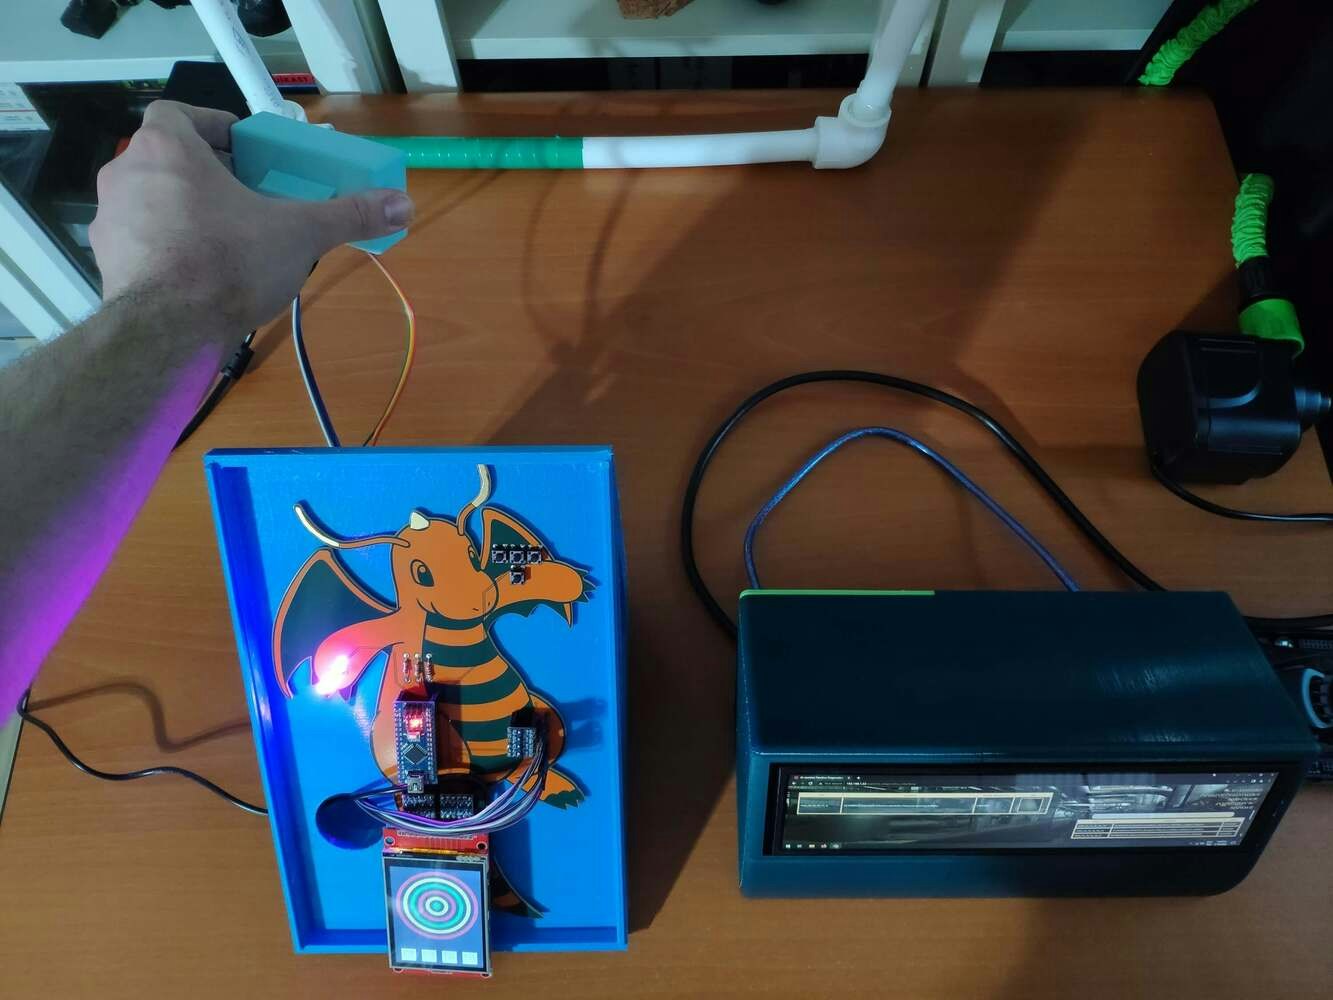
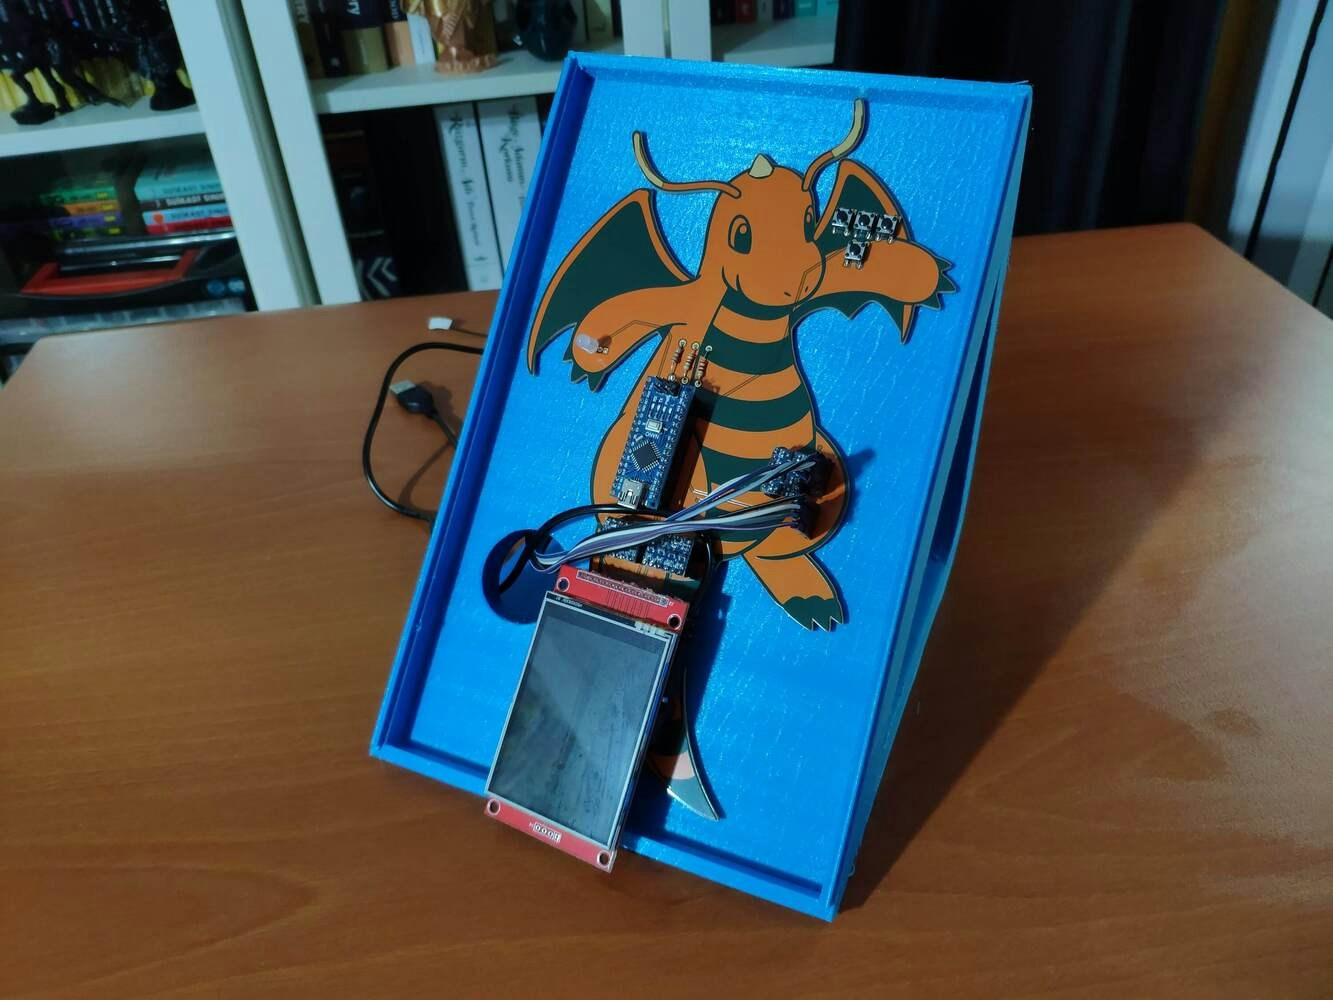
After printing all parts (models), I fastened Dragonite PCB to the diagonal top surface of the main case via a hot glue gun. I placed Nicla Vision and the 60GHz mmWave module in the modular camera holder. Then, I attached the camera holder to the main case via its circular snap-fit joint. Finally, I inserted the sliding front cover via the dents on the diagonal top surface of the main case.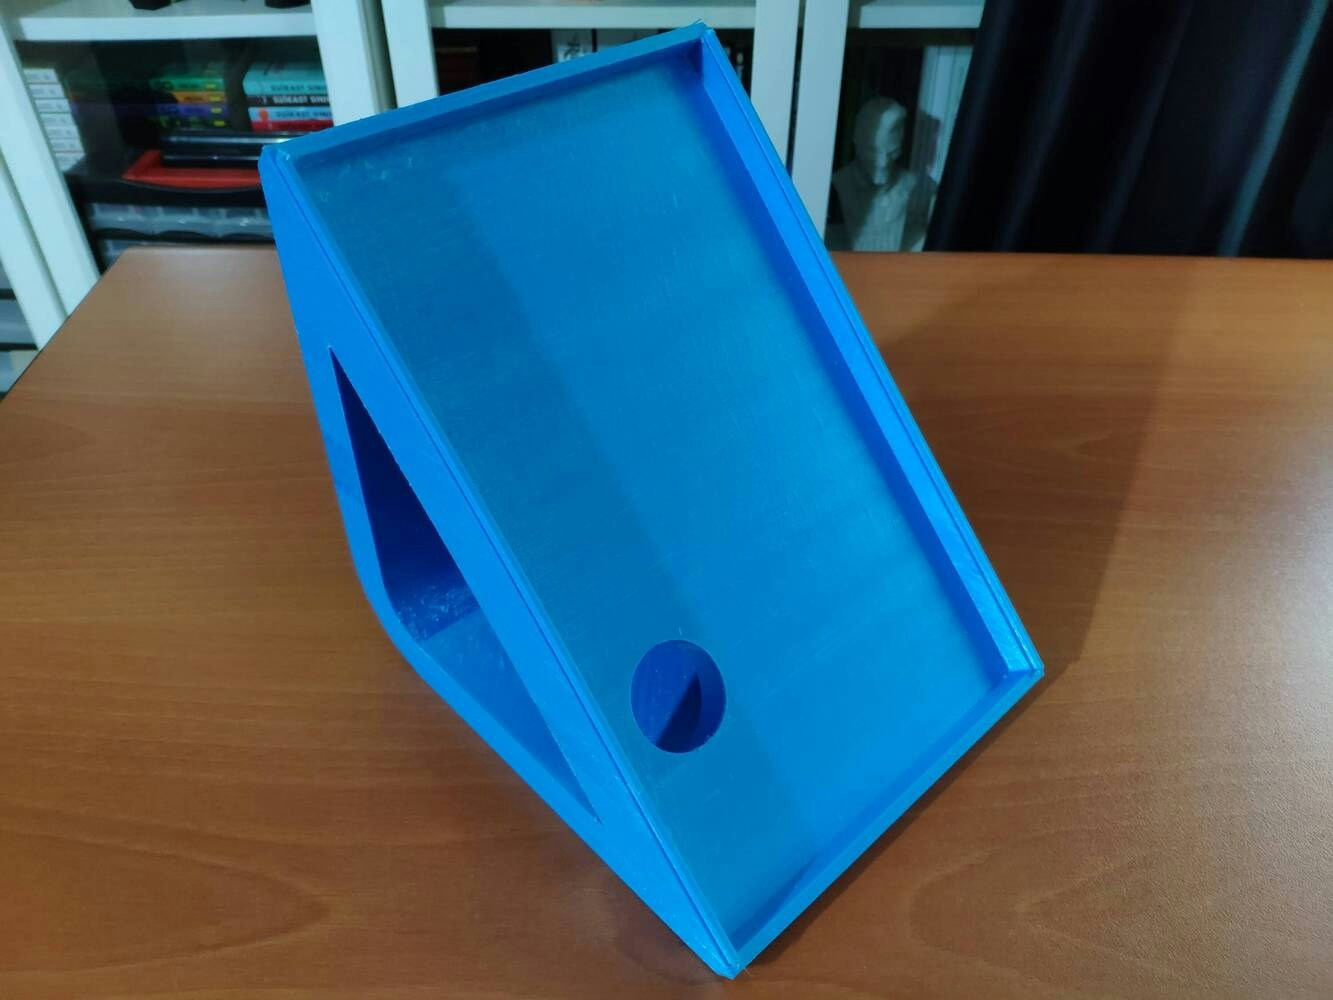
image
image
image
image
image
image
image
image
image
image
image
image
image
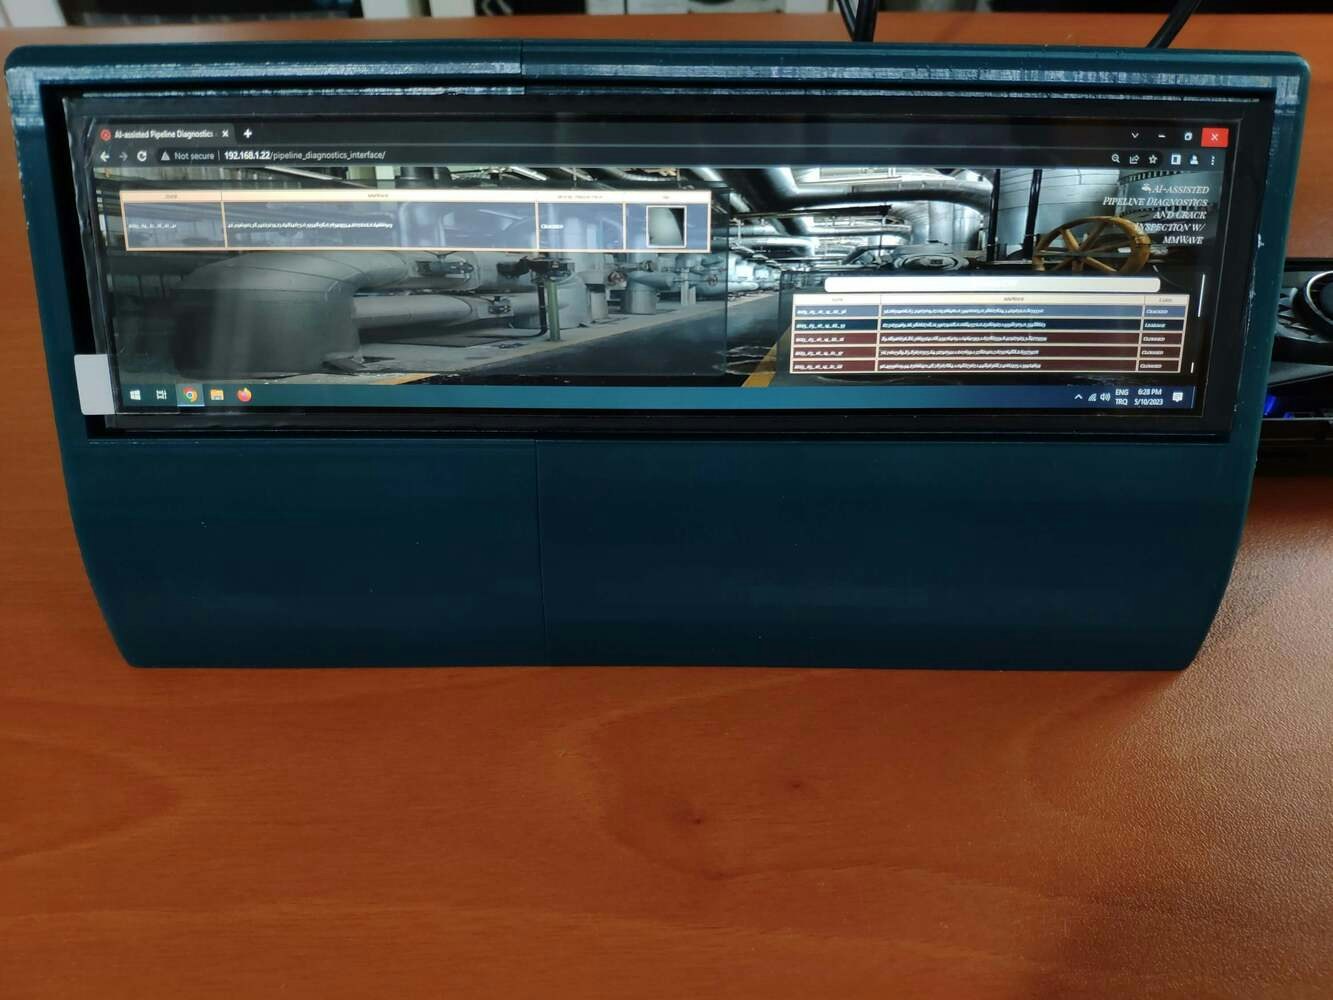
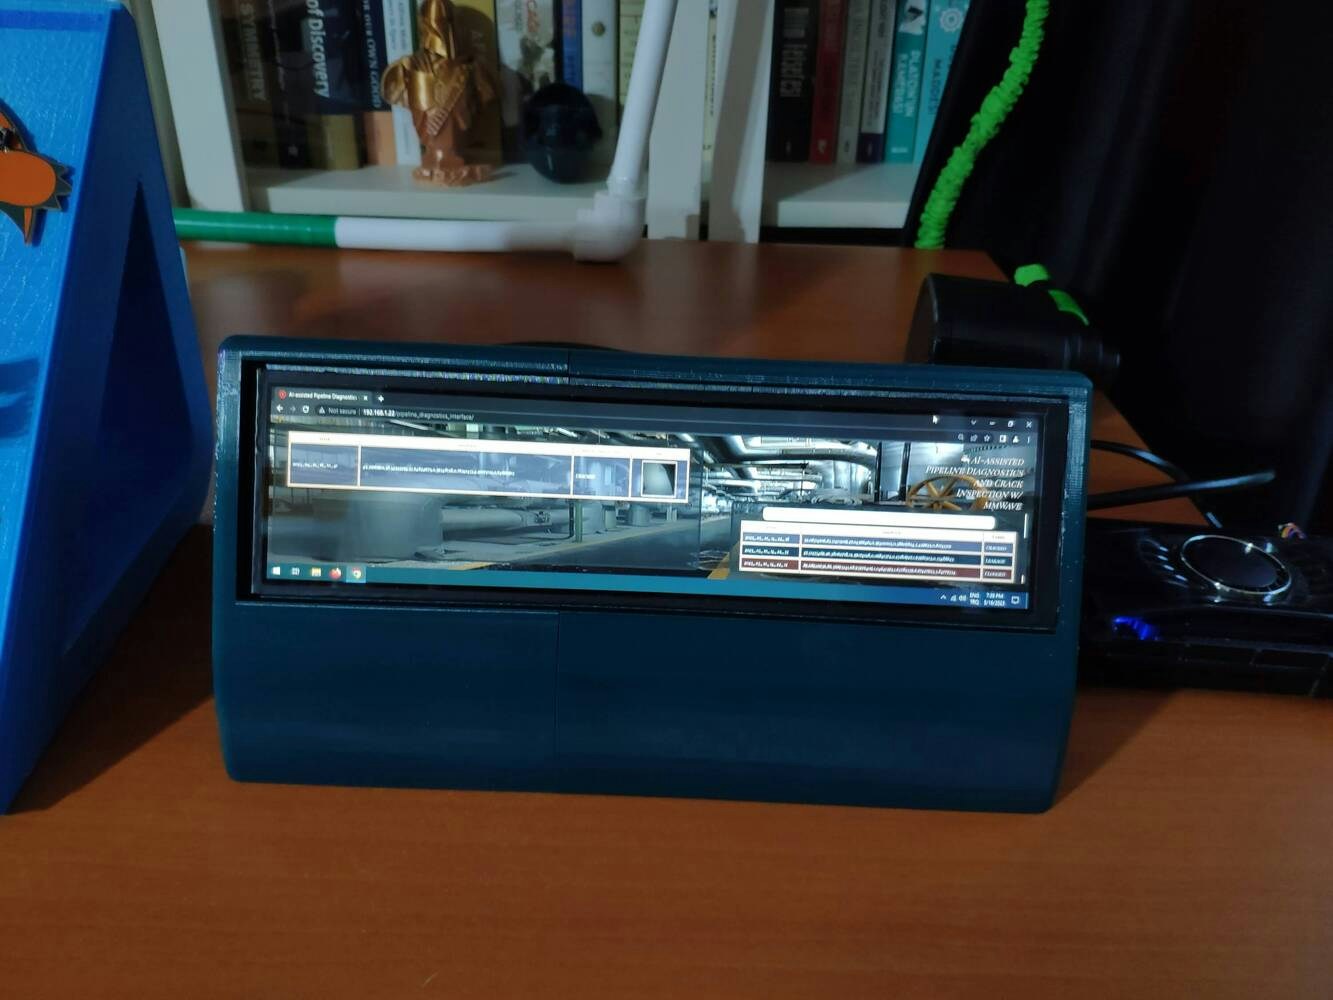
Step 2.2: Creating a LattePanda Deck to display the web application
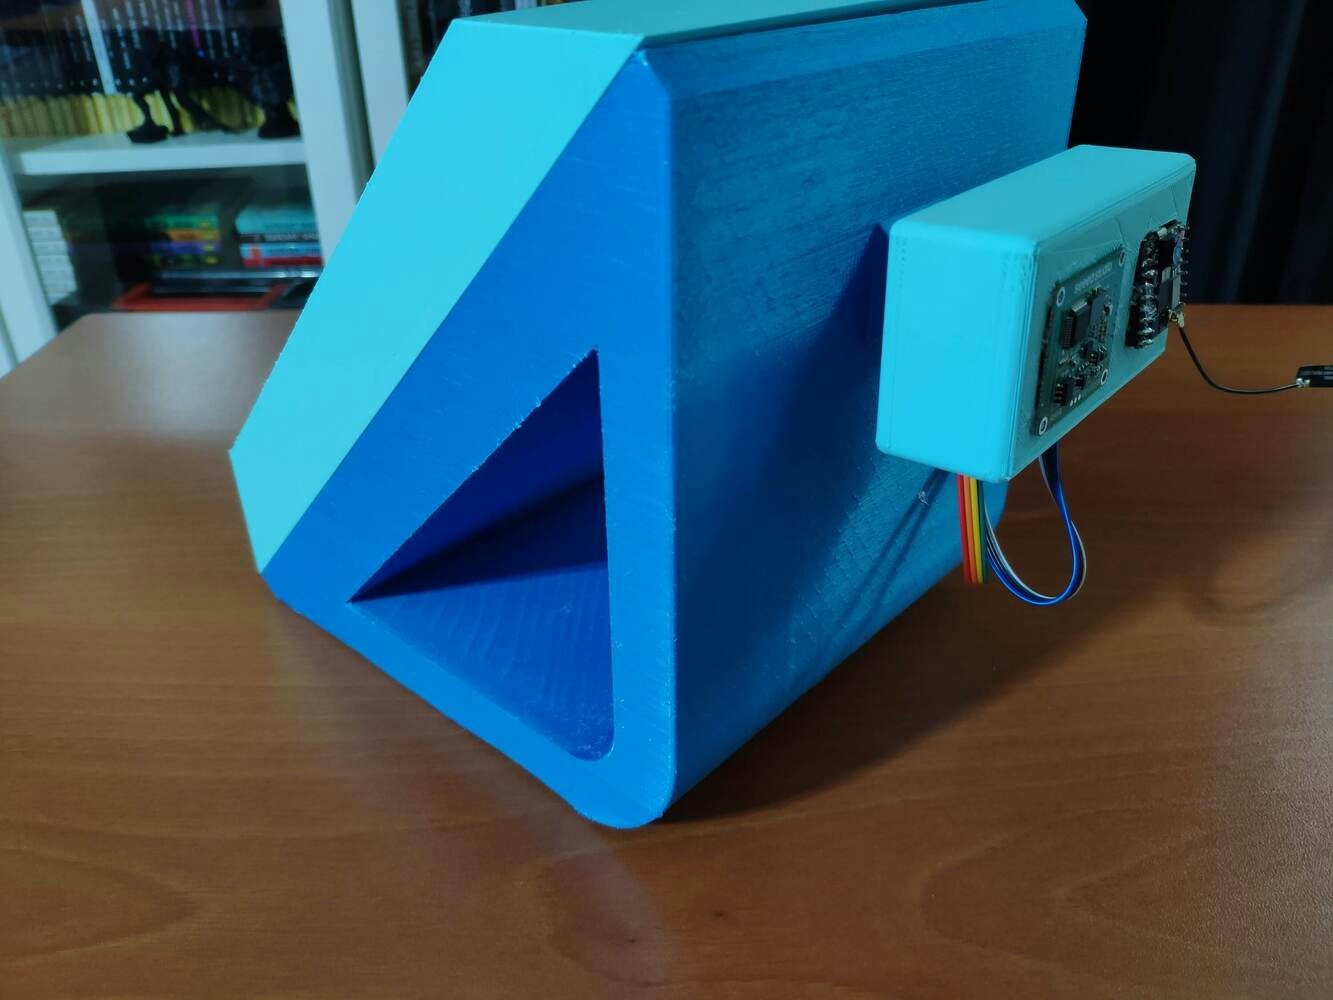
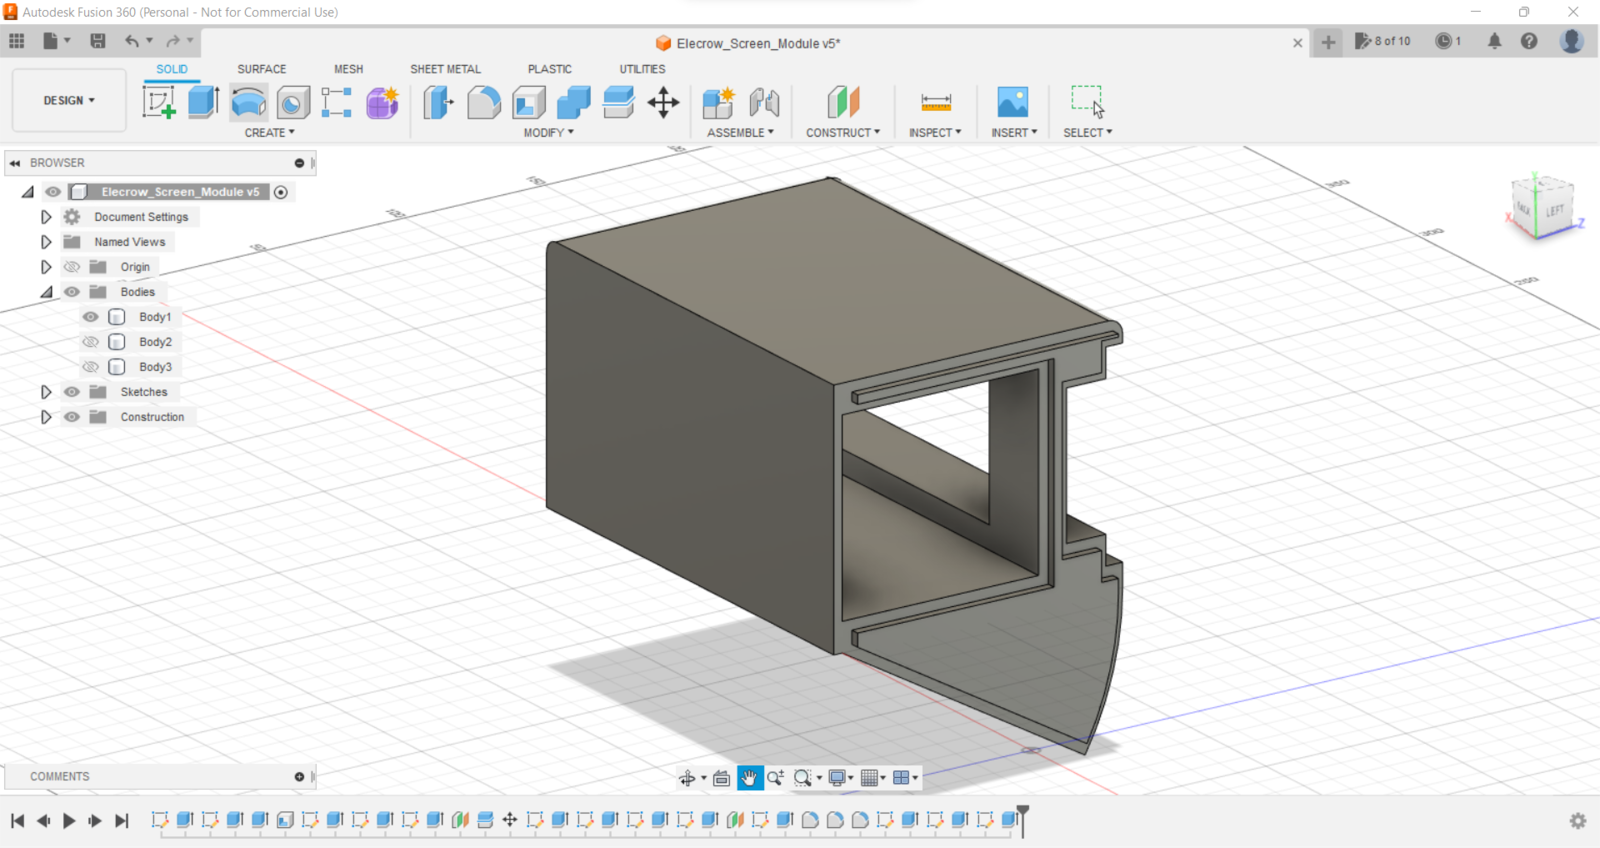
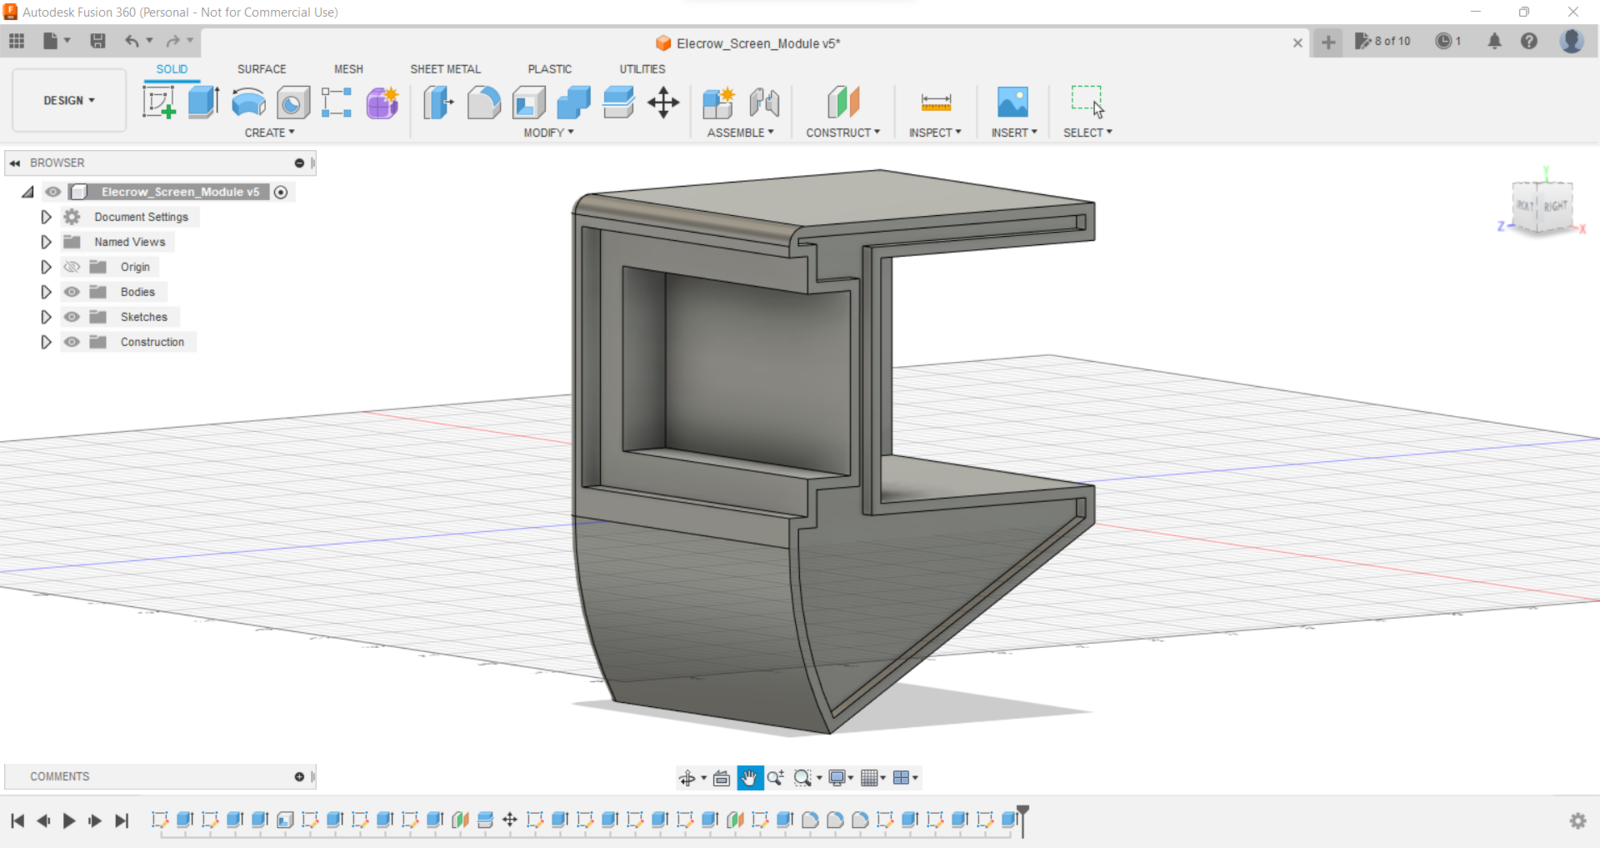
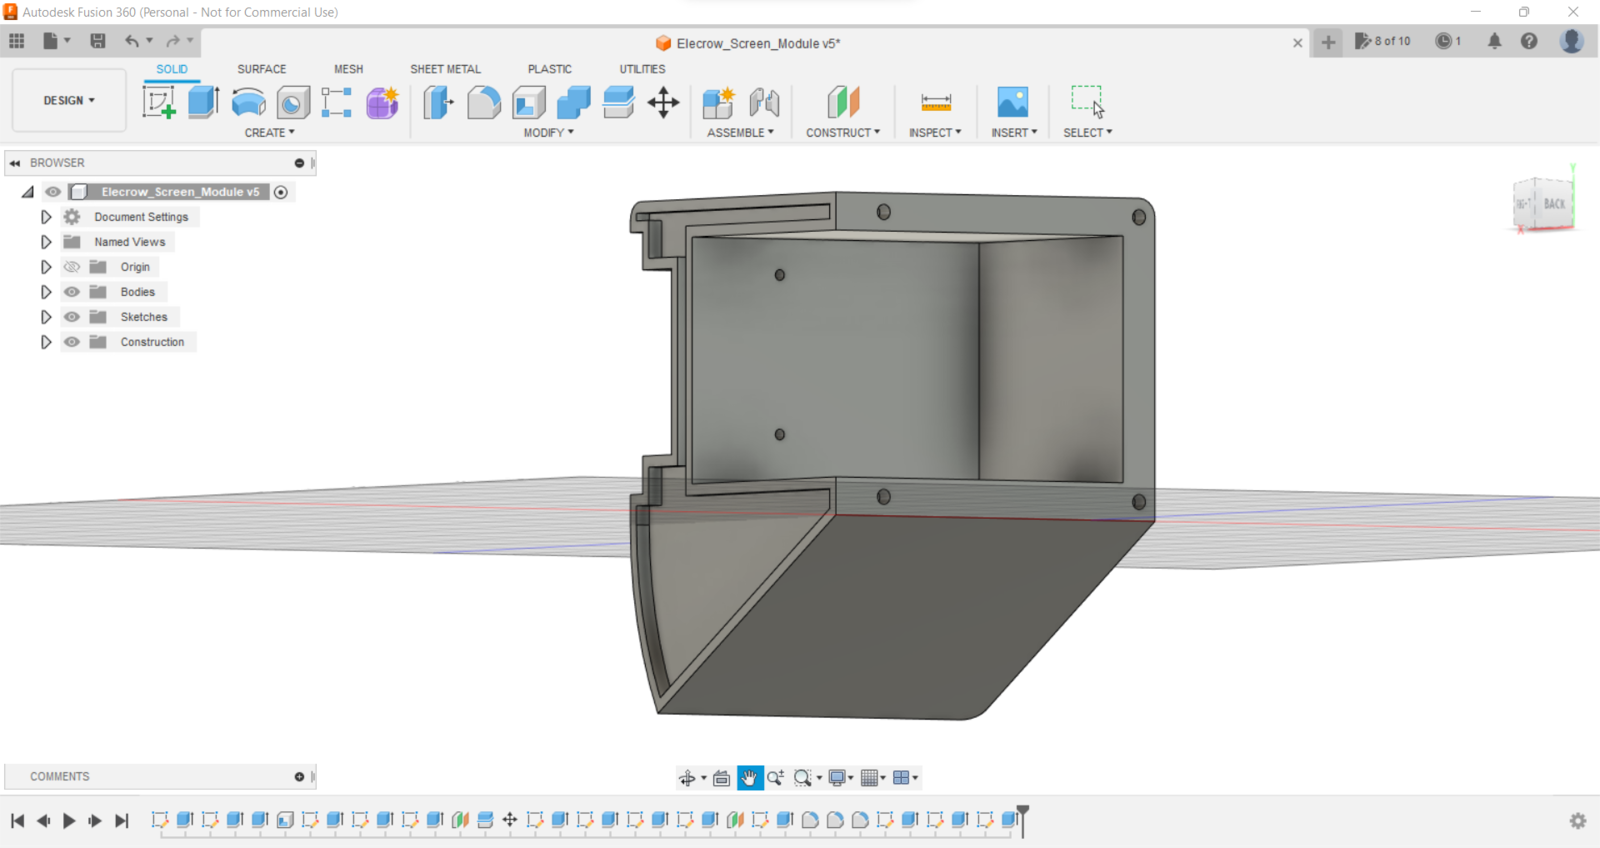
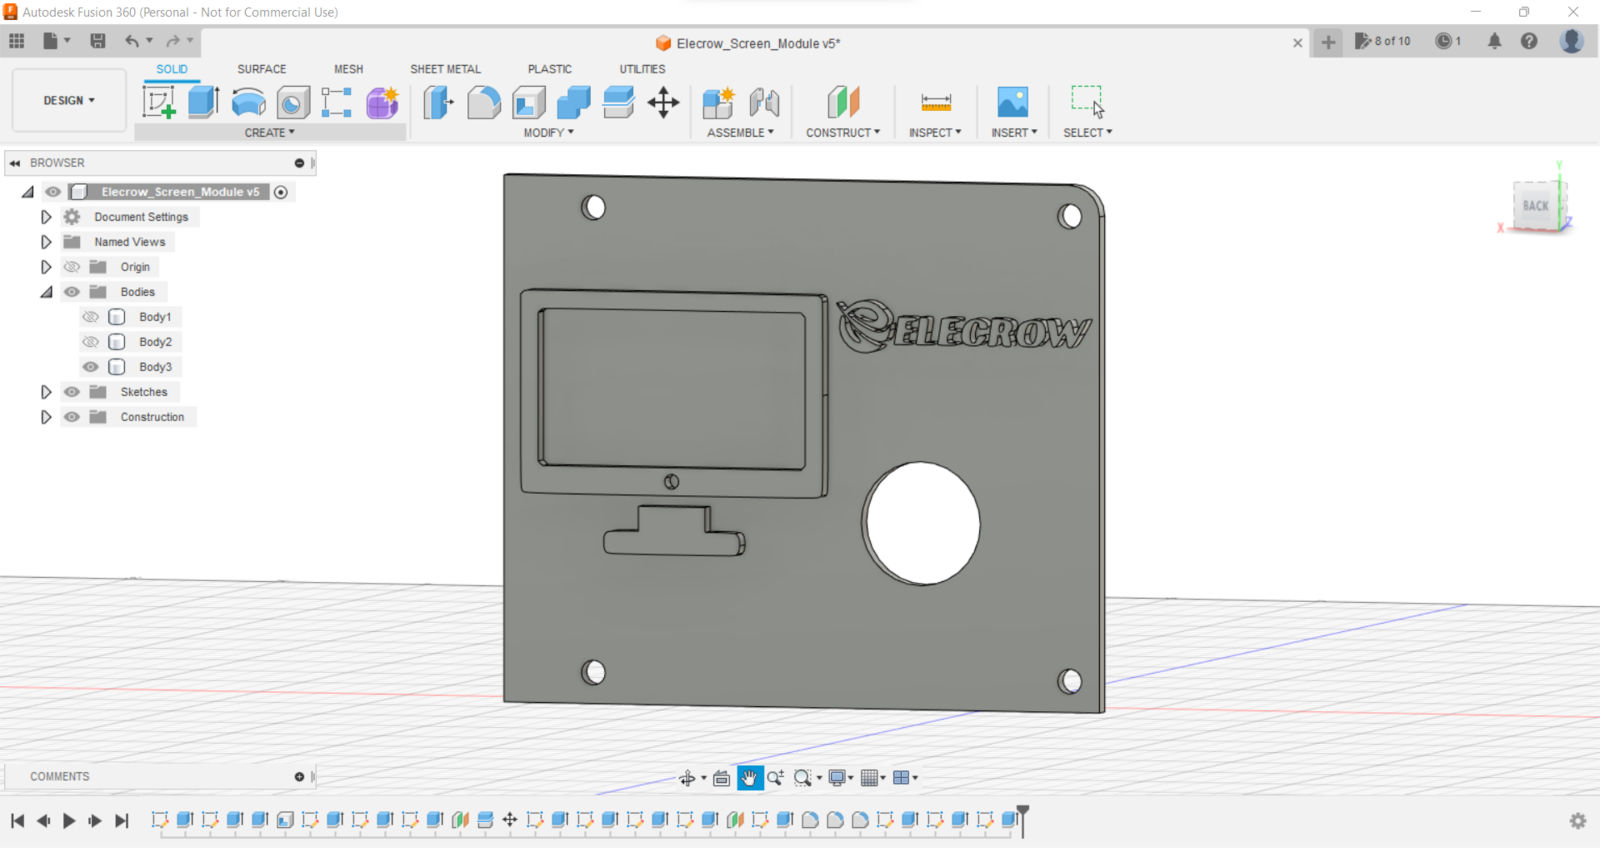
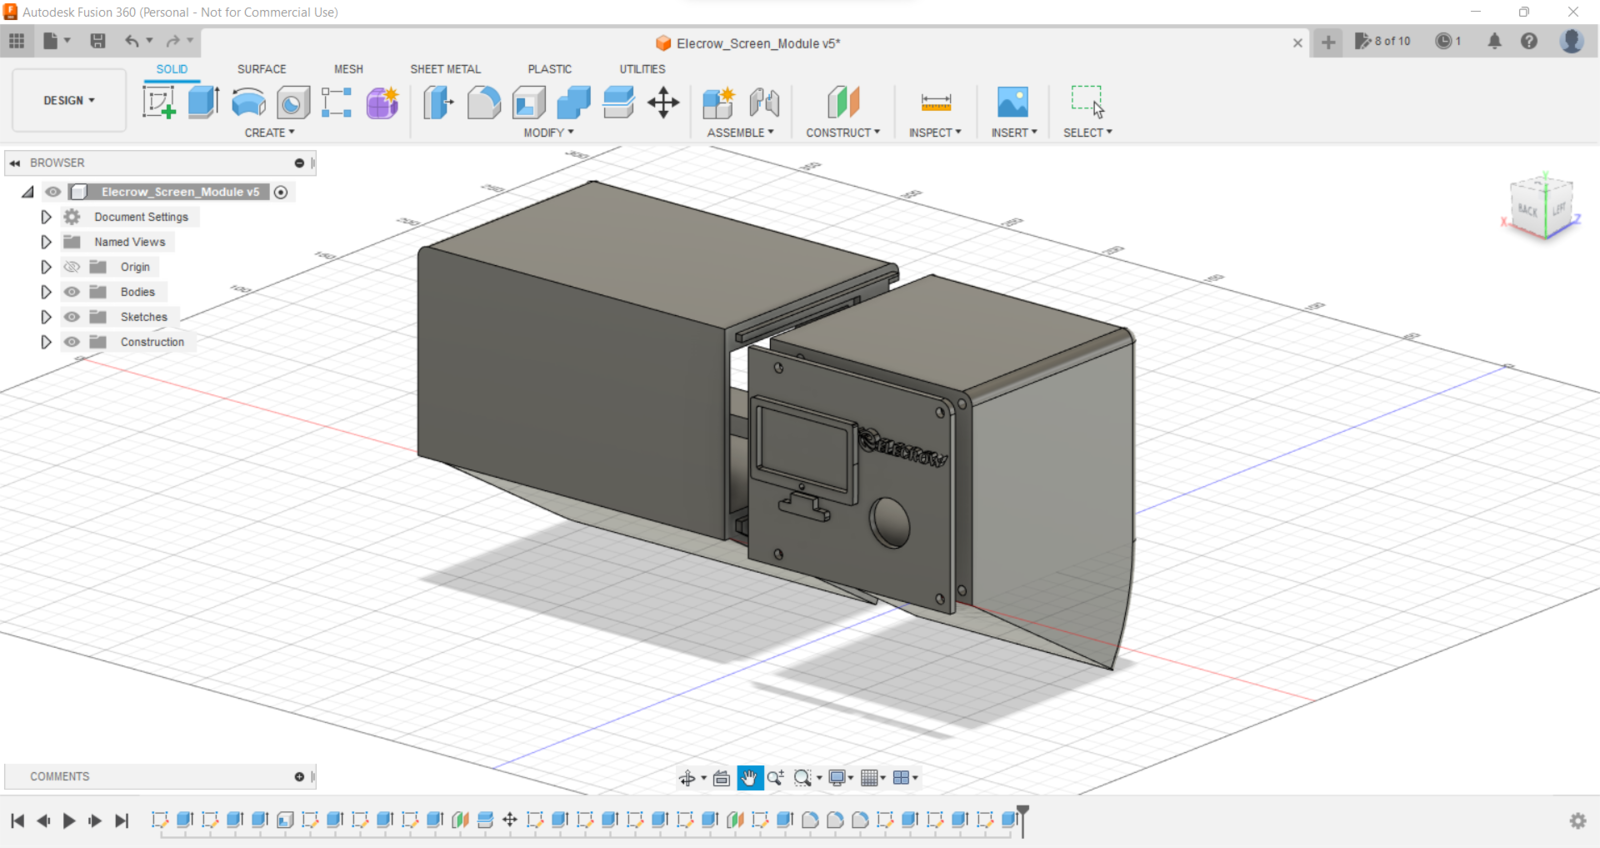
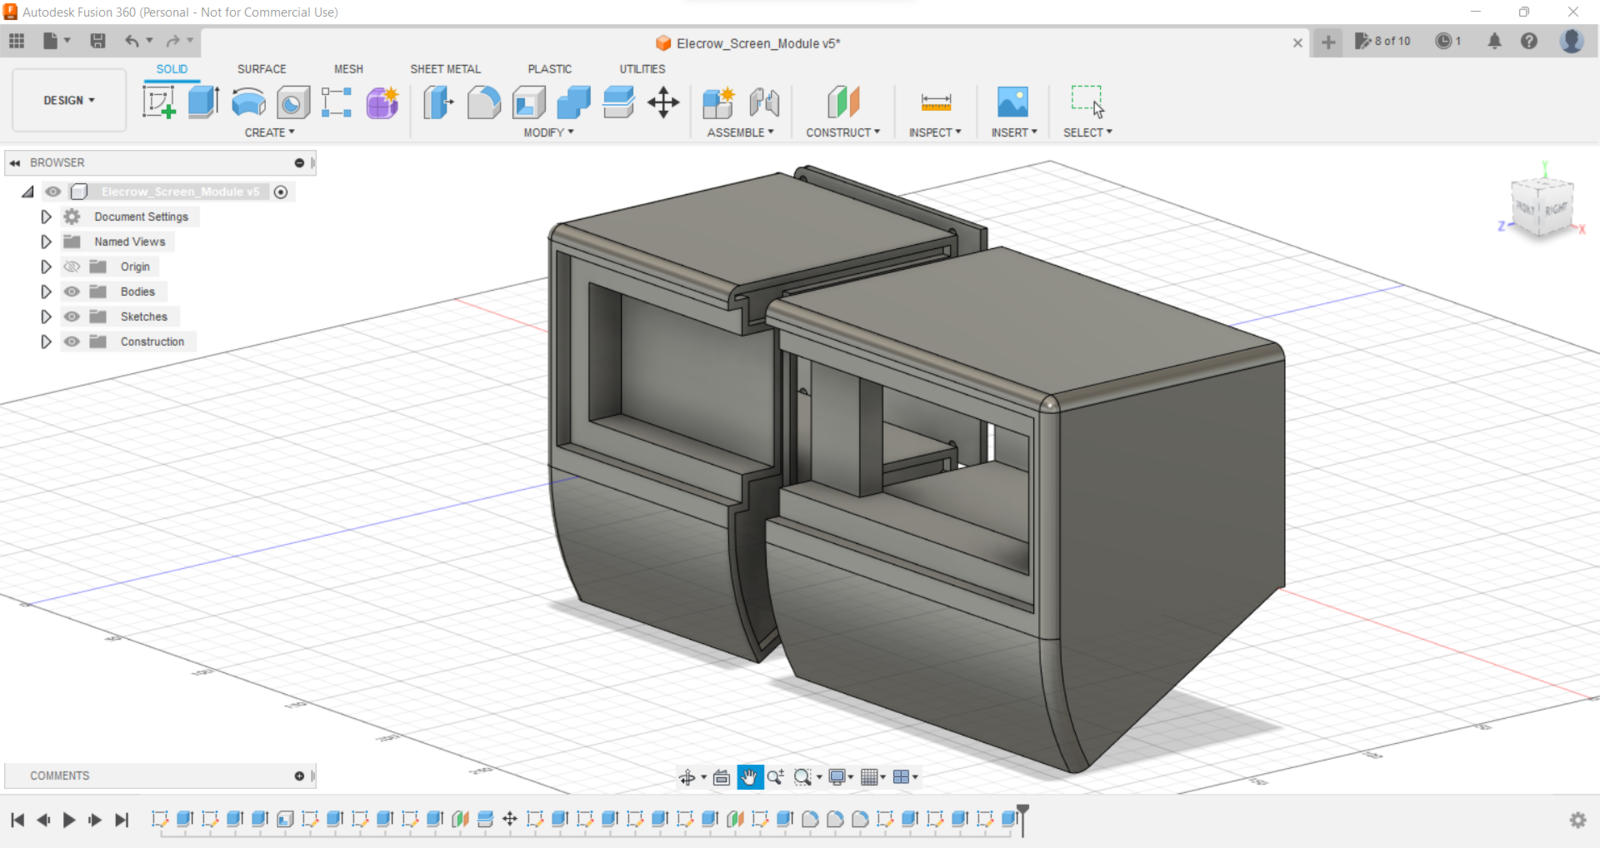
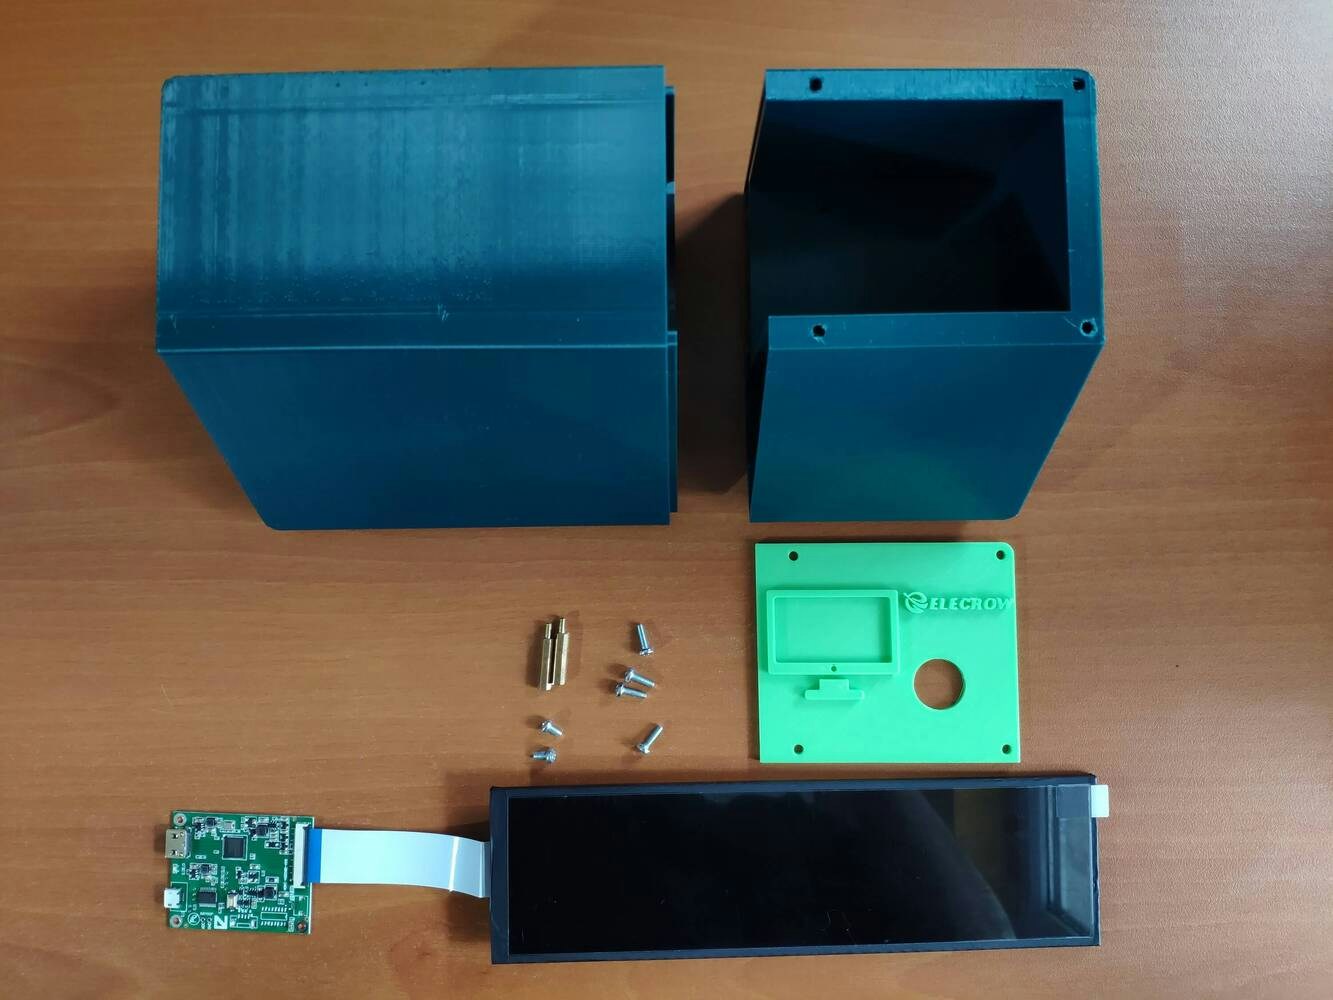
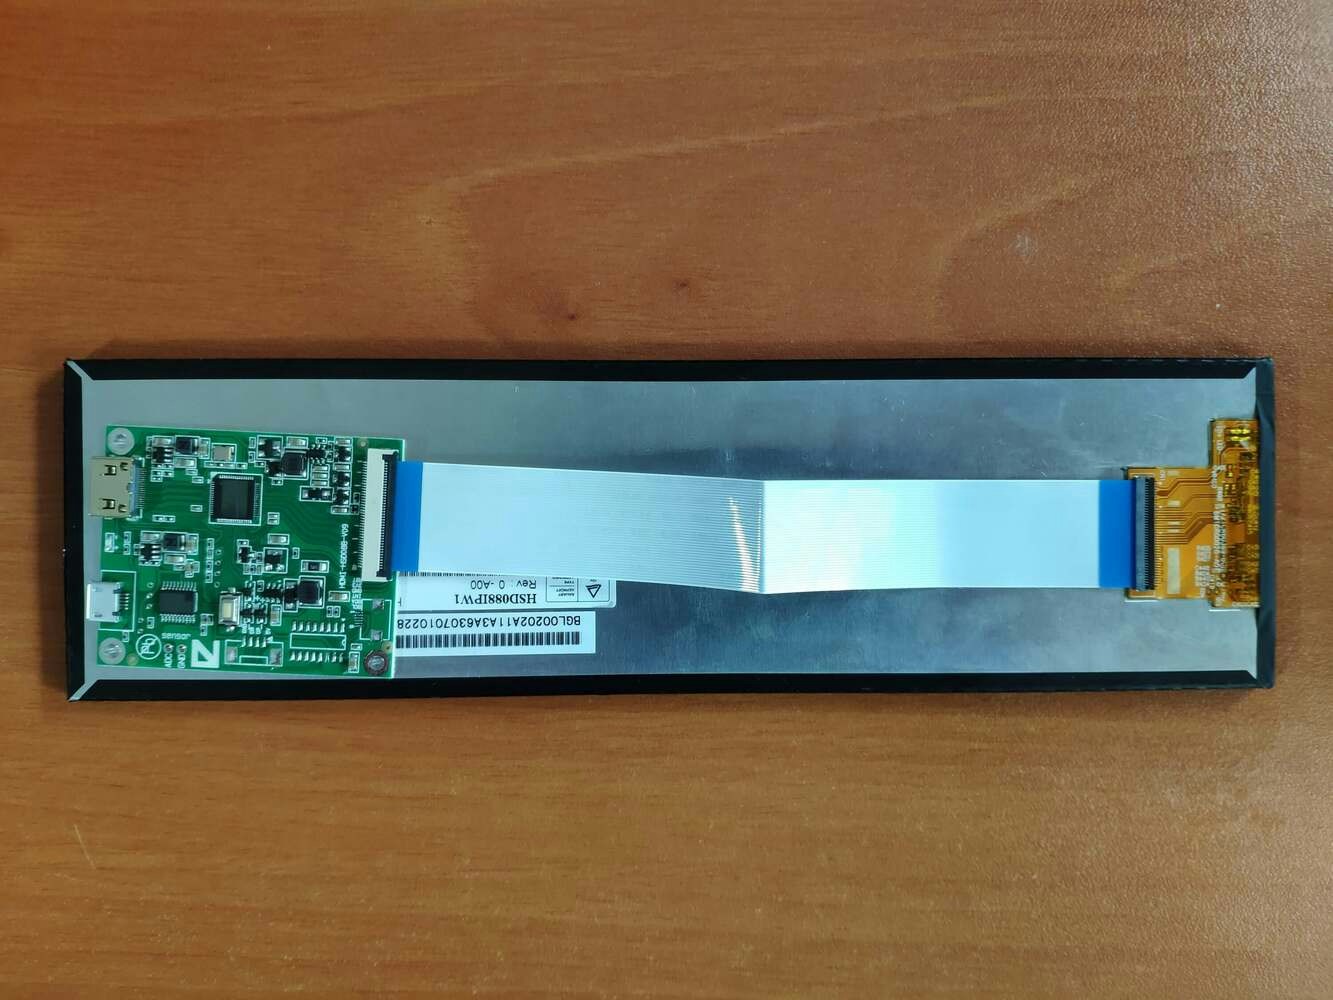
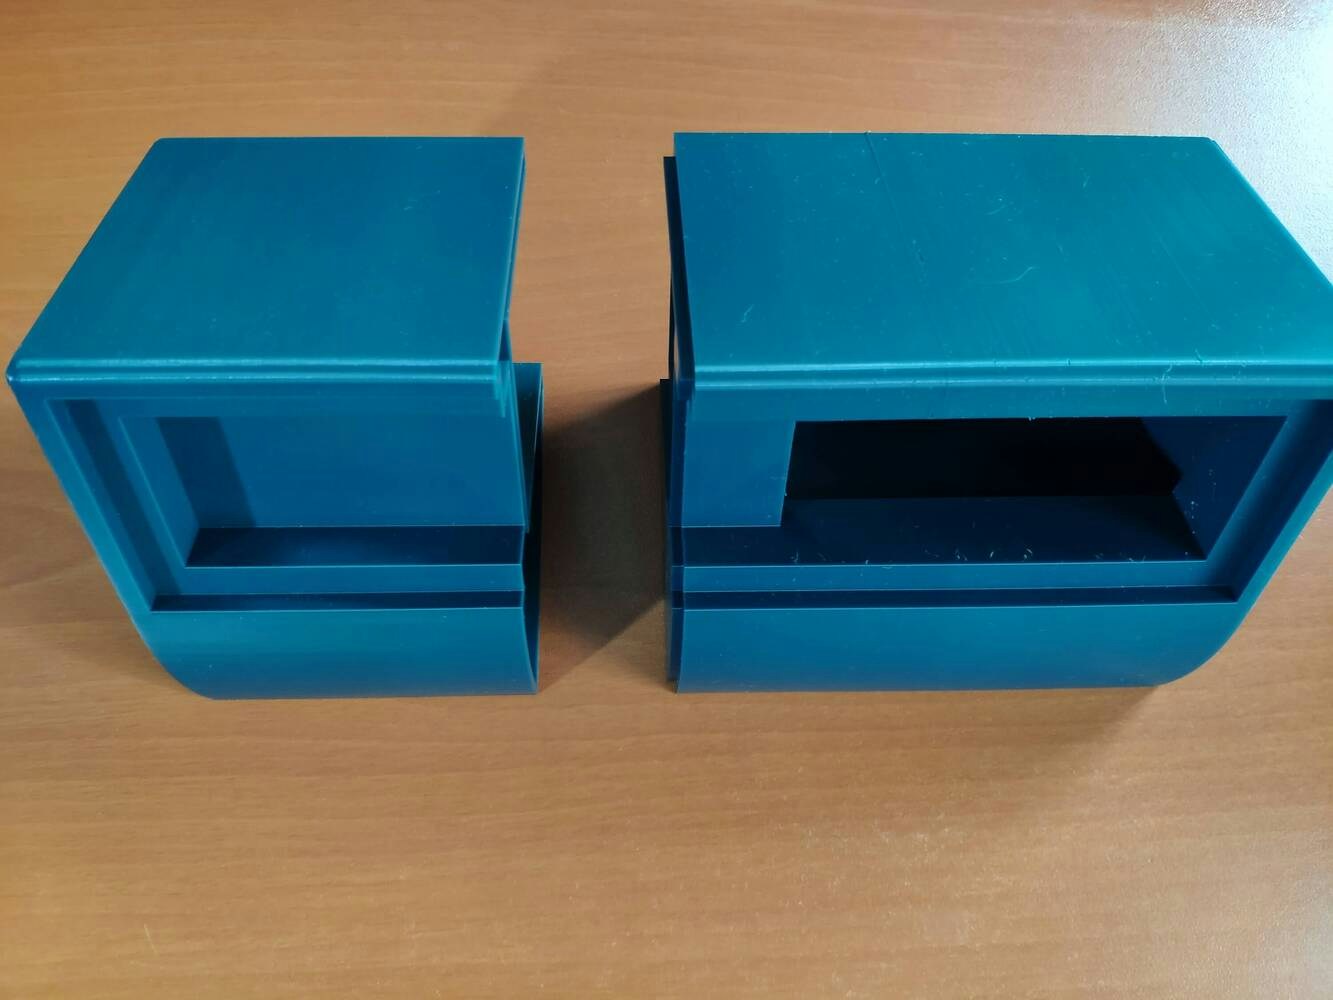
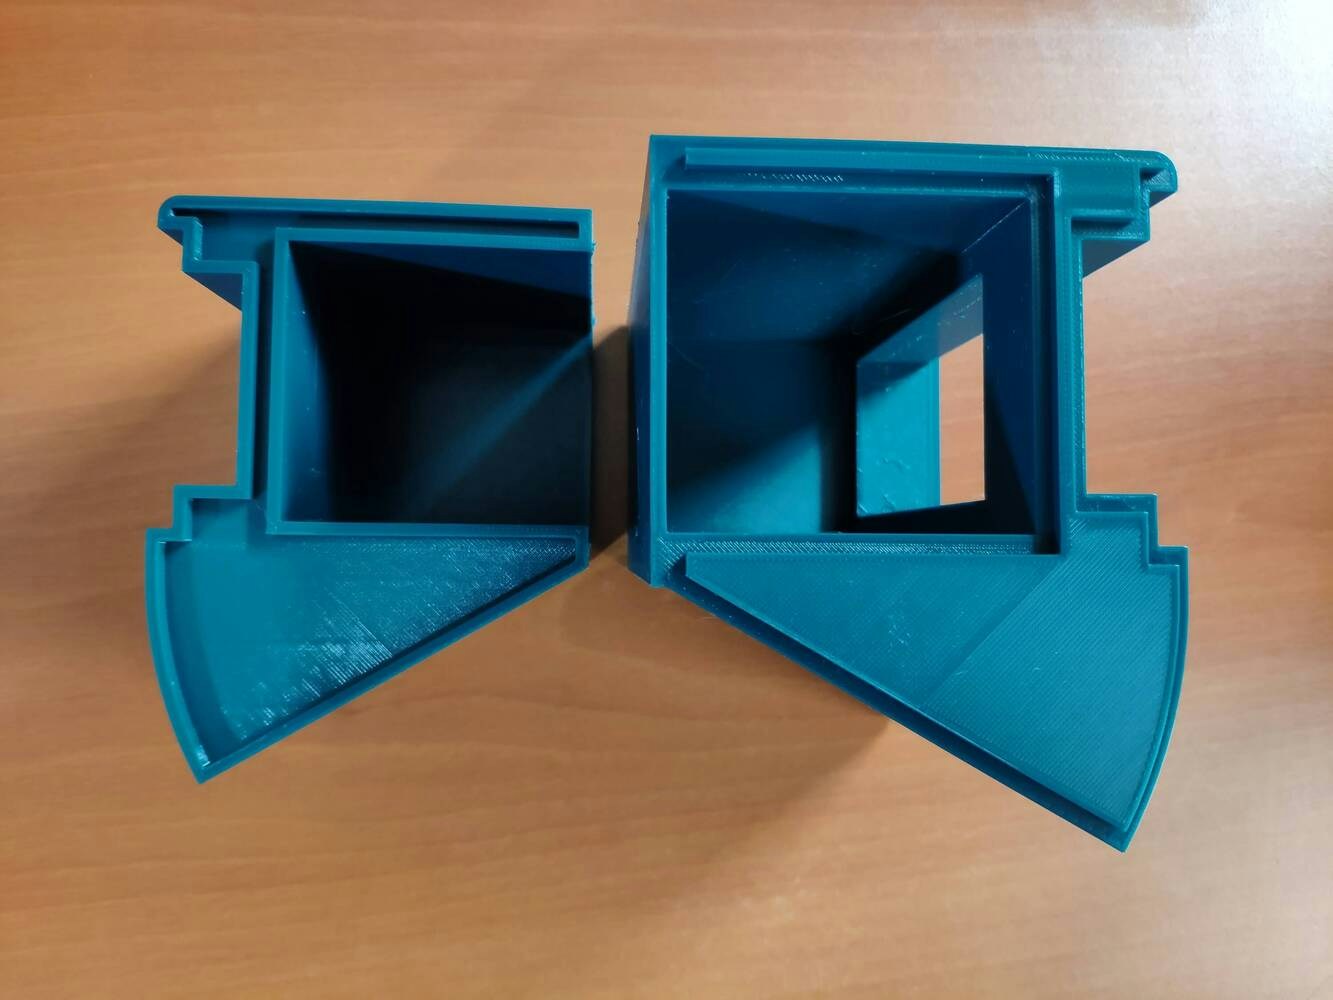
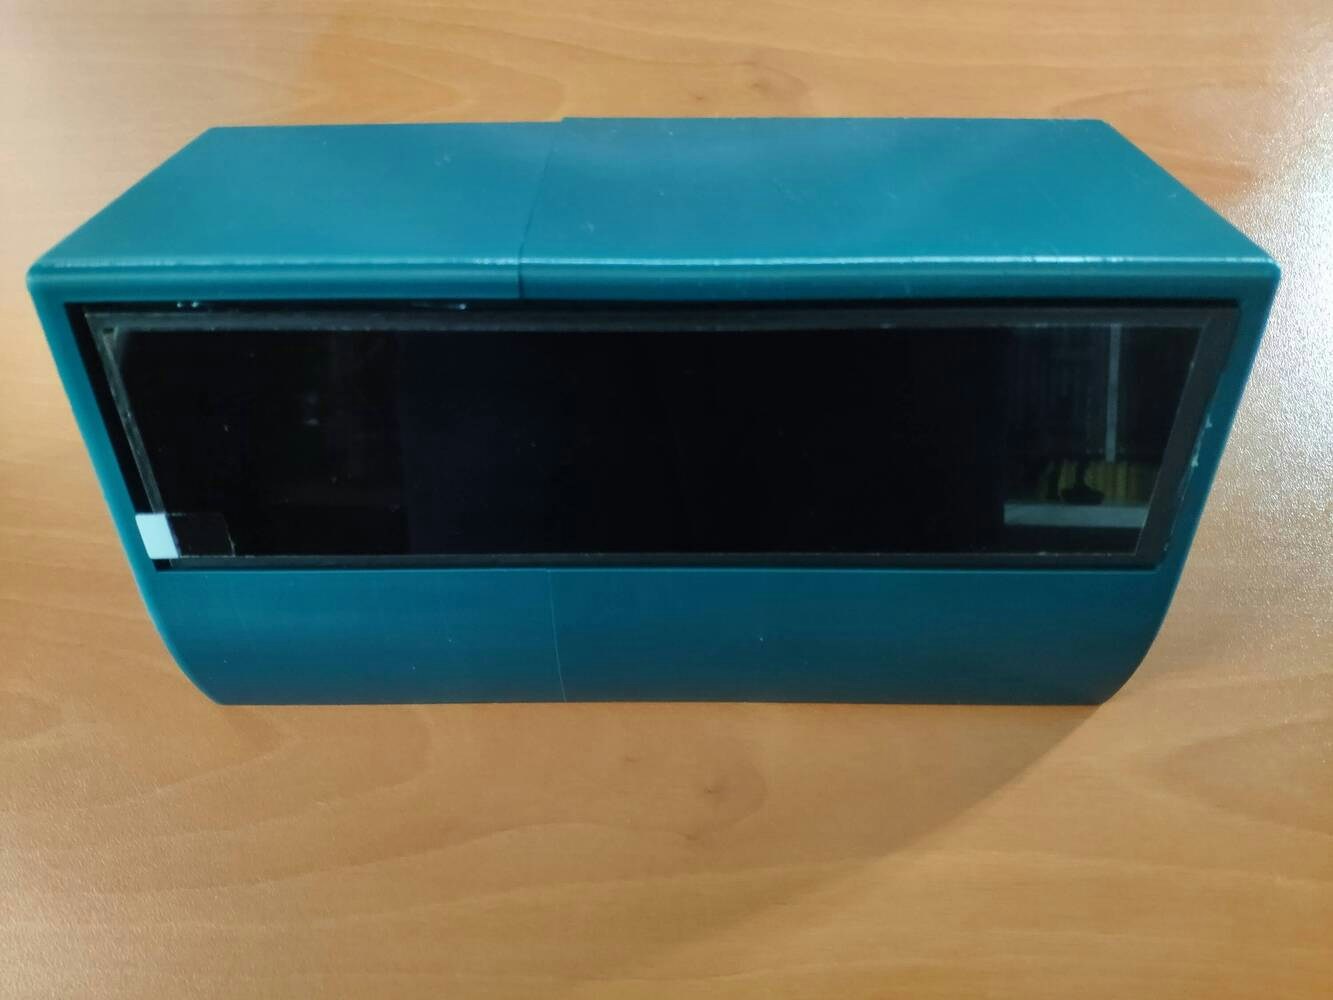
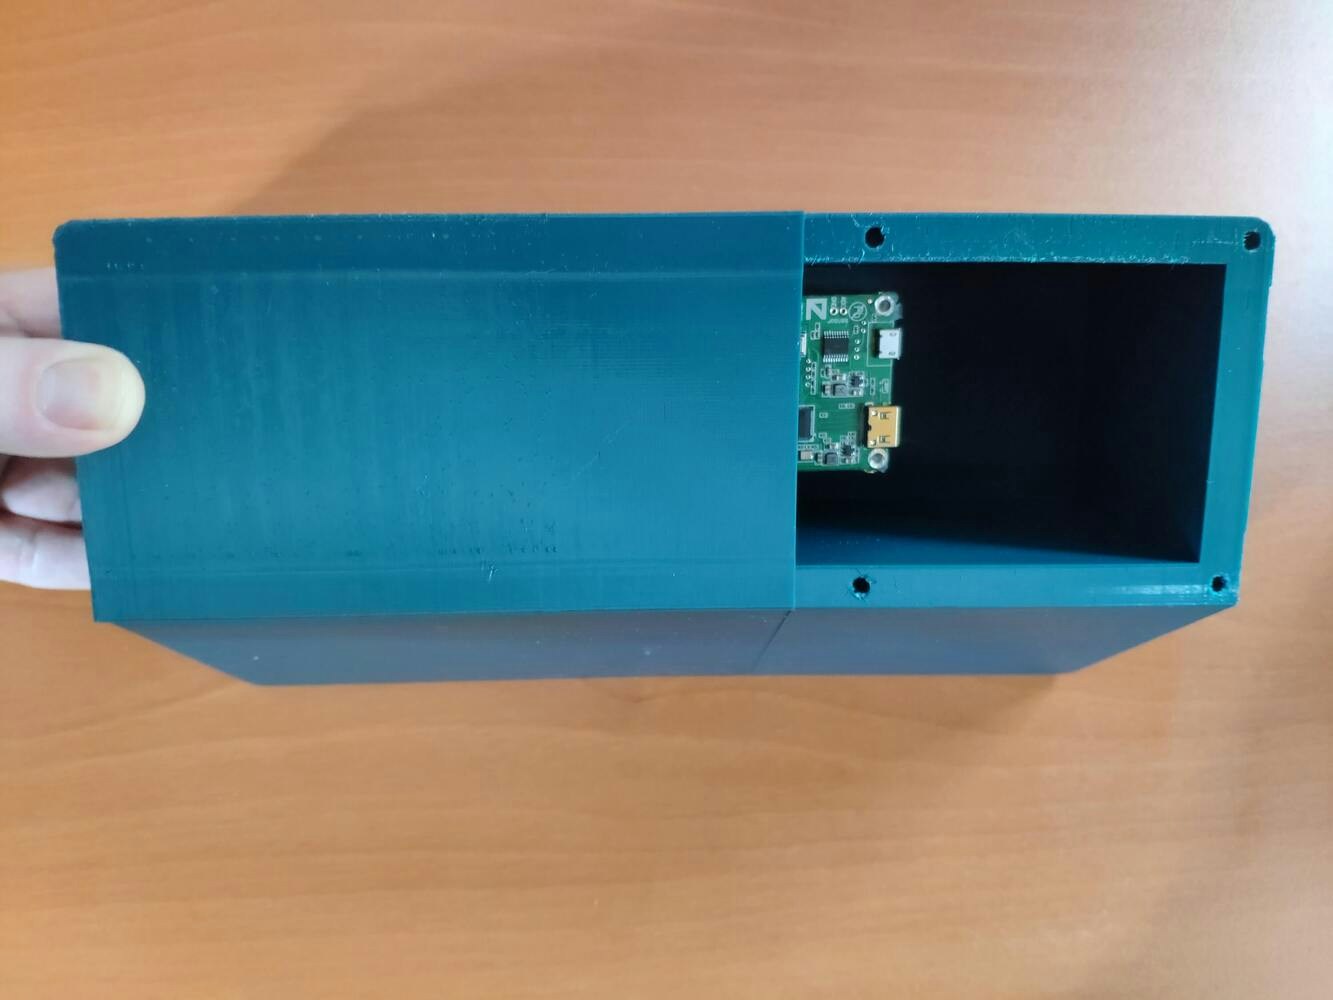
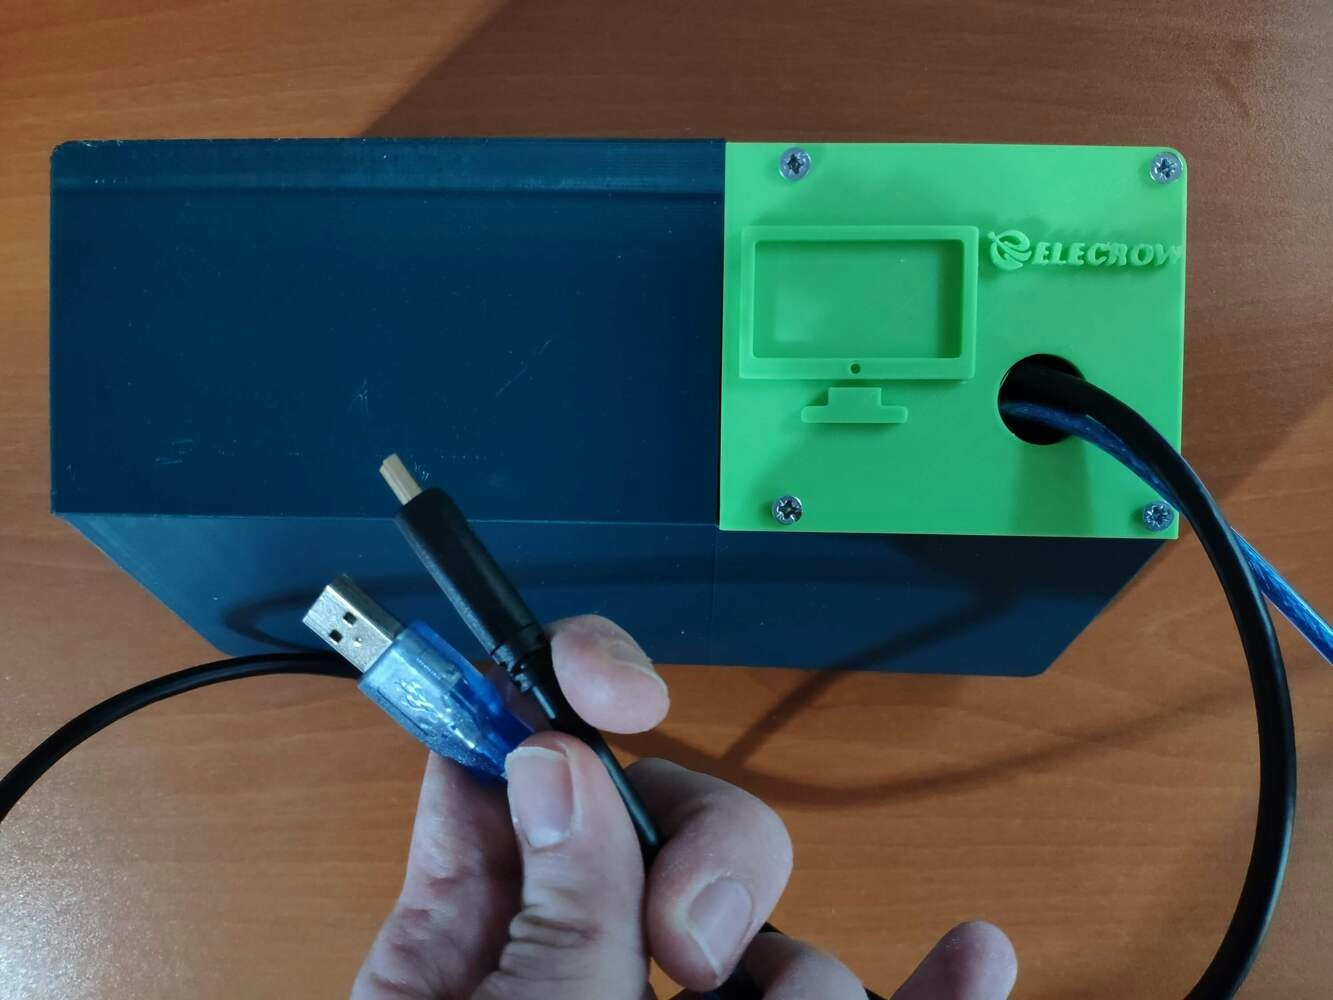
Since I decided to utilize the web application to display the collected data parameters, generate the pre-formatted CSV file from the stored data records in the database, and show the model detection results with the captured images of the deformed pipes, I wanted to create a unique apparatus to inspect the web application. Since I host this web application on my LattePanda 3 Delta, I decided to design a unique and compact LattePanda Deck compatible with not only LattePanda but also any single-board computer supporting HDMI. I decided to employ Elecrow’s 8.8” (1920*480) high-resolution IPS monitor as the screen of my LattePanda Deck. Thanks to its converter board, this monitor can be powered via a USB port and works without installing any drivers. Therefore, it is a compact plug-and-play monitor for LattePanda 3 Delta, providing high resolution and up to 60Hz refresh rate. Due to the fact that I wanted to build a sturdy and easy-to-use deck, I designed a two-part case covering the screen frame and providing a slot for the converter board. To avoid overexposure to dust and provide room for cable management, I added a mountable back cover adorned with the brand logo. I designed the two-part case and its mountable back cover in Autodesk Fusion 360. You can download their STL files below.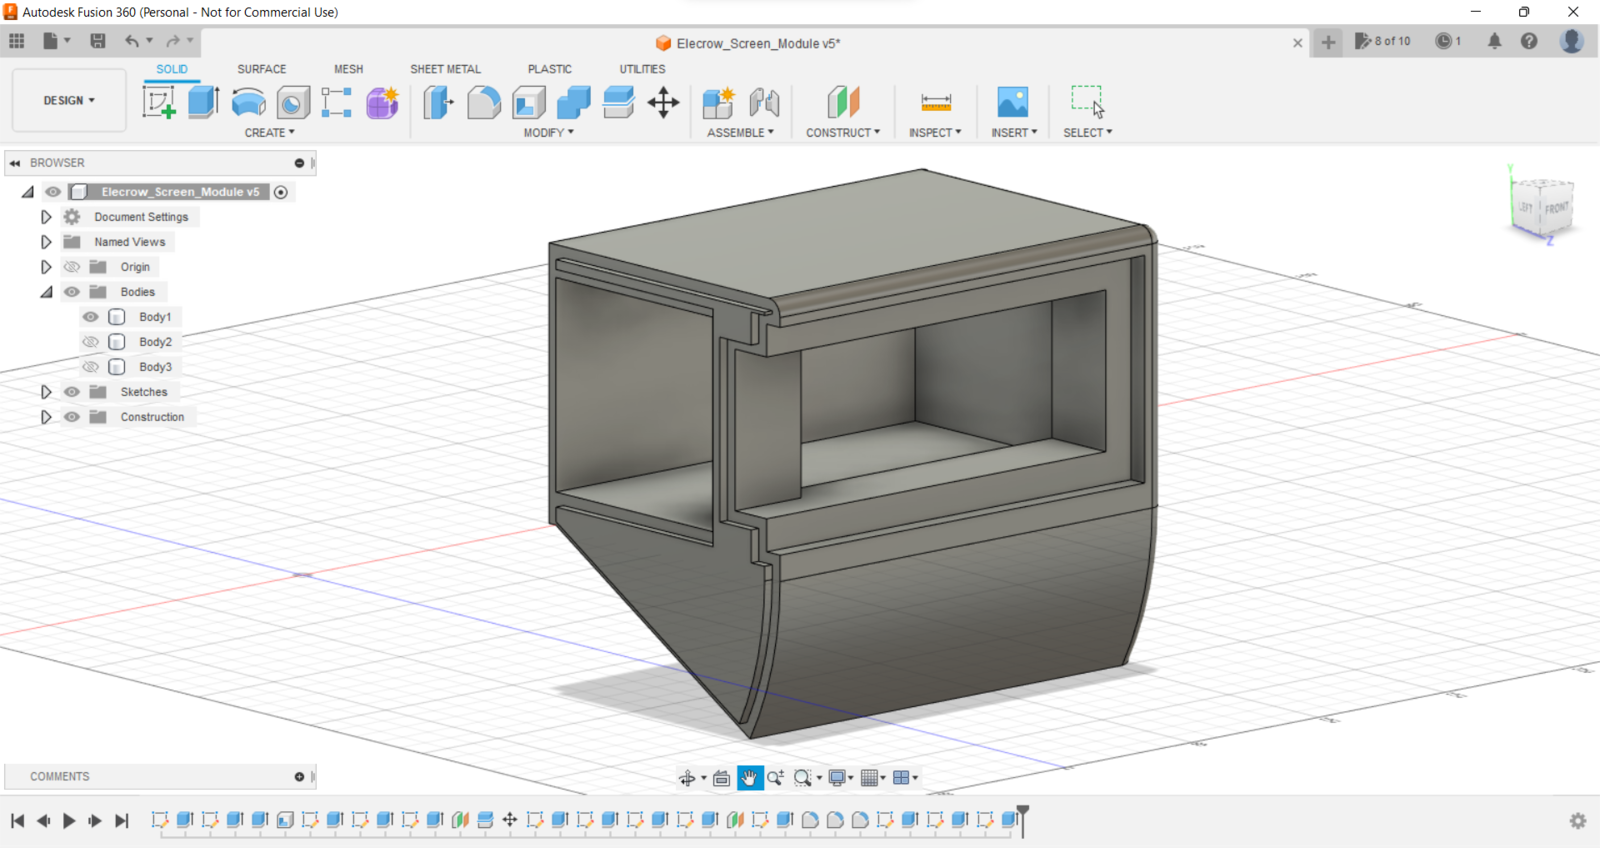
image
image
image
image
image
image
image
image
image
image
image
image
image
image
image
image
image
image
image
Step 3: Developing a web application displaying real-time database updates in PHP, JavaScript, CSS, and MySQL
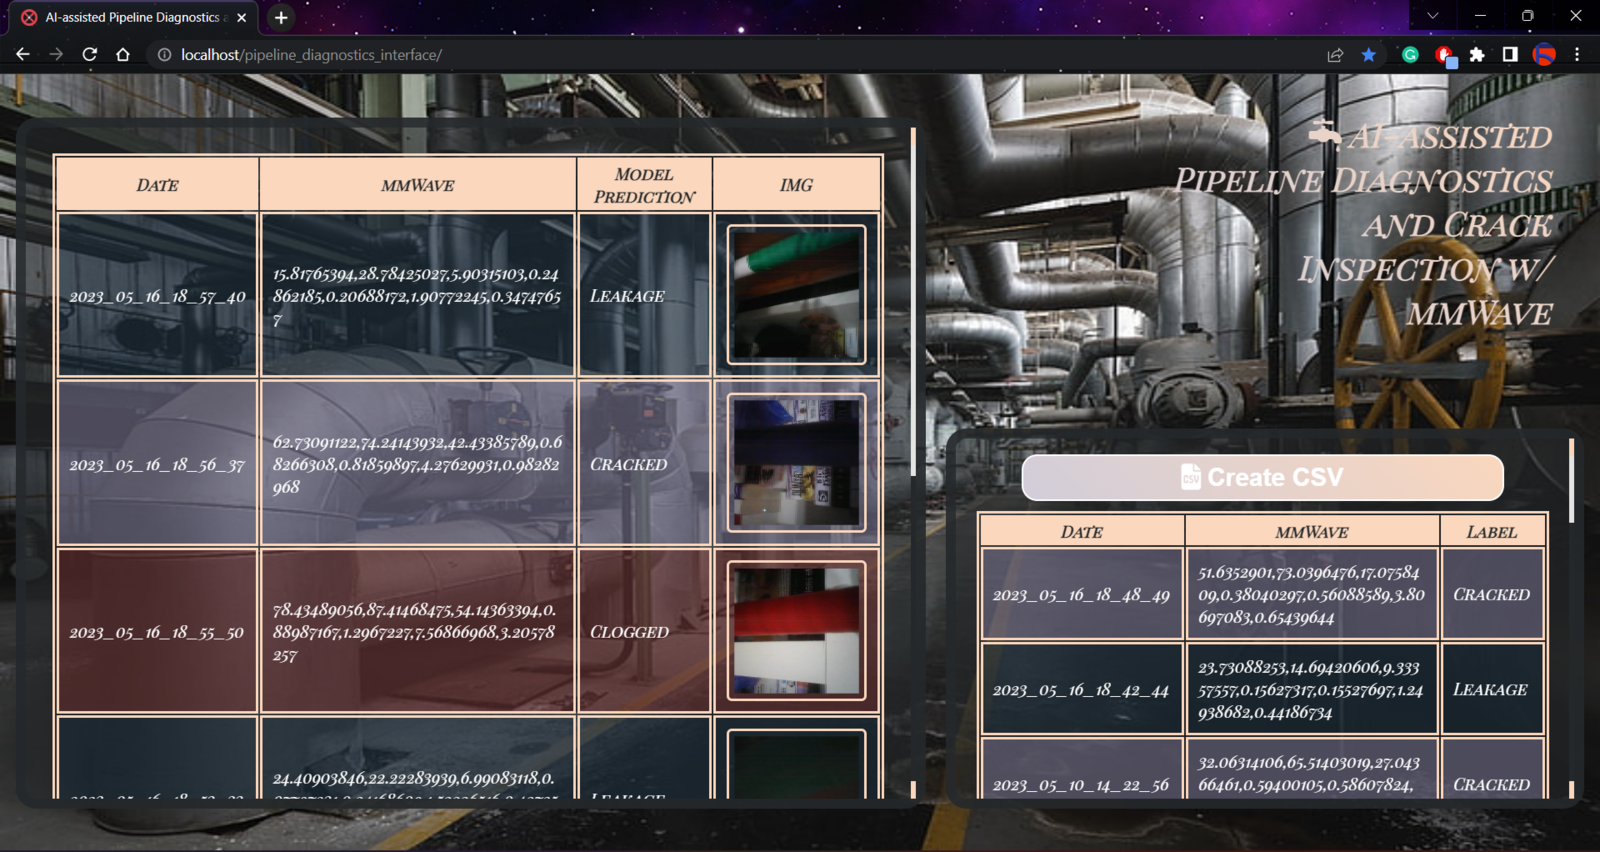
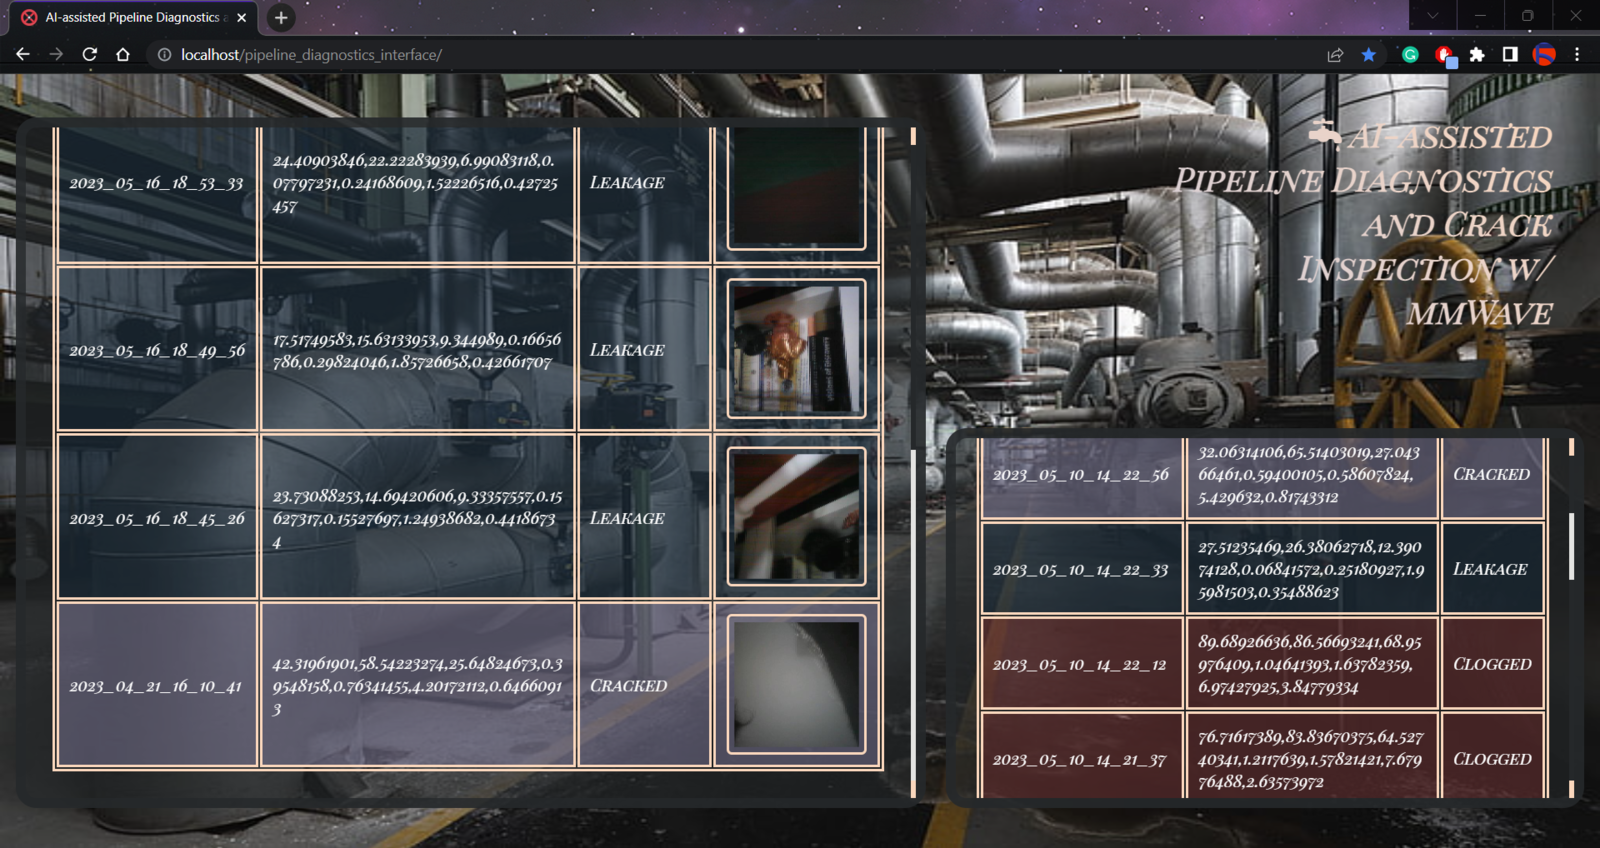
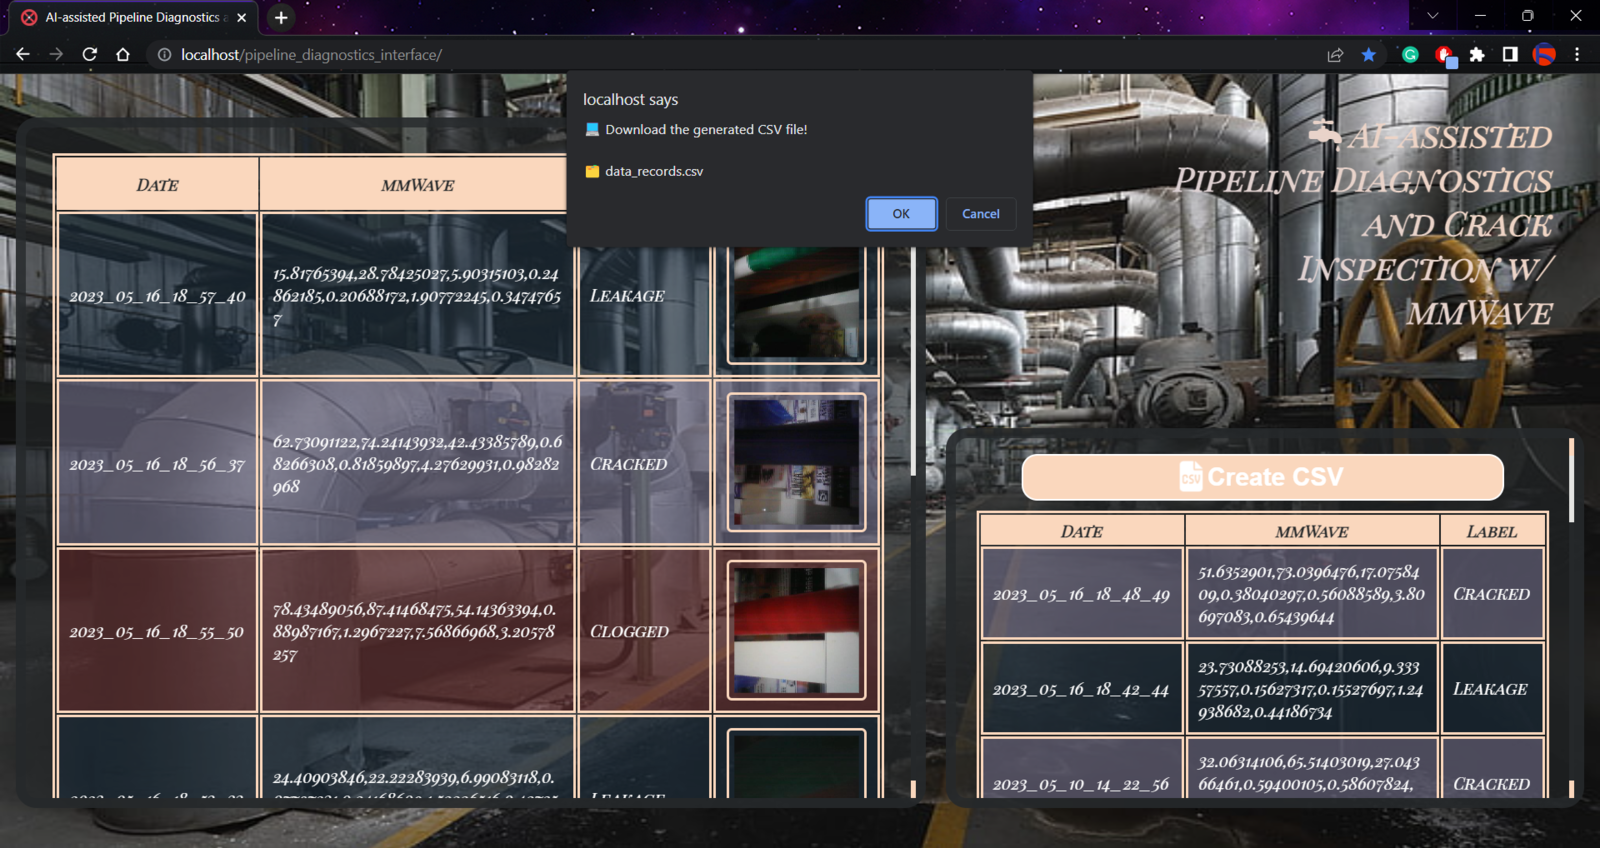
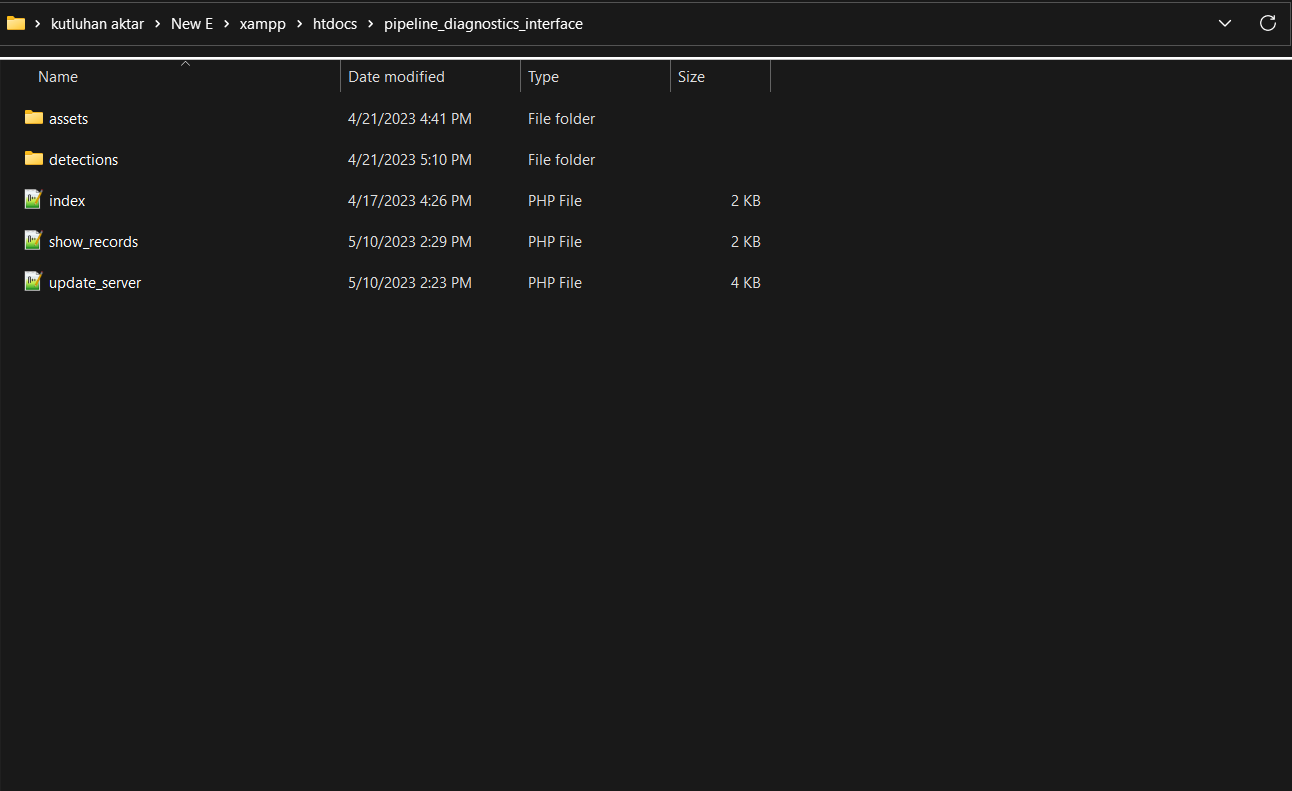
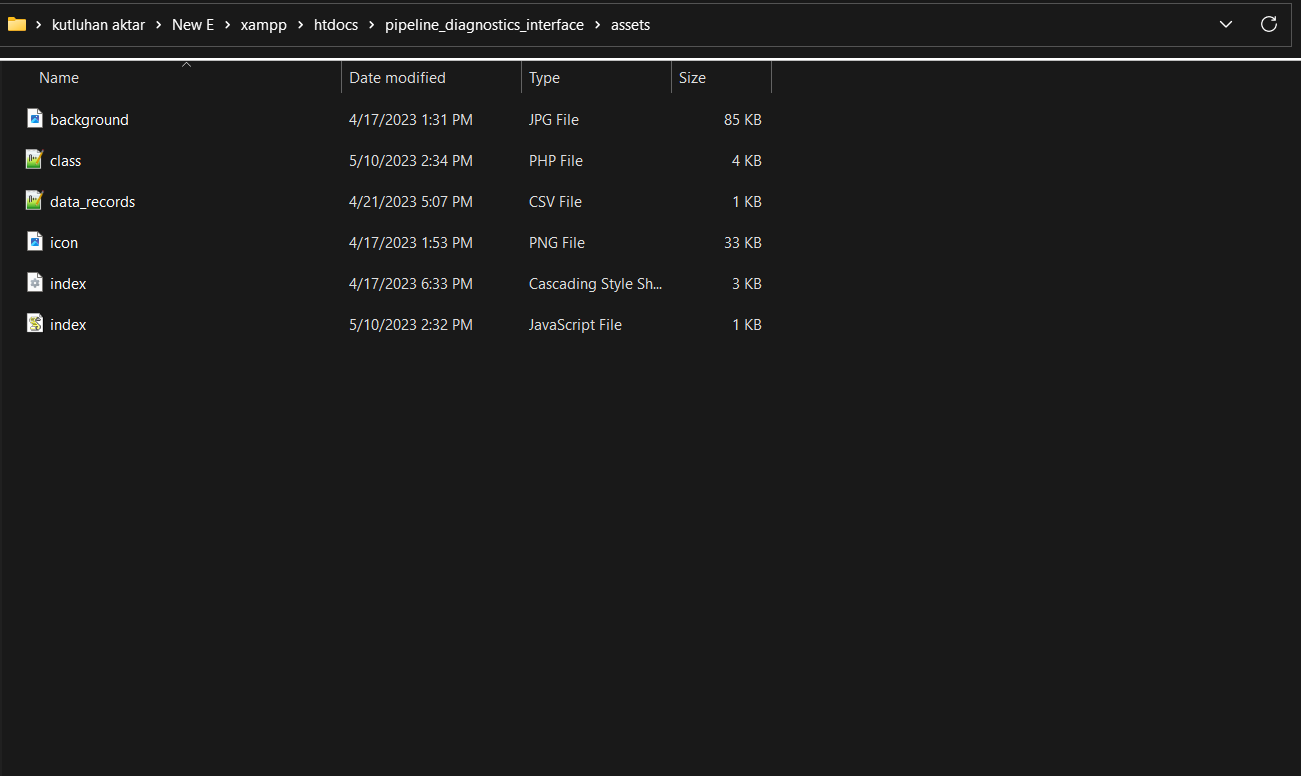
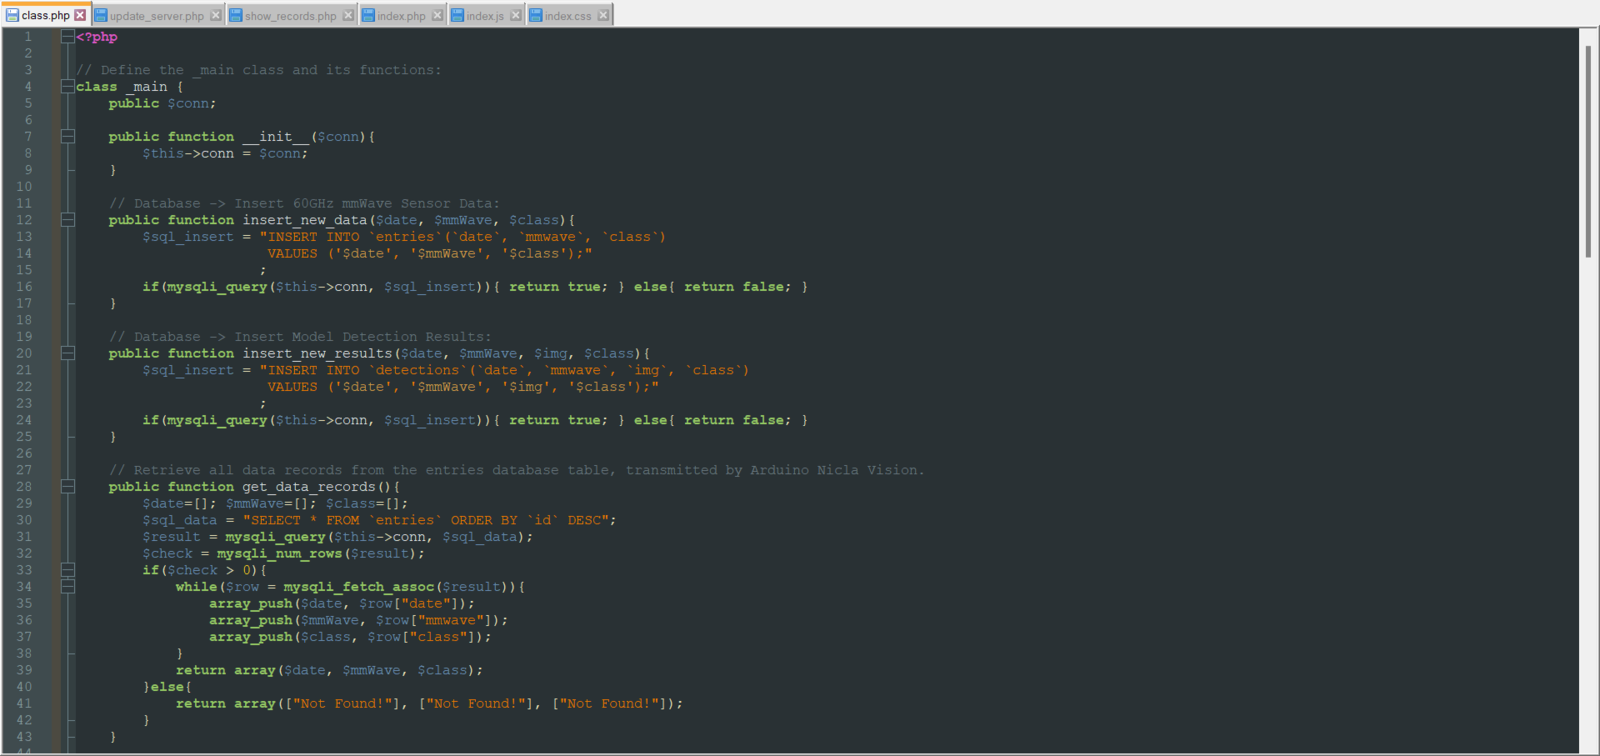
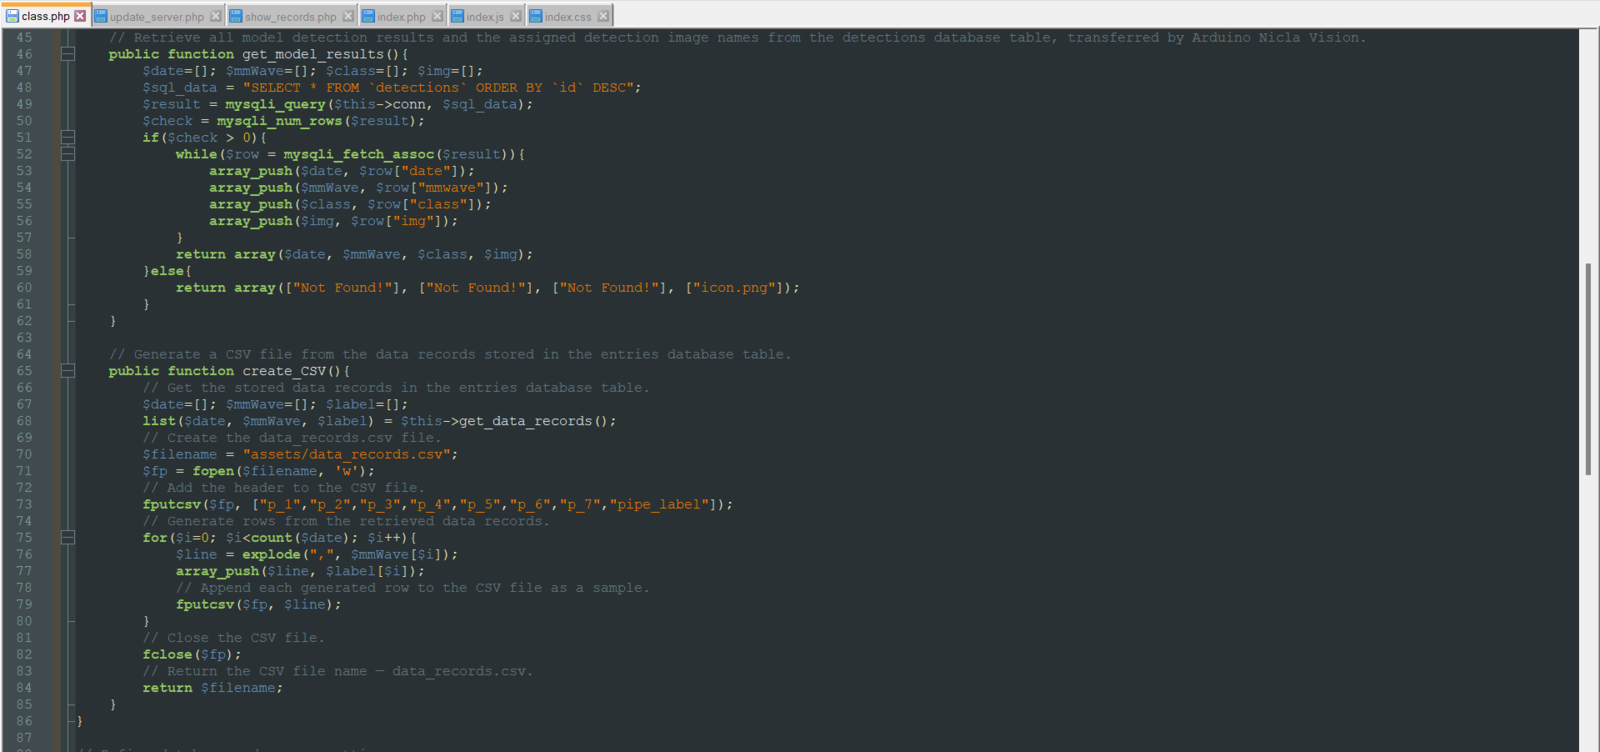
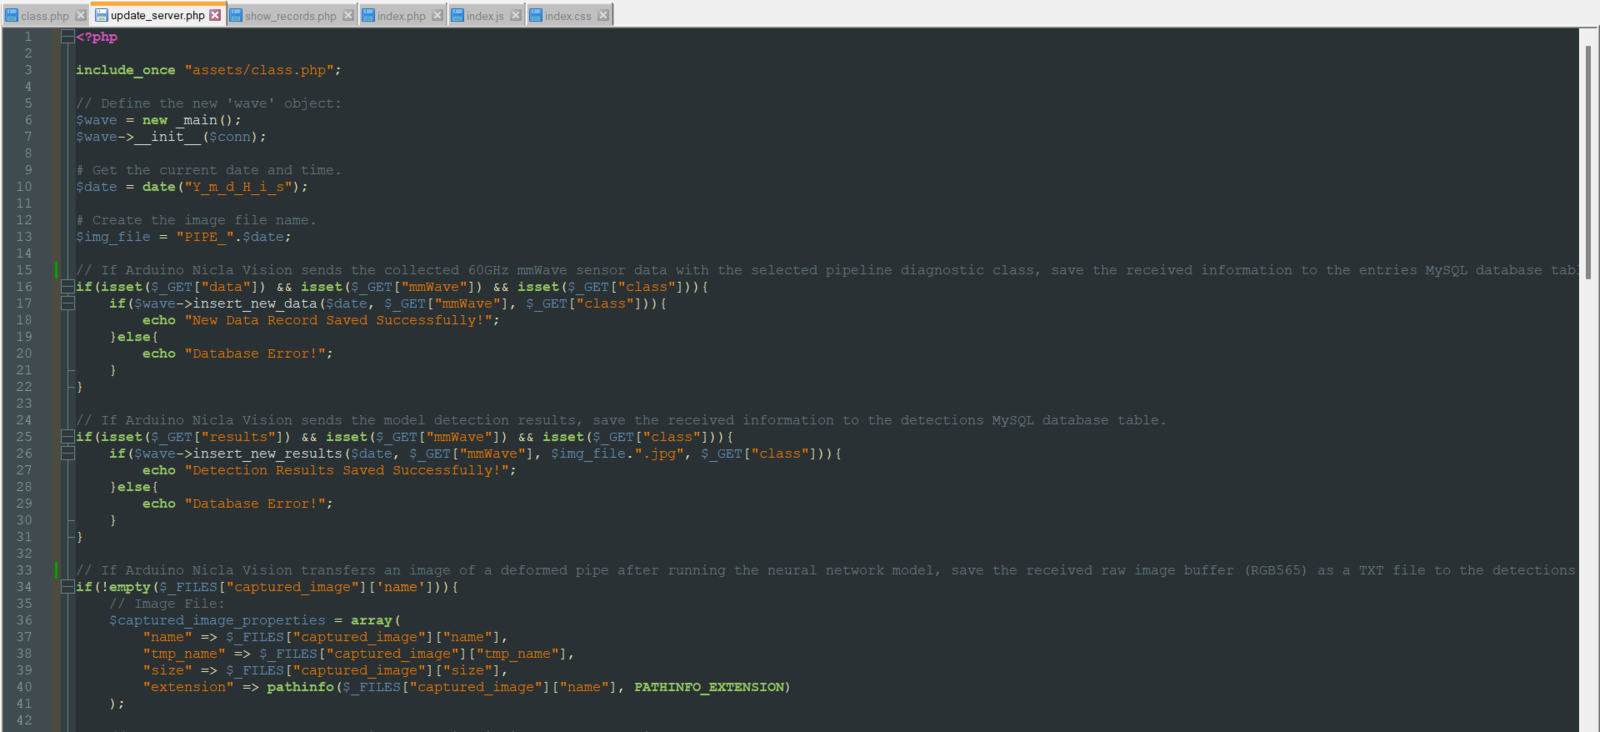
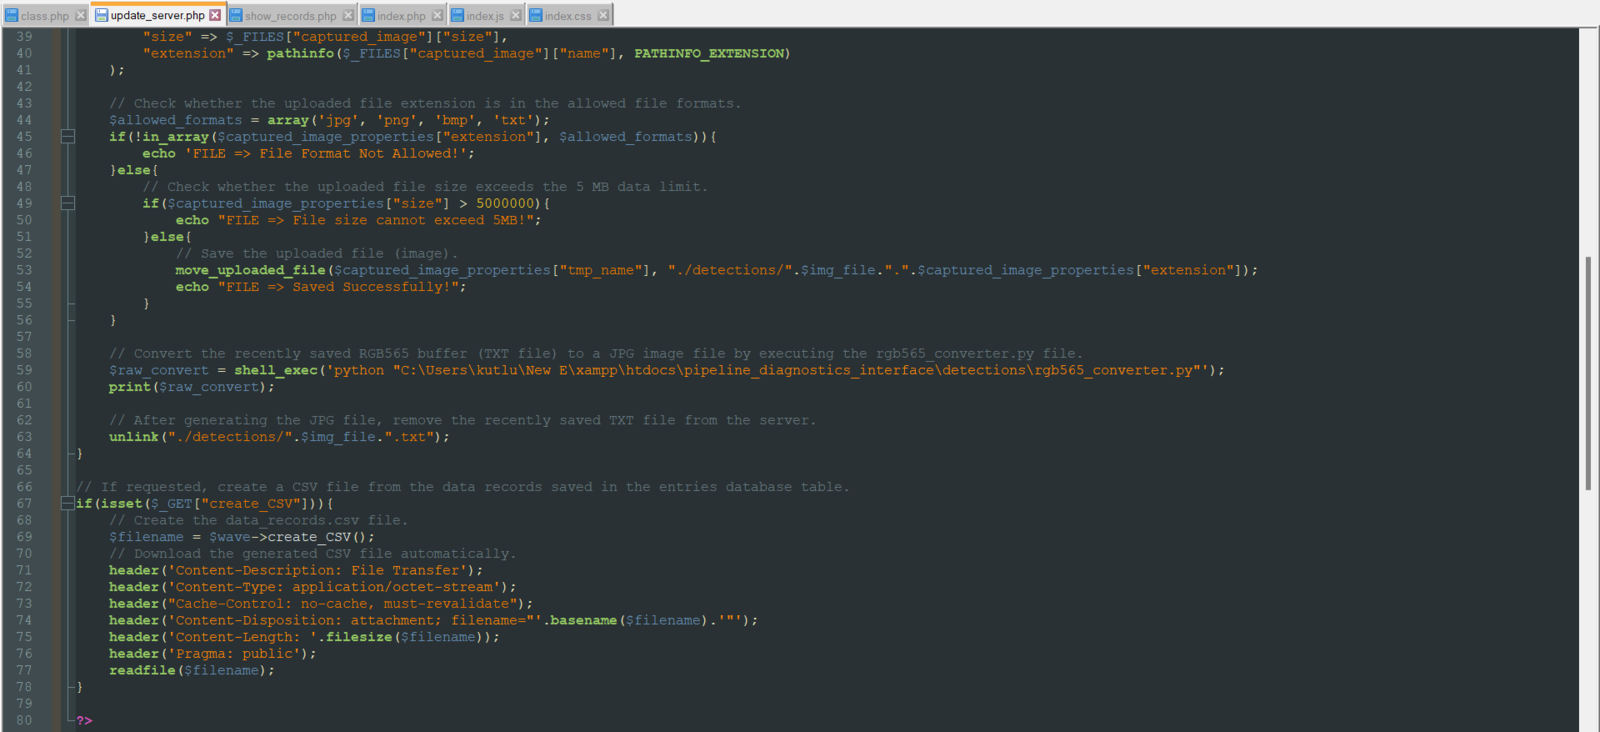
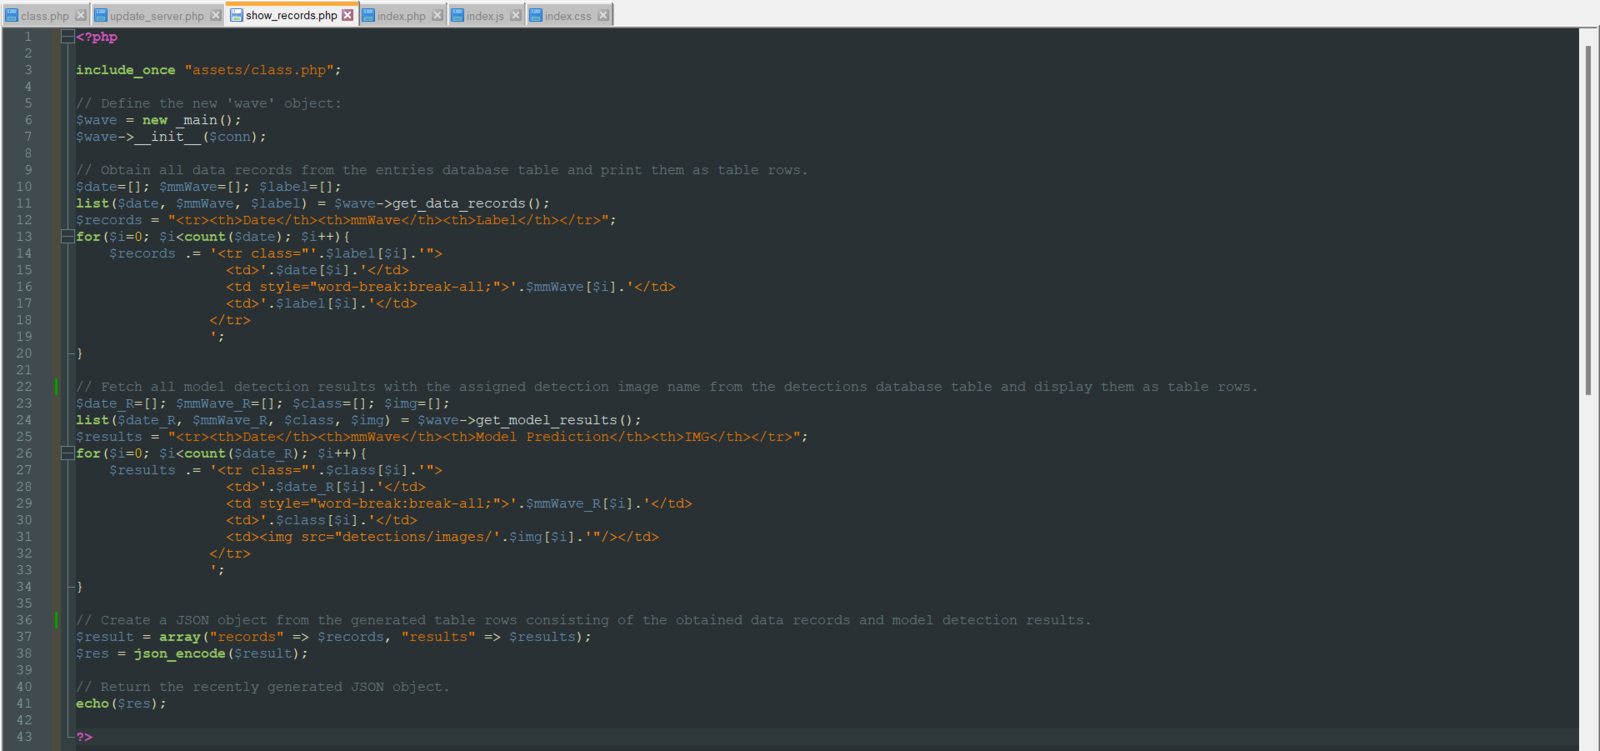
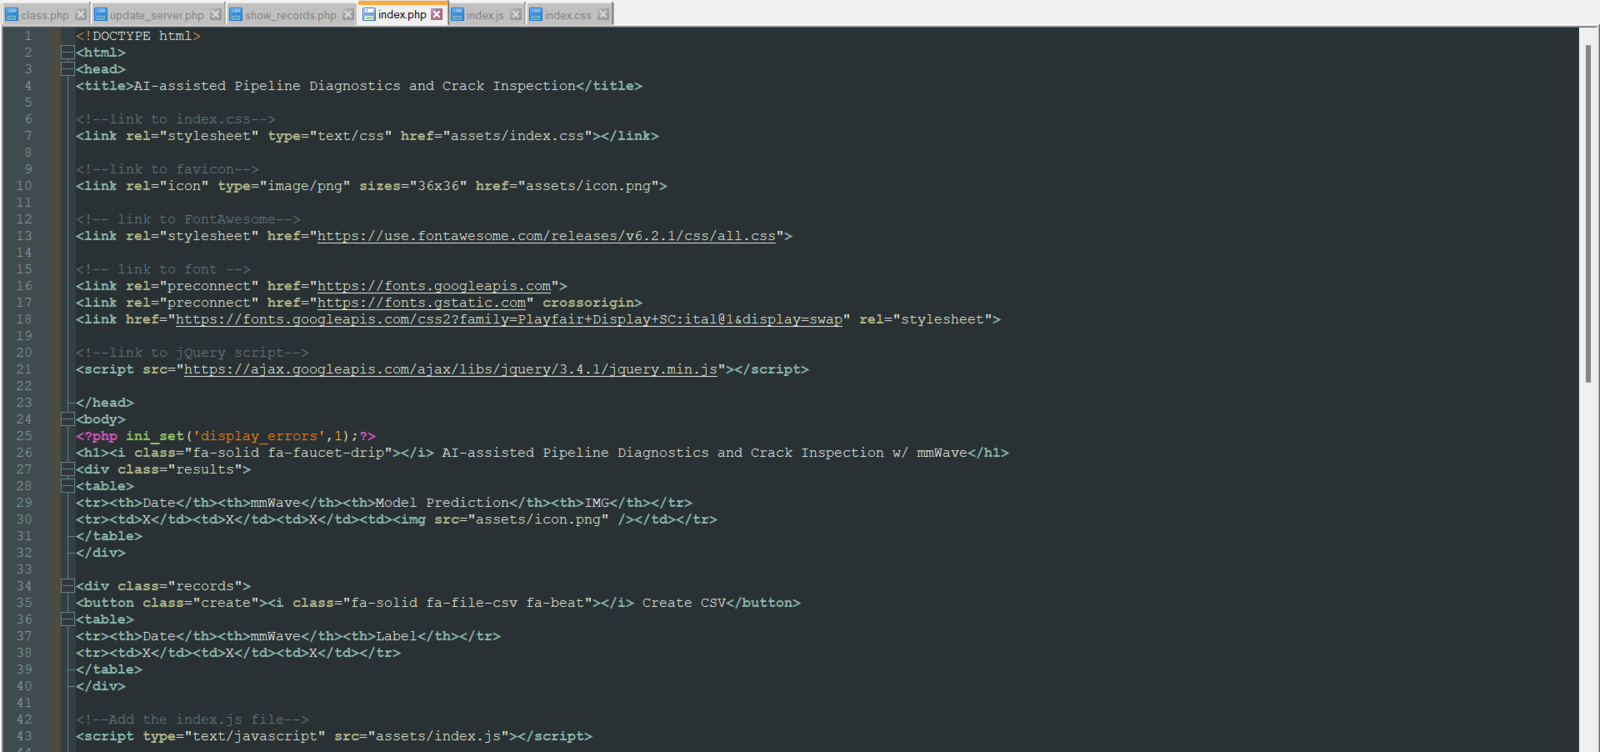
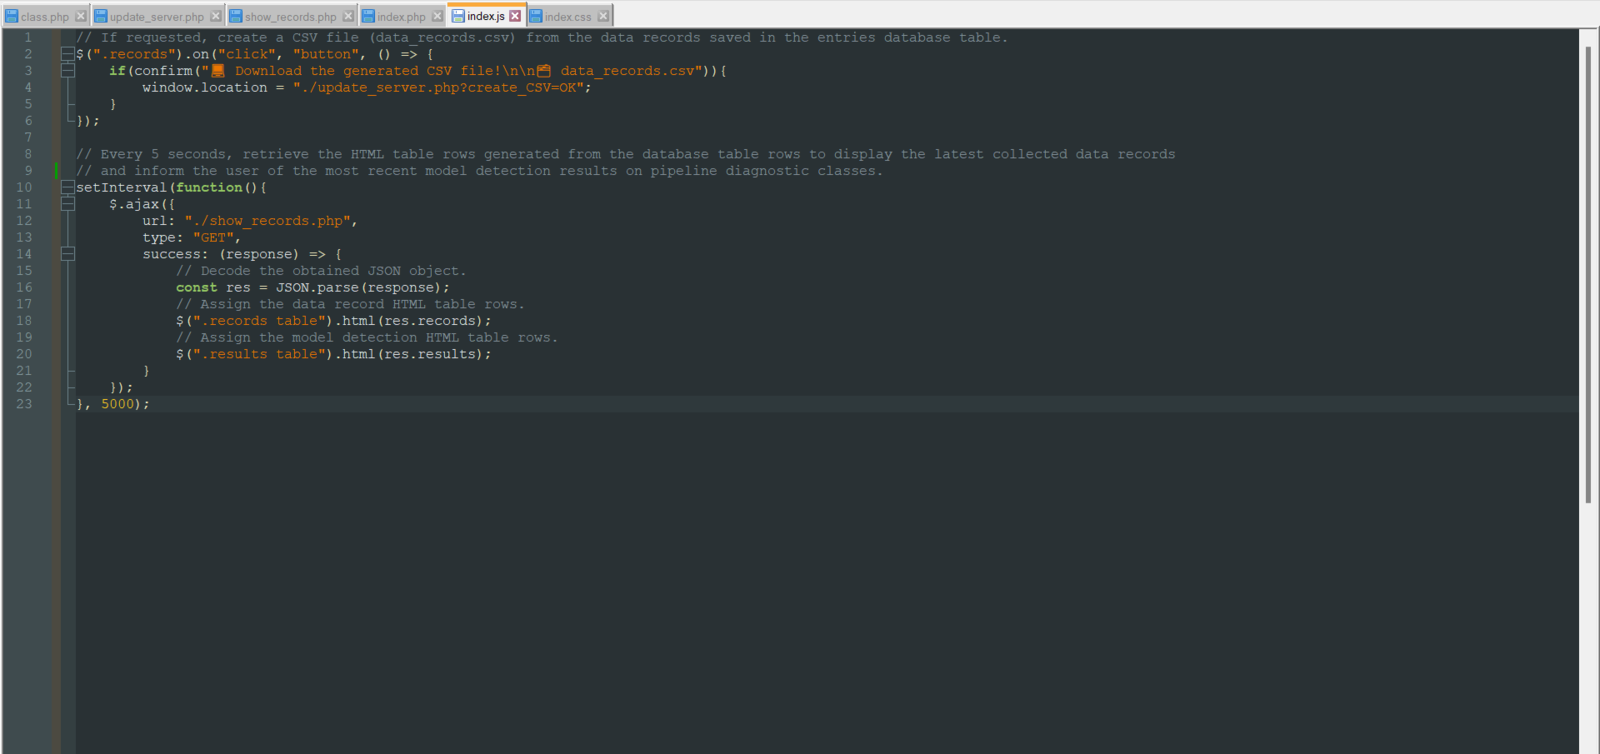
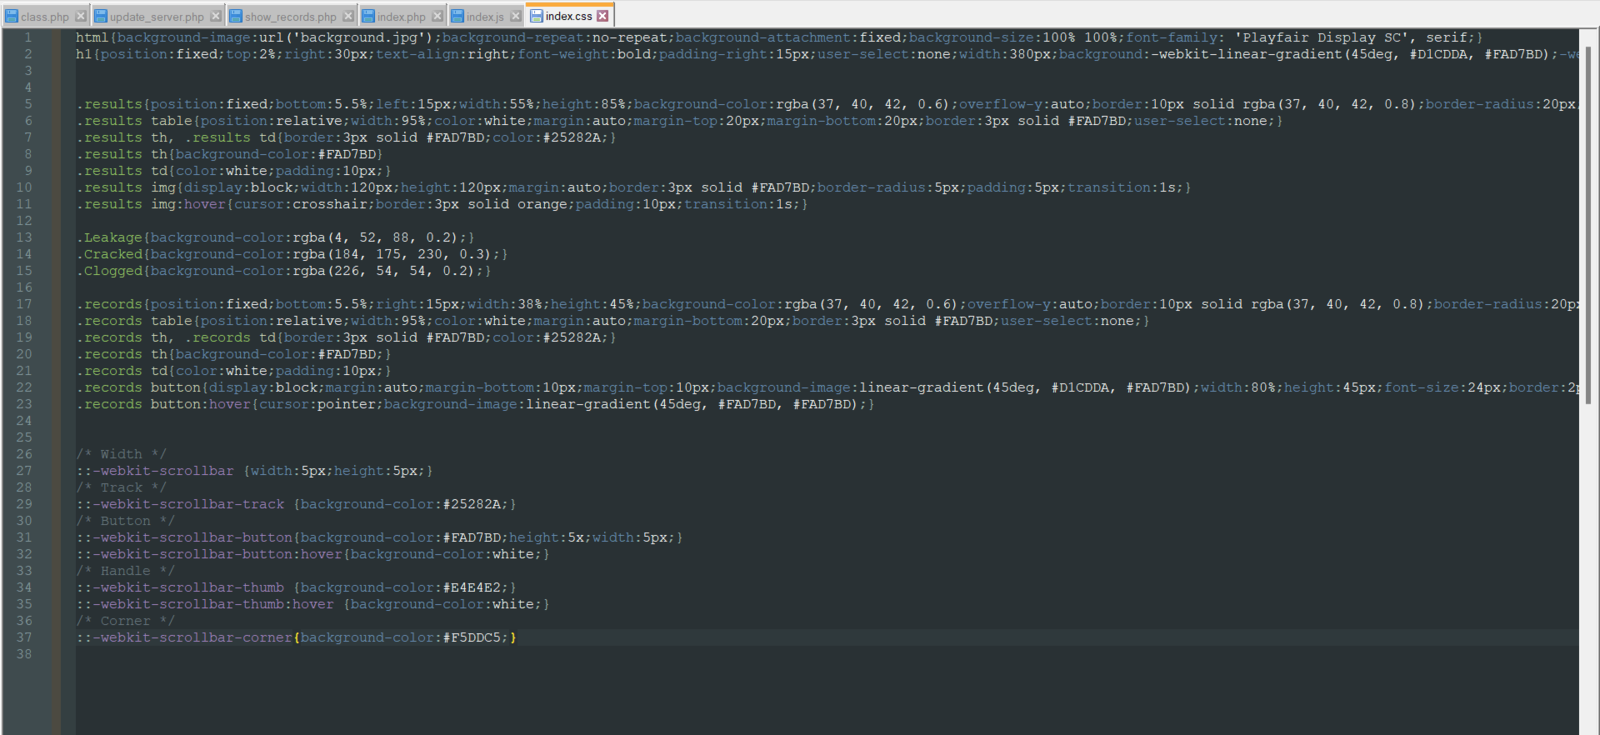
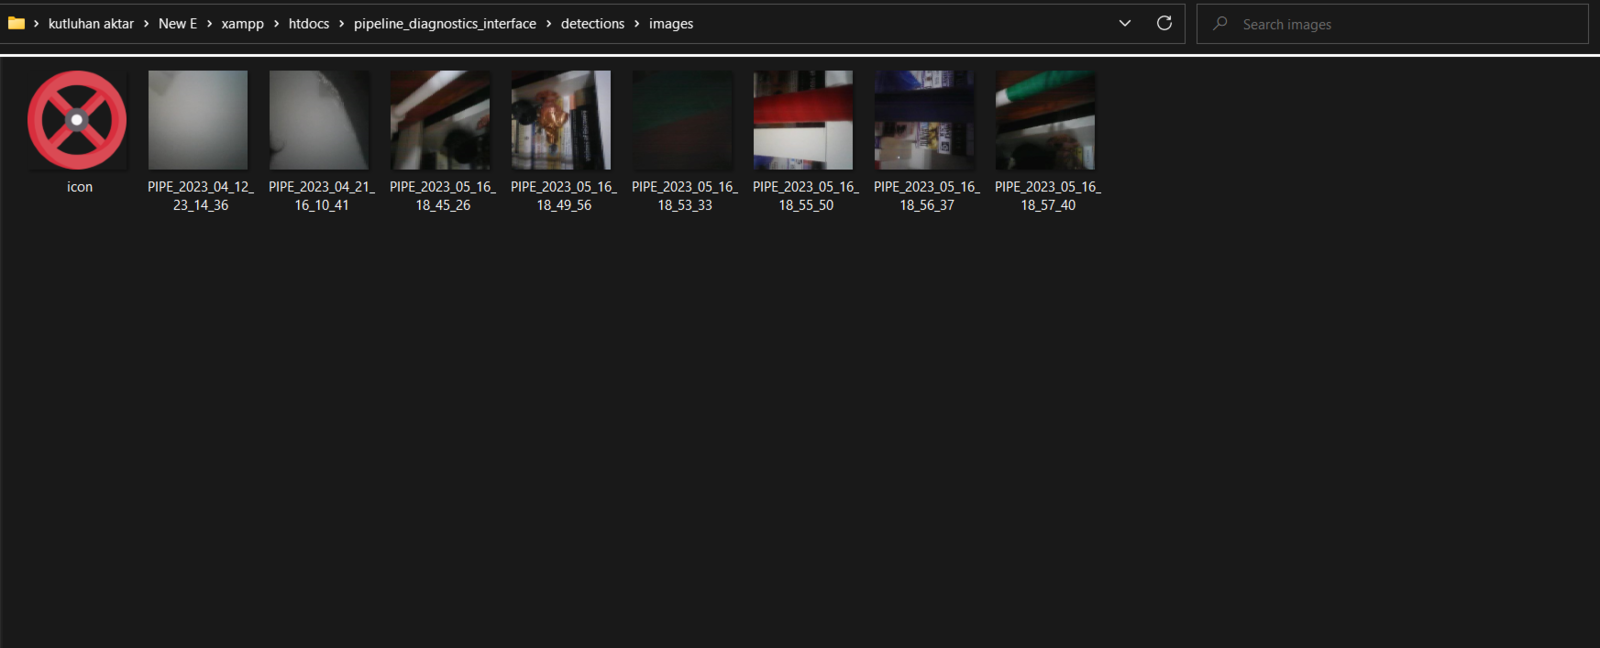
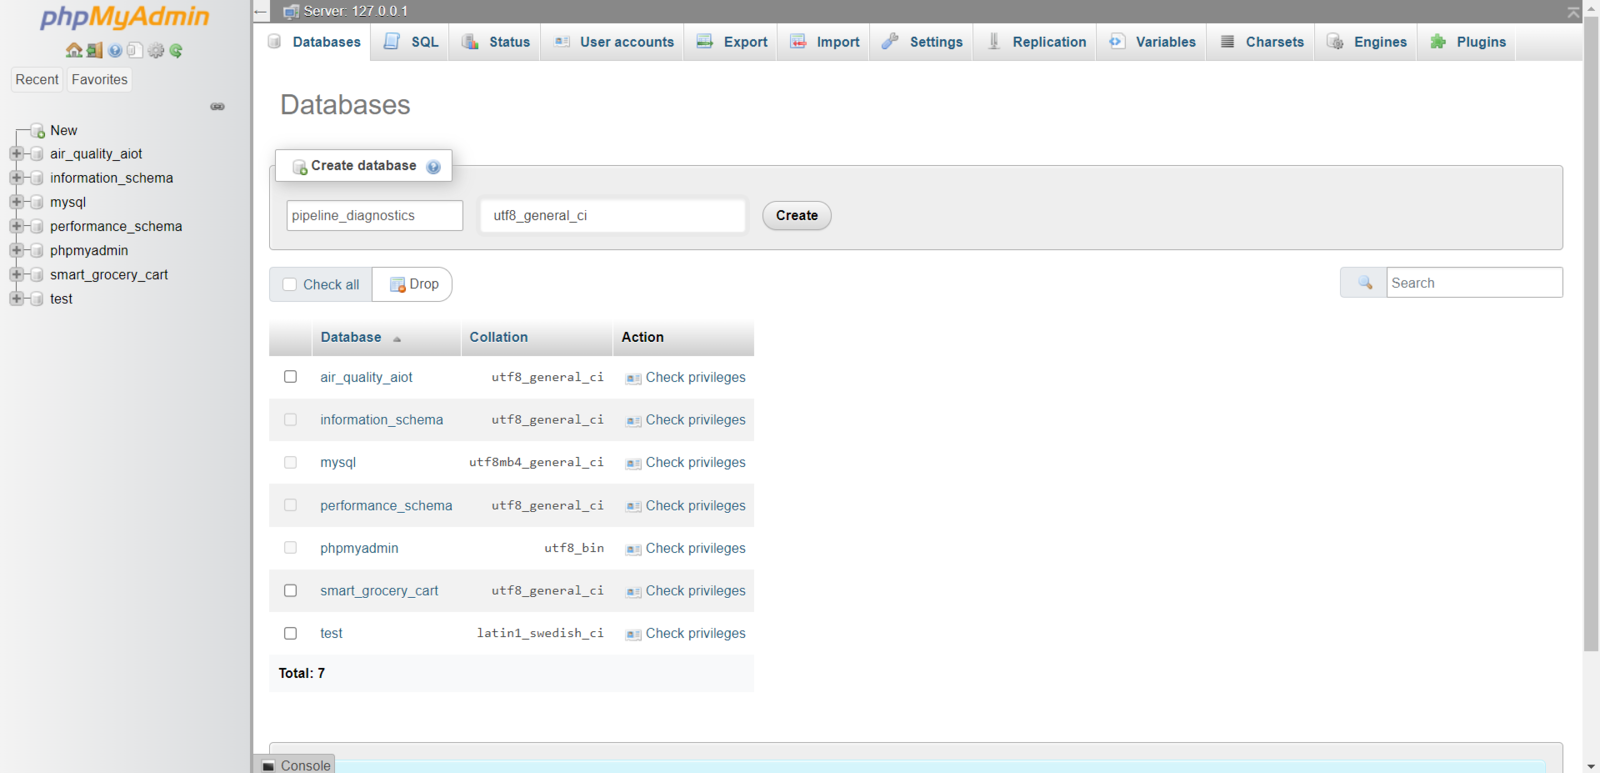
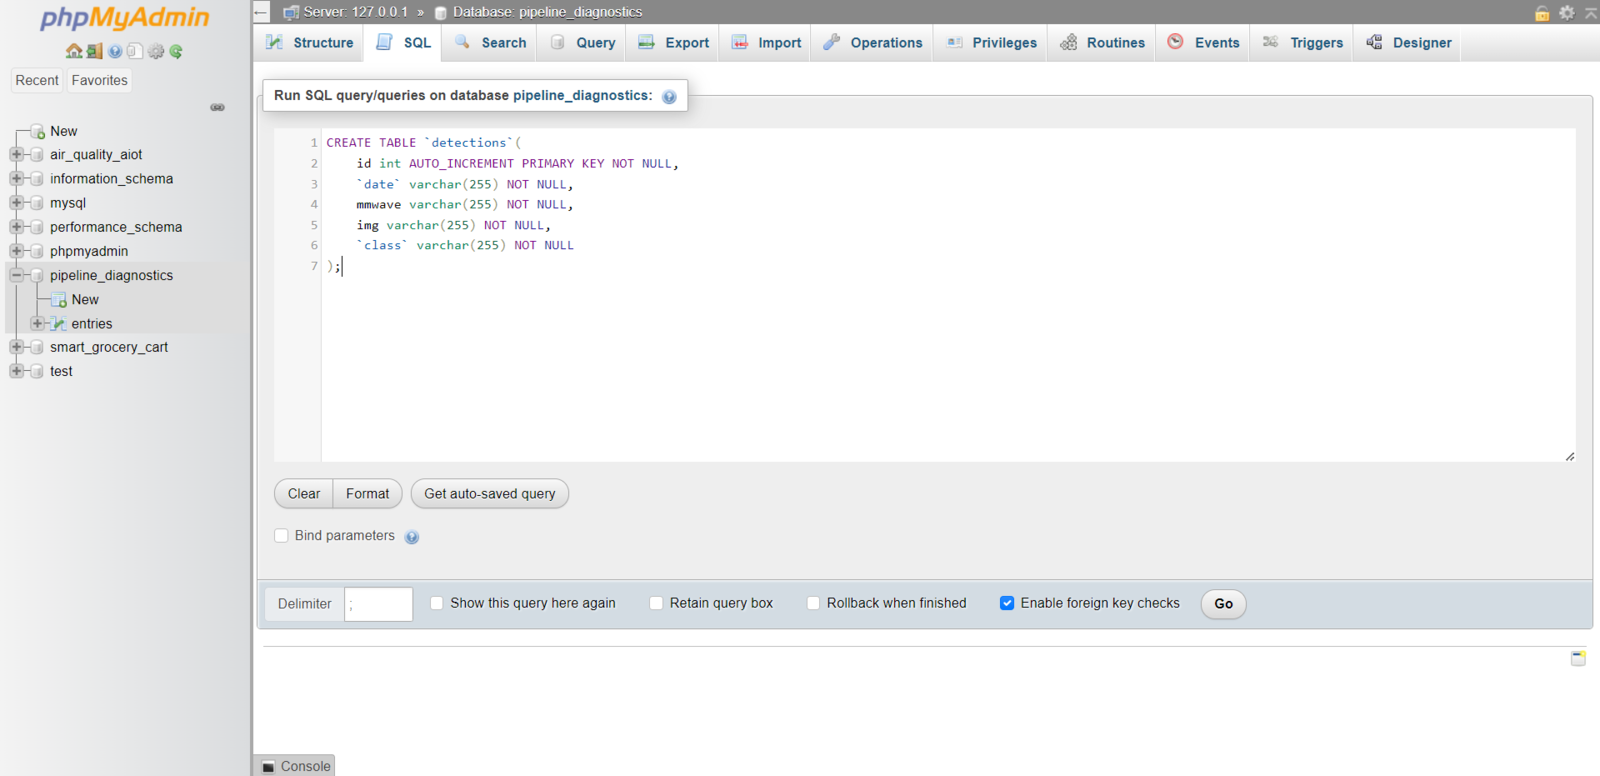
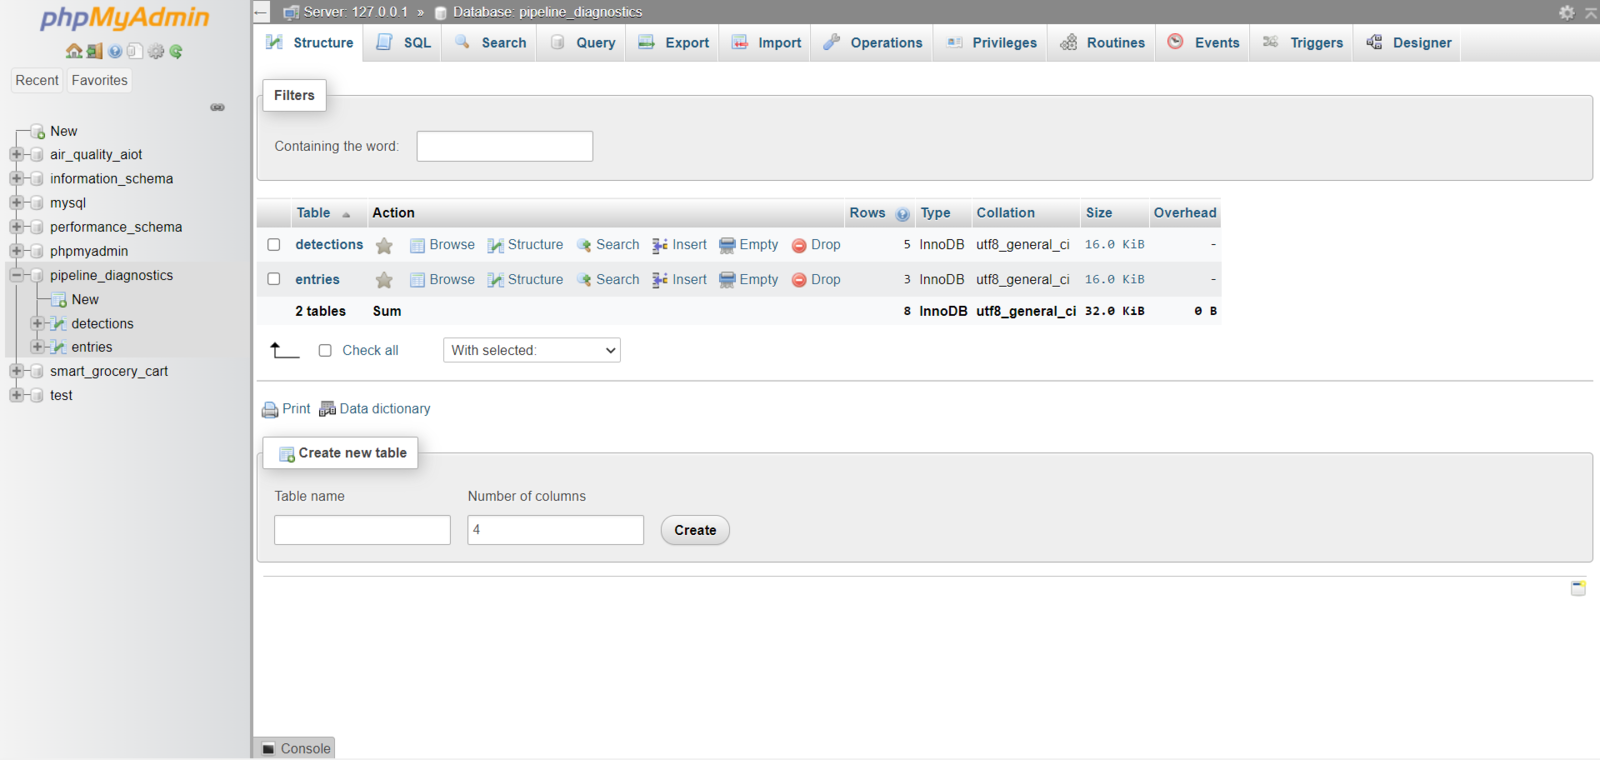
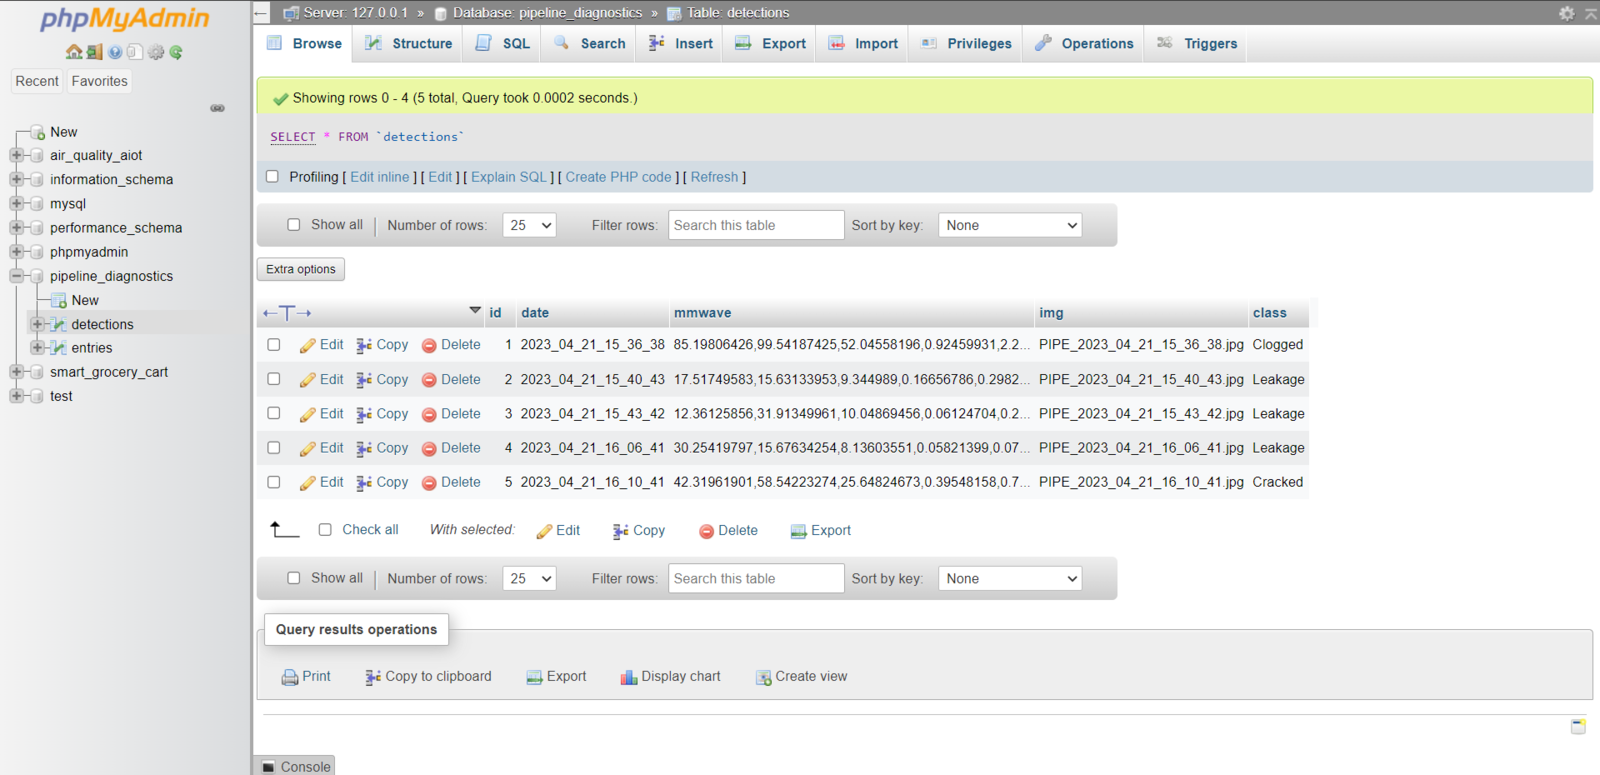
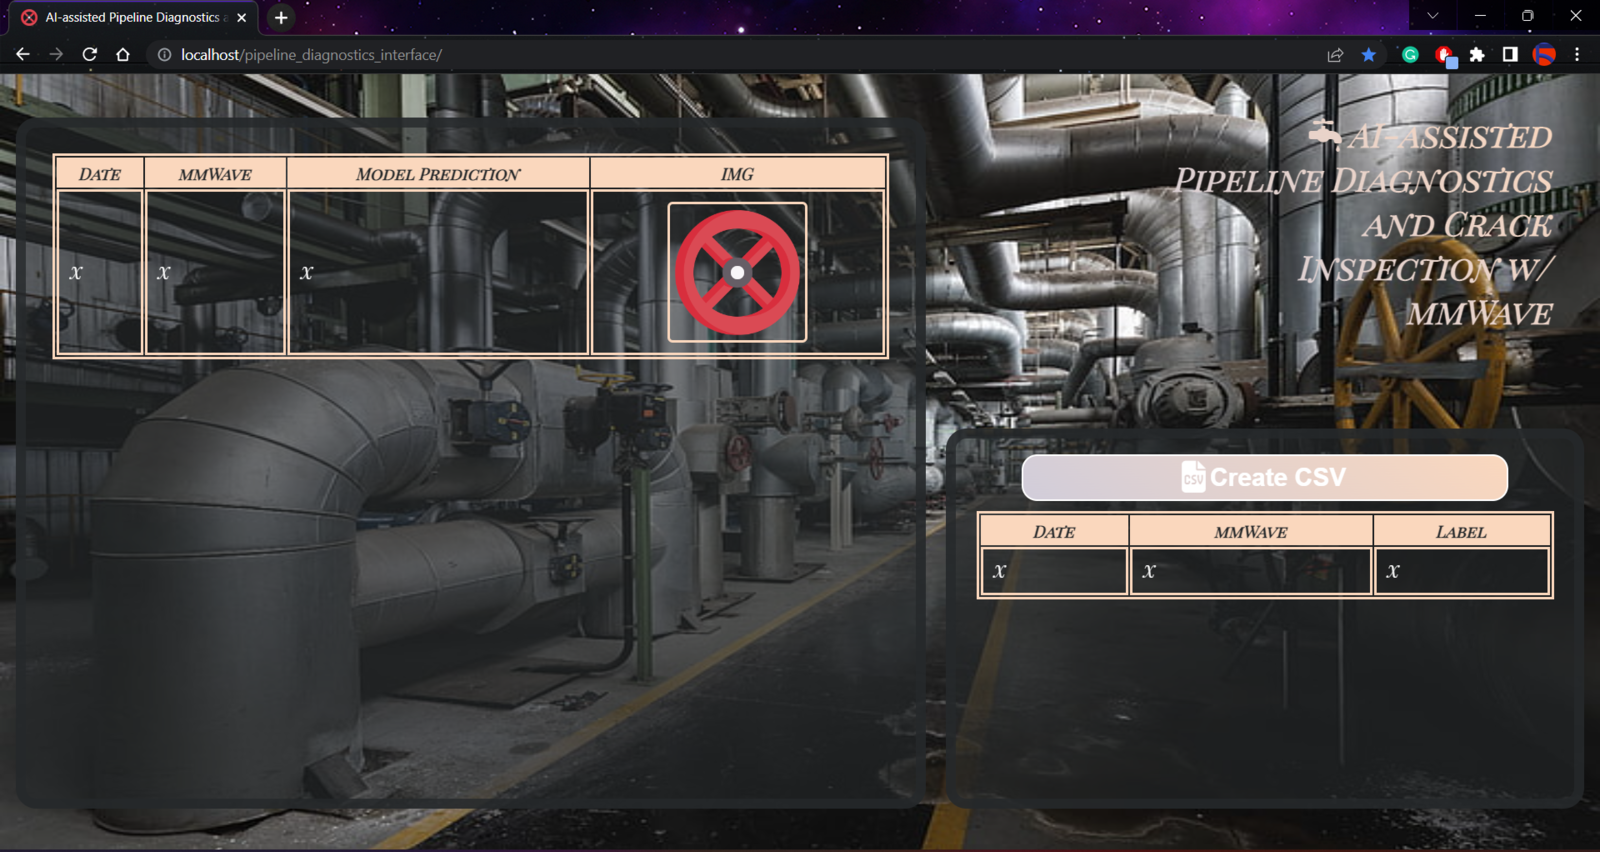
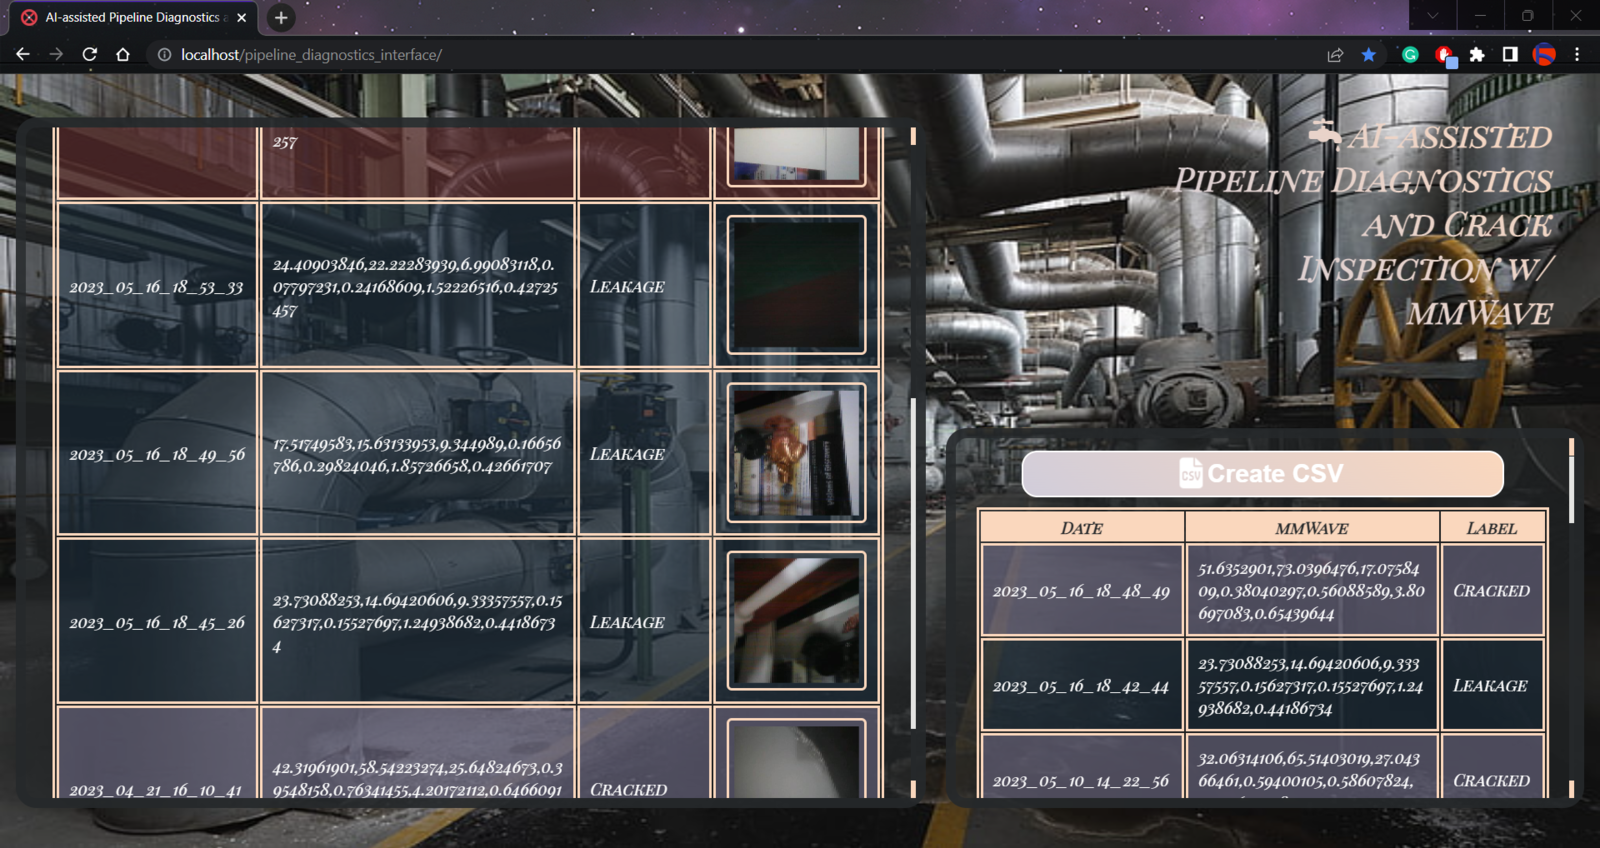
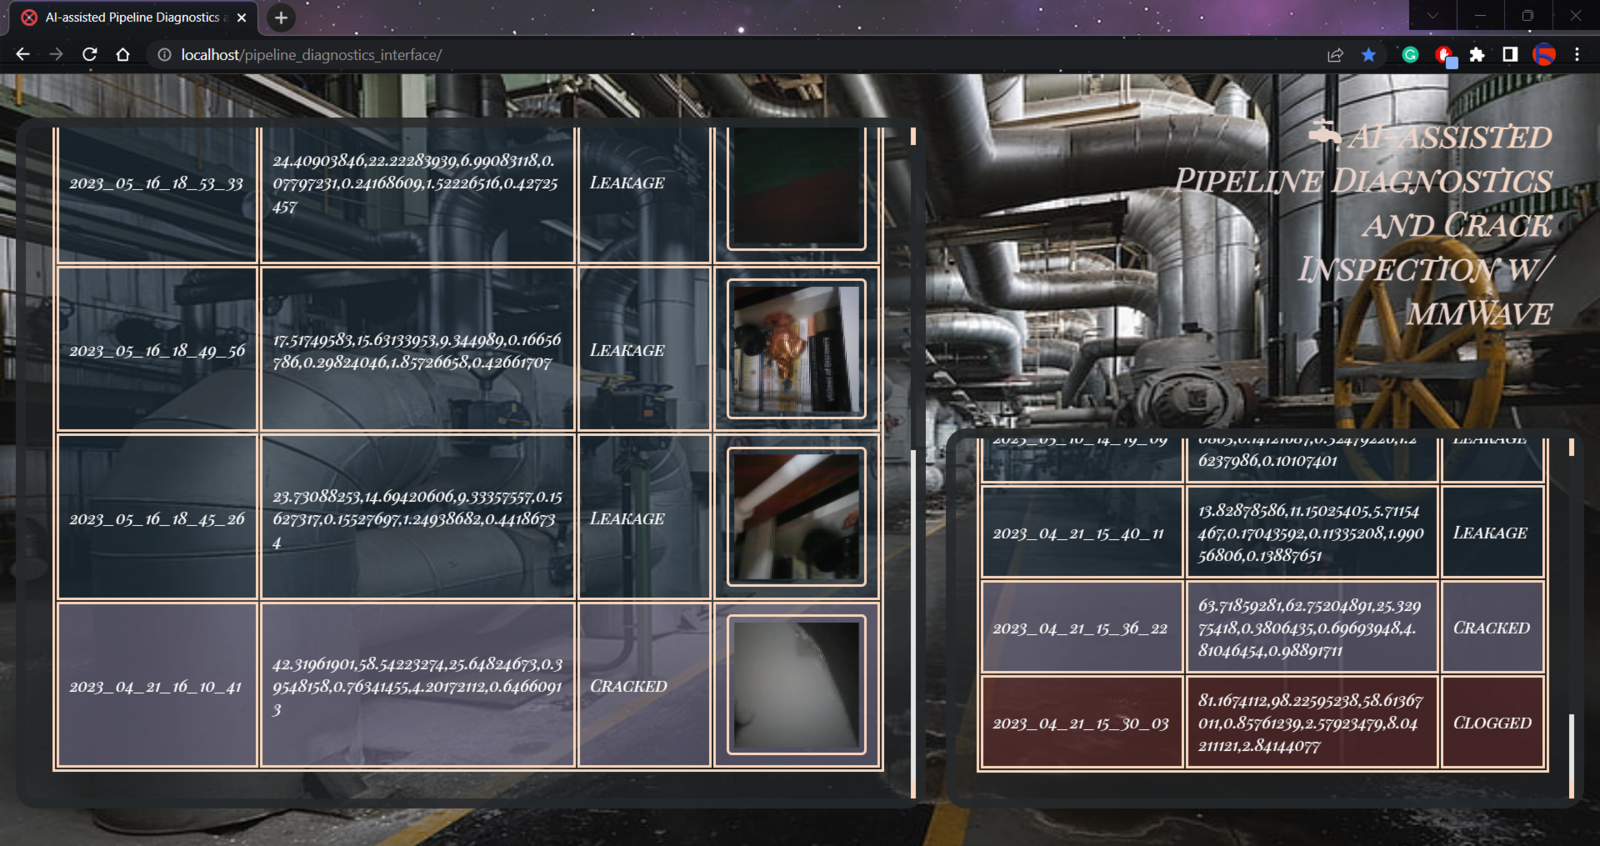
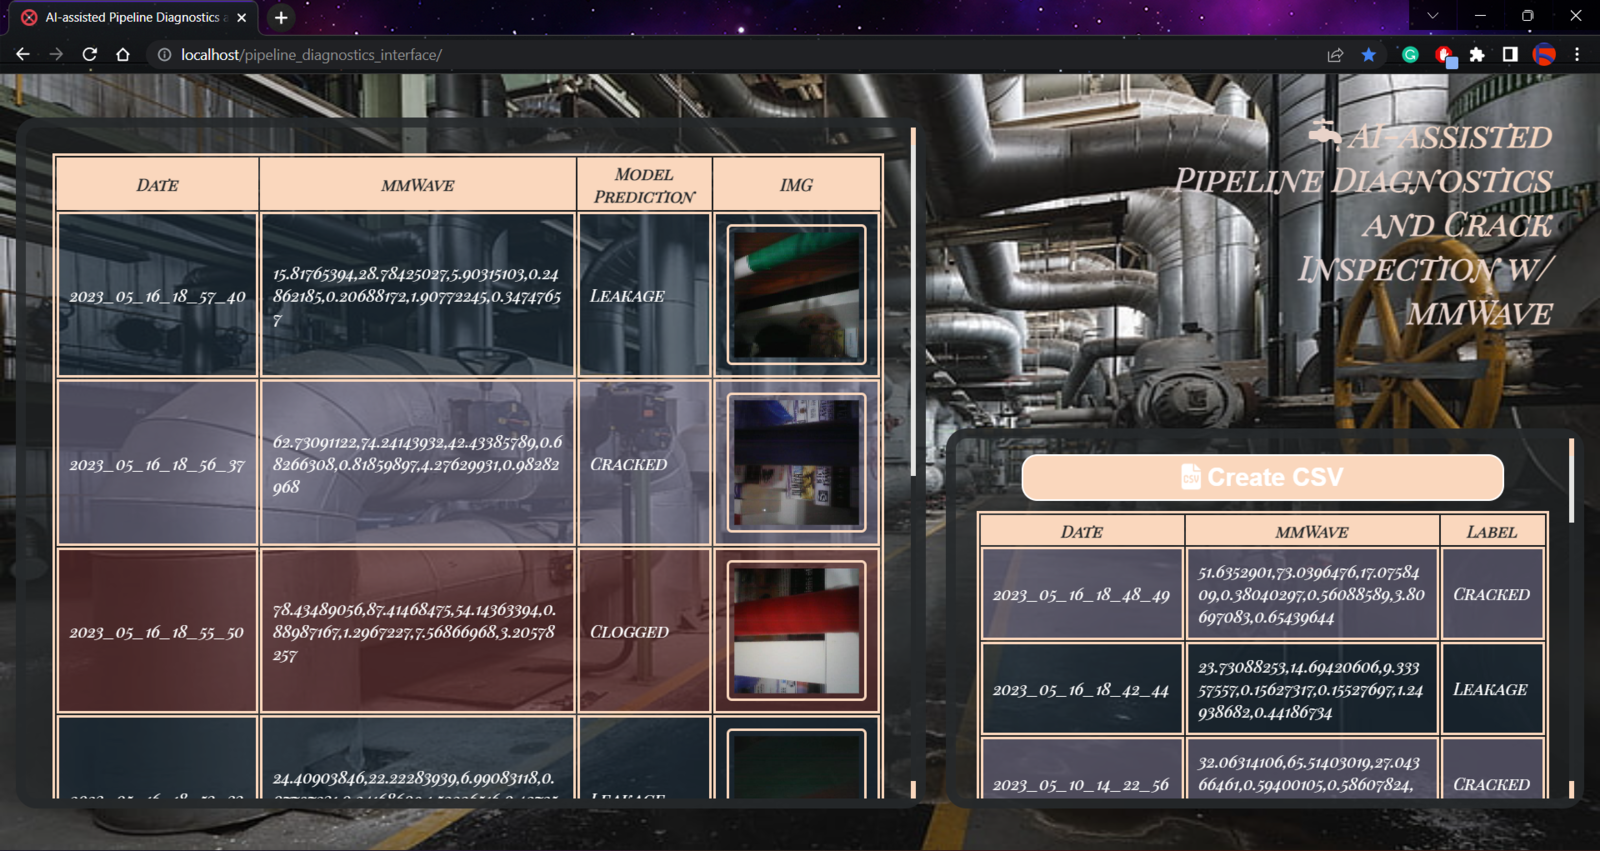
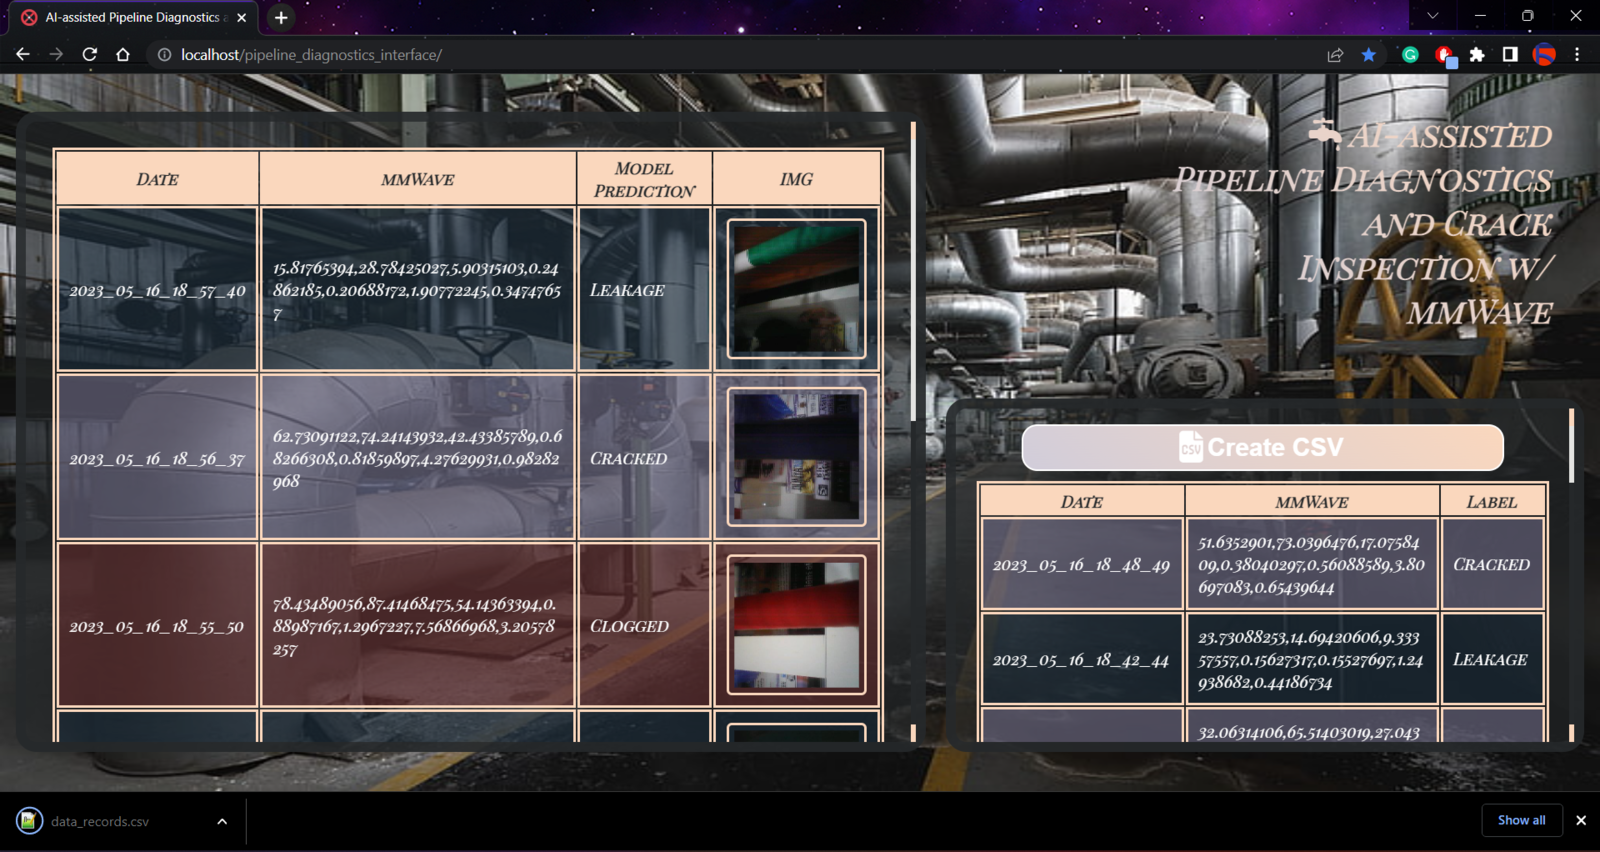
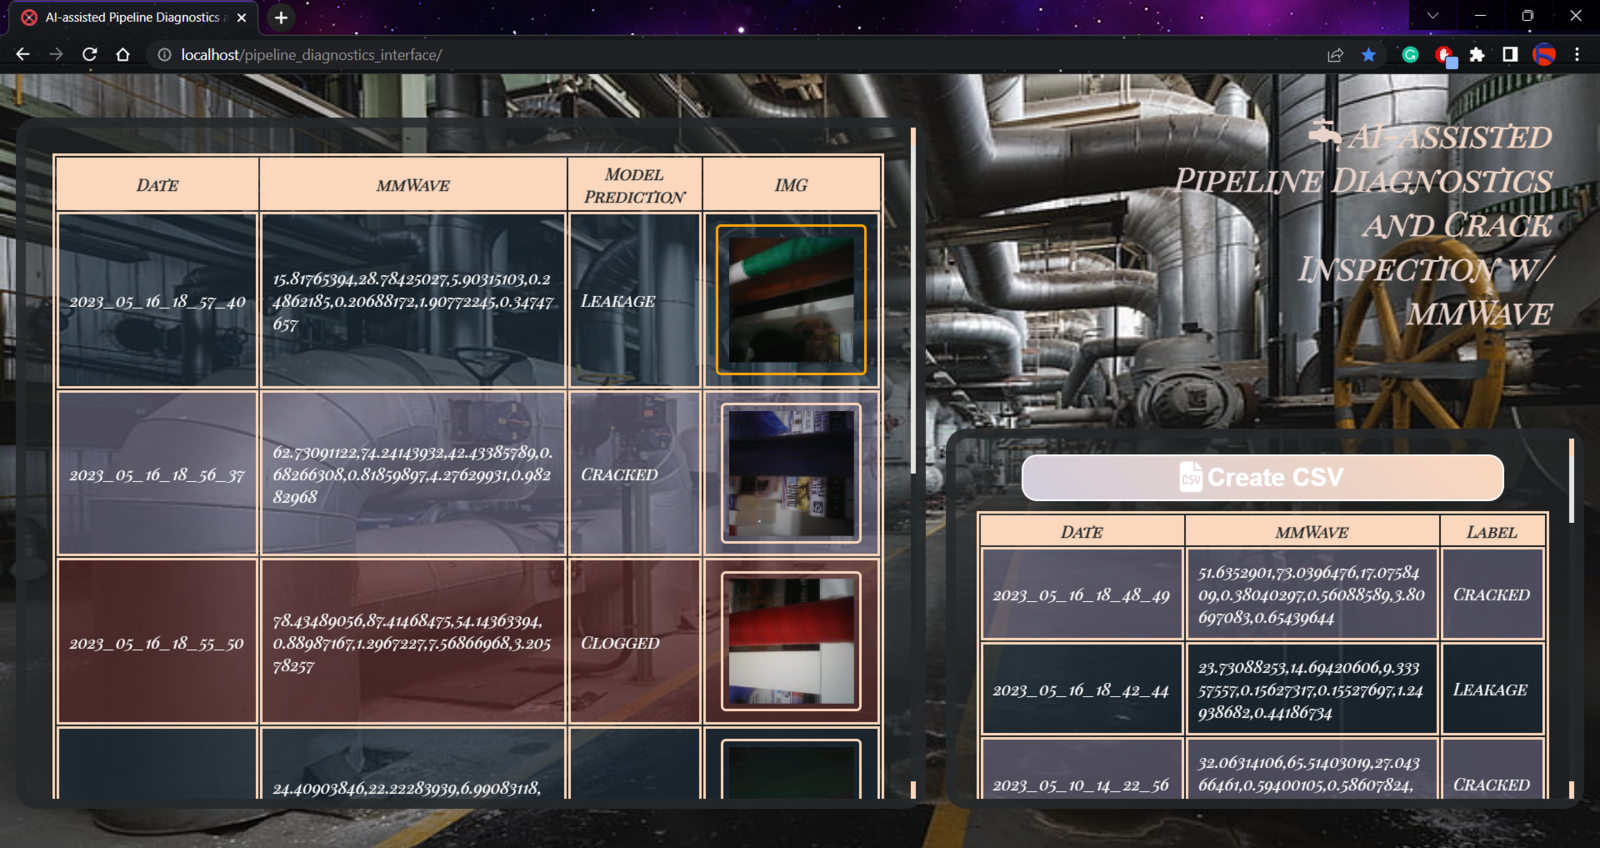
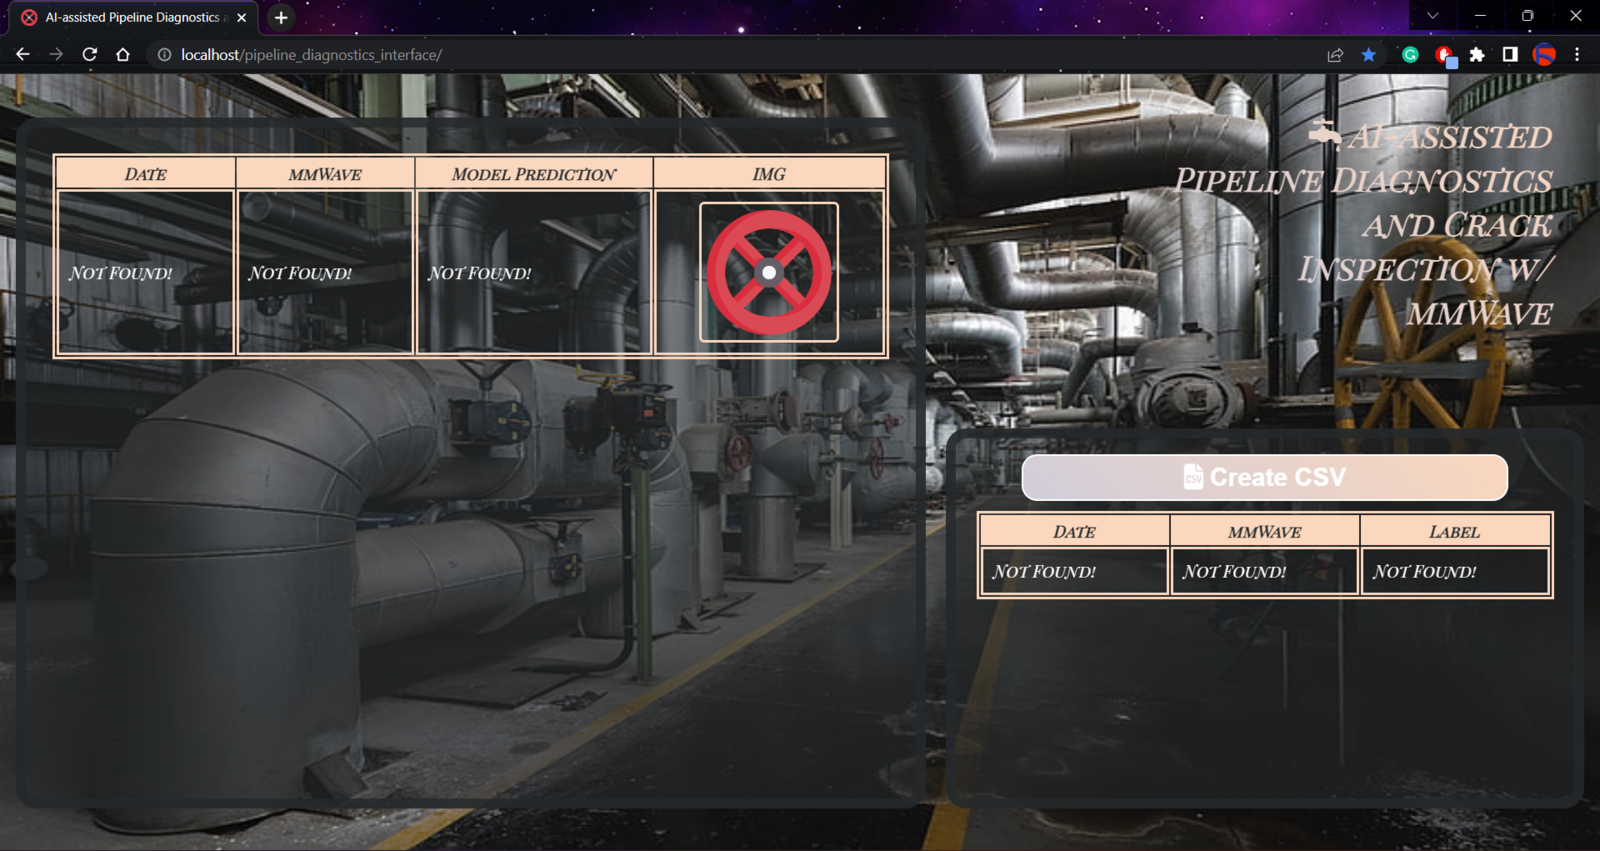
To provide an outstanding user interface for generating data samples and displaying model detection results, I developed a full-fledged web application from scratch in PHP, HTML, JavaScript, CSS, and MySQL. First of all, the web application obtains the extracted mmWave data parameters and the selected pipeline diagnostic class from Nicla Vision via an HTTP GET request. After storing the received information in a particular MySQL database table, the web application lets the user generate a CSV file, including all stored data records as samples. Also, the web application gets the inference data parameters, the diagnosed pipeline defect (class) by the neural network model, and the captured image of the deformed pipe from Nicla Vision via an HTTP POST request. After saving the received information to a particular MySQL database table for further inspection, the web application converts the received raw image buffer (RGB565) to a JPG file by executing a Python script. Then, the web application updates its interface automatically to show the latest stored information in database tables. On the interface, the application shows model detection results, the assigned detection images, and the collected data parameters in descending order so as to allow the user to check previous records easily. As shown below, the web application consists of three folders and seven code files:- /assets
- — background.jpg
- — class.php
- — data_records.csv
- — icon.png
- — index.css
- — index.js
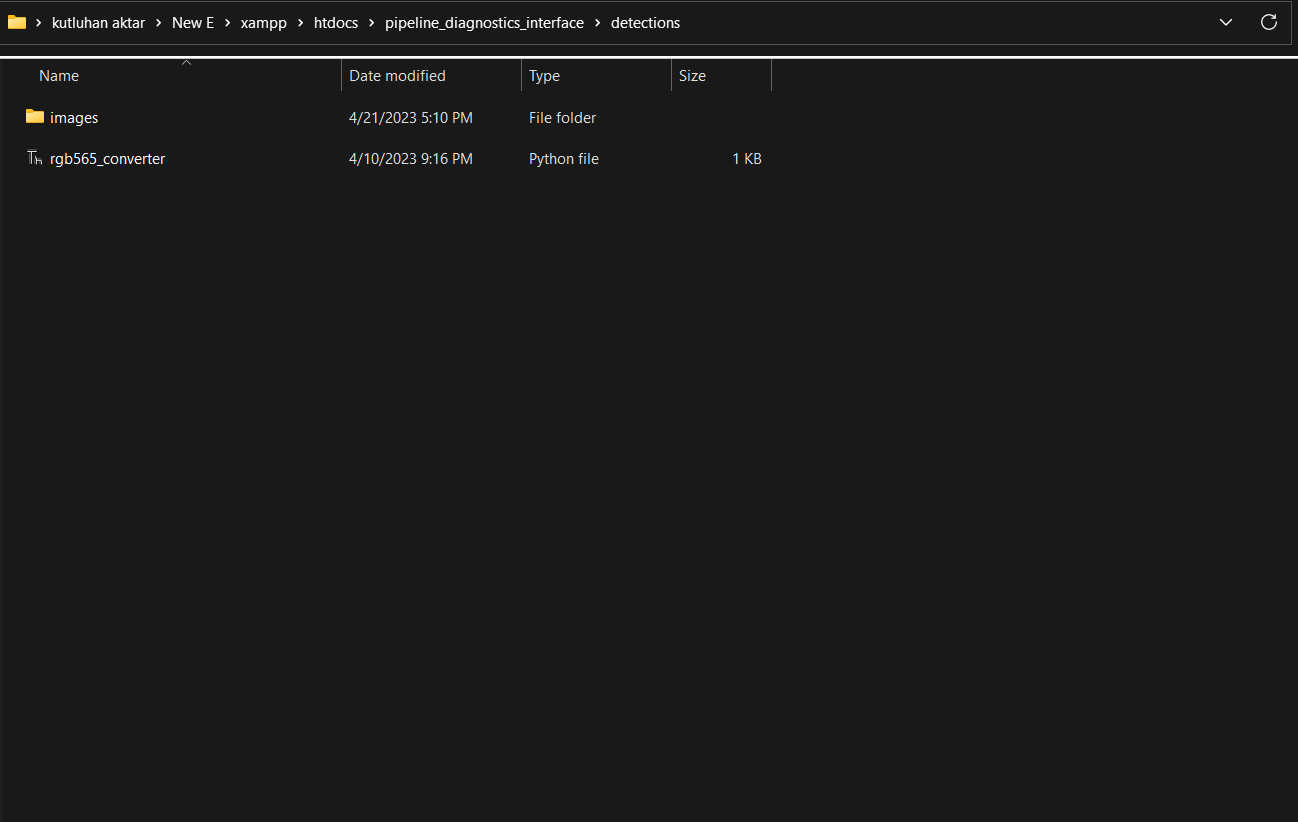
- /detections
- — /images
- — rgb565_converter.py
- index.php
- show_records.php
- update_server.php
image
image
image
image
image
image
image
image
image
image
image
Step 3.1: Converting the raw image buffers transferred by Nicla Vision via POST requests to JPG files
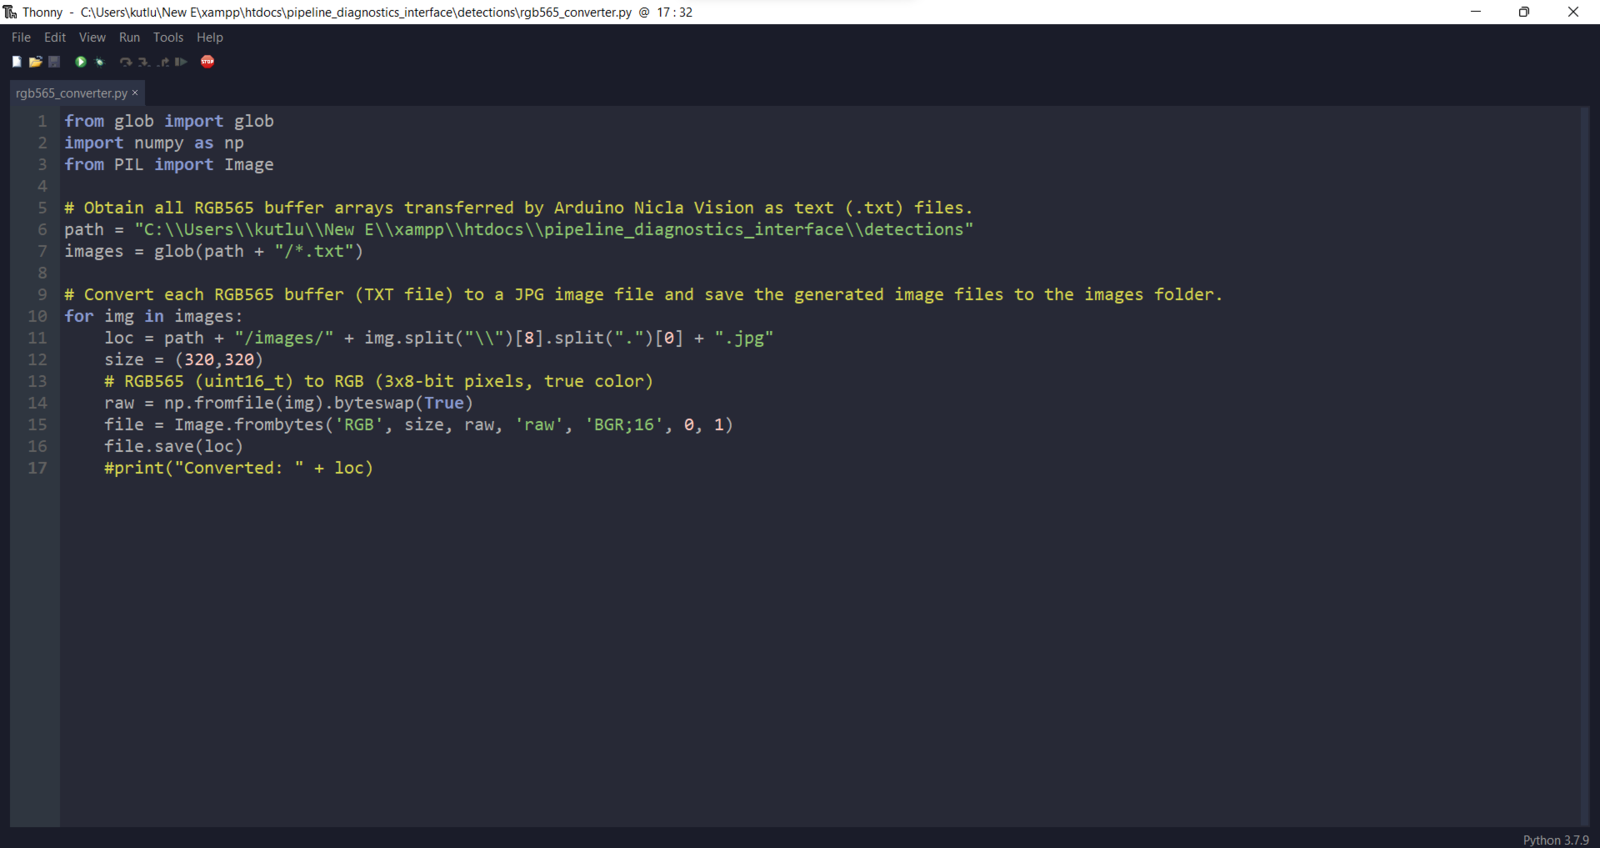
Since Nicla Vision can only produce raw image buffers (RGB565) due to its built-in 2-megapixel CMOS camera (GC2145) and camera library, I needed to convert the generated raw image buffers to readable image files so as to display them on the web application interface. Since Nicla Vision cannot convert the generated raw image buffer due to memory allocation issues, I decided to convert the captured raw image buffer to a JPG file through the web application. Even though PHP can handle converting image buffers to different file formats, converting images in PHP causes bad request issues since the web application receives raw image buffers from Nicla Vision via HTTP POST requests. Hence, I decided to utilize Python to create JPG files from raw image buffers since Python provides built-in modules for image conversion in seconds, even for byte swapping. By employing the terminal on LattePanda 3 Delta, the web application executes the rgb565_converter.py file directly to convert raw image buffers. :hash: Since the numpy module is required to convert uint16_t to 3x8-bit pixels, you may require to install the numpy module on the terminal manually to avoid errors. python -m pip install numpy 📁 rgb565_converter.py ⭐ Include the required modules.- RGB565 (uint16_t) ➜ RGB (3x8-bit pixels, true color)
image
image
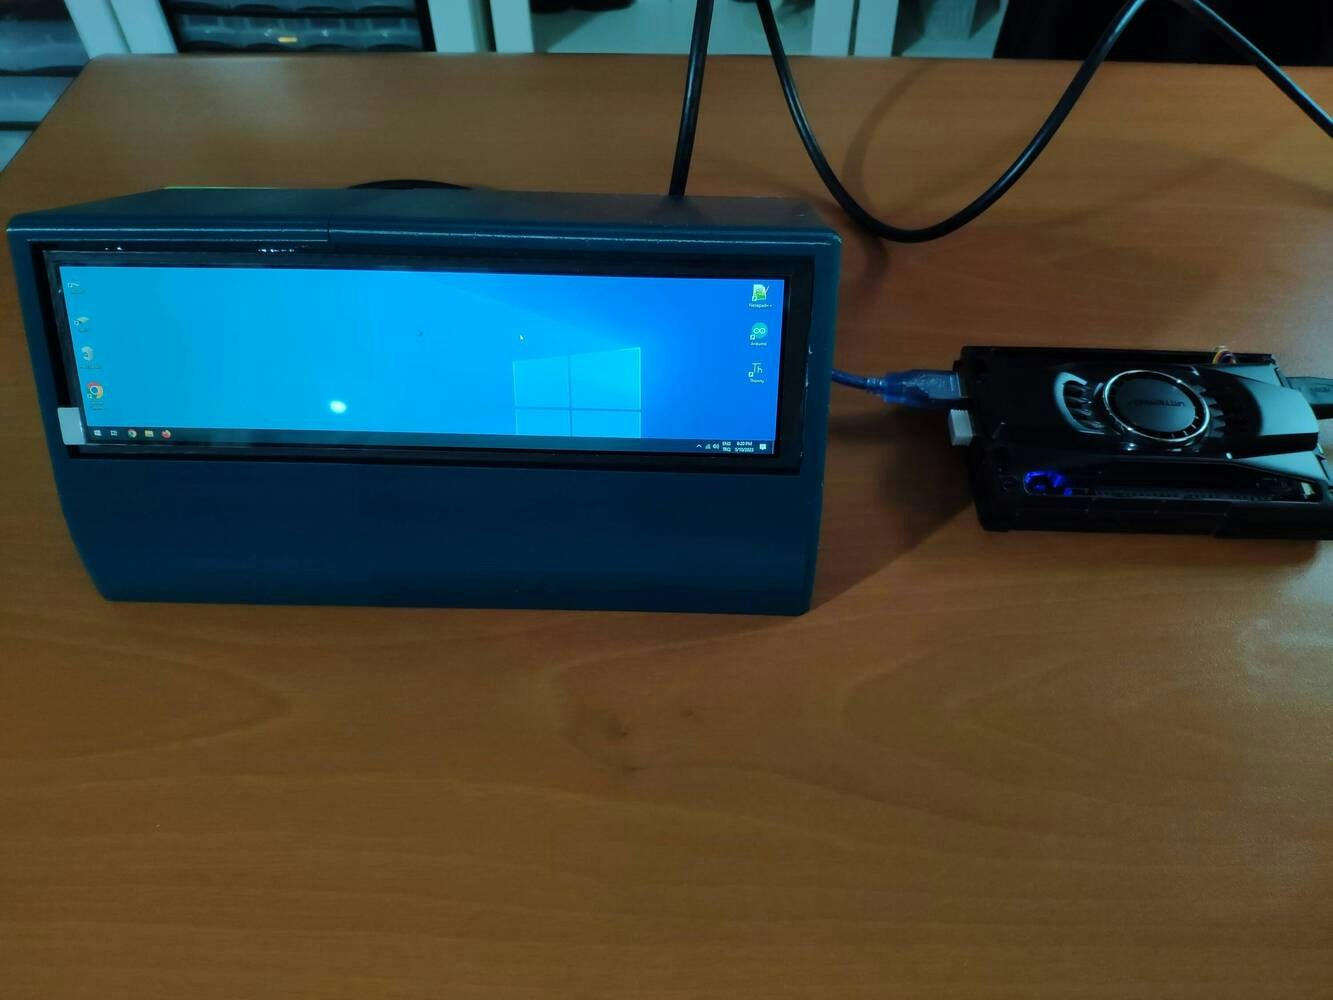
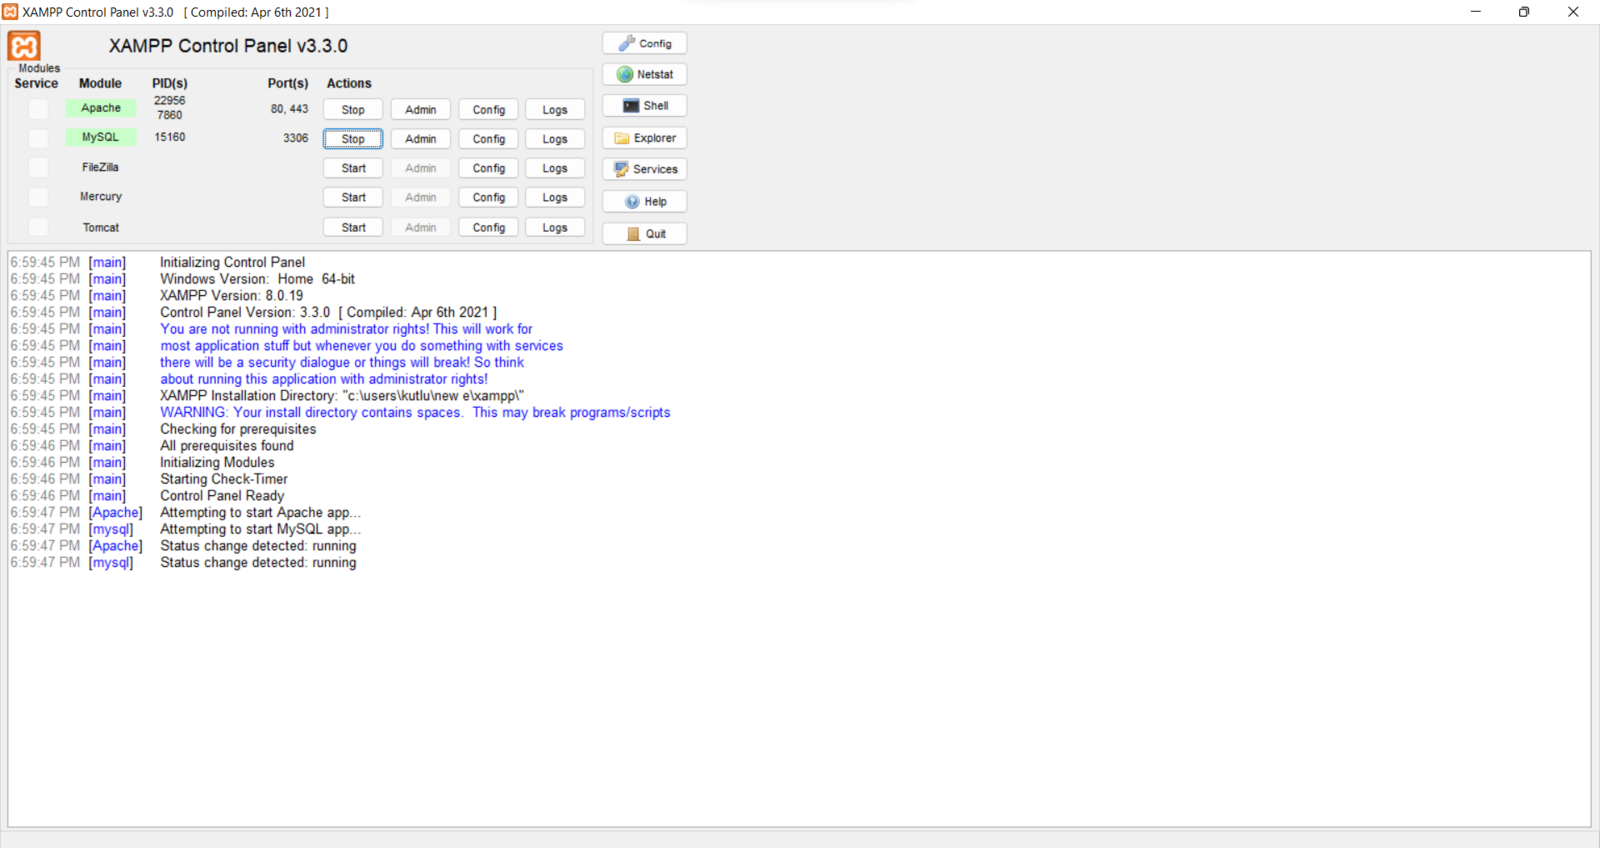
Step 3.2: Setting and running the web application on LattePanda 3 Delta 864
Since I have got a test sample of the brand-new LattePanda 3 Delta 864, I decided to host my web application on LattePanda 3 Delta. Therefore, I needed to set up a LAMP web server. LattePanda 3 Delta is a pocket-sized hackable computer that provides ultra performance with the Intel 11th-generation Celeron N5105 processor. Plausibly, LattePanda 3 Delta can run the XAMPP application. So, it is effortless to create a server with a MariaDB database on LattePanda 3 Delta. As explained in the previous steps, I also designed a unique deck for LattePanda by utilizing Elecrow’s 8.8” IPS monitor.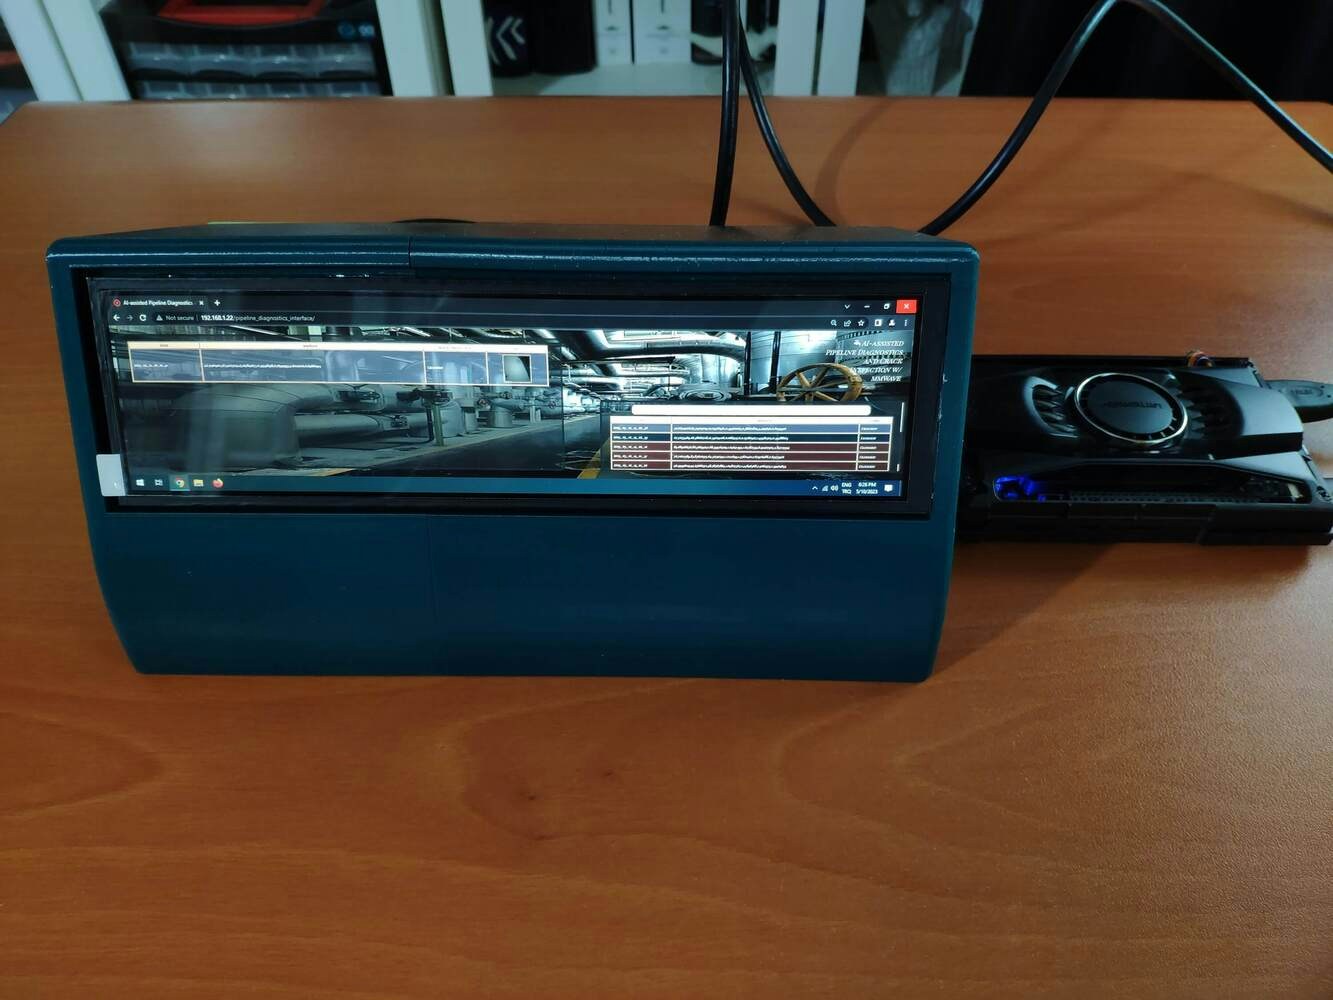
image
image
image
image
image
image
image
image
image
Step 3.3: Generating data samples and displaying real-time model detection results transferred by Nicla Vision
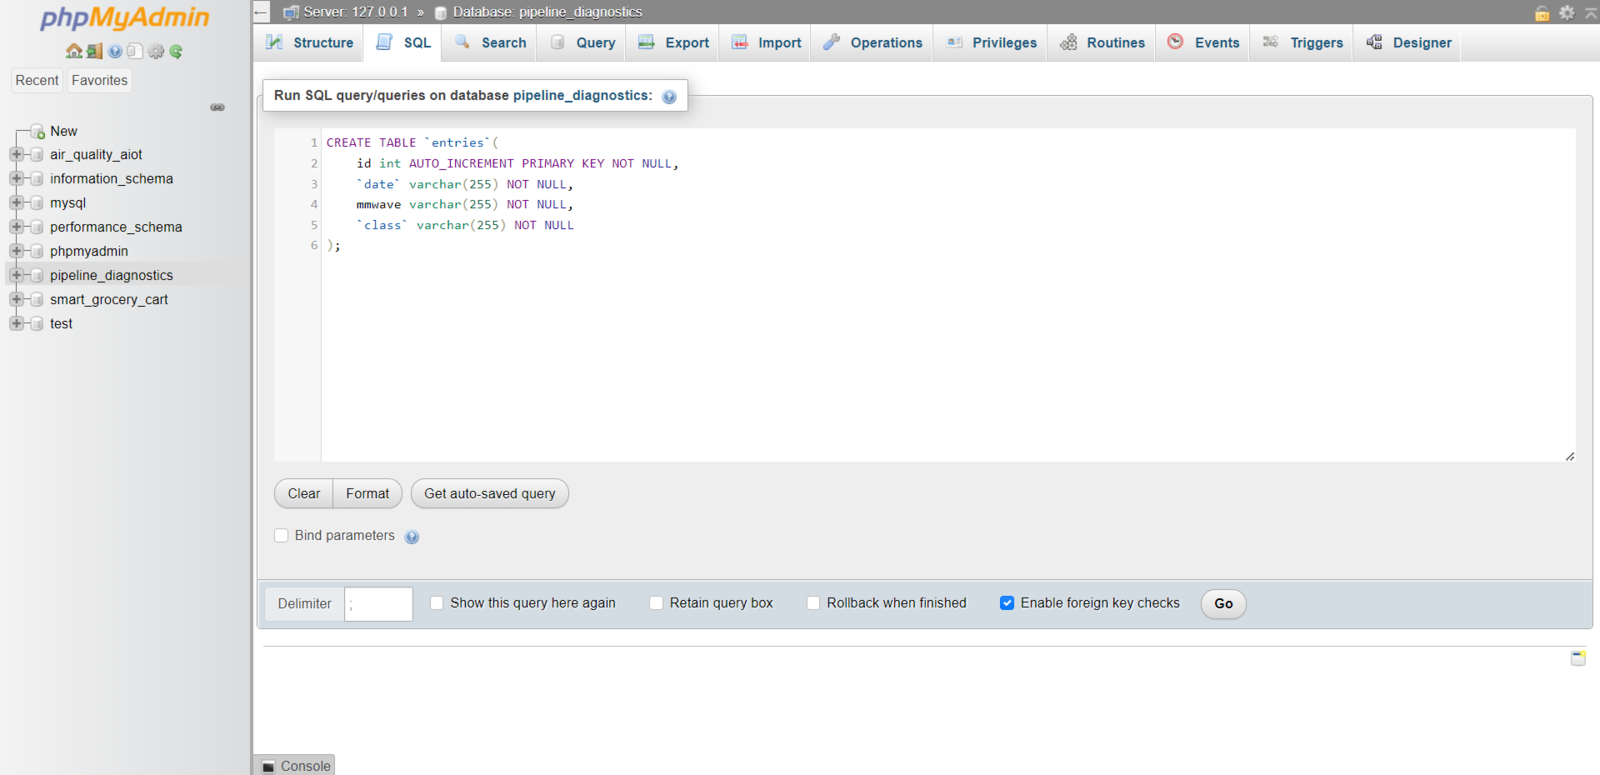
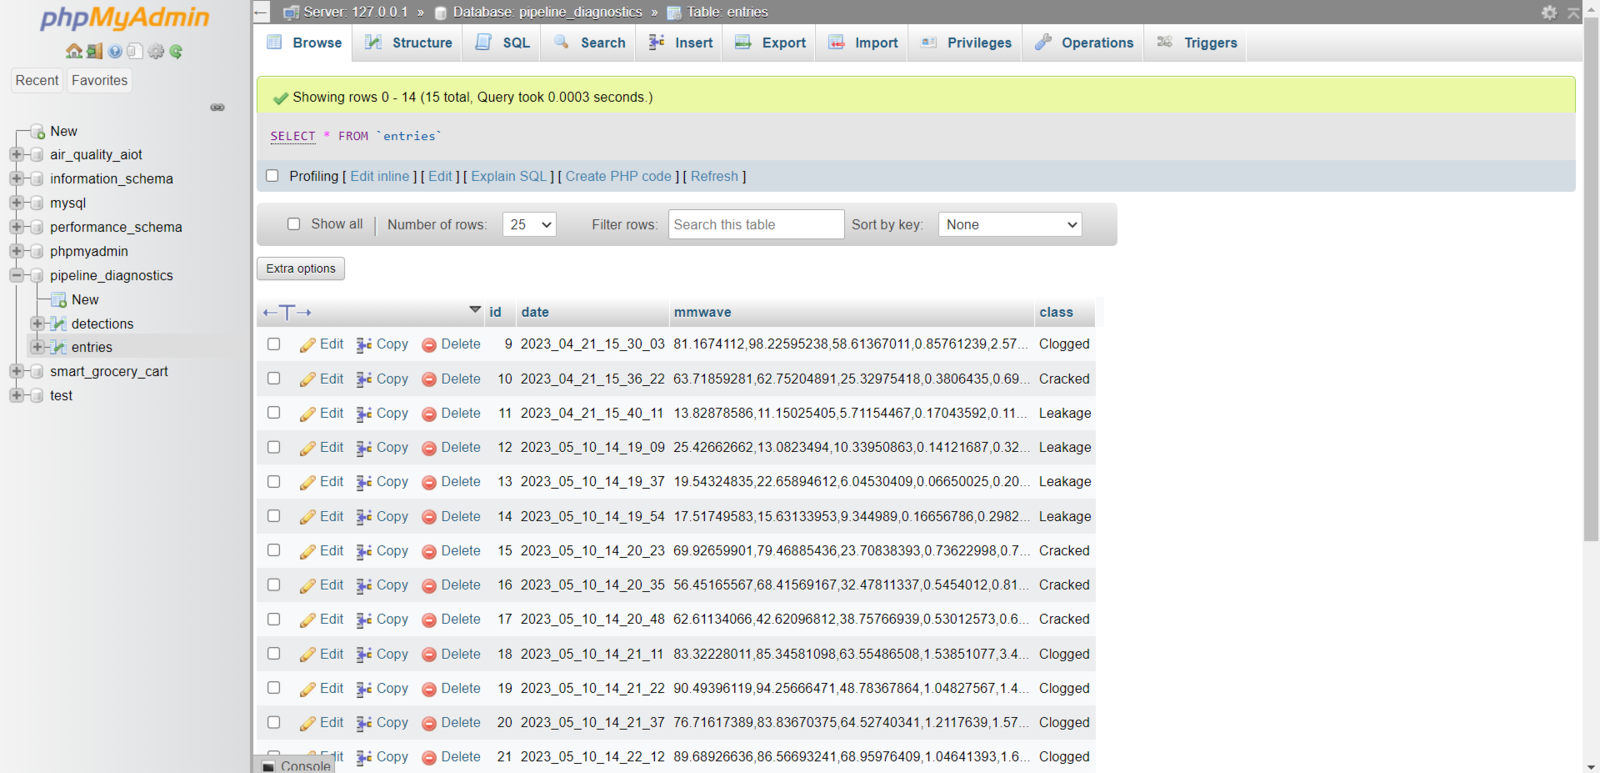
After setting the web application on LattePanda 3 Delta 864: 🚿🔎📲 The web application (update_server.php) saves the mmWave data parameters with the selected class transferred by Nicla Vision via an HTTP GET request to the entries MySQL database table. /pipeline_diagnostics_interface/update_server.php?data=OK&mmWave=32.06314106,65.51403019,27.04366461,0.59400105,0.58607824,5.429632,0.81743312&class=Cracked
image
- Leakage ➜ Dark Blue
- Cracked ➜ Violet
- Clogged ➜ Red
image
image
image
image
image
image
image
image
image
image
image
Step 4: Setting up Nicla Vision on Arduino IDE
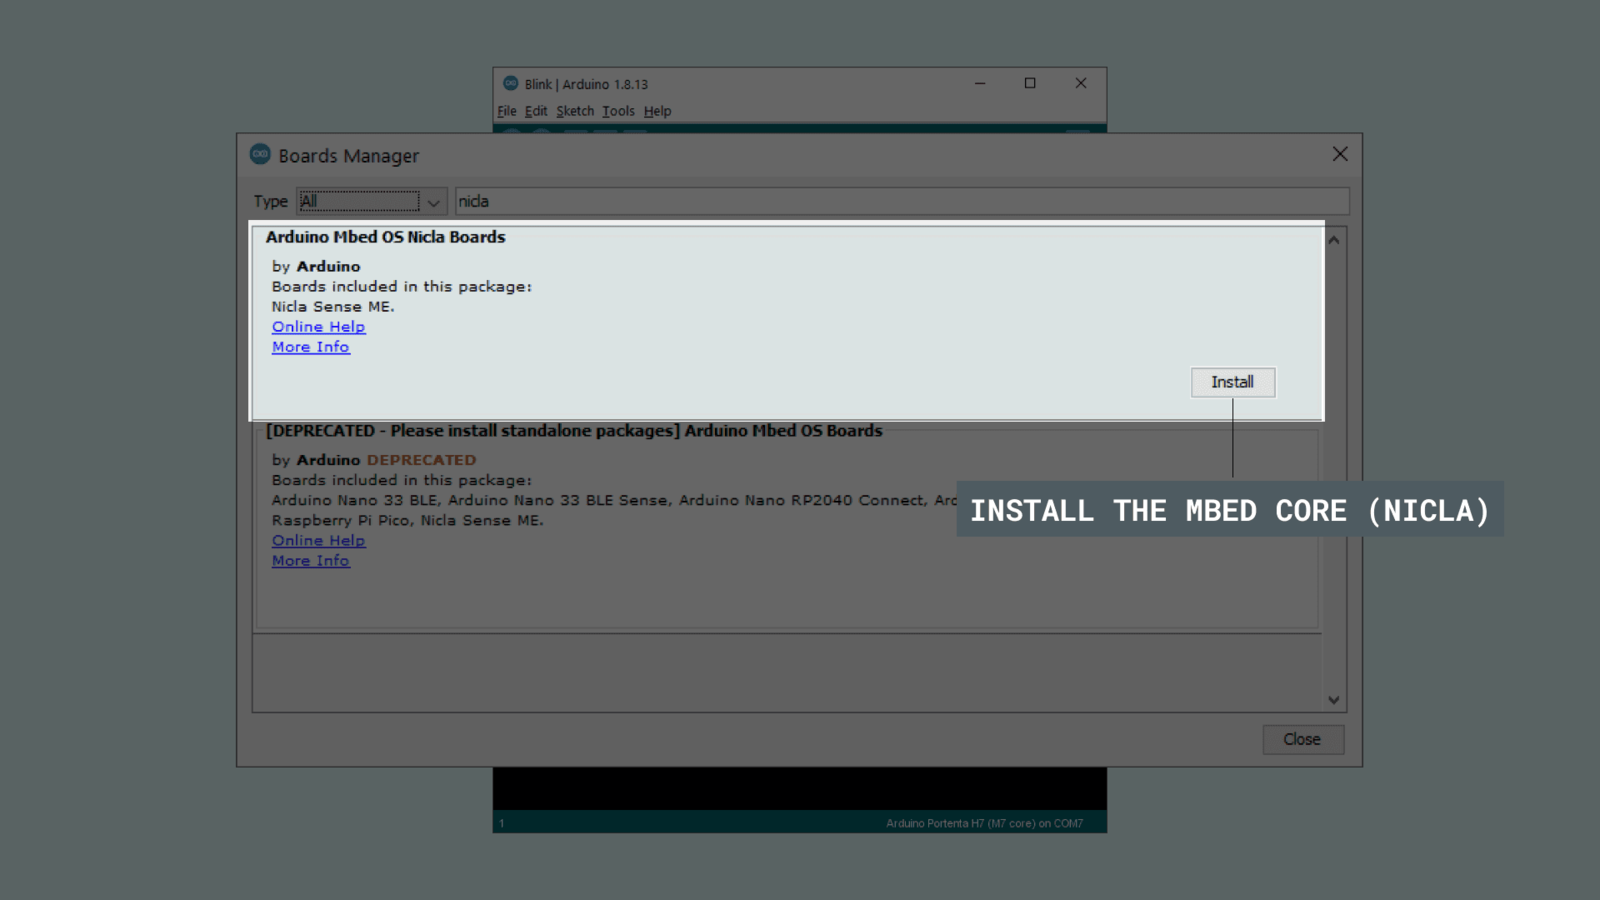
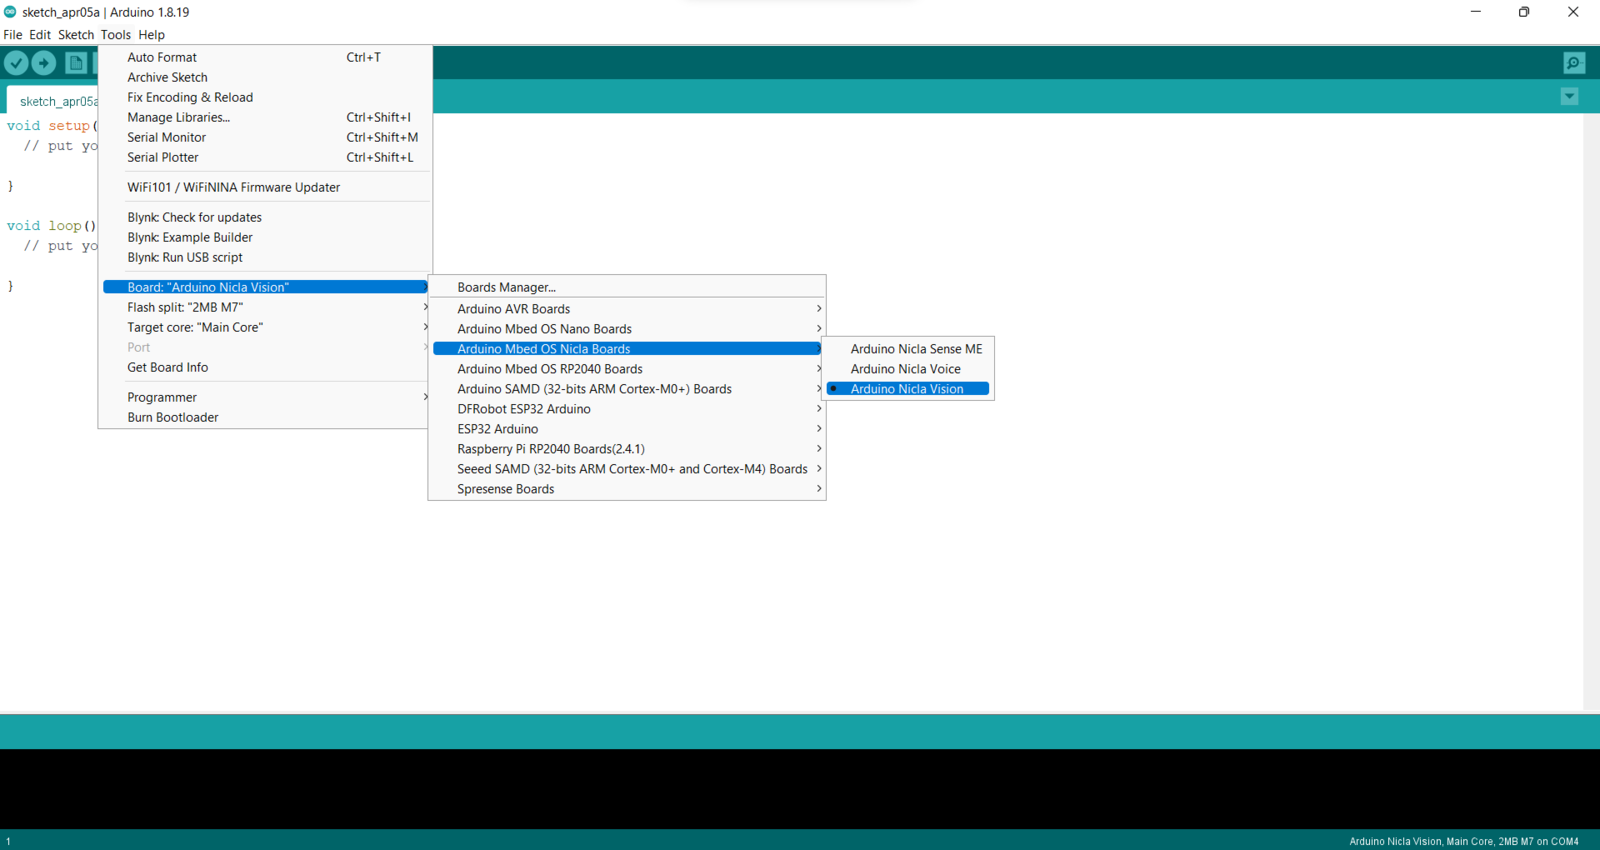
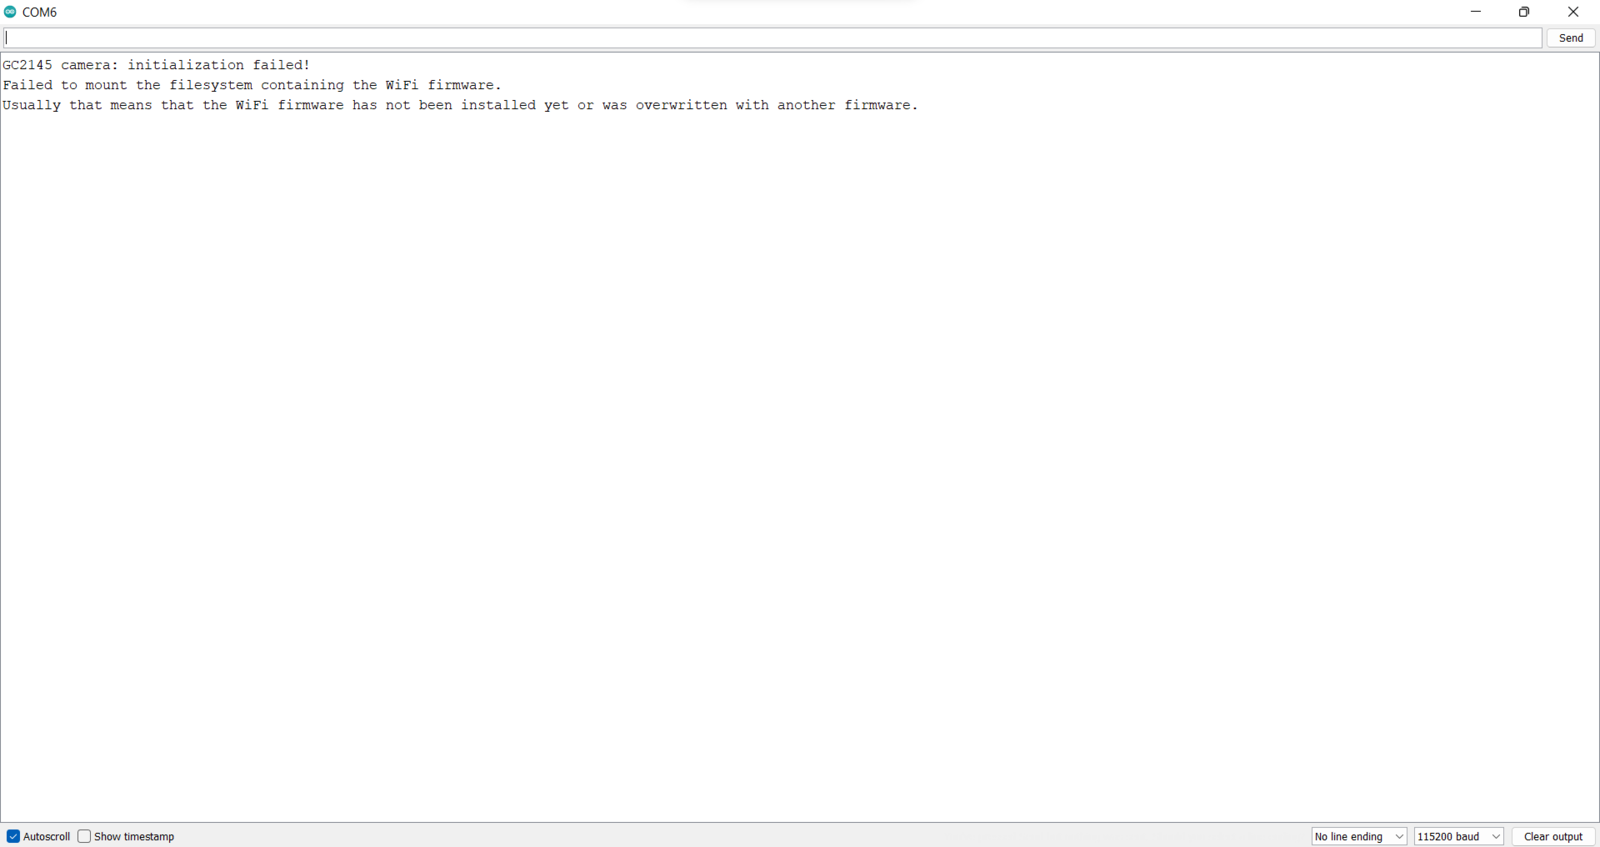
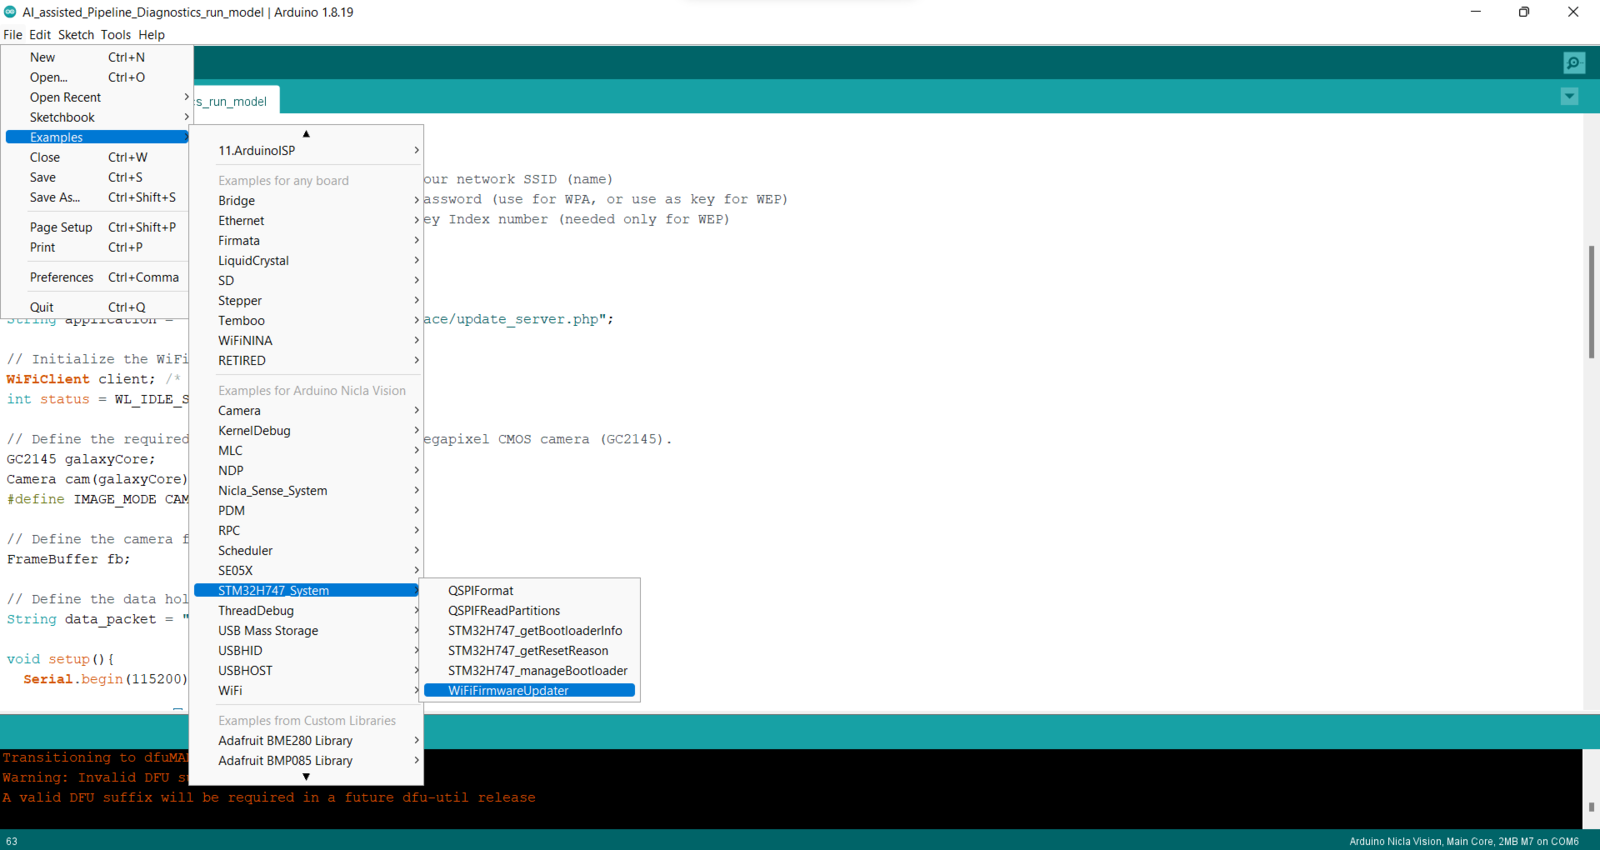
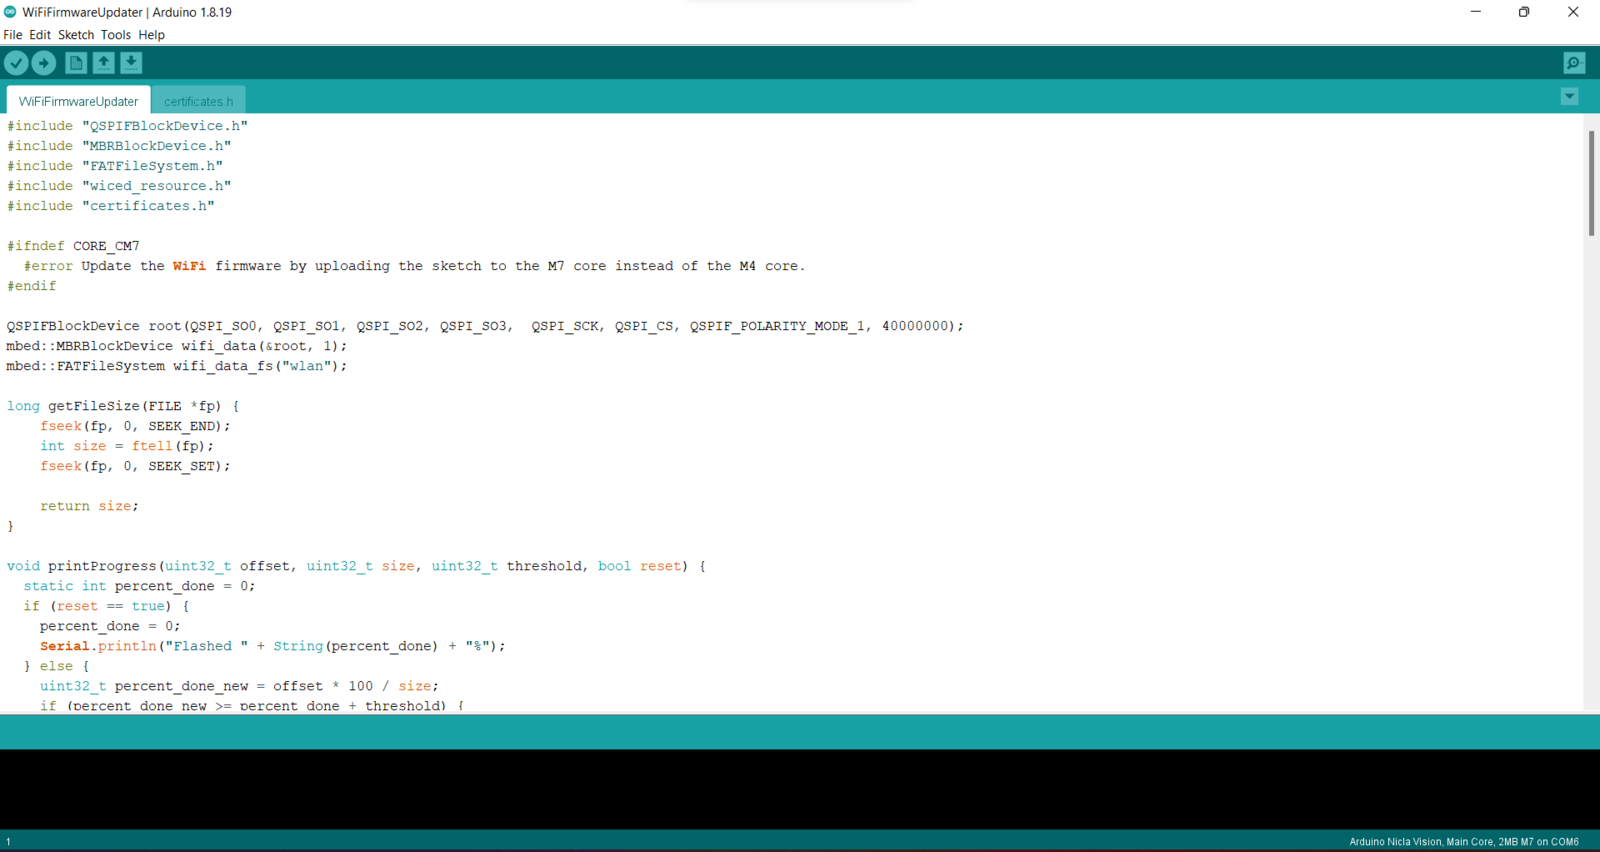
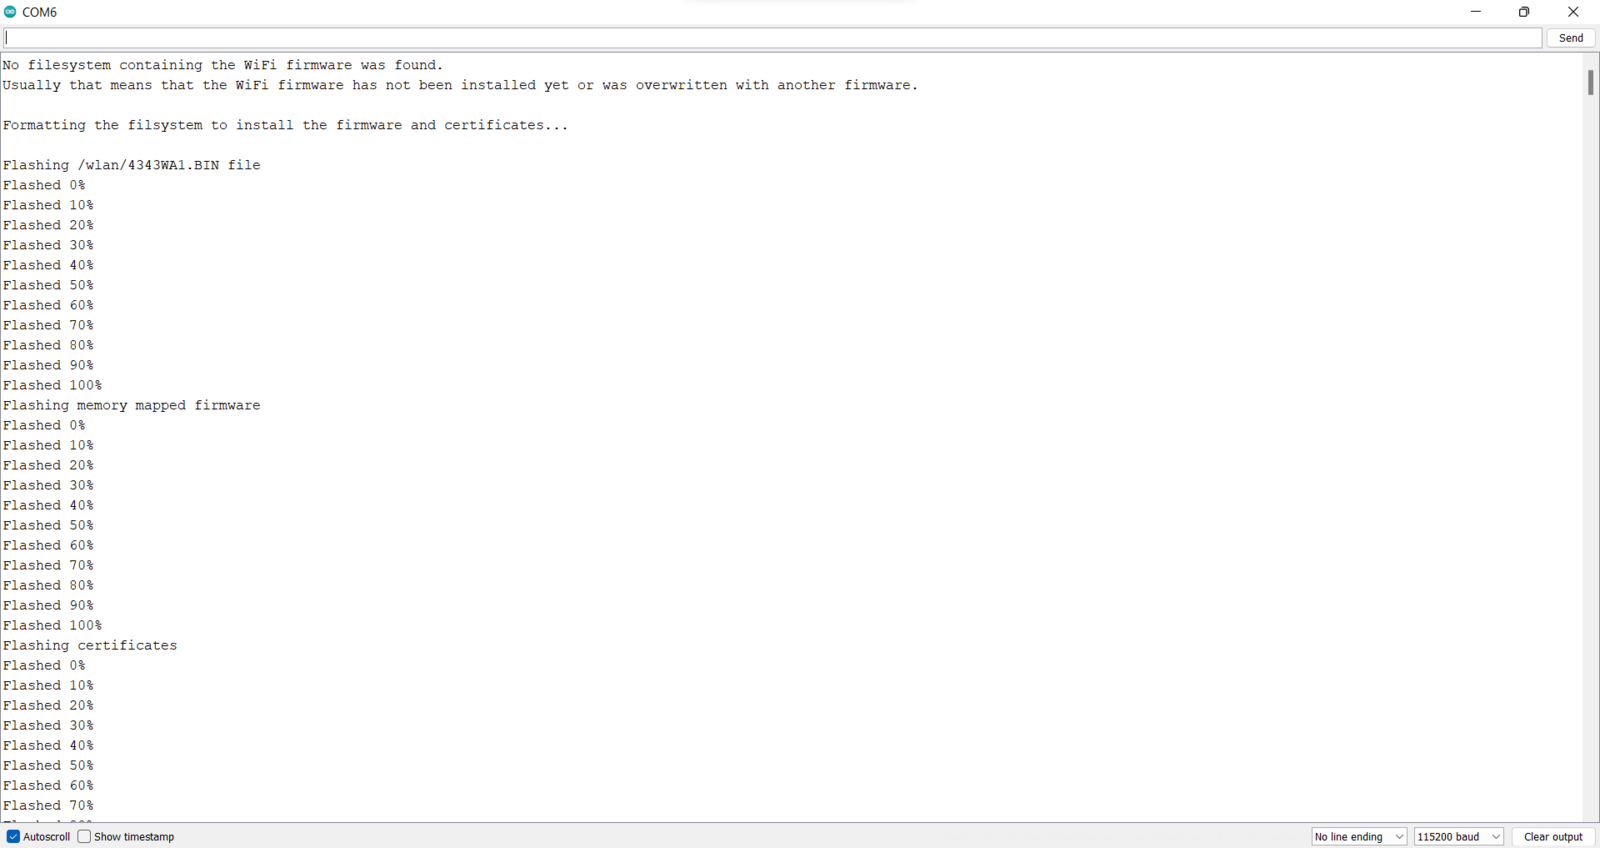
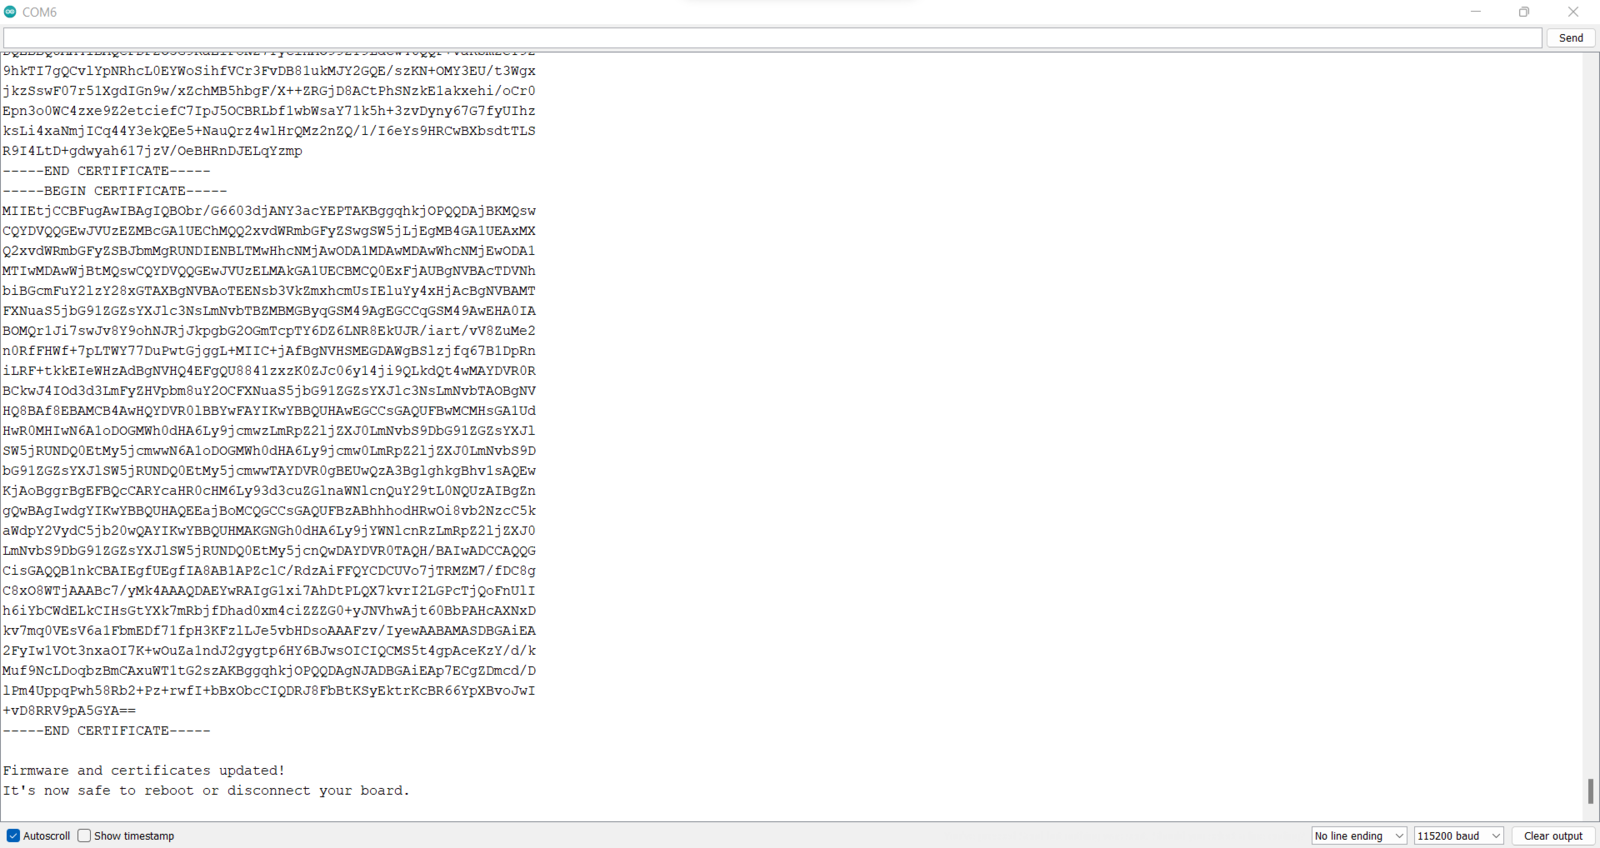
Before proceeding with the following steps, I needed to set up Nicla Vision on the Arduino IDE and install the required libraries for this project. Although Arduino provides an official board package and libraries for Nicla Vision, the Wi-Fi firmware is not installed out of the box. Therefore, I had to install the Wi-Fi firmware manually to utilize the built-in Wi-Fi module. :hash: To install the required core for Nicla boards, navigate to Tools ➡ Board ➡ Boards Manager and search for Arduino Mbed OS Nicla Boards.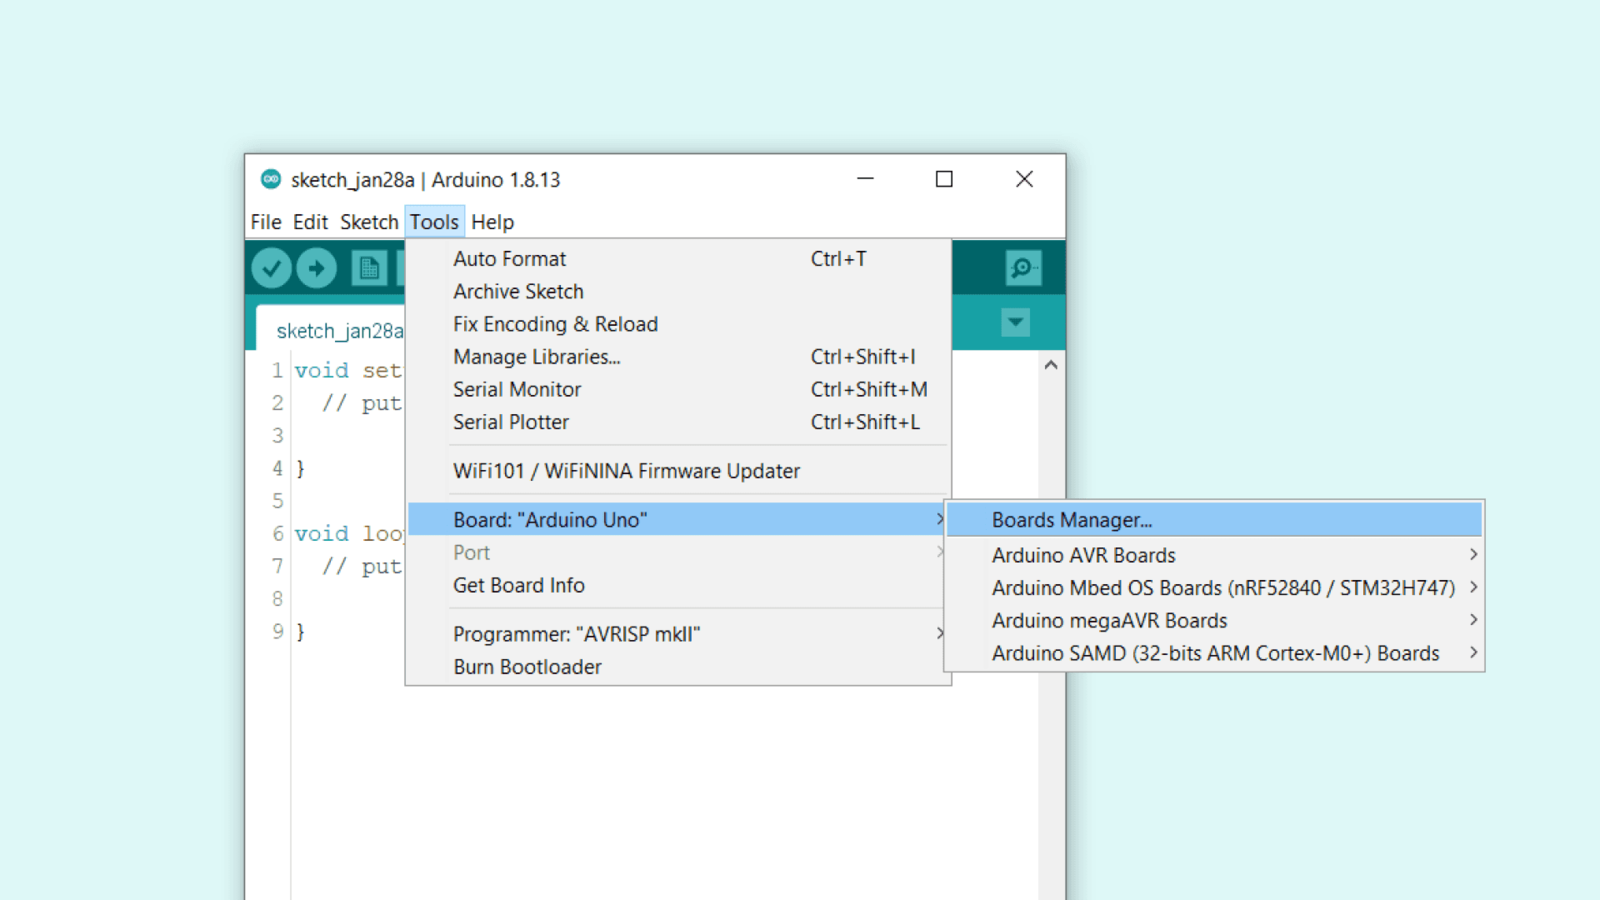
image
image
image
image
image
image
image
image
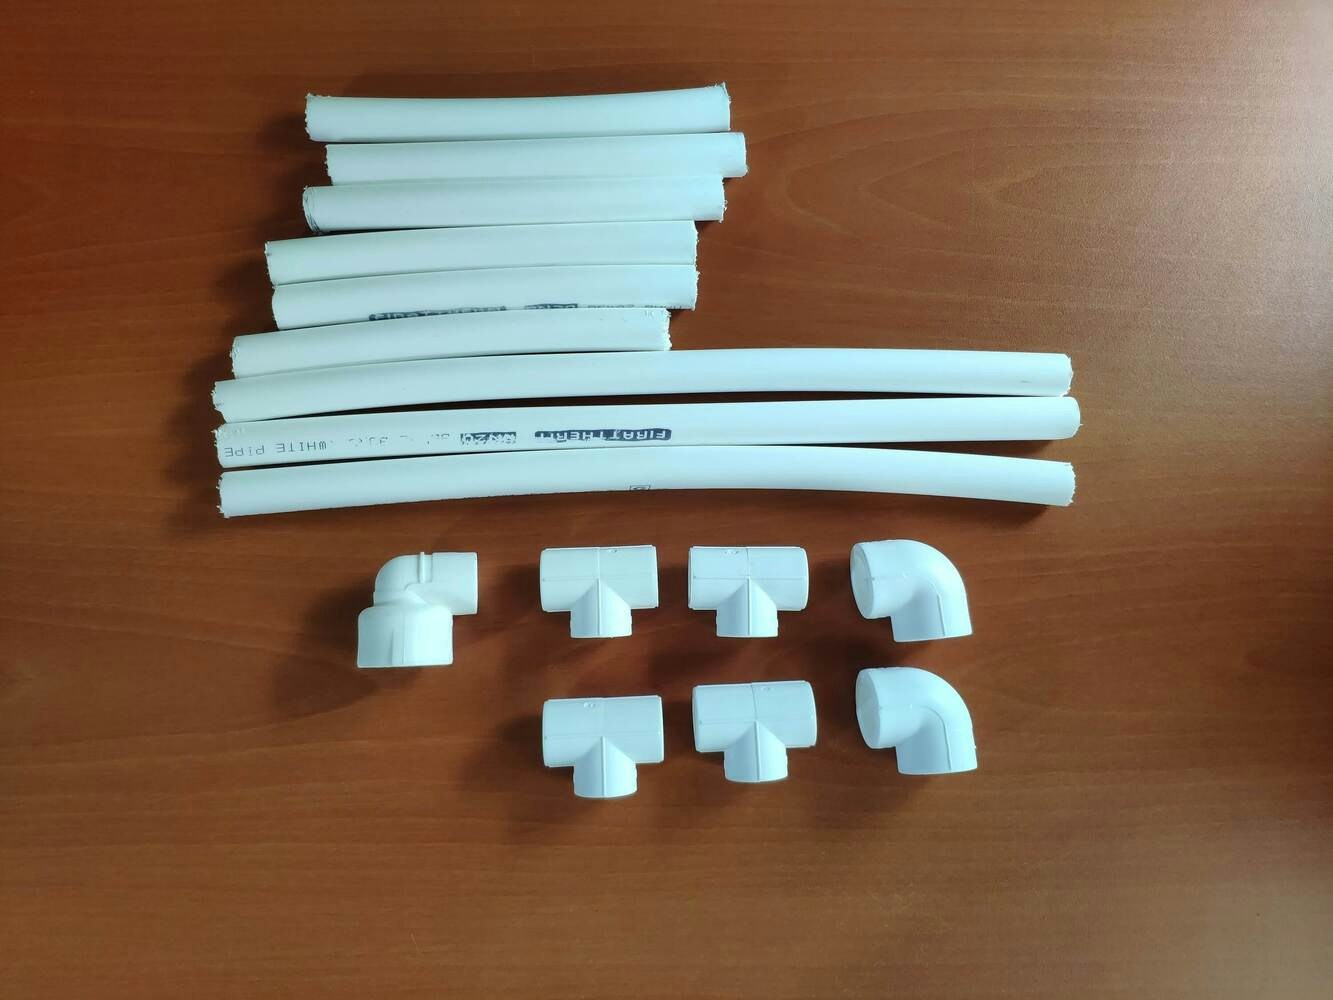
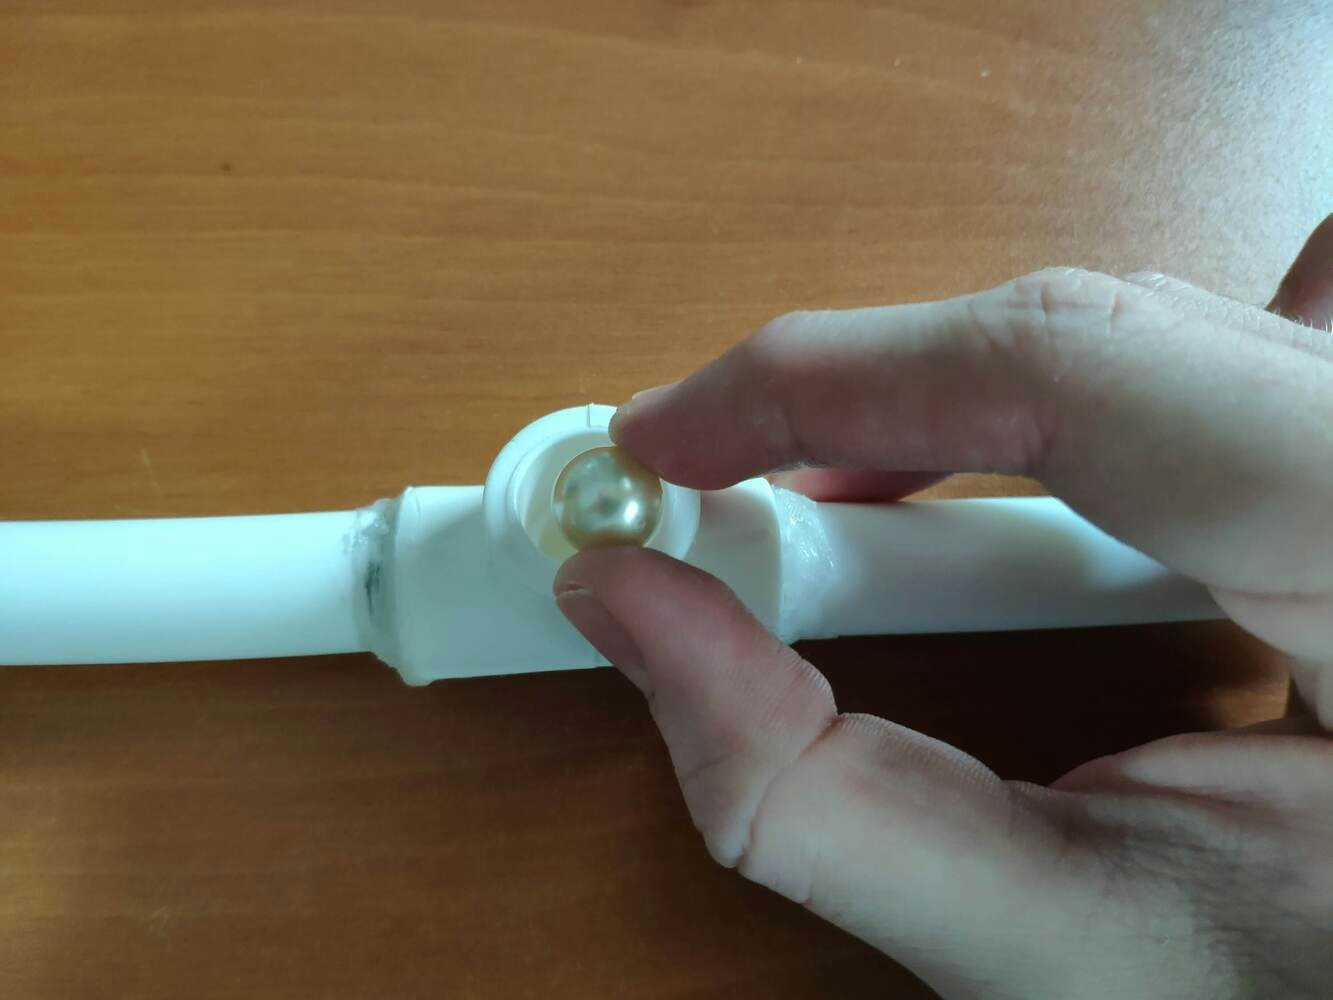
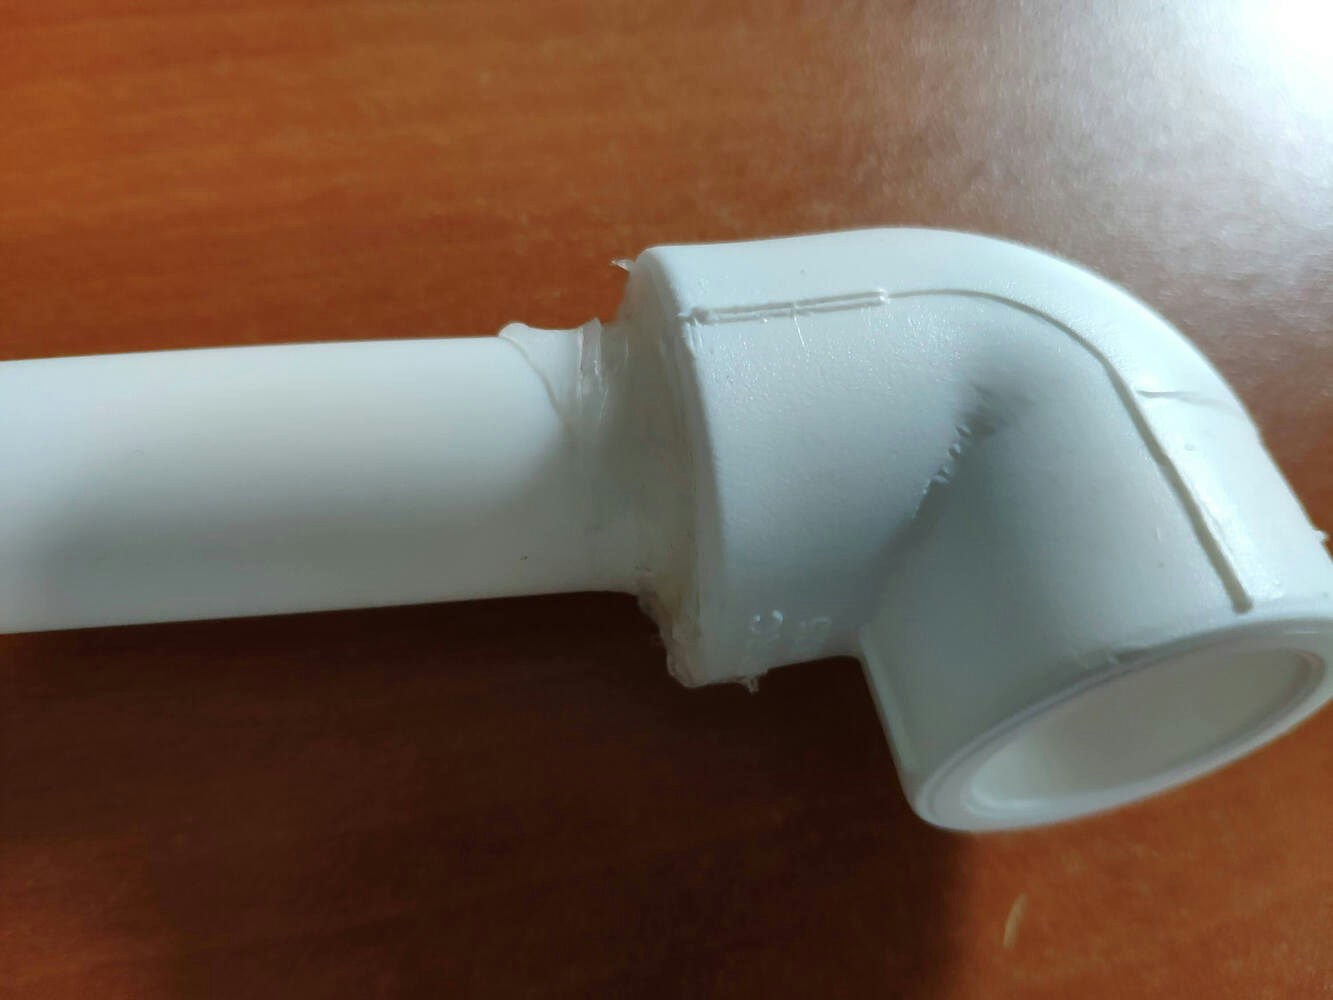
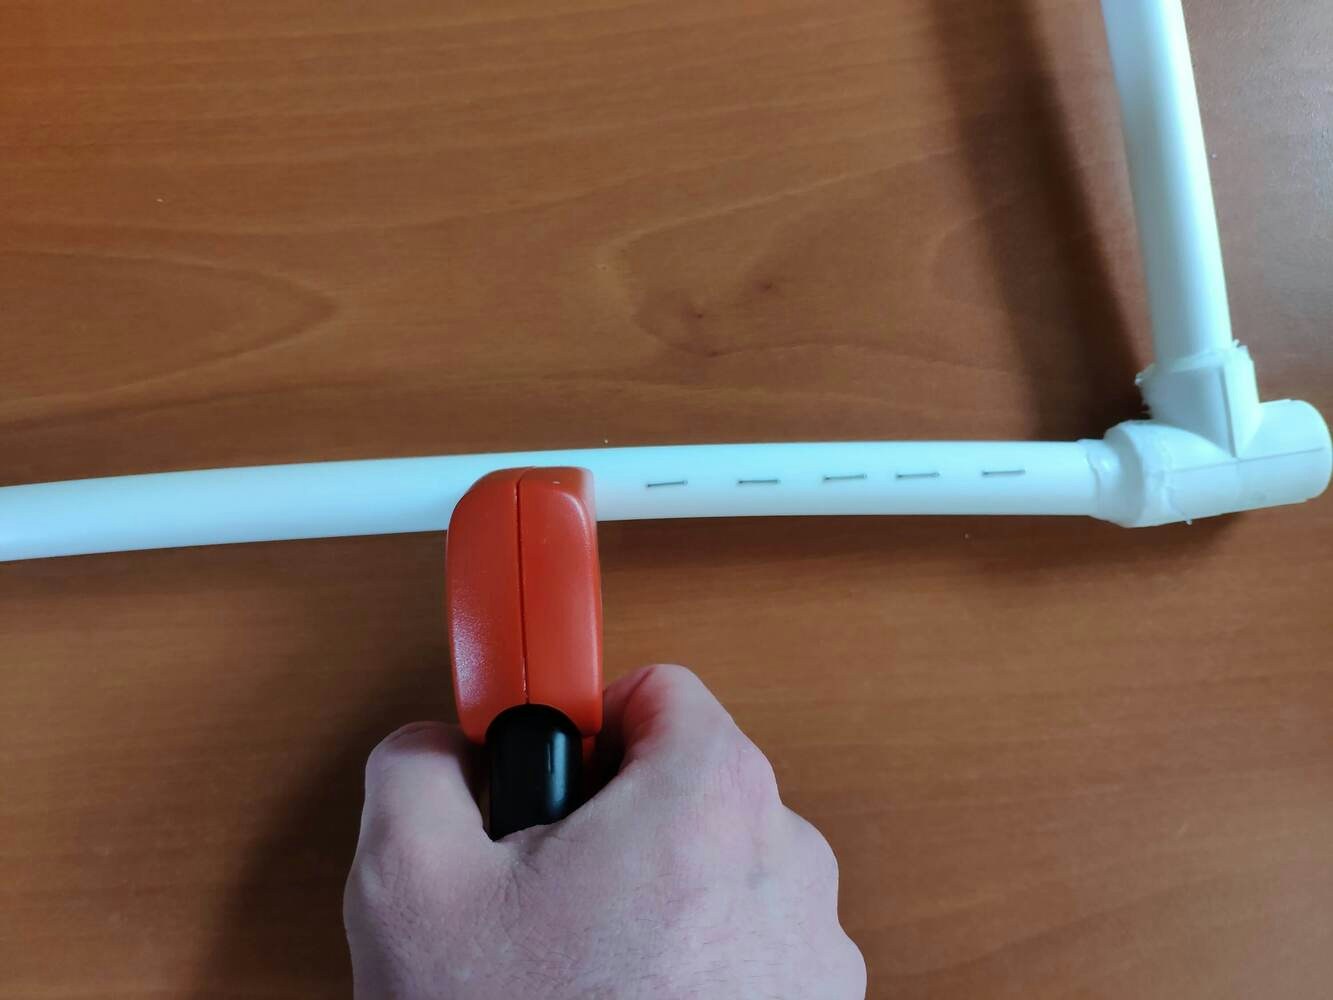
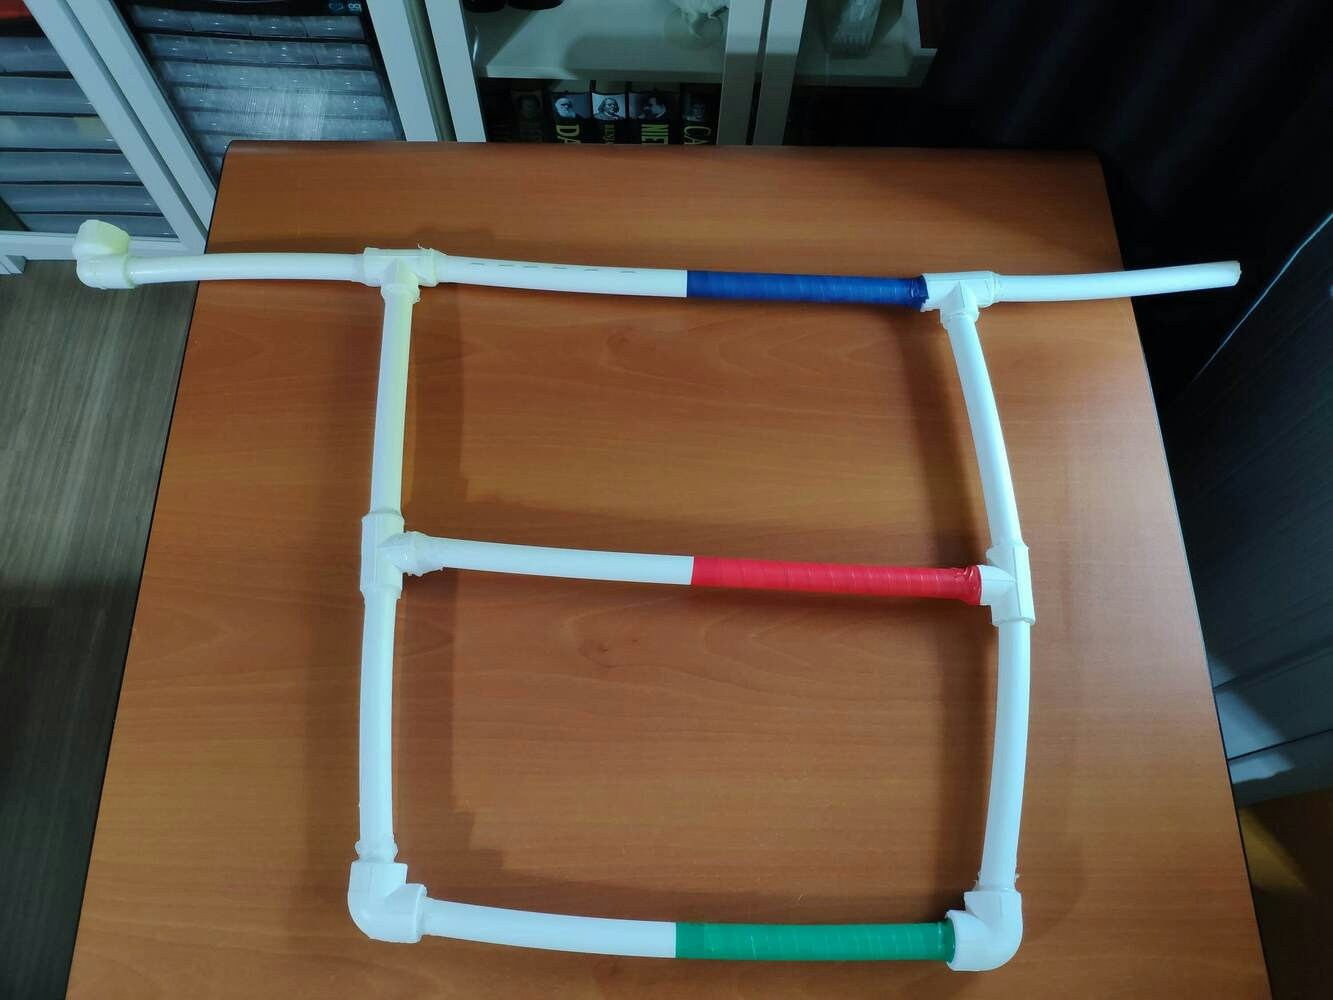
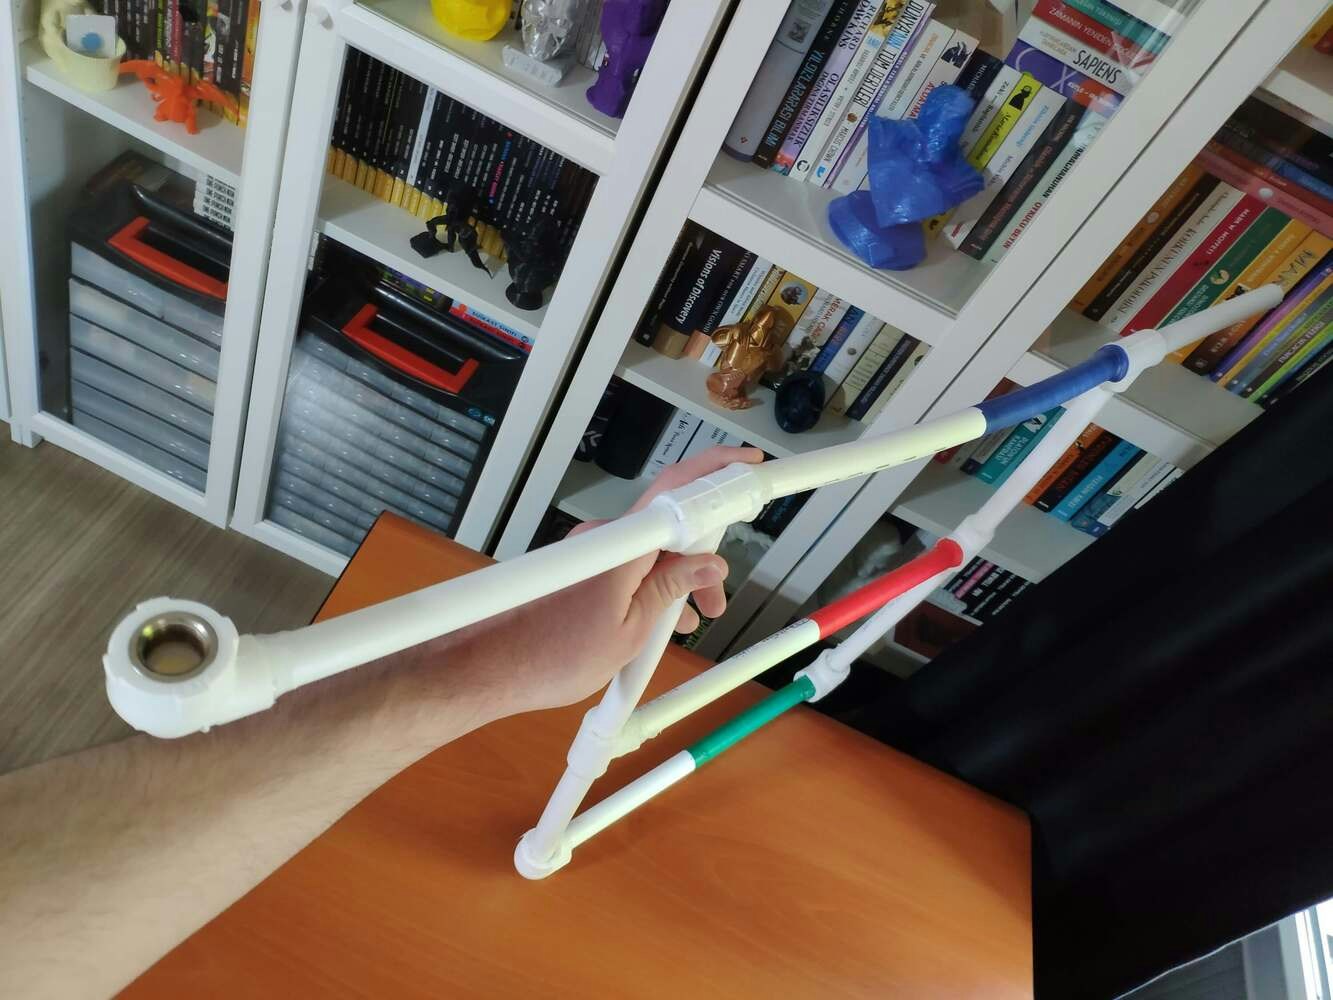
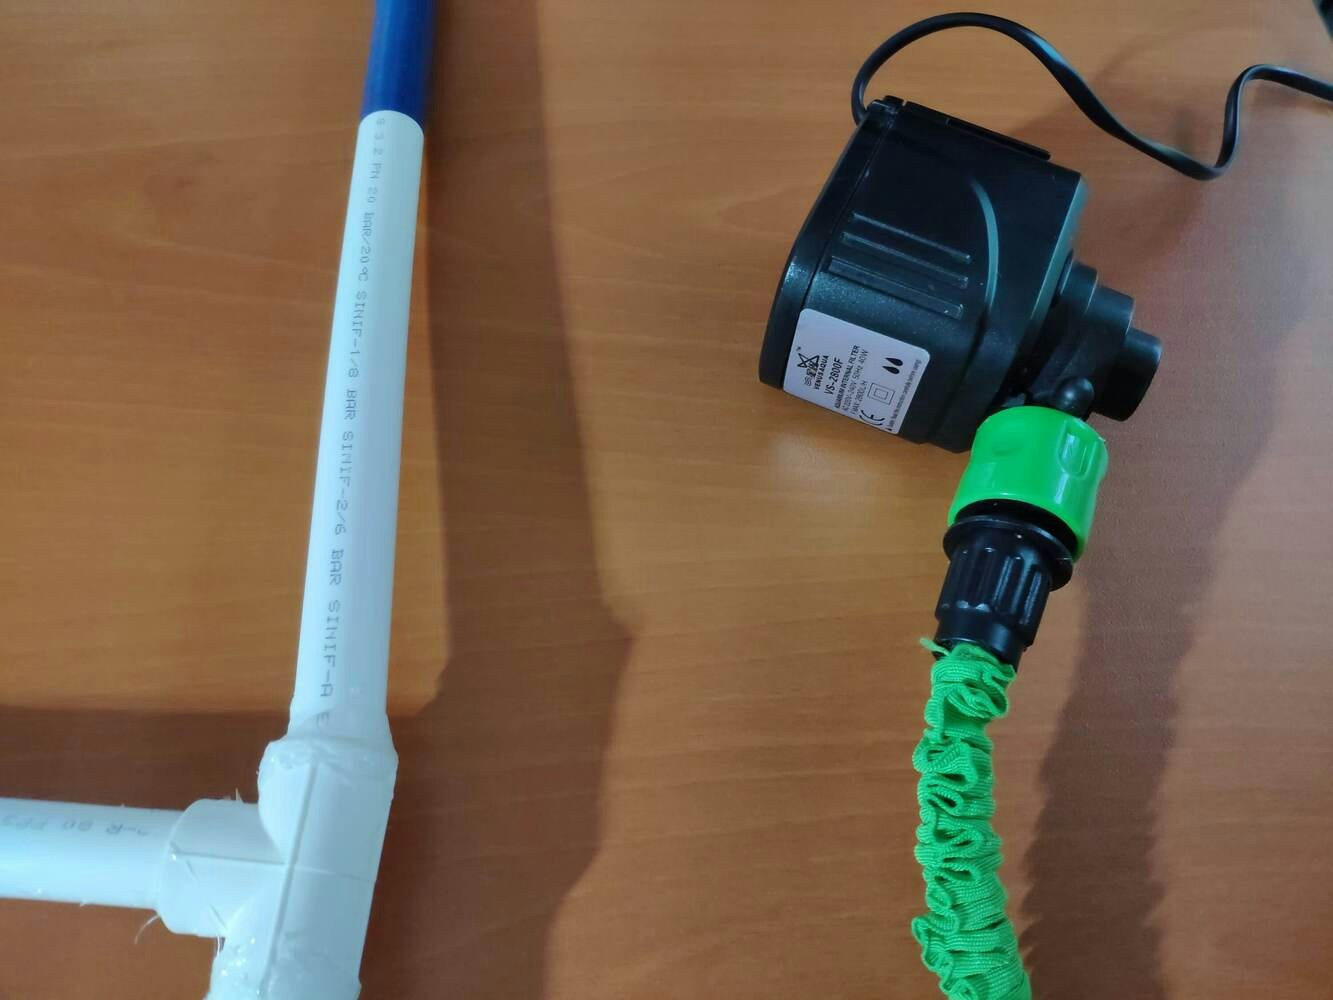
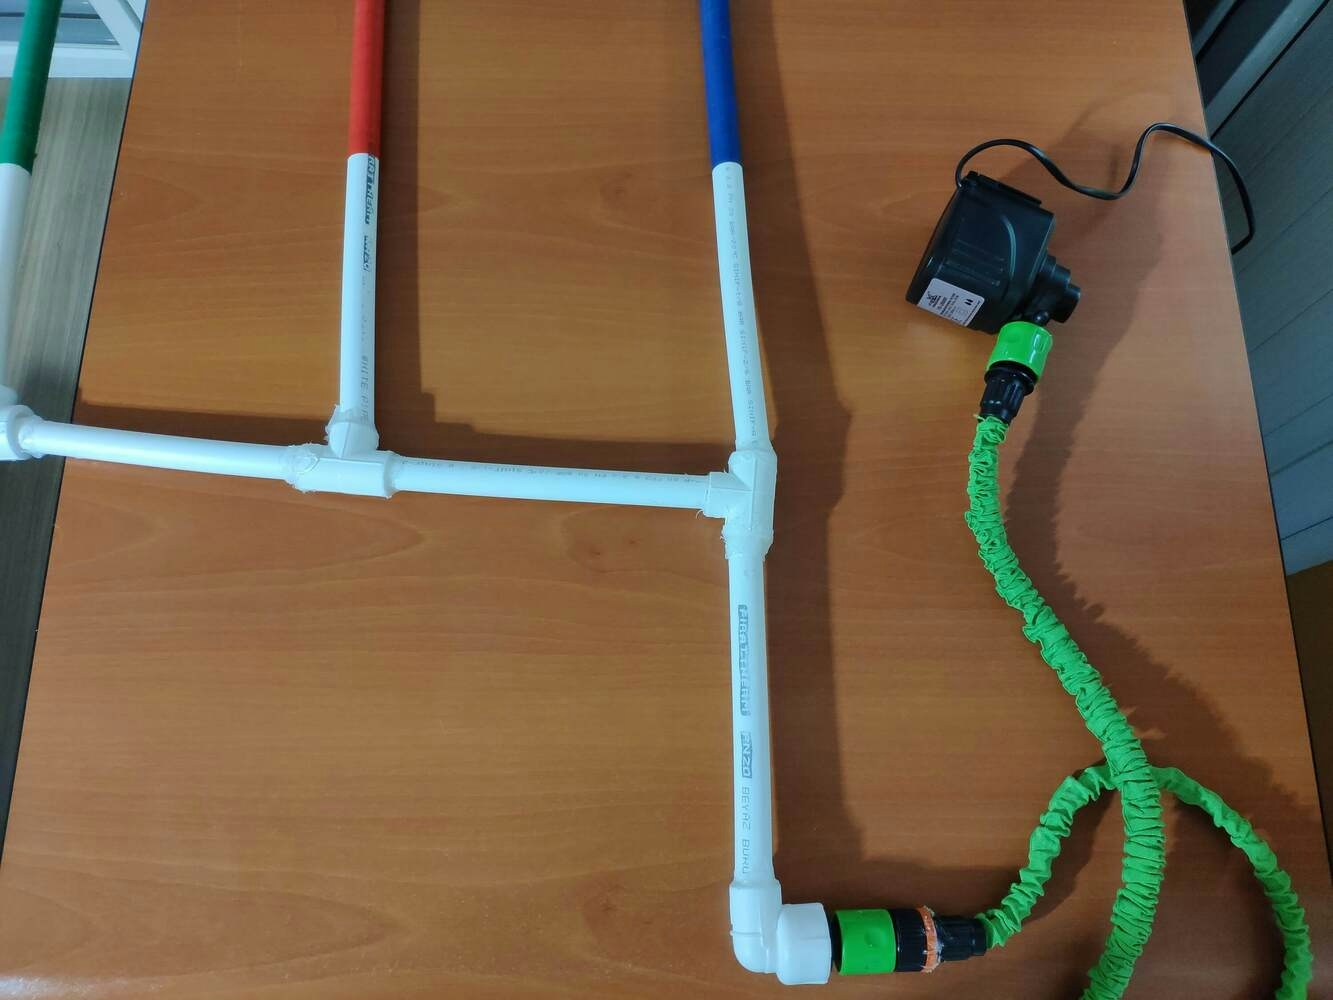
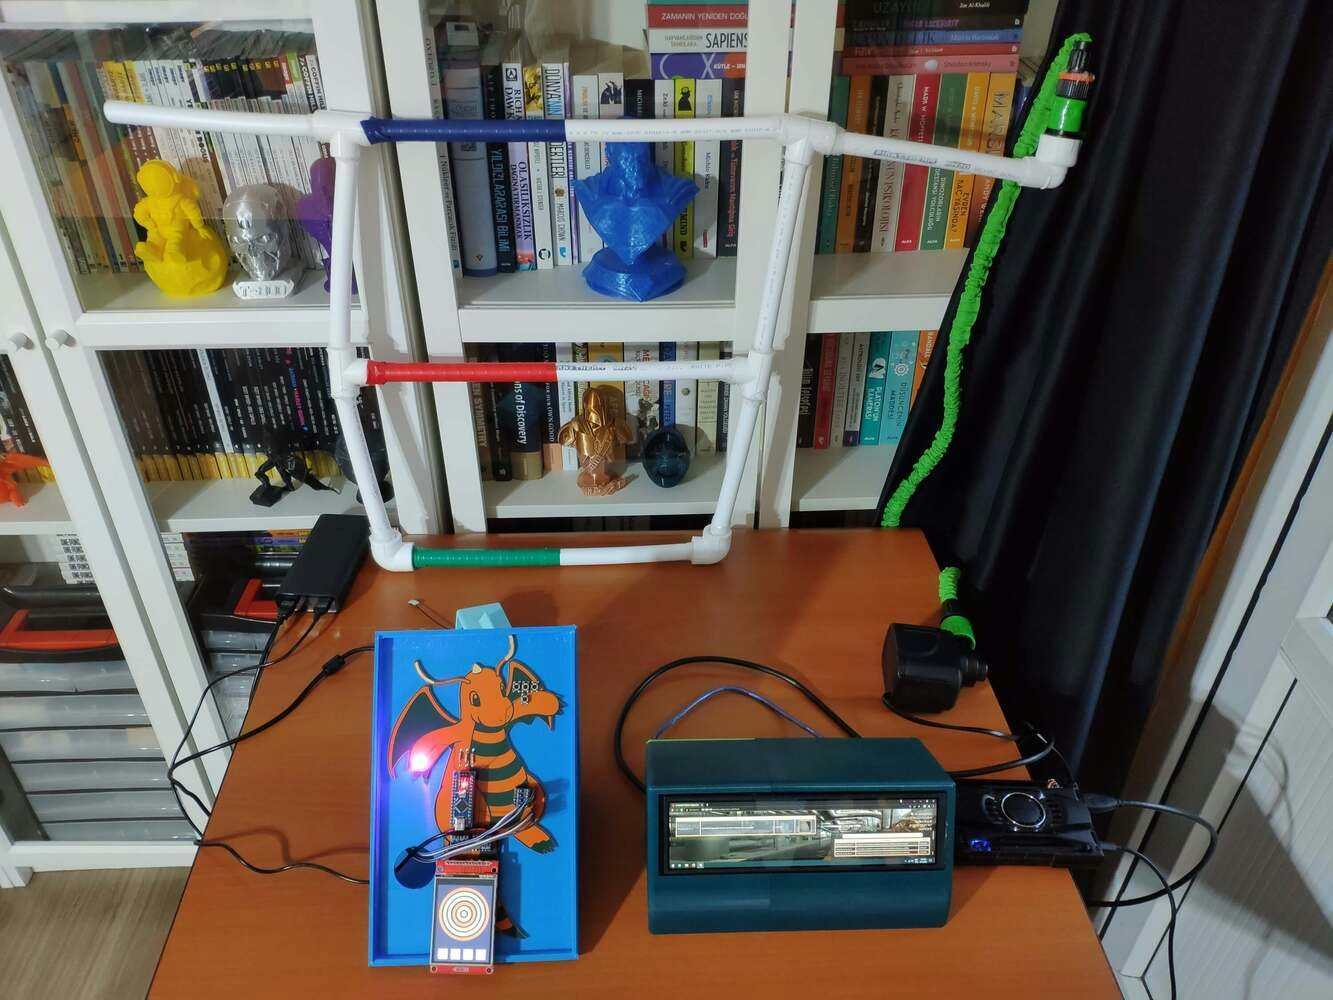
Step 5.0: Building a basic pipeline system demonstrating different defects
To diagnose different pipeline defects, I needed to collect accurate vibration measurements from a pipeline system so as to train my neural network model with notable validity. Therefore, I decided to build a simple pipeline system by utilizing pipes and fittings (adapters) with mediocre thermal conductivity, demonstrating three different pipeline defects in each primary section — color-coded:- Blue Section ➡ Cracked
- Red Section➡ Clogged
- Green Section ➡ Leakage
image
image
image
image
image
image
image
image
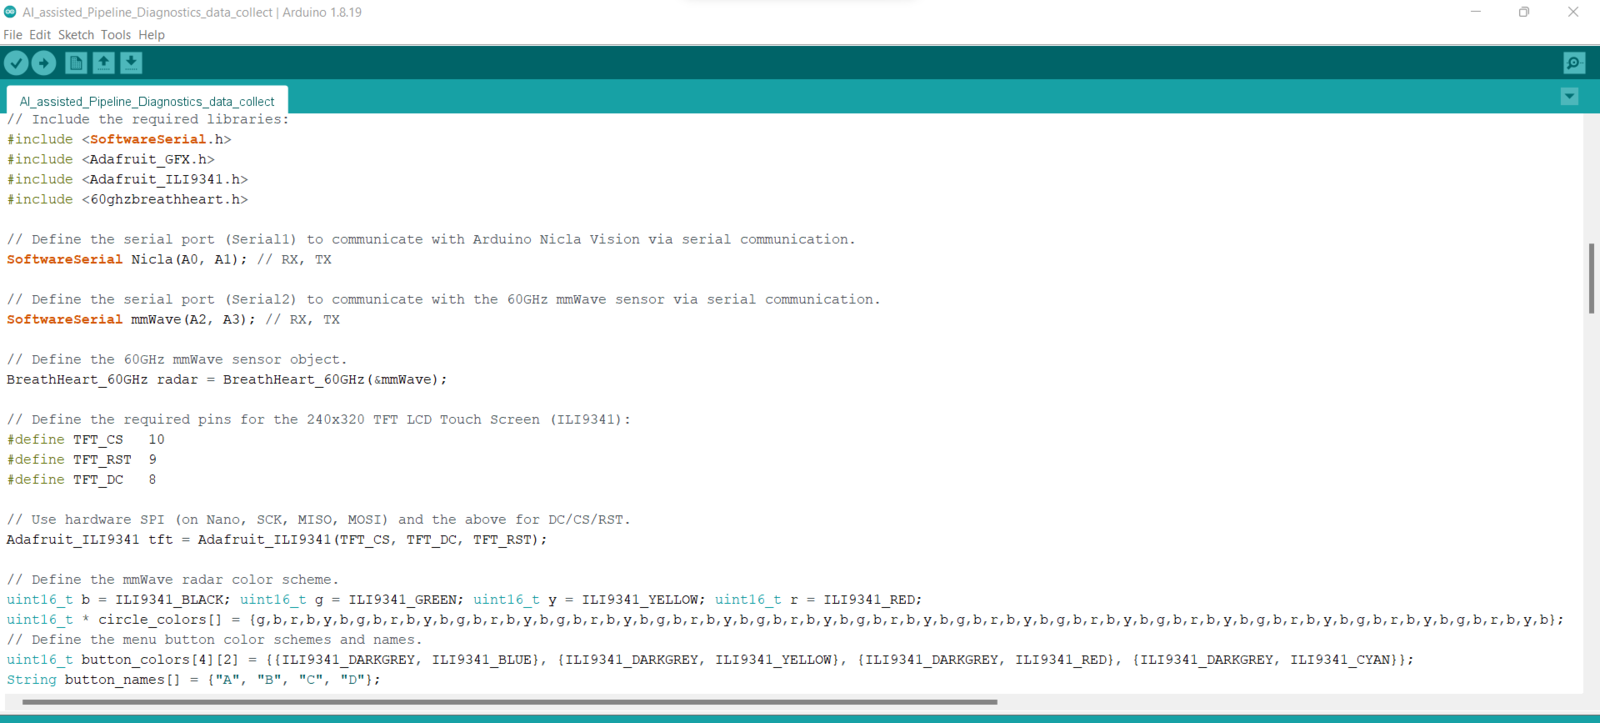
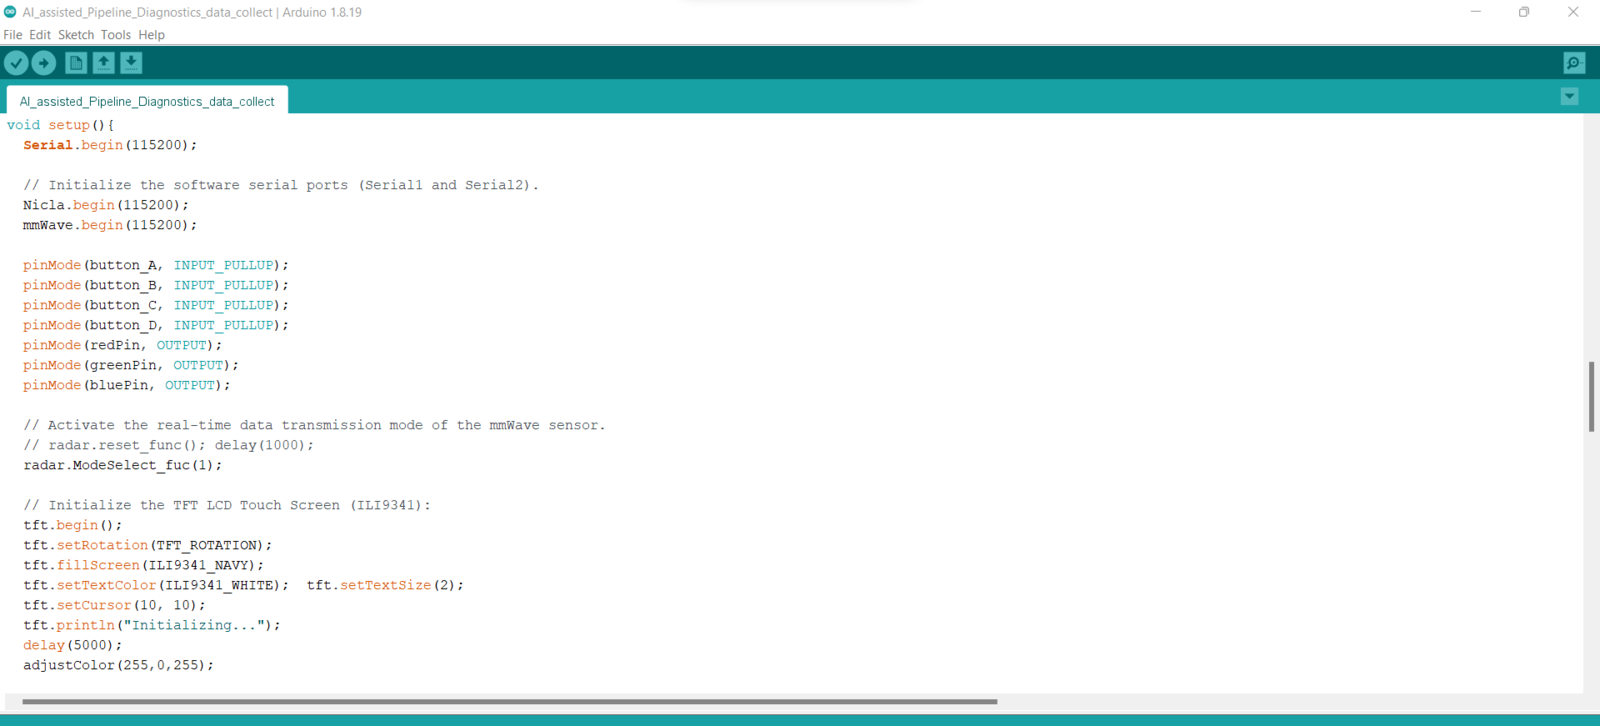
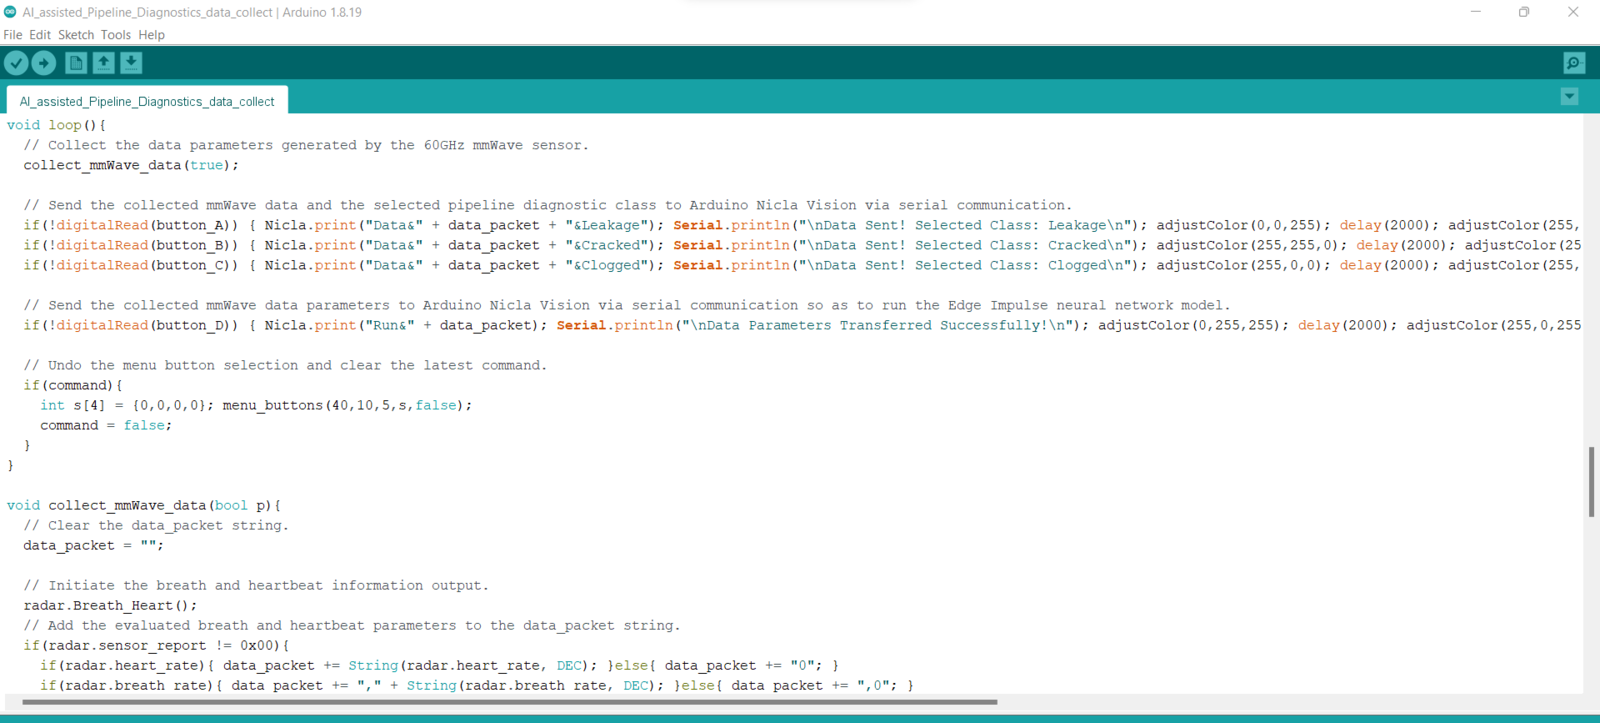
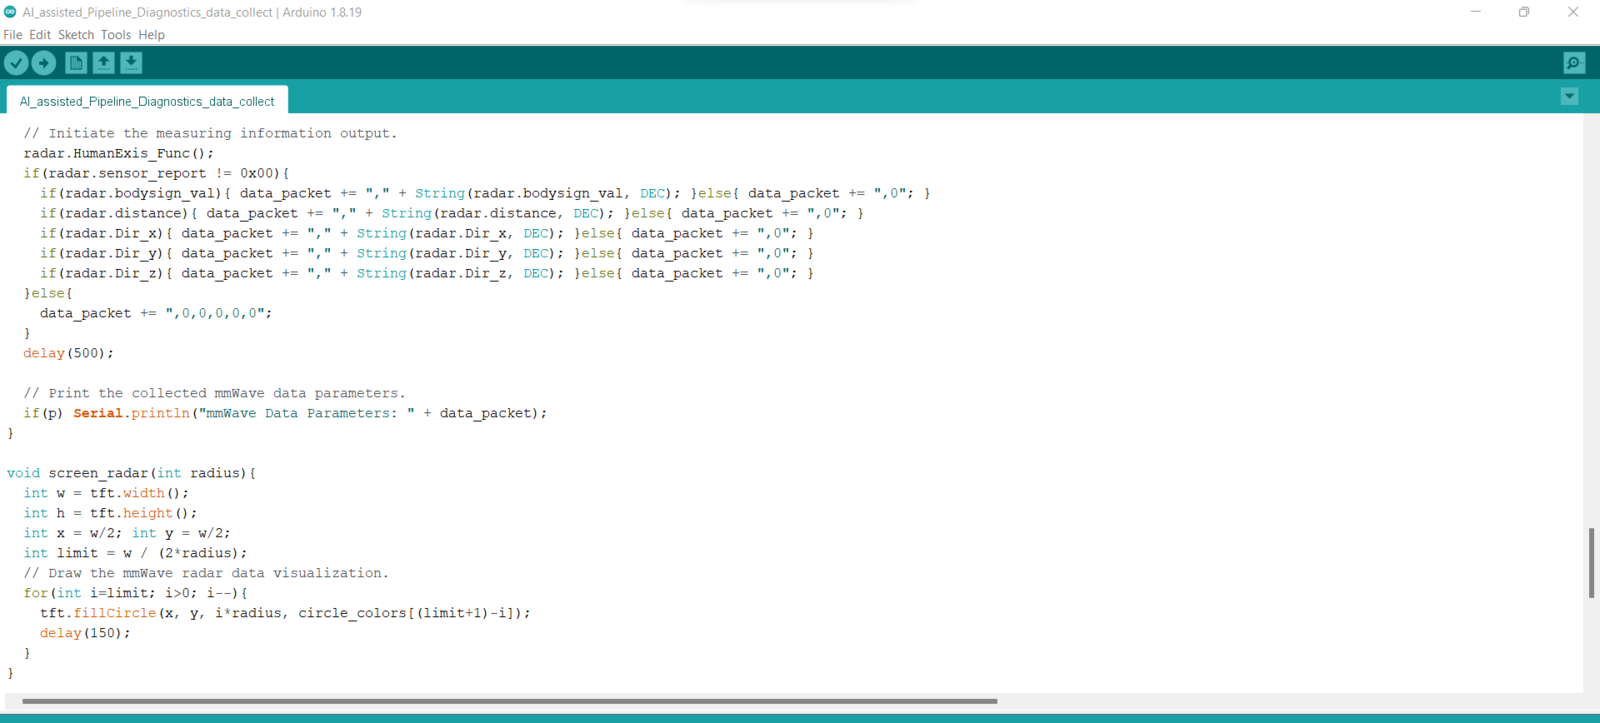
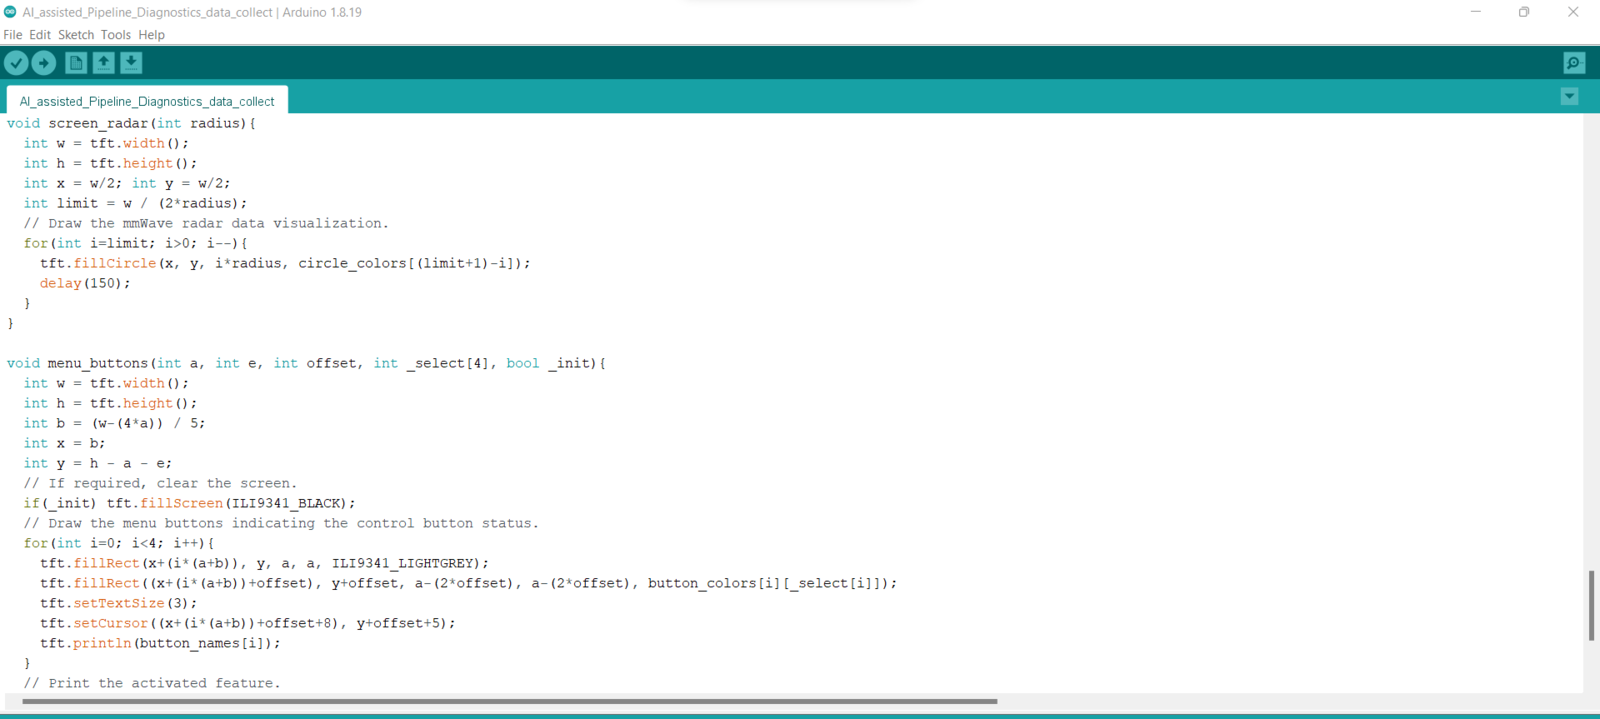
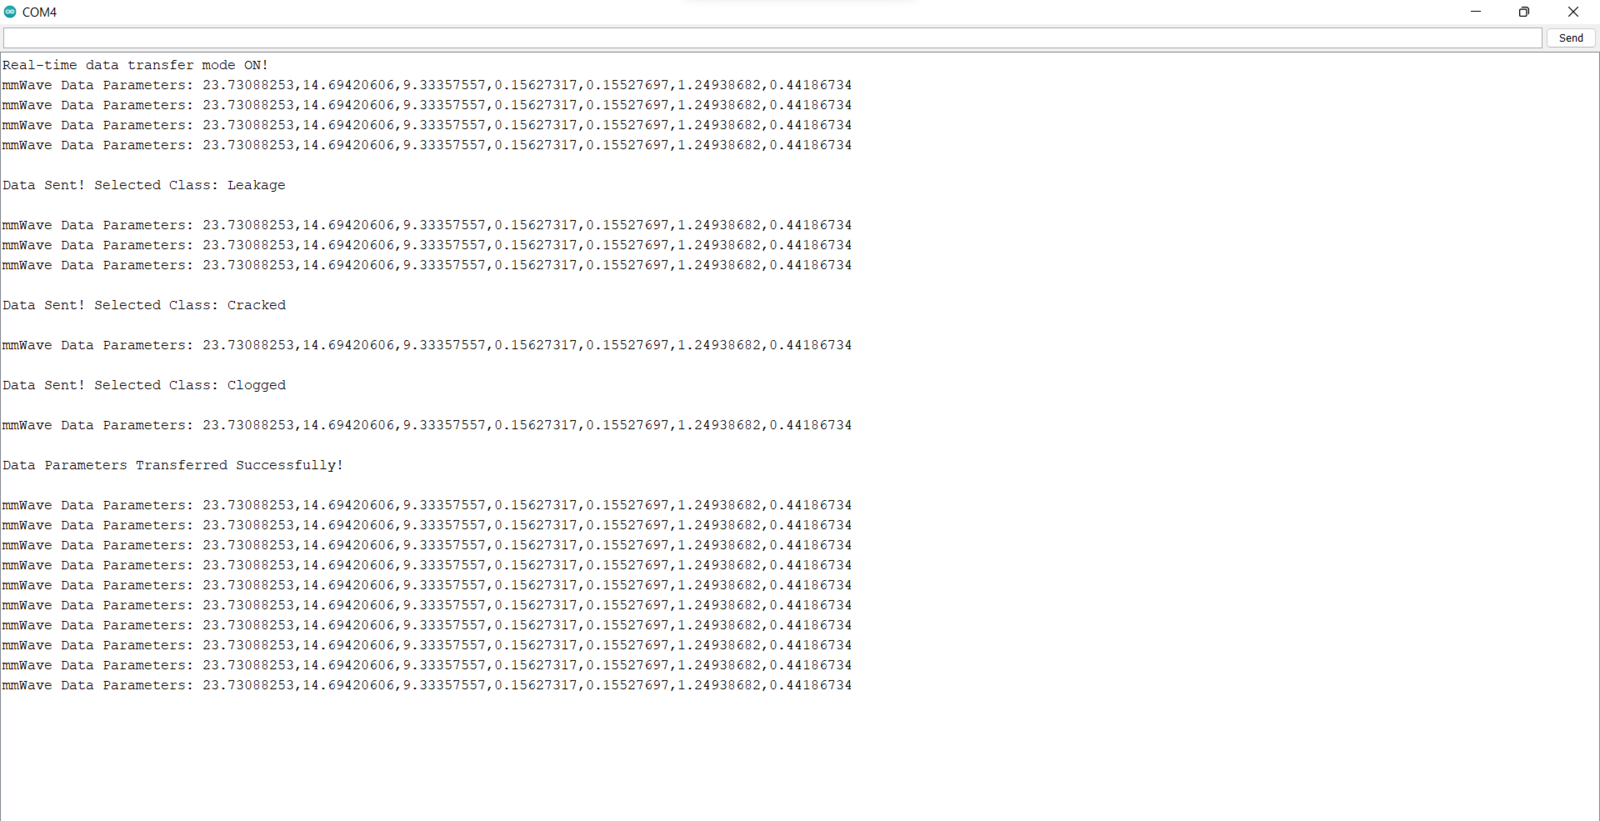
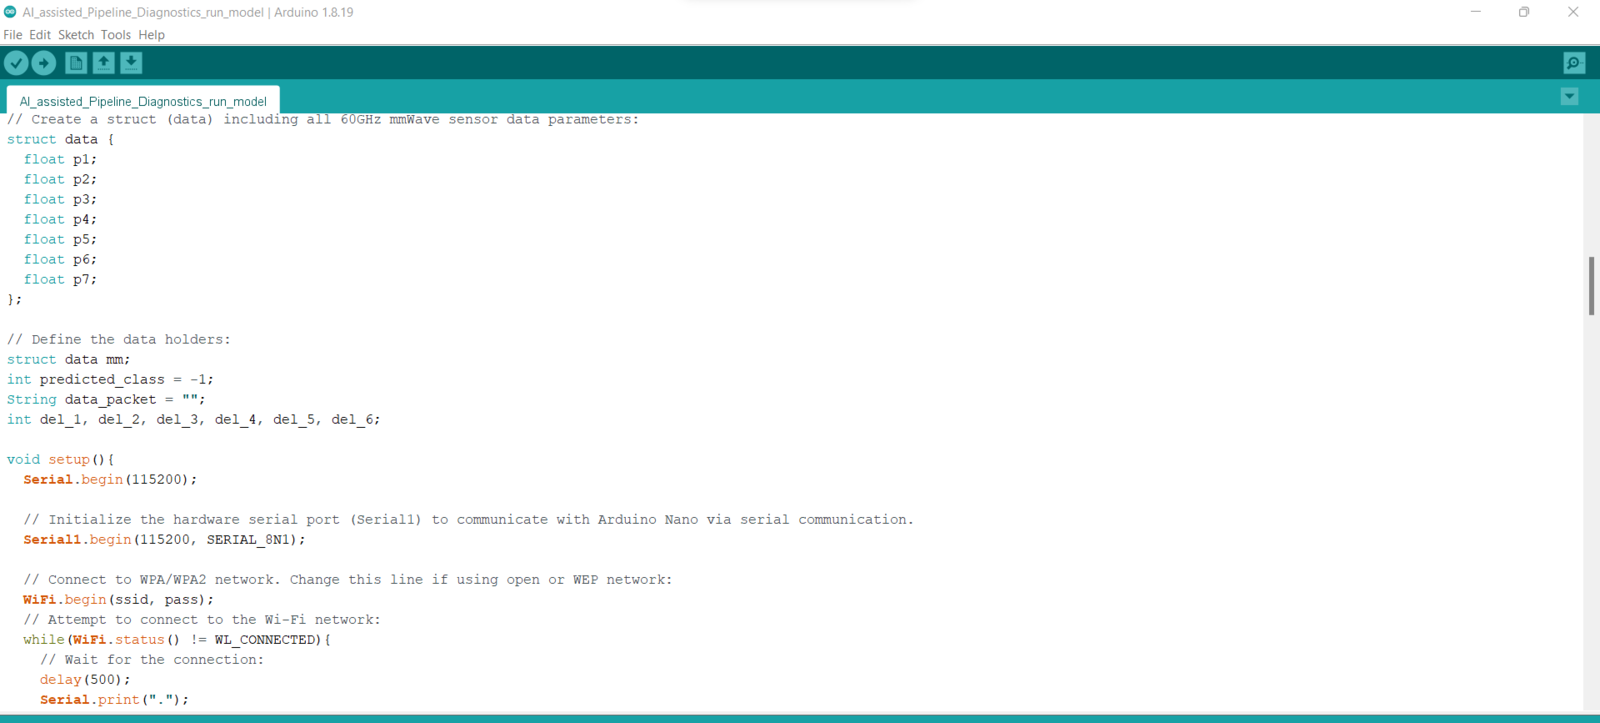
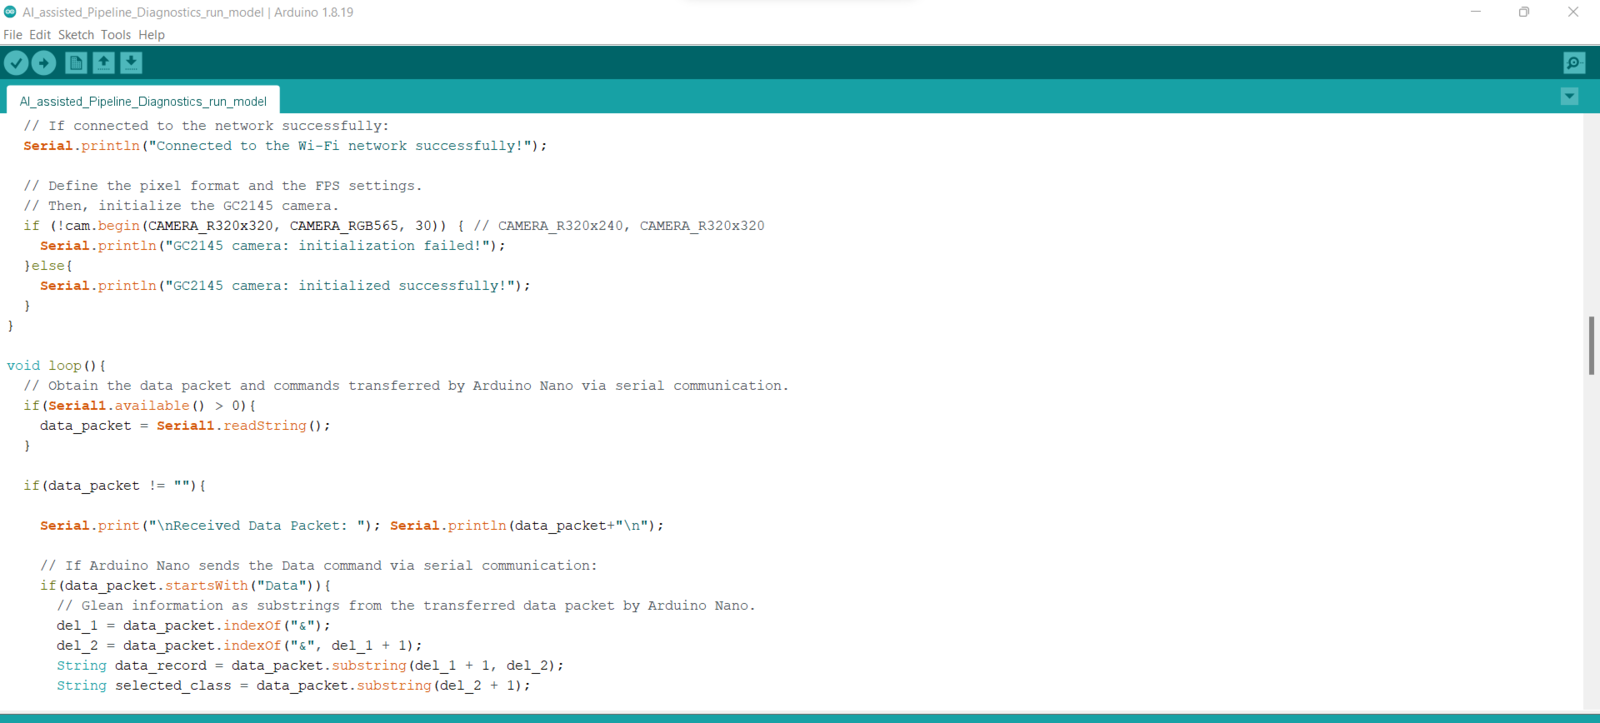
Step 5: Collecting mmWave data parameters and communicating with Nicla Vision via serial communication w/ Arduino Nano
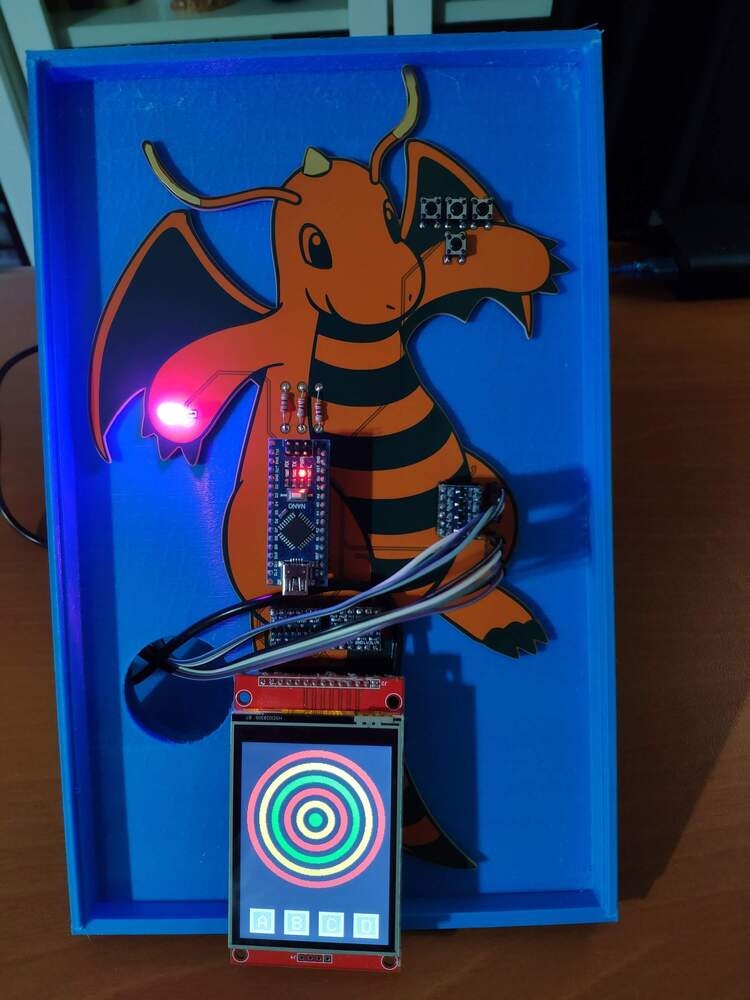
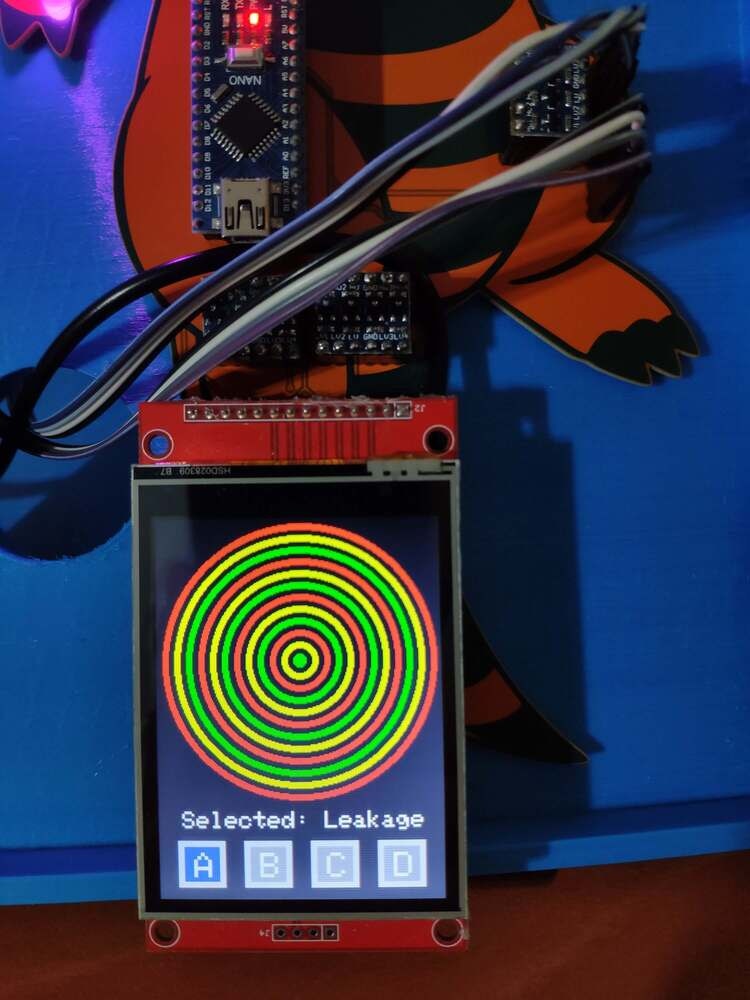
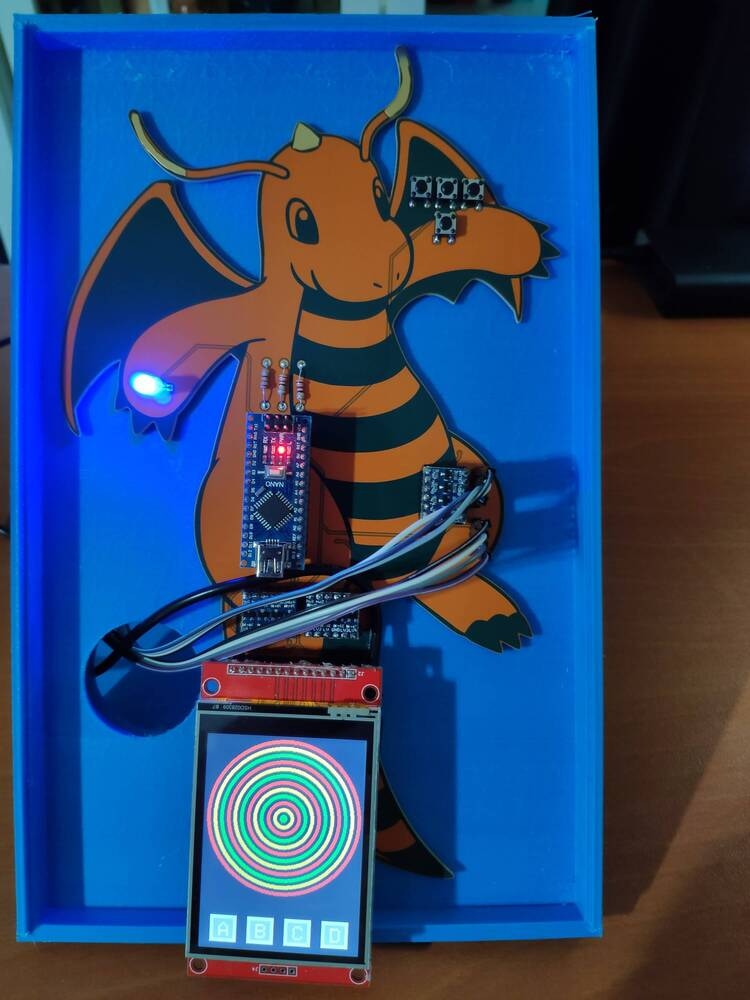
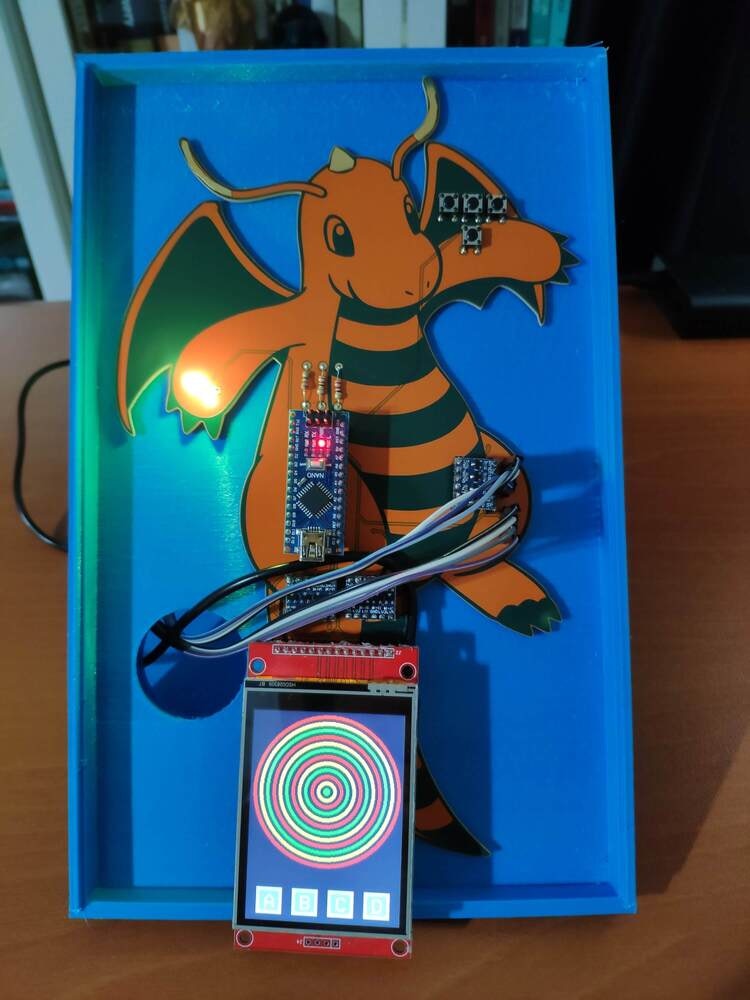
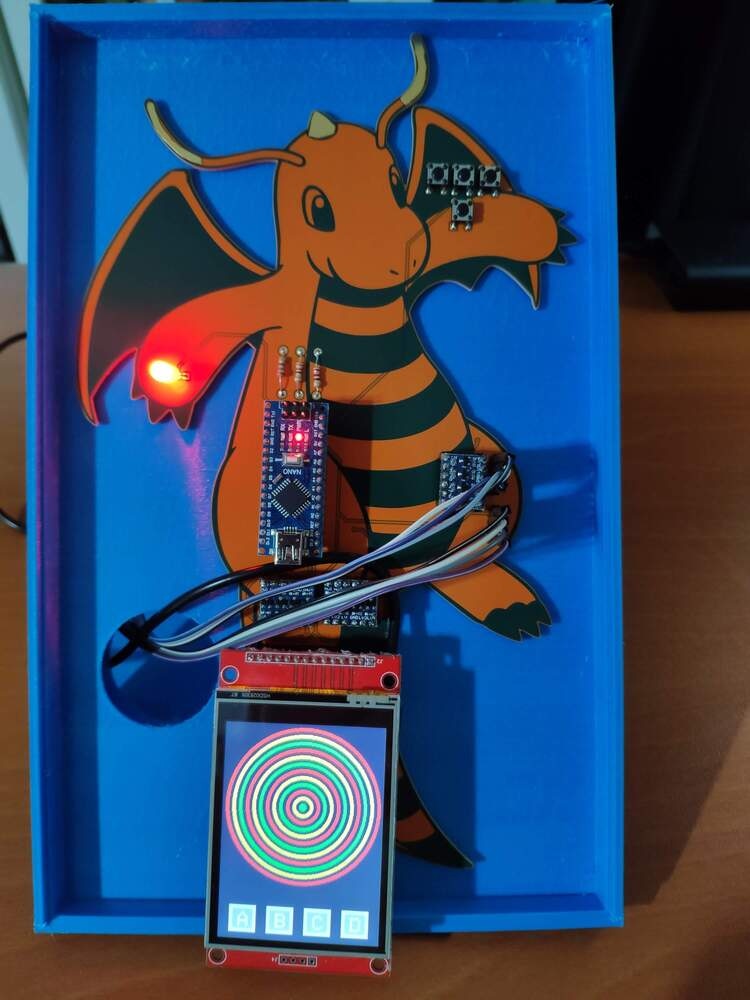
After setting up Nicla Vision and installing the required libraries, I programmed Arduino Nano to extract data parameters from the 60GHz mmWave radar module and transmit the collected data parameters to Nicla Vision via serial communication. As explained in the previous steps, I encountered architecture and library incompatibilities when I connected the mmWave module and the ILI9341 TFT LCD screen directly to Nicla Vision. Since I needed to assign pipeline diagnostic classes as labels for each data record while collecting mmWave data parameters of different pipeline defects to create a valid data set for my neural network model, I utilized three control buttons connected to Arduino Nano so as to choose among classes and transfer data records via serial communication. After selecting a pipeline diagnostic class by pressing a control button, Arduino Nano transmits the selected class and the recently collected data parameters to Nicla Vision.- Control Button (A) ➡ Leakage
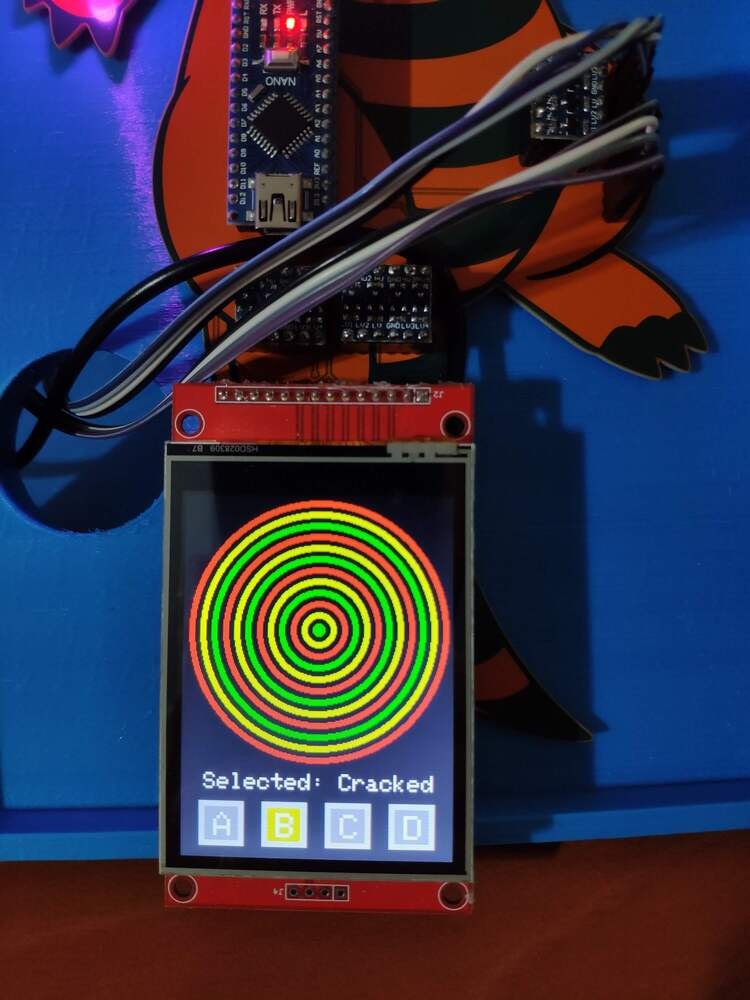
- Control Button (B) ➡ Cracked
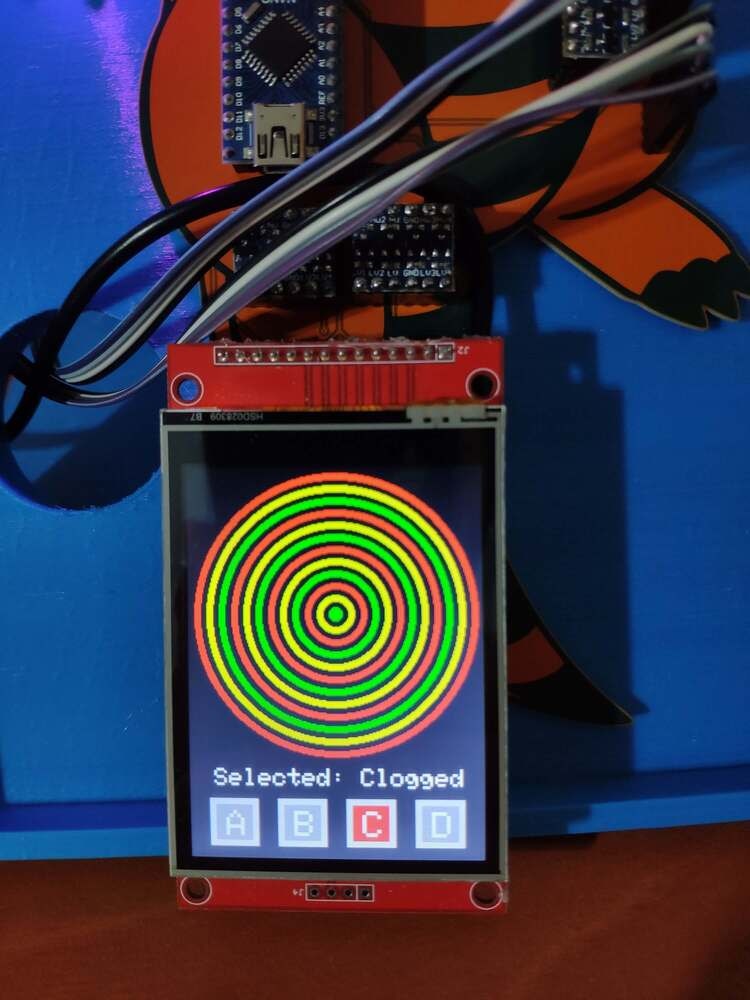
- Control Button (C) ➡ Clogged
image
image
image
image
image
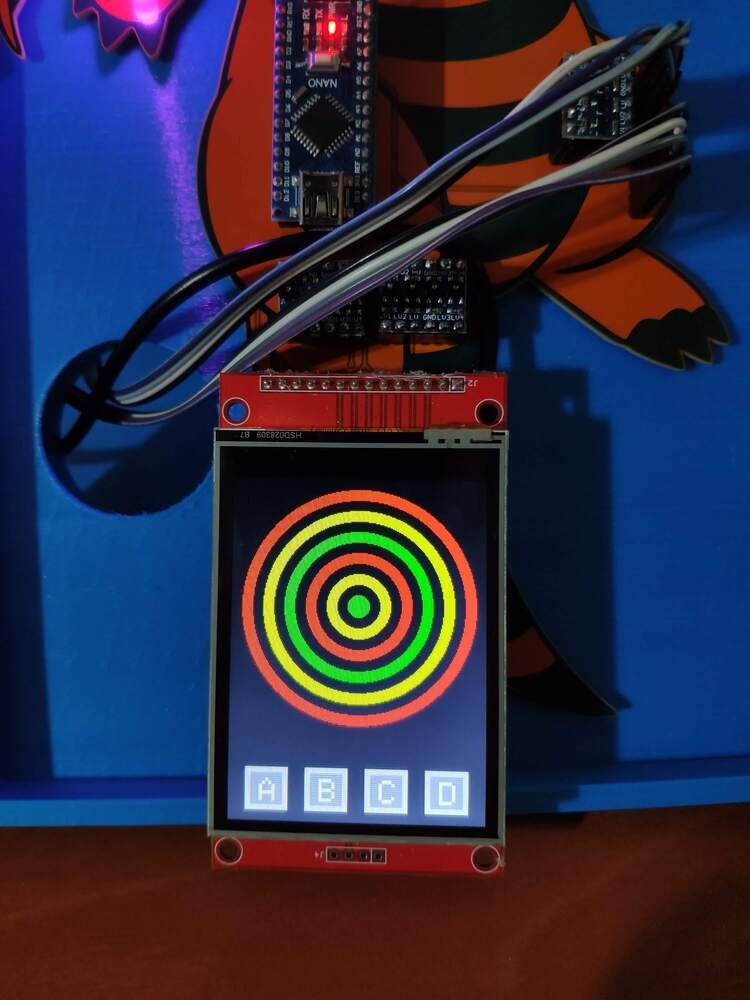
Step 5.1: Storing and converting the collected data parameters to samples via the web application
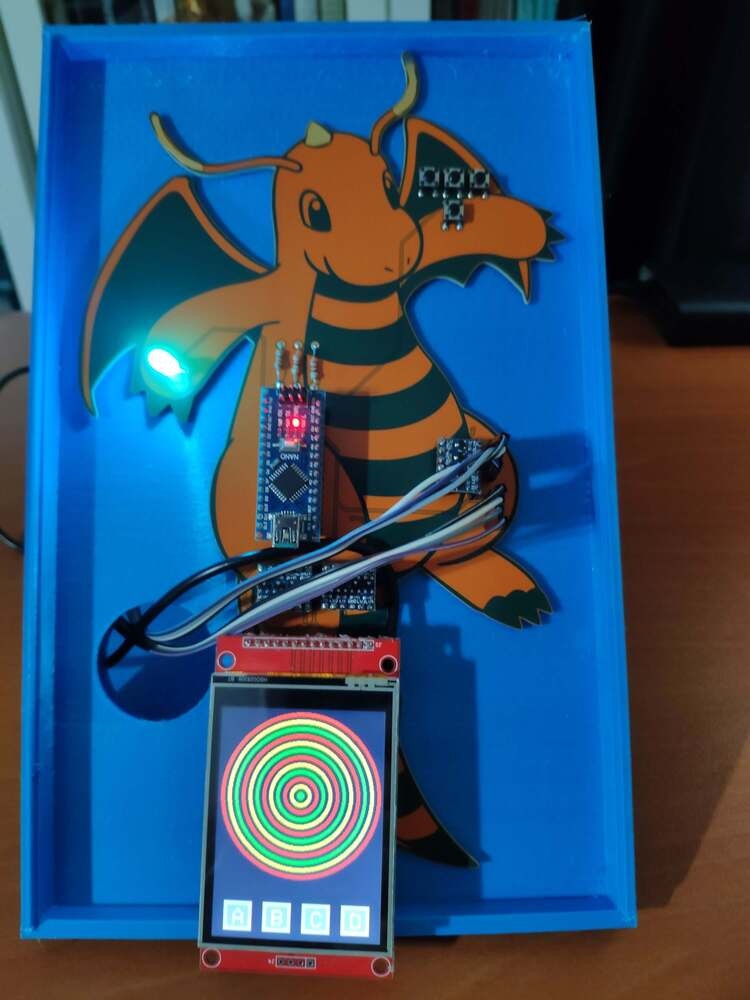
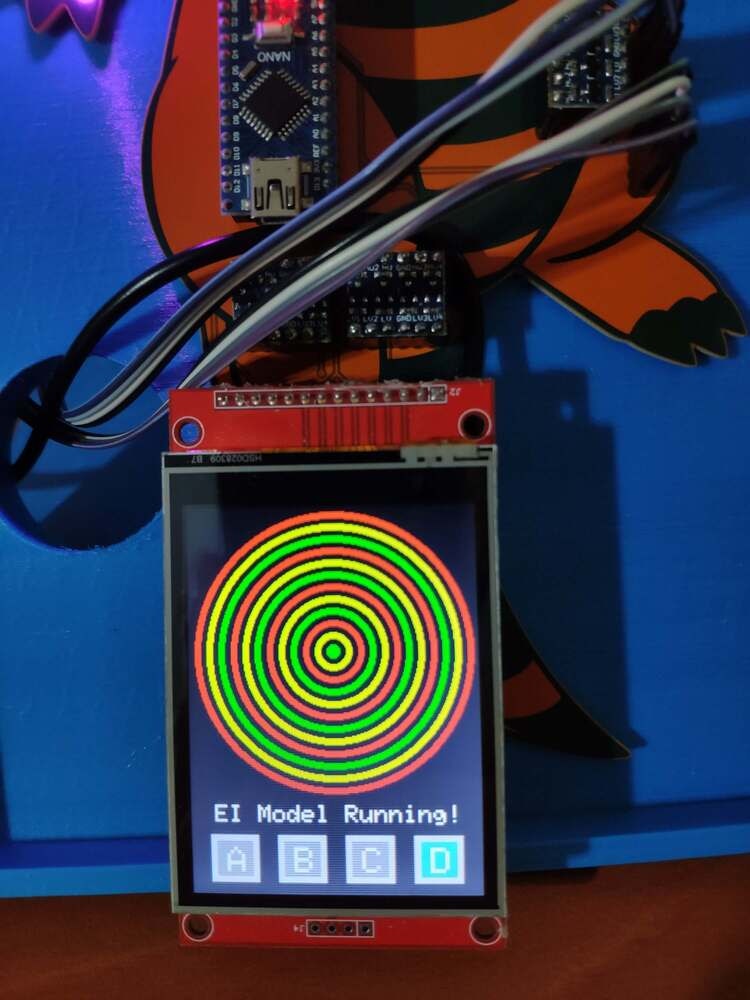
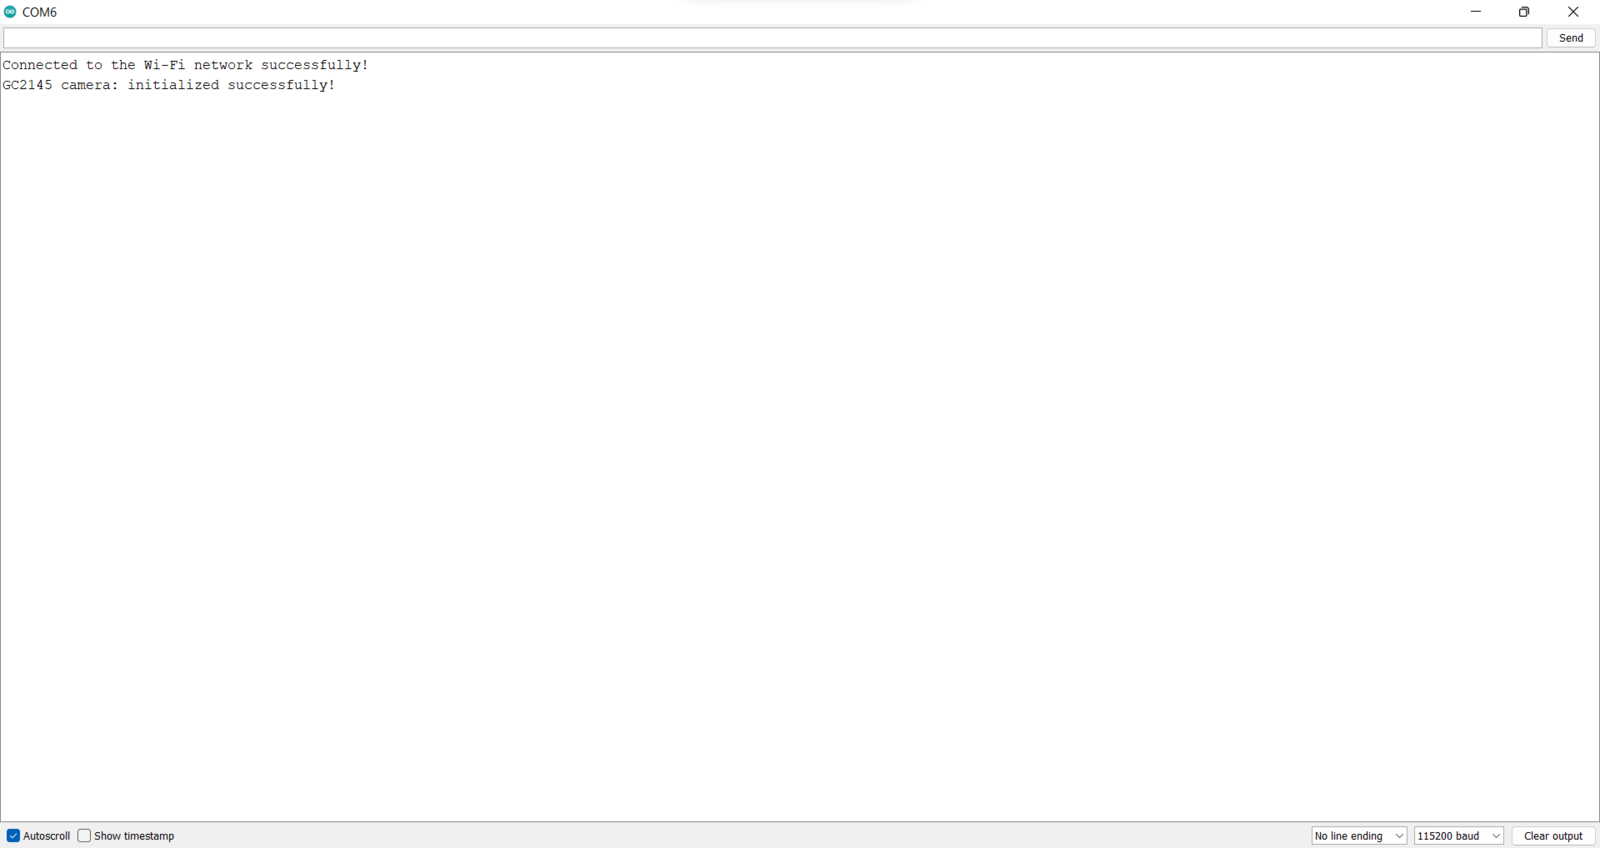
After uploading and running the code for collecting mmWave data parameters and transferring the collected data with the selected class to Nicla Vision via serial communication: 🚿🔎📲 If the 60GHz mmWave radar module works accurately, the device turns the RGB LED to magenta and displays the simple radar indicator visualizing the extracted mmWave data parameters and the interface menu buttons on the ILI9341 TFT LCD screen.image
image
image
image
image
image
image
image
image
image
image

image
image
Step 6: Building a neural network model with Edge Impulse
In this project, I needed to obtain precise mmWave data parameters indicating vibration fluctuations of different pipeline defects in order to train my neural network model accurately. Therefore, as explained in the previous steps, I built a simple pipeline system by utilizing pipes and fittings (adapters) with mediocre thermal conductivity, demonstrating three different pipeline defects in each primary section — color-coded.- Blue Section ➡ Cracked
- Red Section➡ Clogged
- Green Section ➡ Leakage
- Clogged
- Cracked
- Leakage
- Data Scaling (Normalizing)
- Data Preprocessing
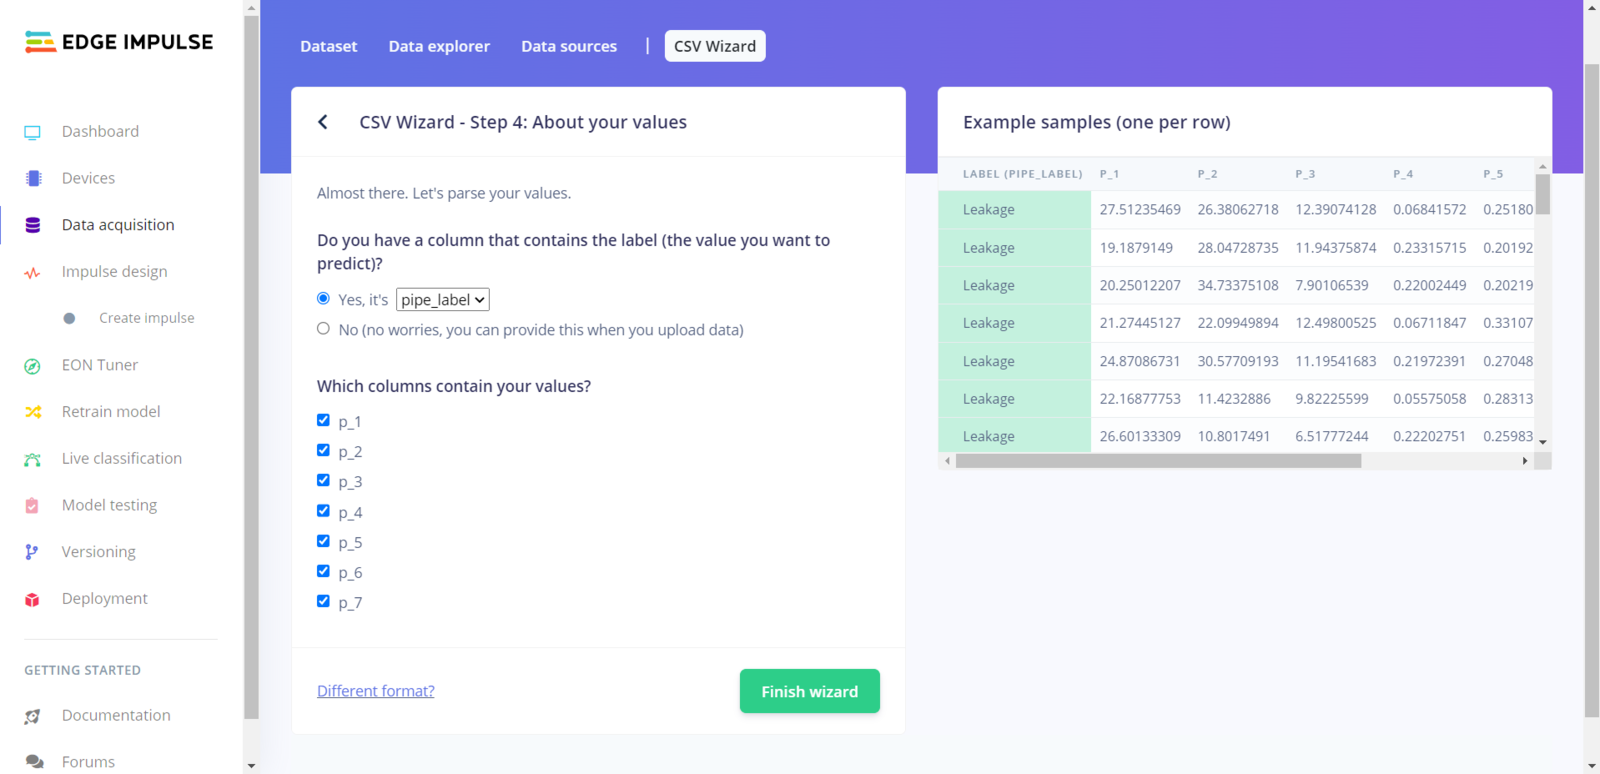
Step 6.1: Preprocessing and scaling the data set to create formatted samples for Edge Impulse
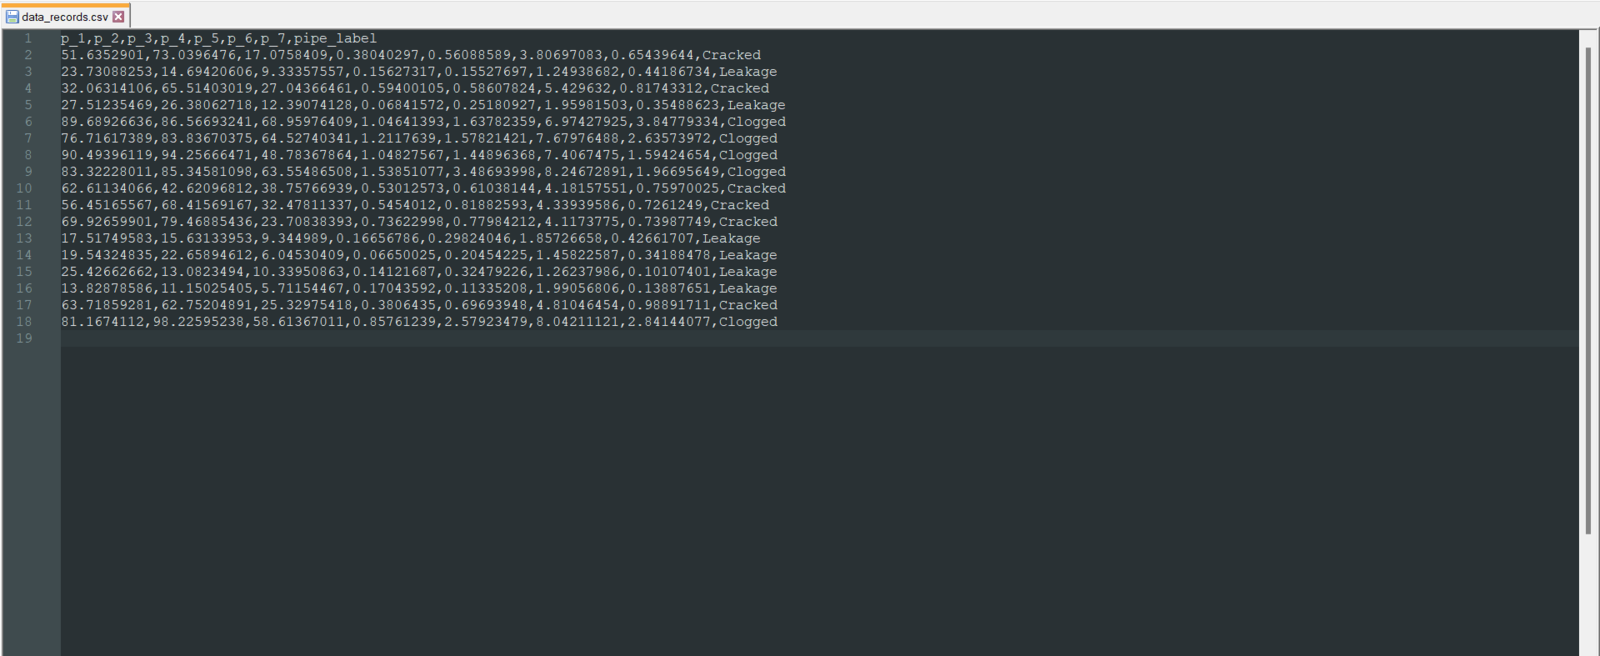
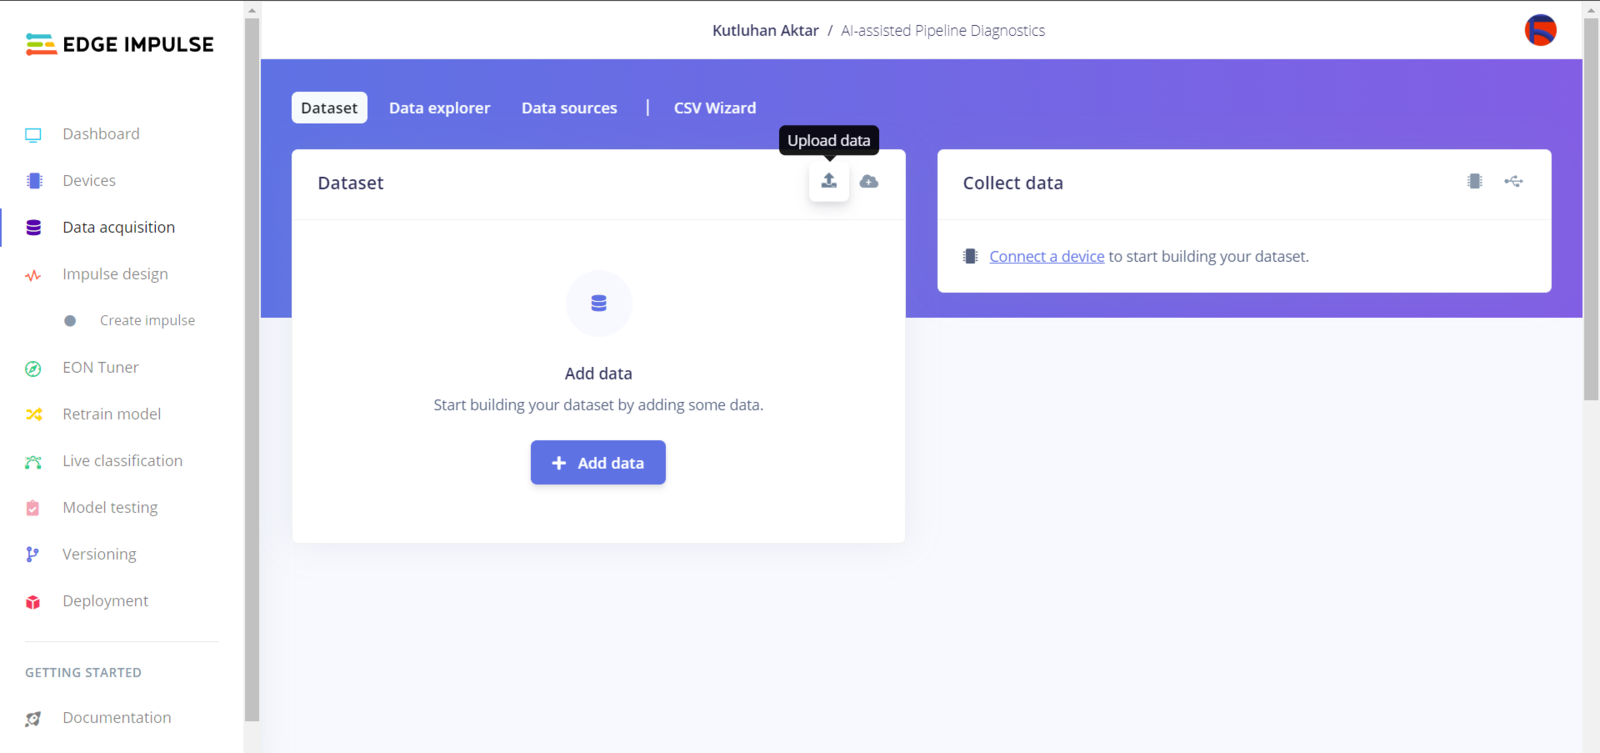
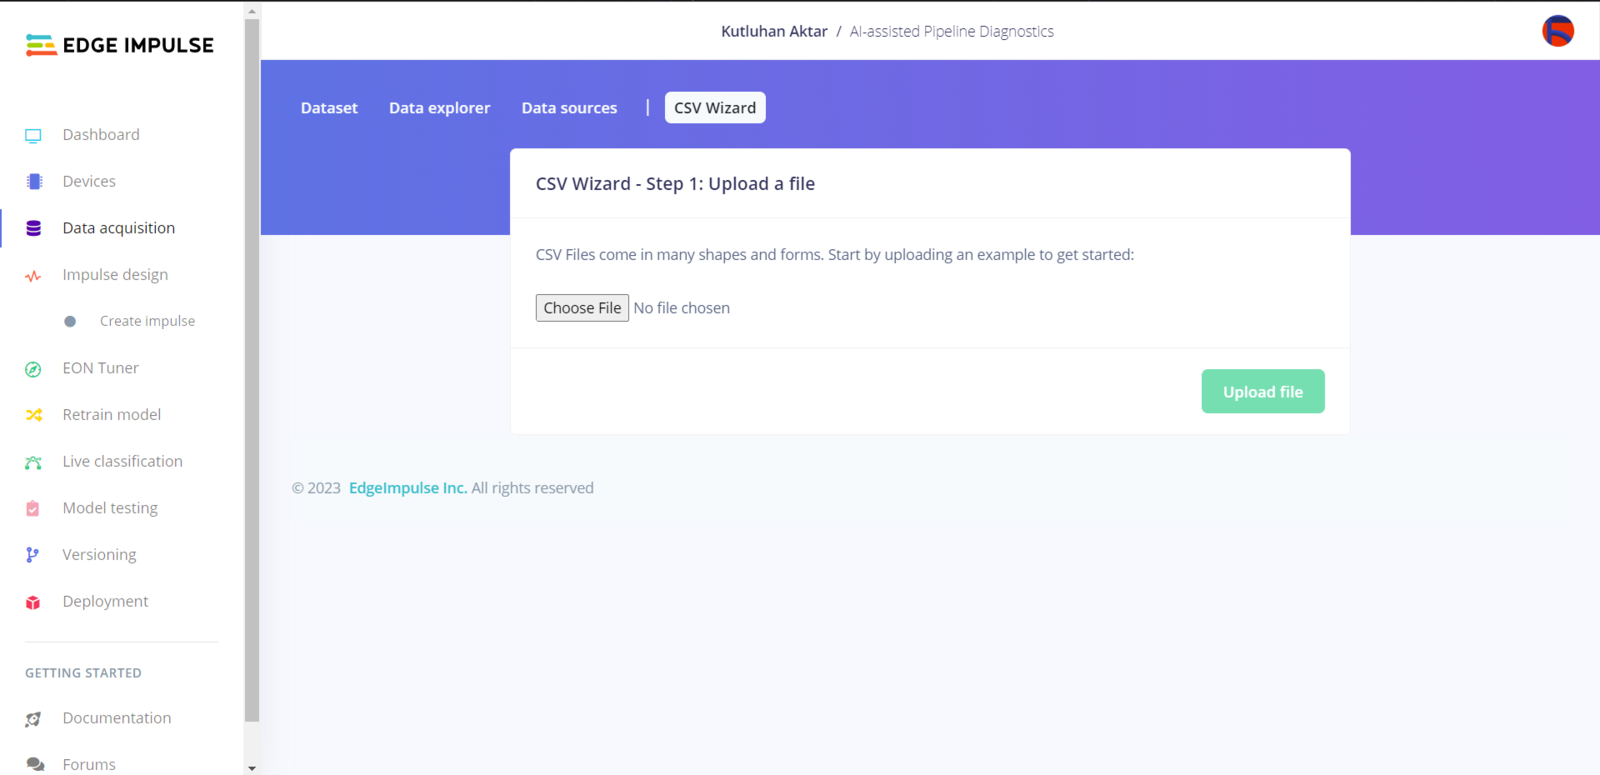
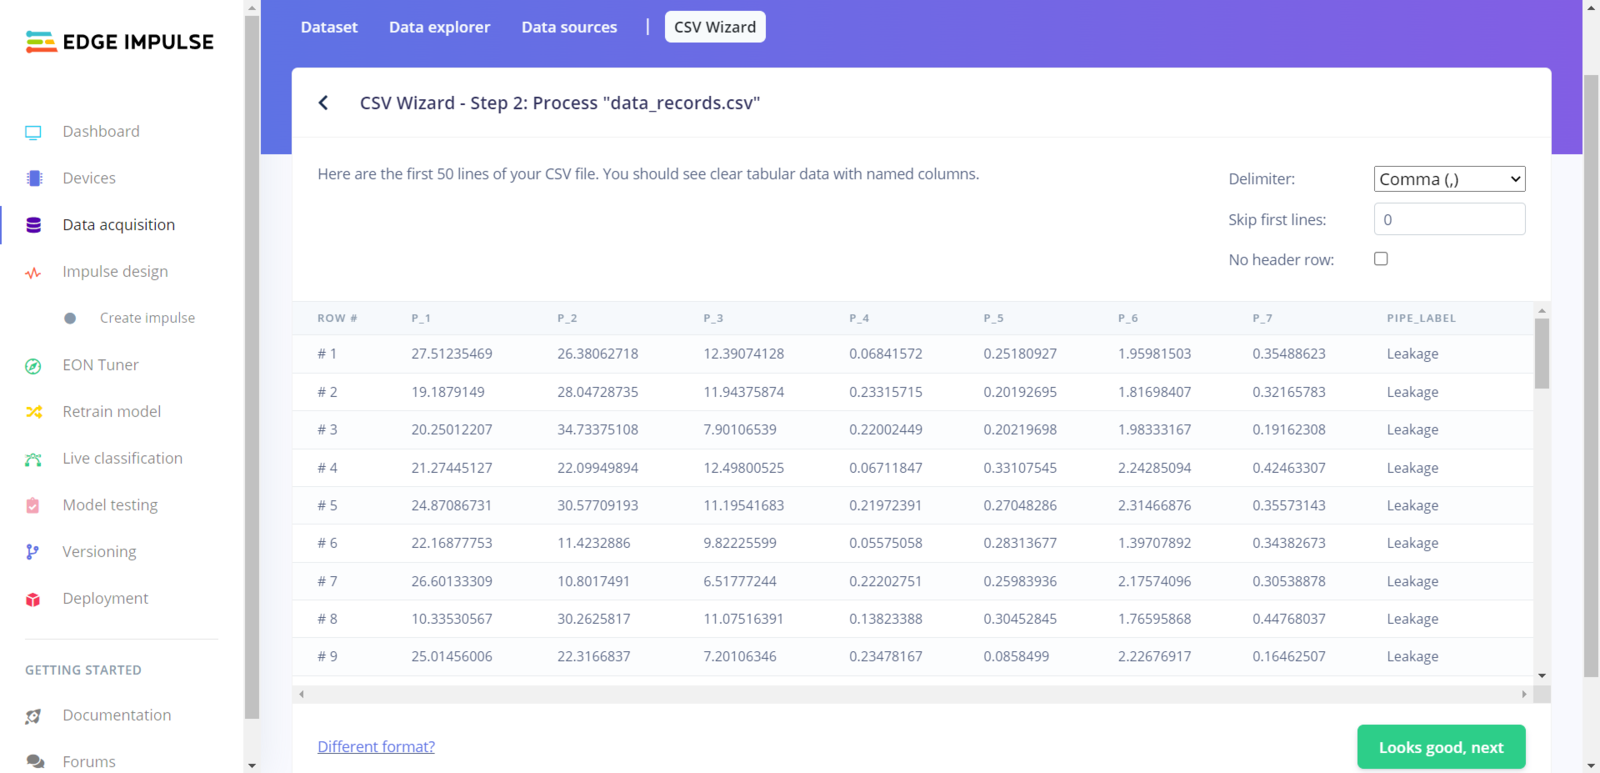
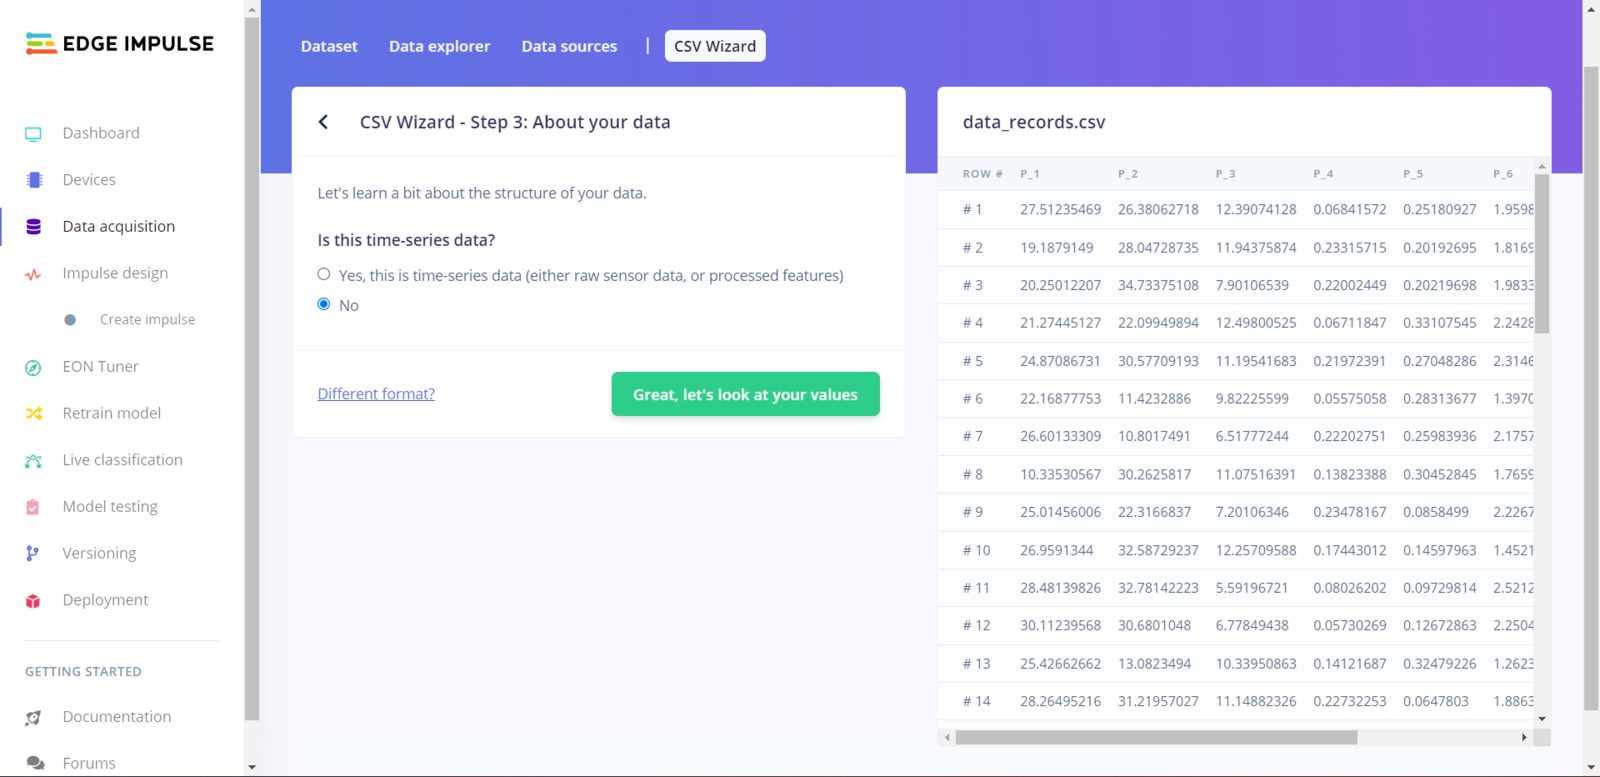
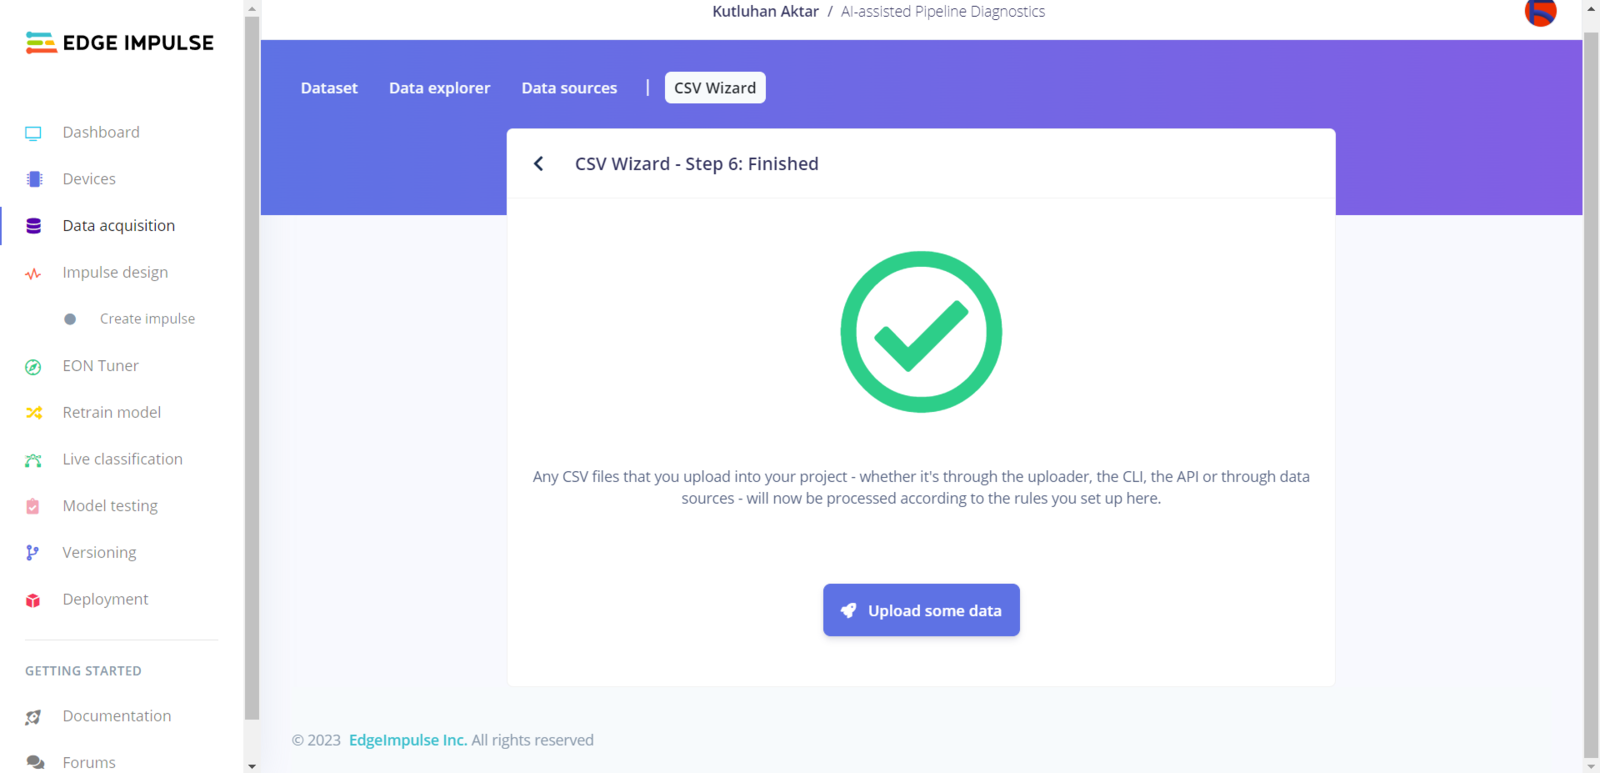
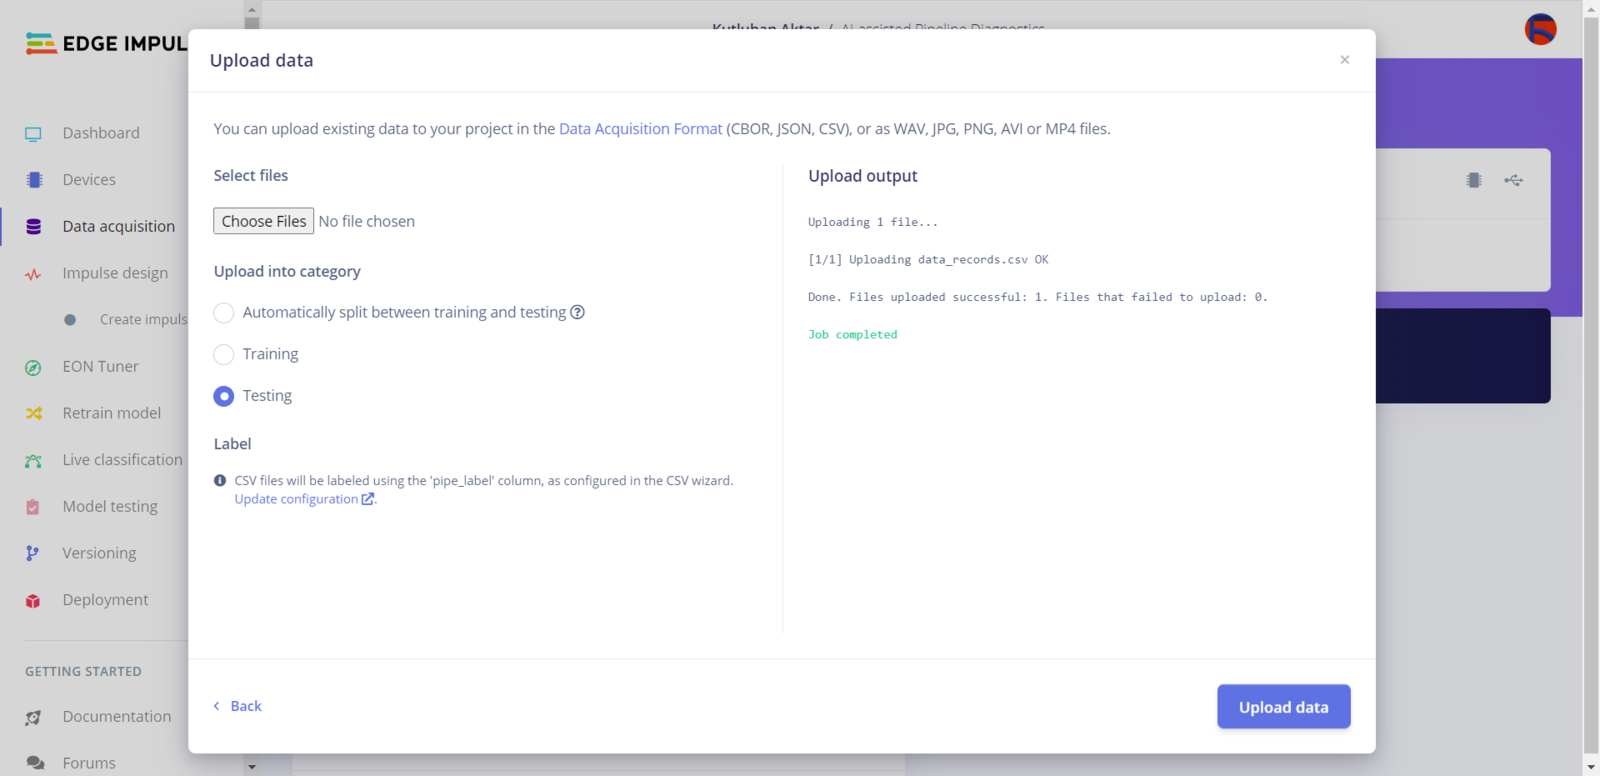
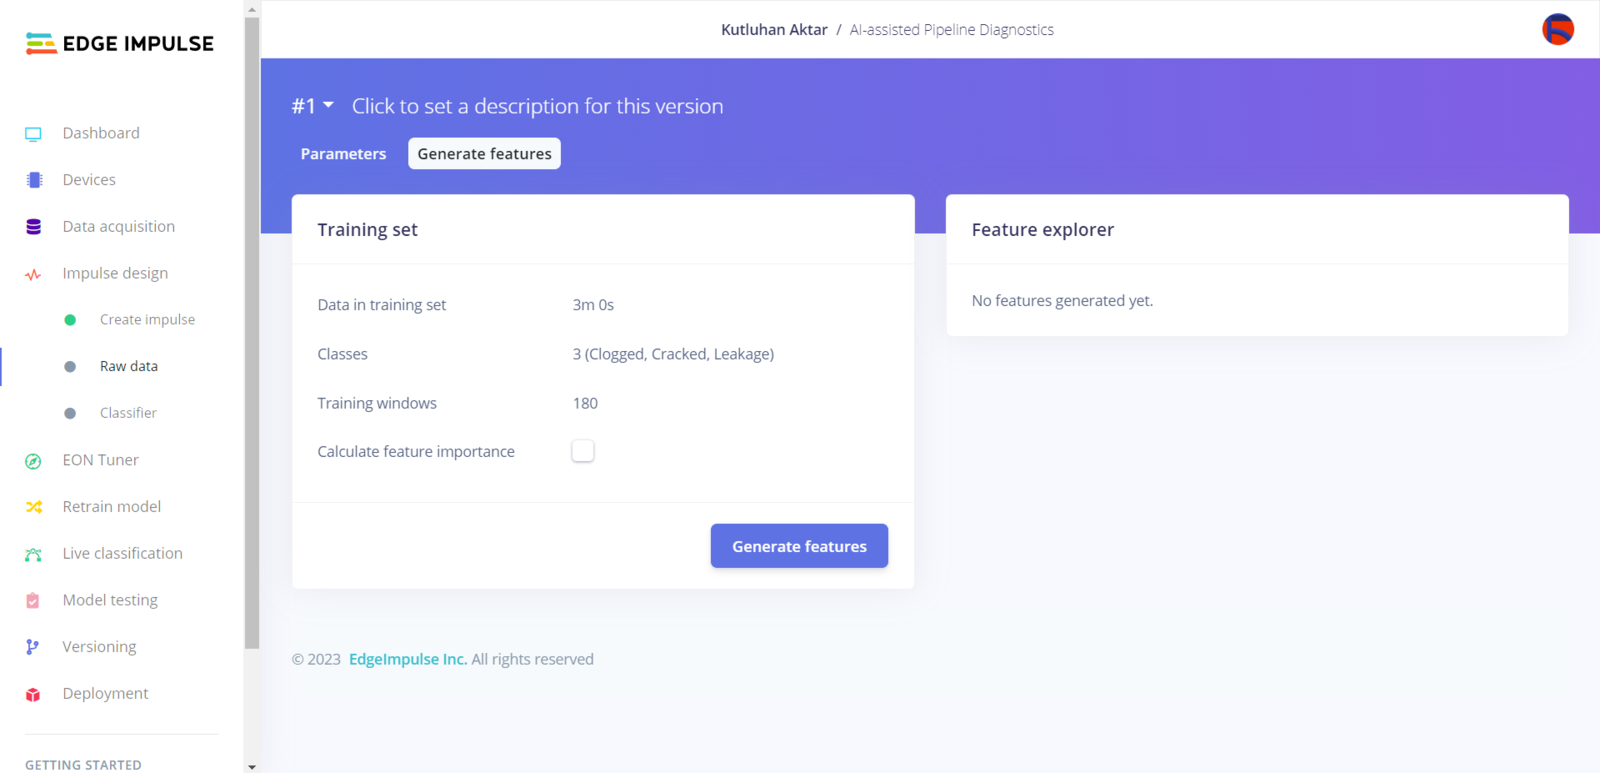
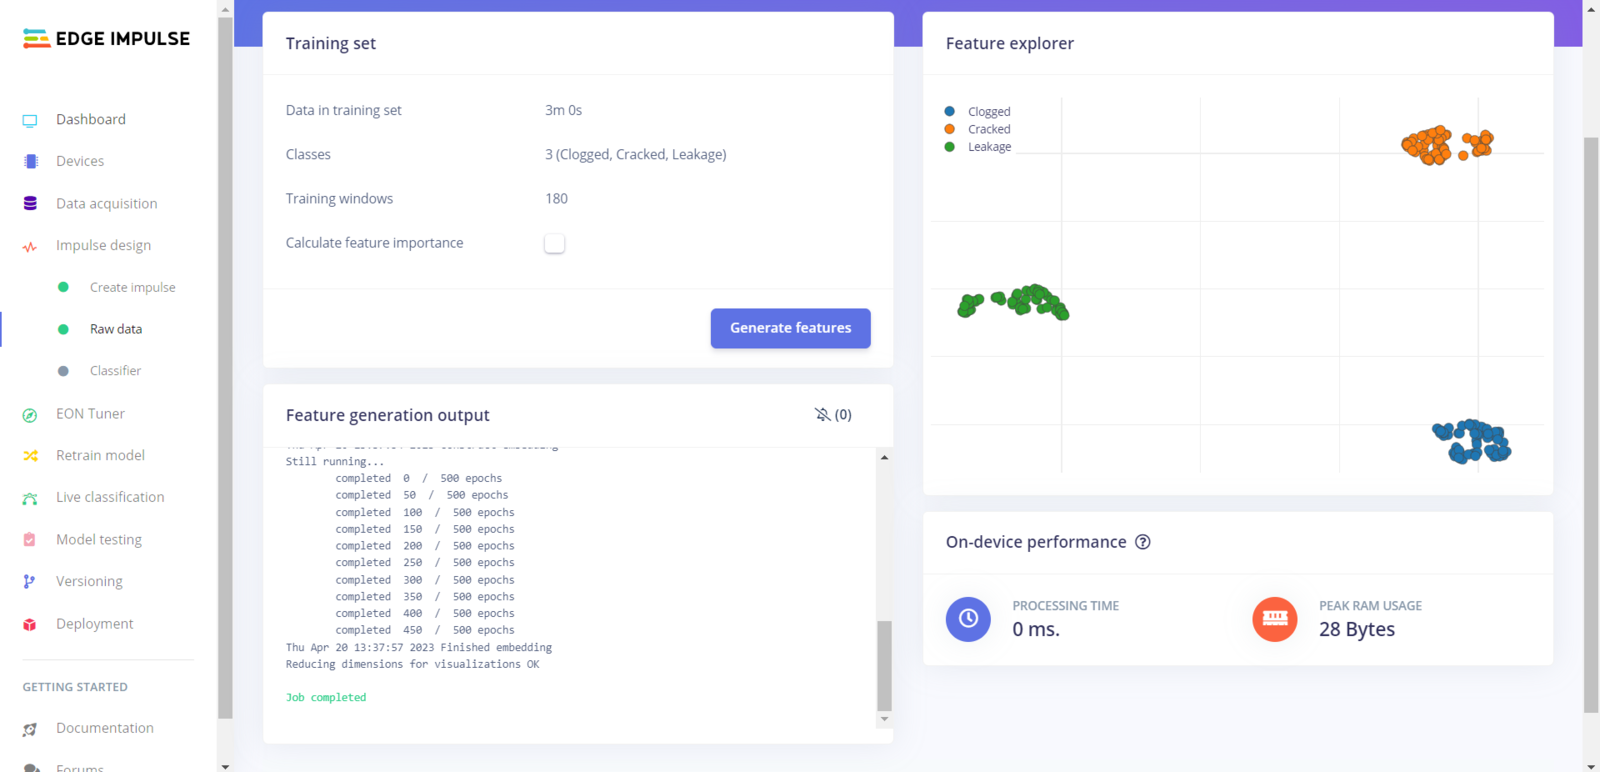
As long as the CSV file includes a header defining data fields, Edge Impulse can distinguish data records as individual samples in different data structures thanks to its CSV Wizard while adding existing data to an Edge Impulse project. Therefore, there is no need for splitting single CSV file data sets even if the data type is not time series. After collecting the extracted mmWave data parameters of different pipeline defects and generating a pre-formatted CSV file via the web application, I obtained my appropriately formatted samples.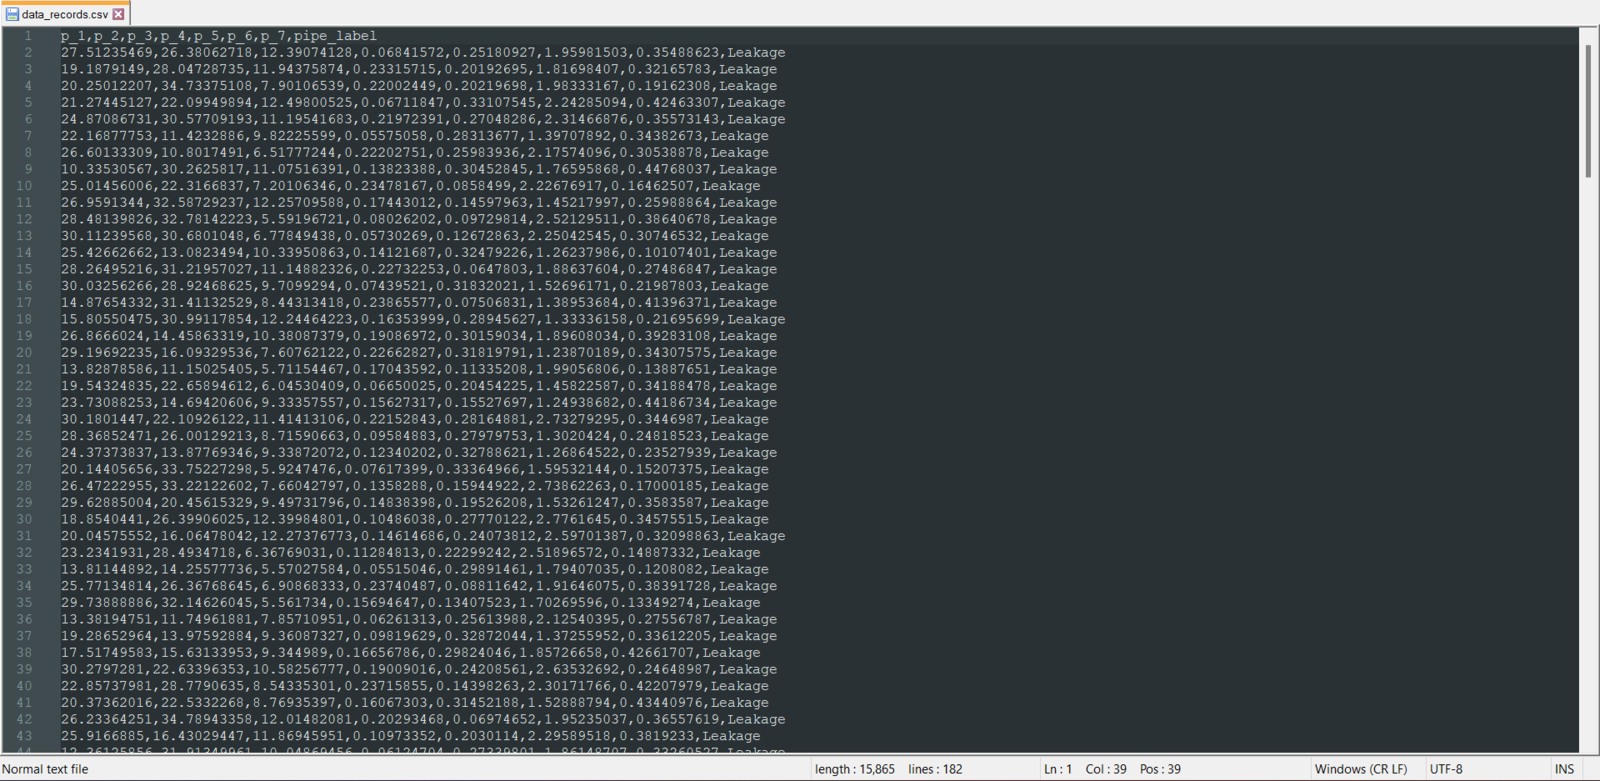
image
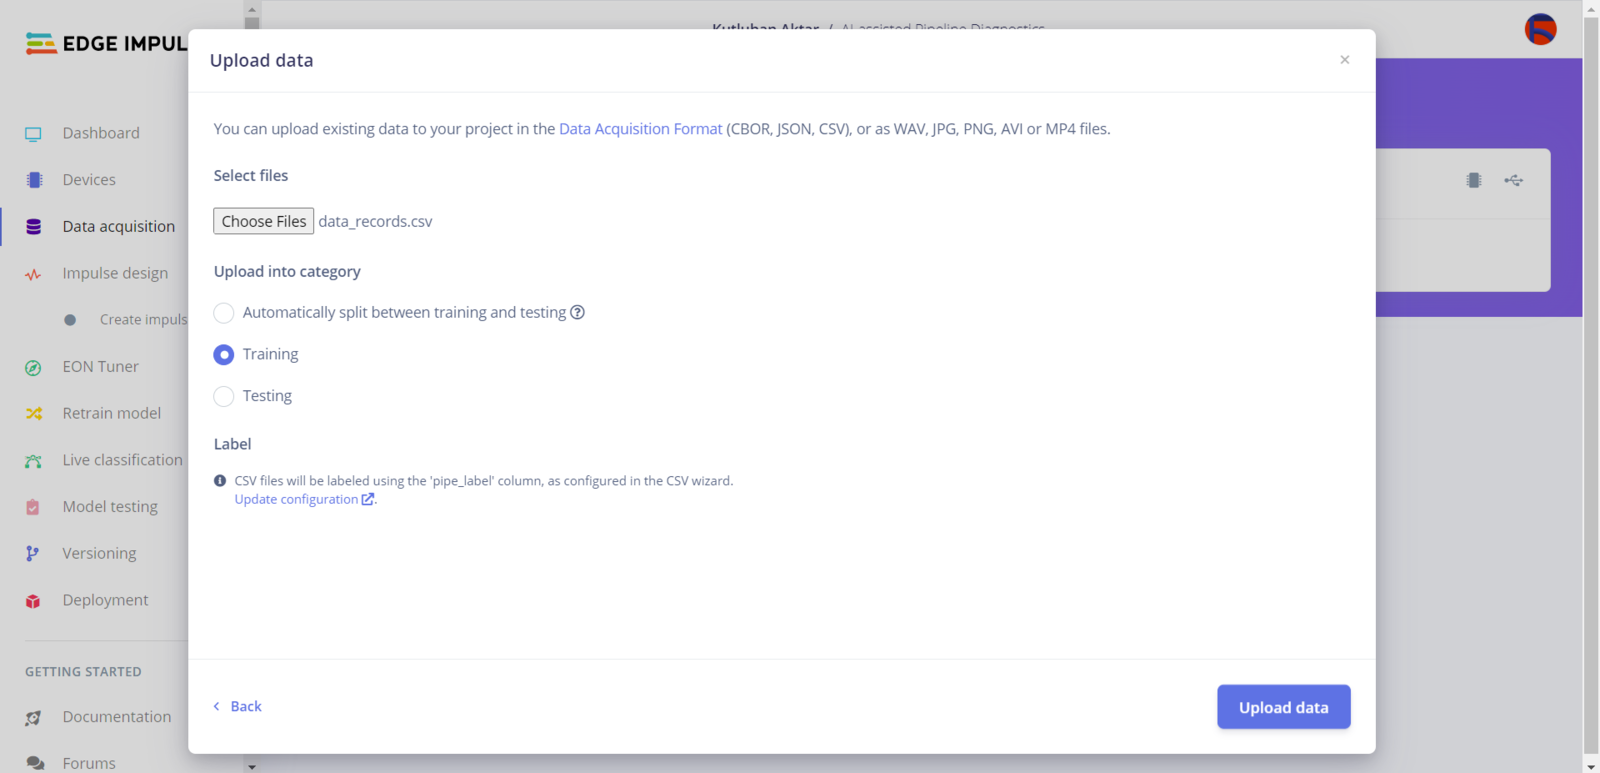
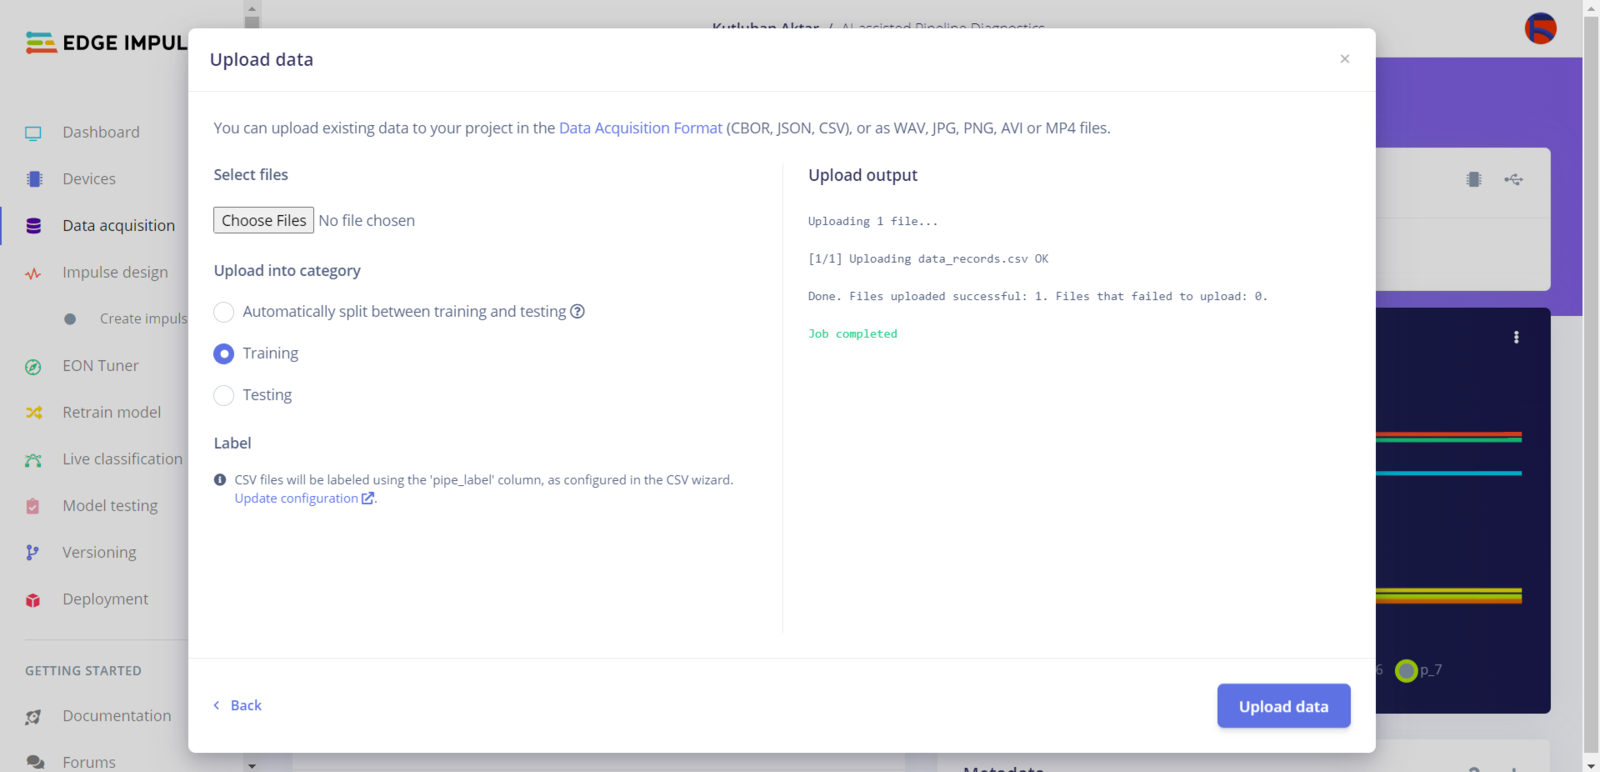
Step 6.2: Uploading formatted samples to Edge Impulse
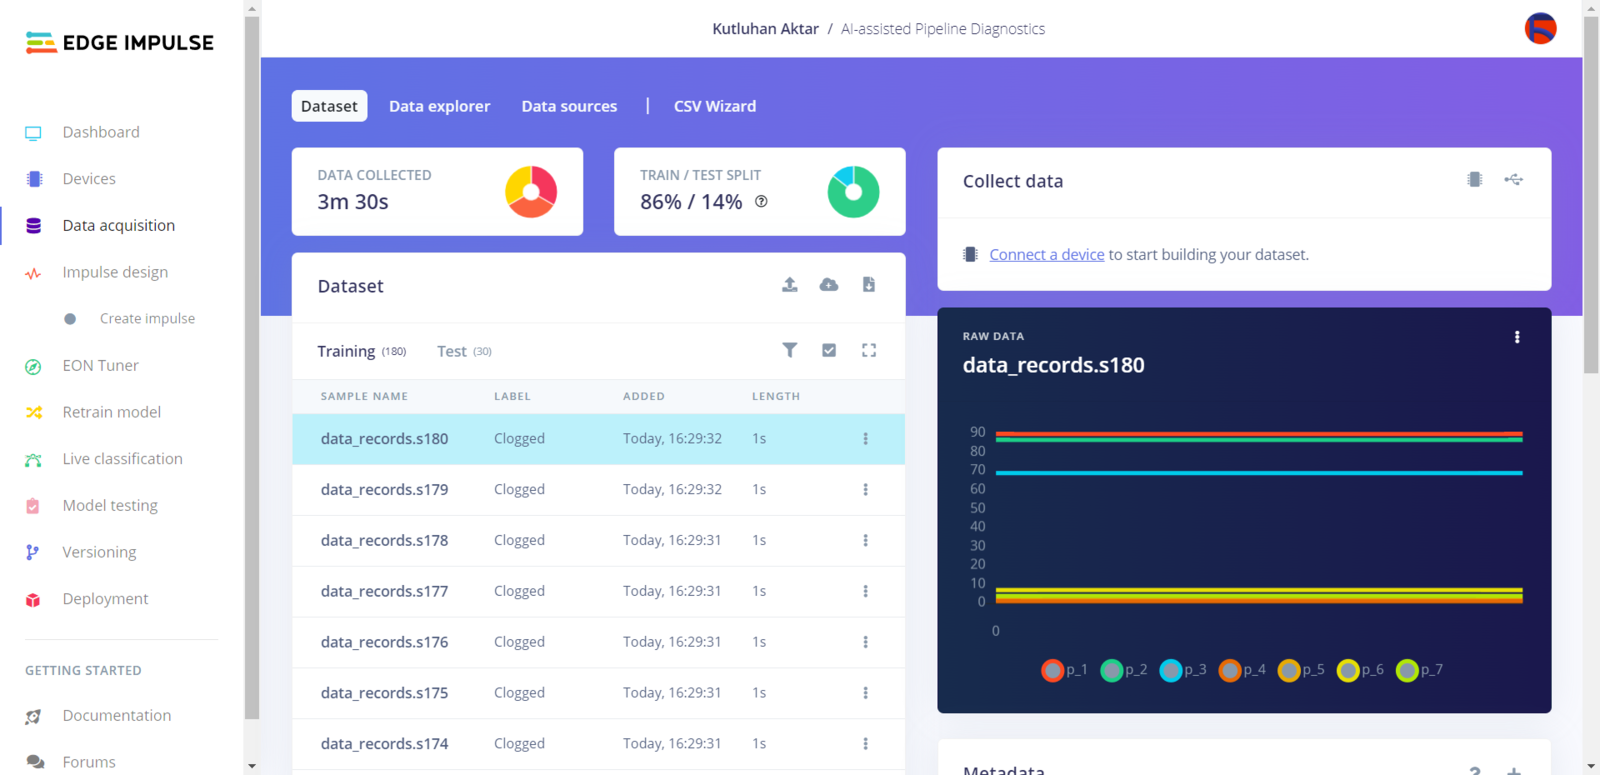
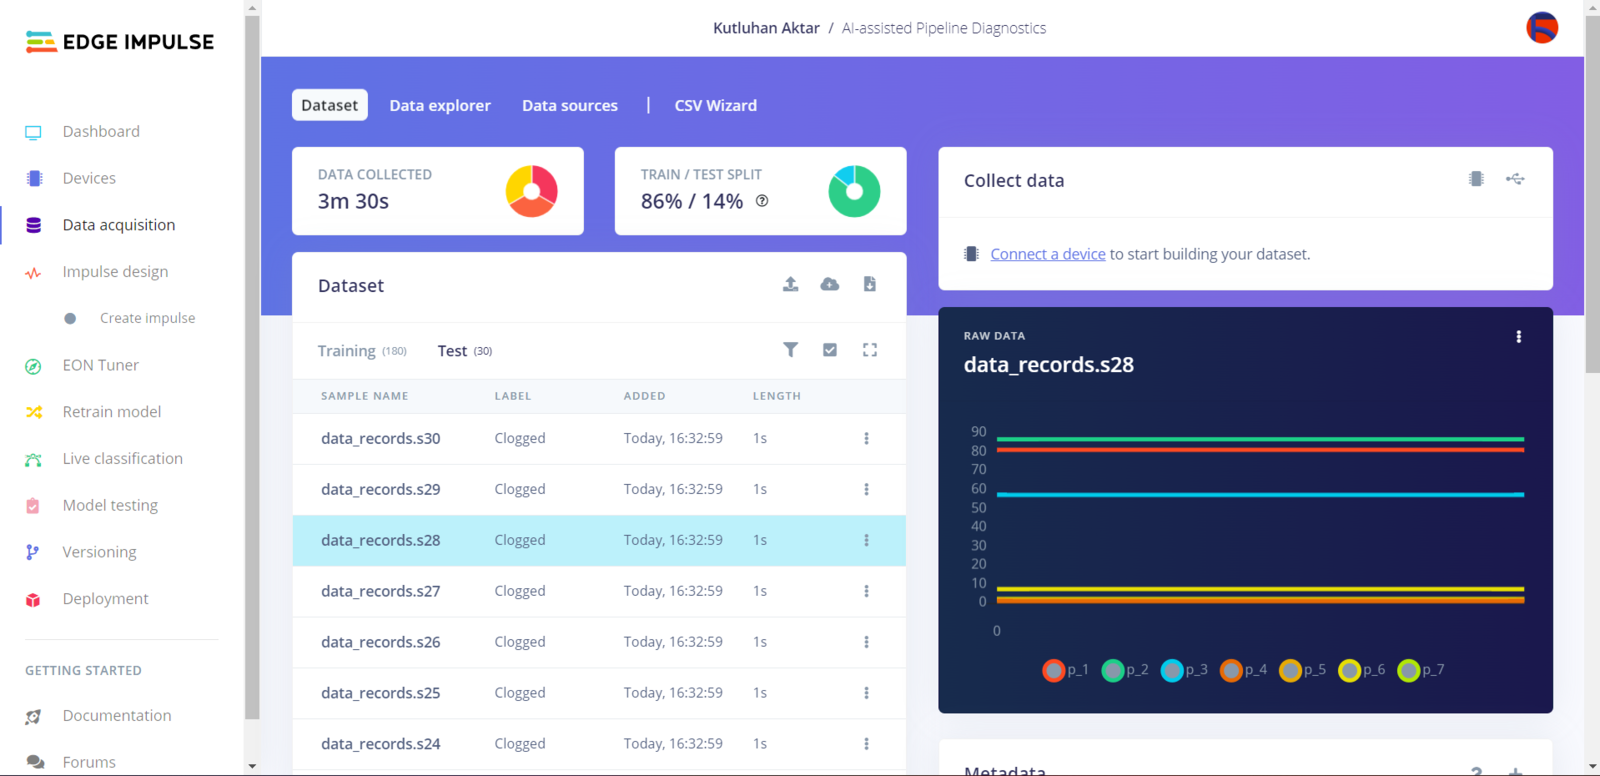
After generating training and testing samples successfully, I uploaded them to my project on Edge Impulse. :hash: First of all, sign up for Edge Impulse and create a new project.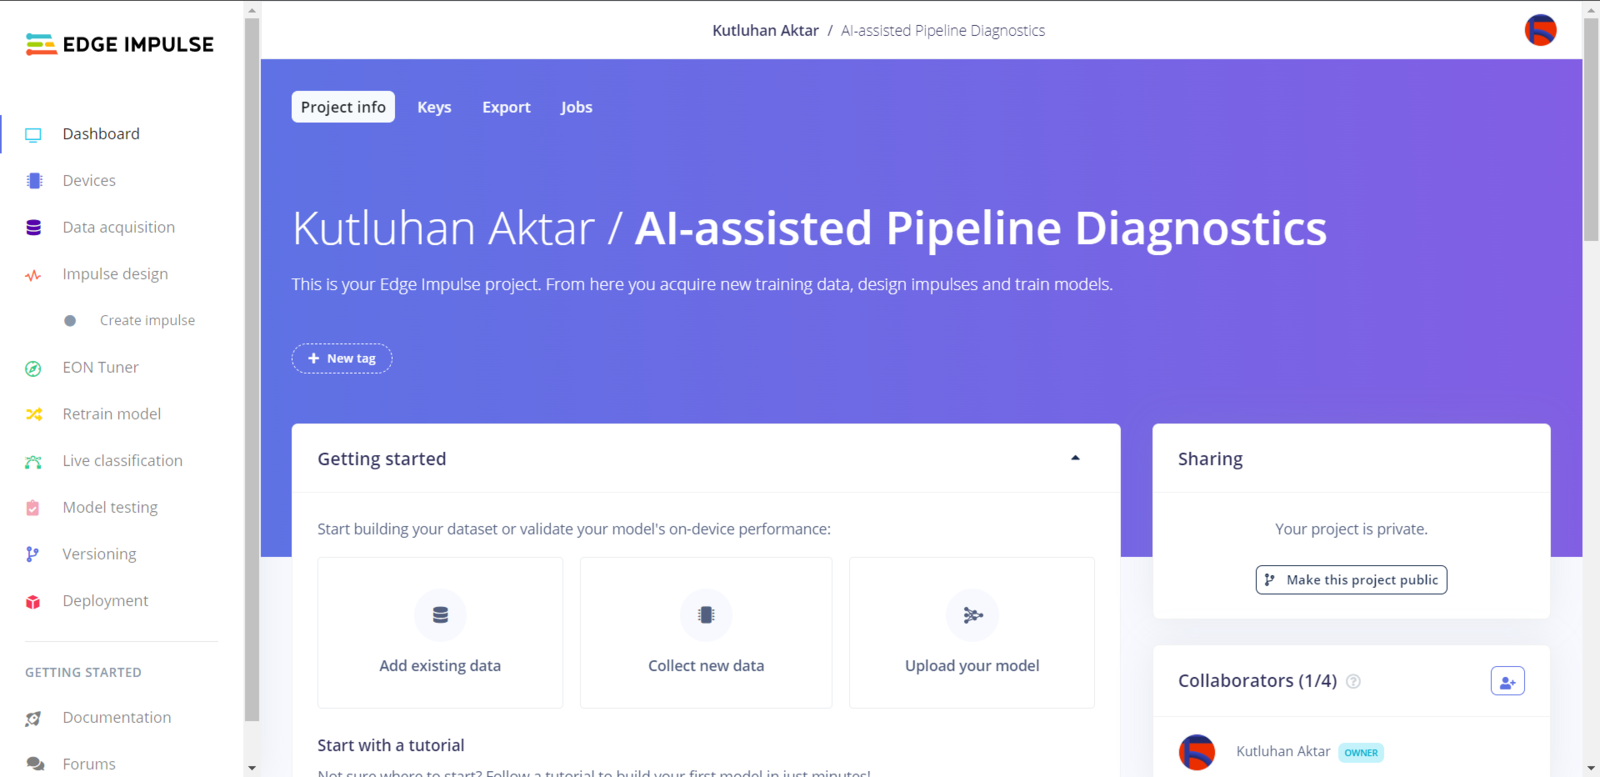
image
image
image

image
image
image
image
image
image
image

image
image
image
image
Step 6.3: Training the model on various pipeline defects
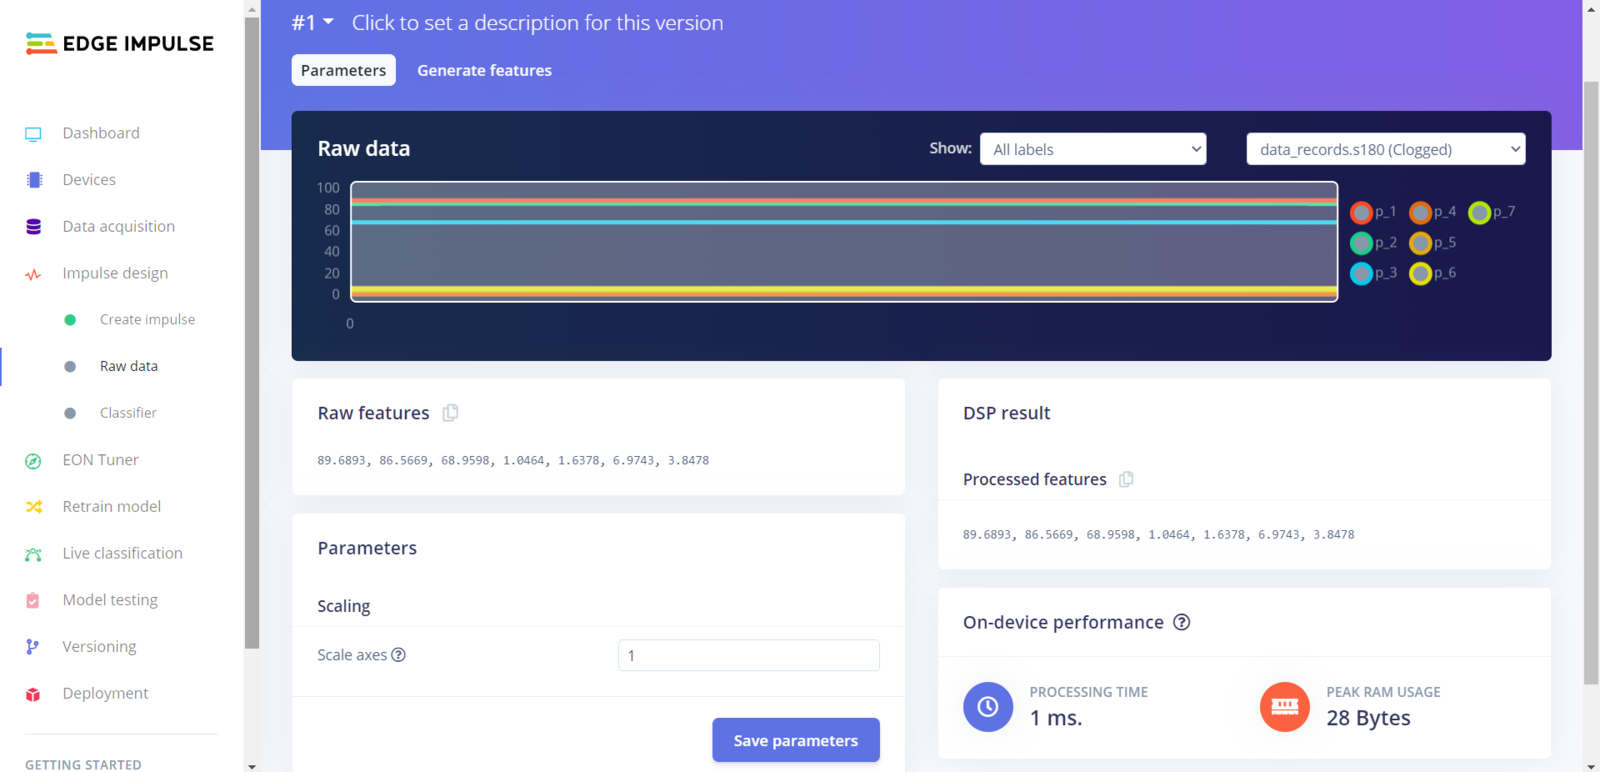
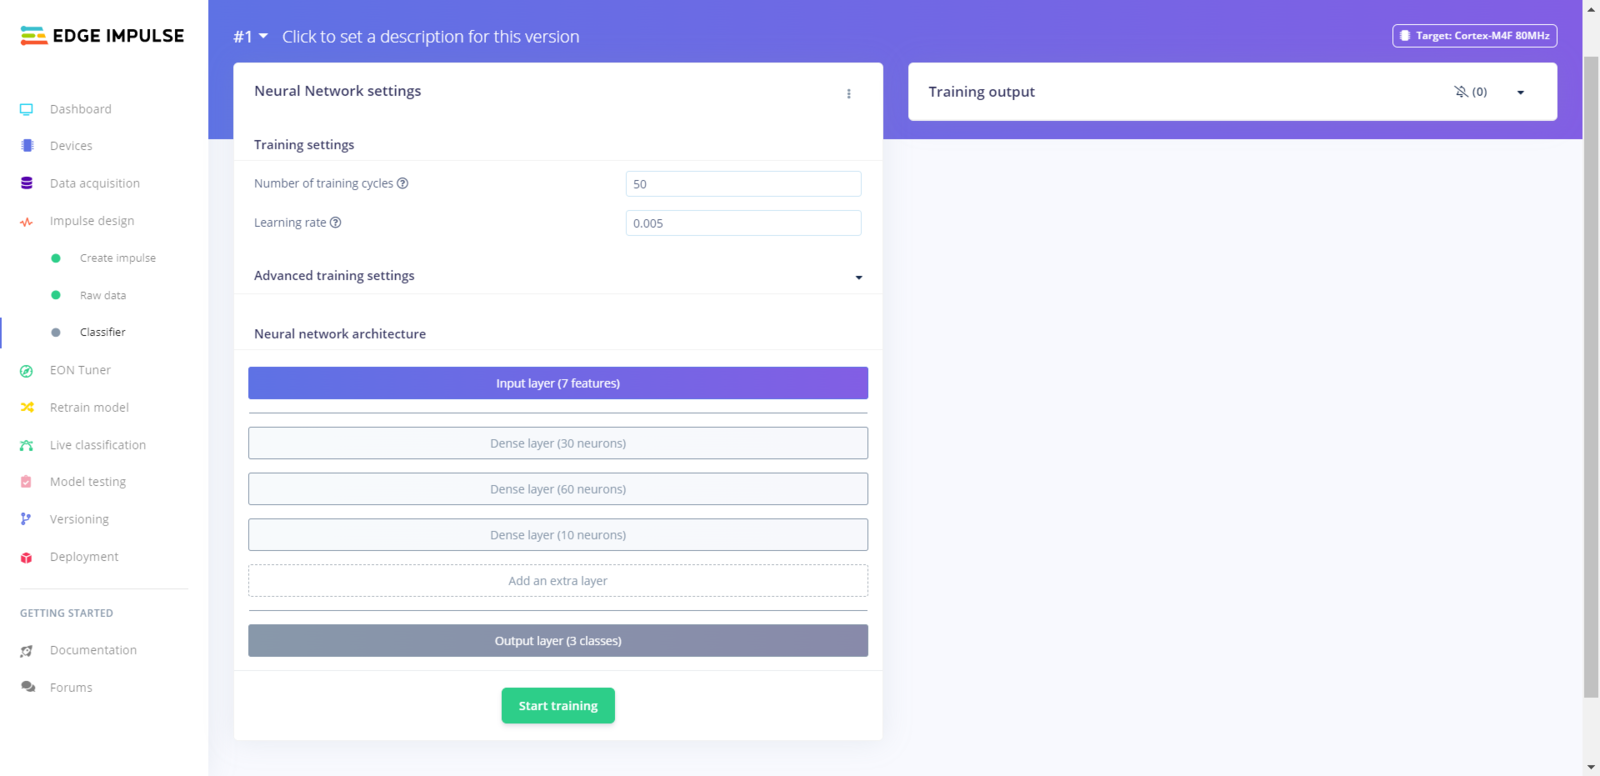
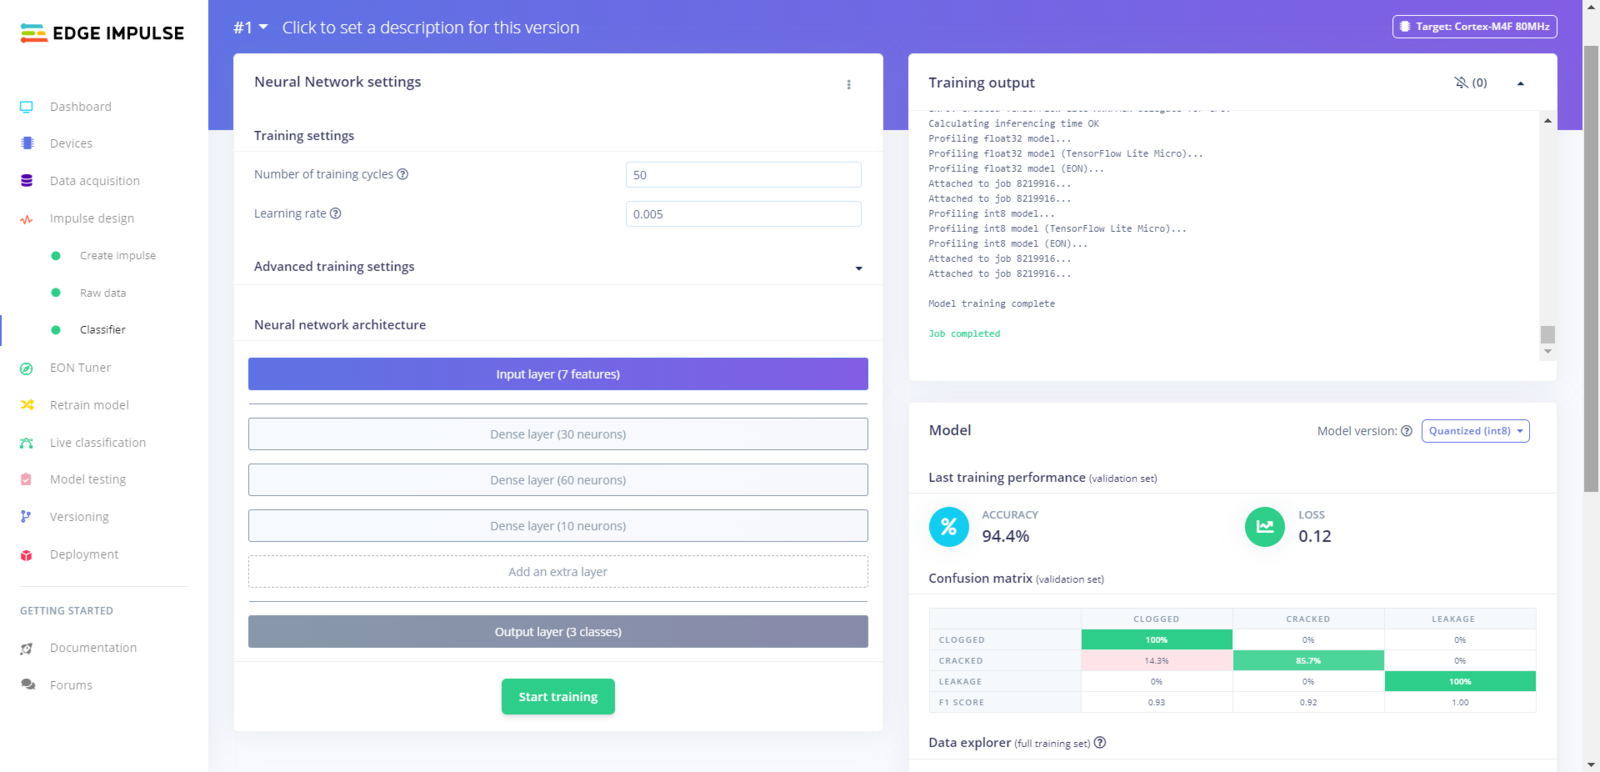
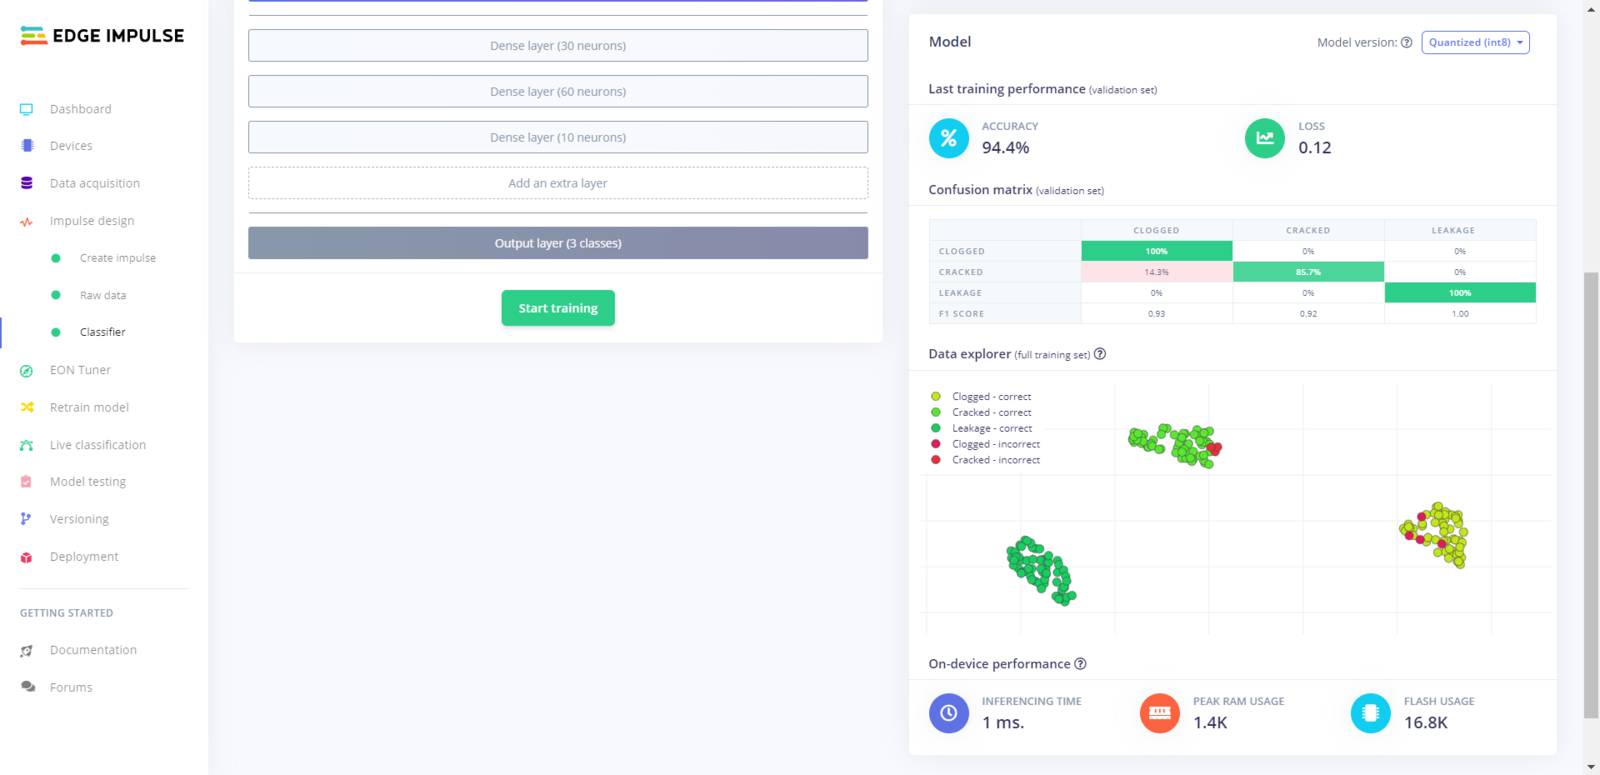
After uploading my training and testing samples successfully, I designed an impulse and trained it on pipeline diagnostic classes. An impulse is a custom neural network model in Edge Impulse. I created my impulse by employing the Raw Data processing block and the Classification learning block. The Raw Data processing block generate windows from data samples without any specific signal processing. The Classification learning block represents a Keras neural network model. Also, it lets the user change the model settings, architecture, and layers. :hash: Go to the Create impulse page. Then, select the Raw Data processing block and the Classification learning block. Finally, click Save Impulse.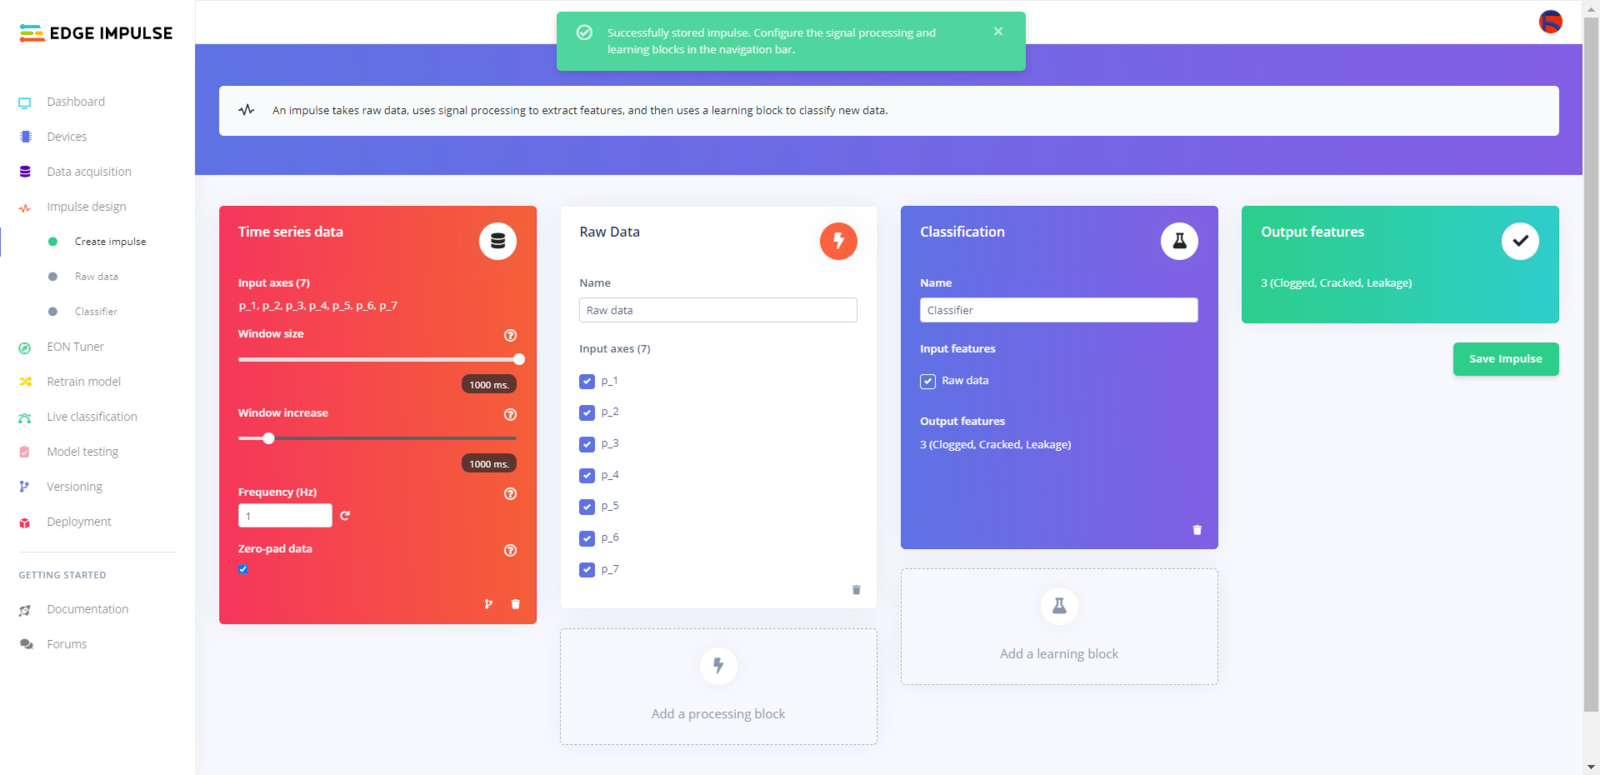
image
image
image
image
image
image
- Number of training cycles ➡ 50
- Learning rate ➡ 0.005
- Validation set size ➡ 20
- Dense layer (30 neurons)
- Dense layer (60 neurons)
- Dense layer (10 neurons)
image
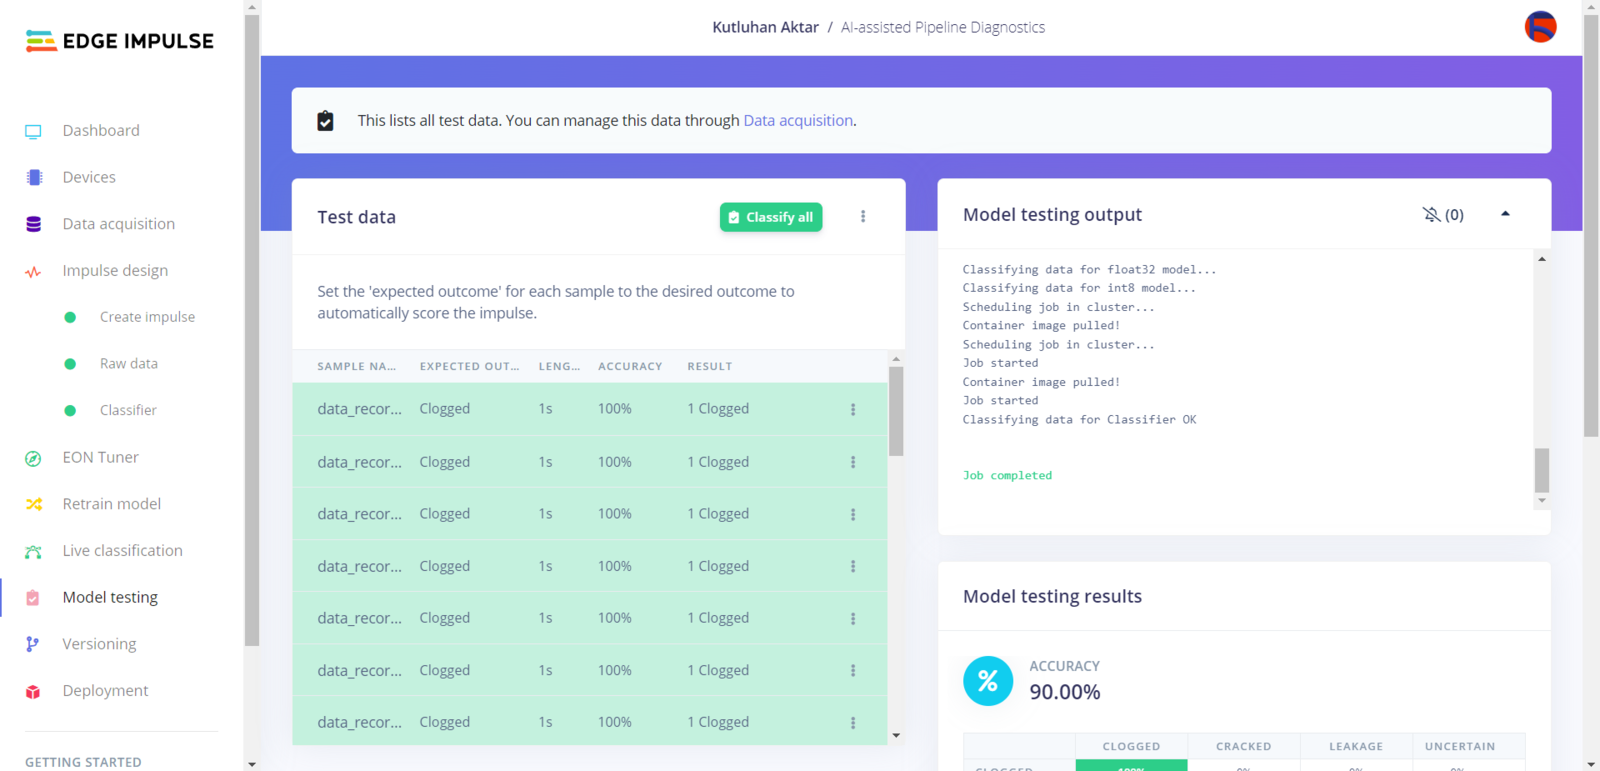
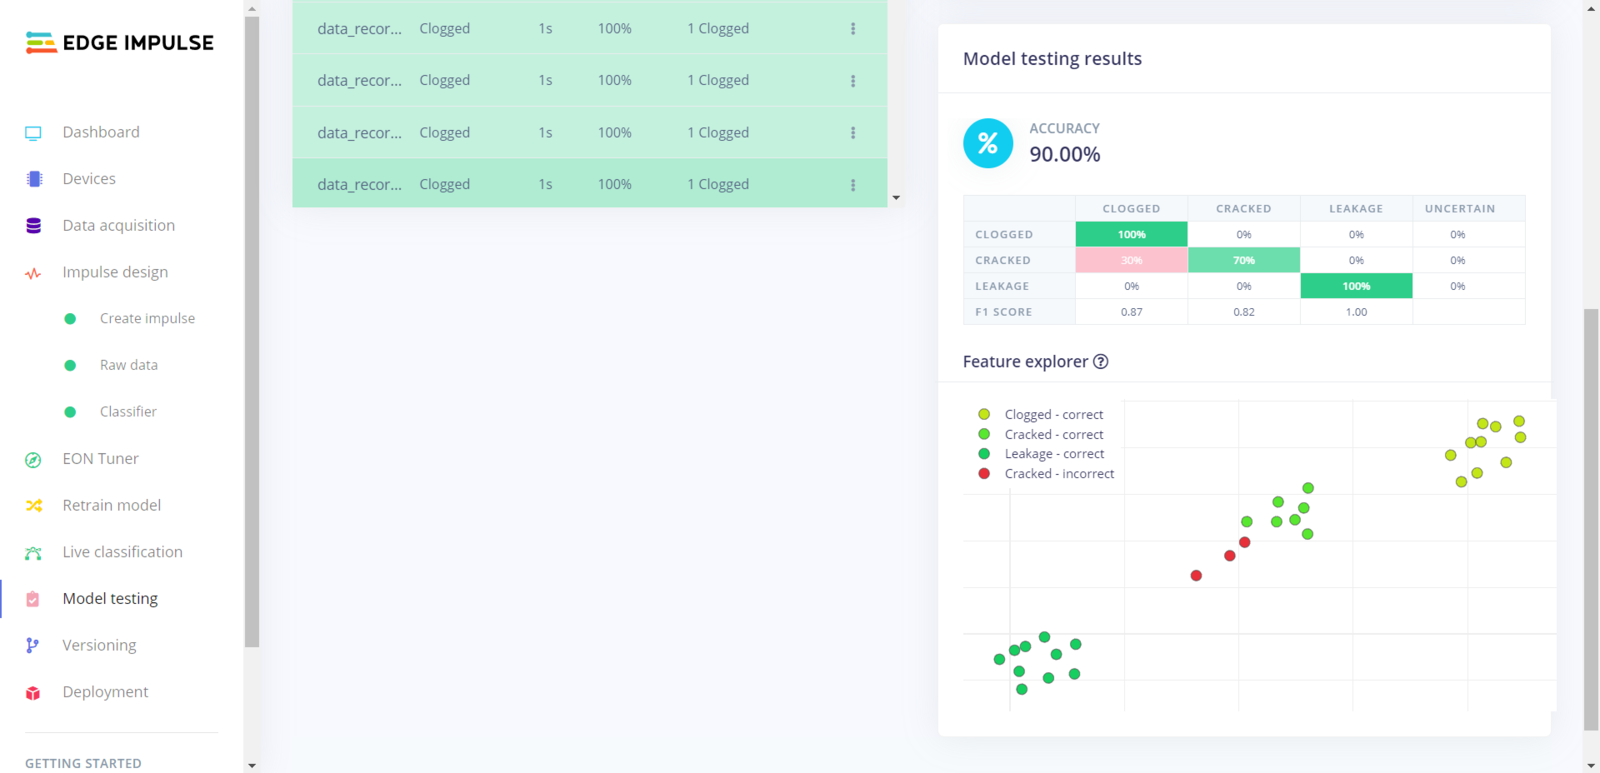
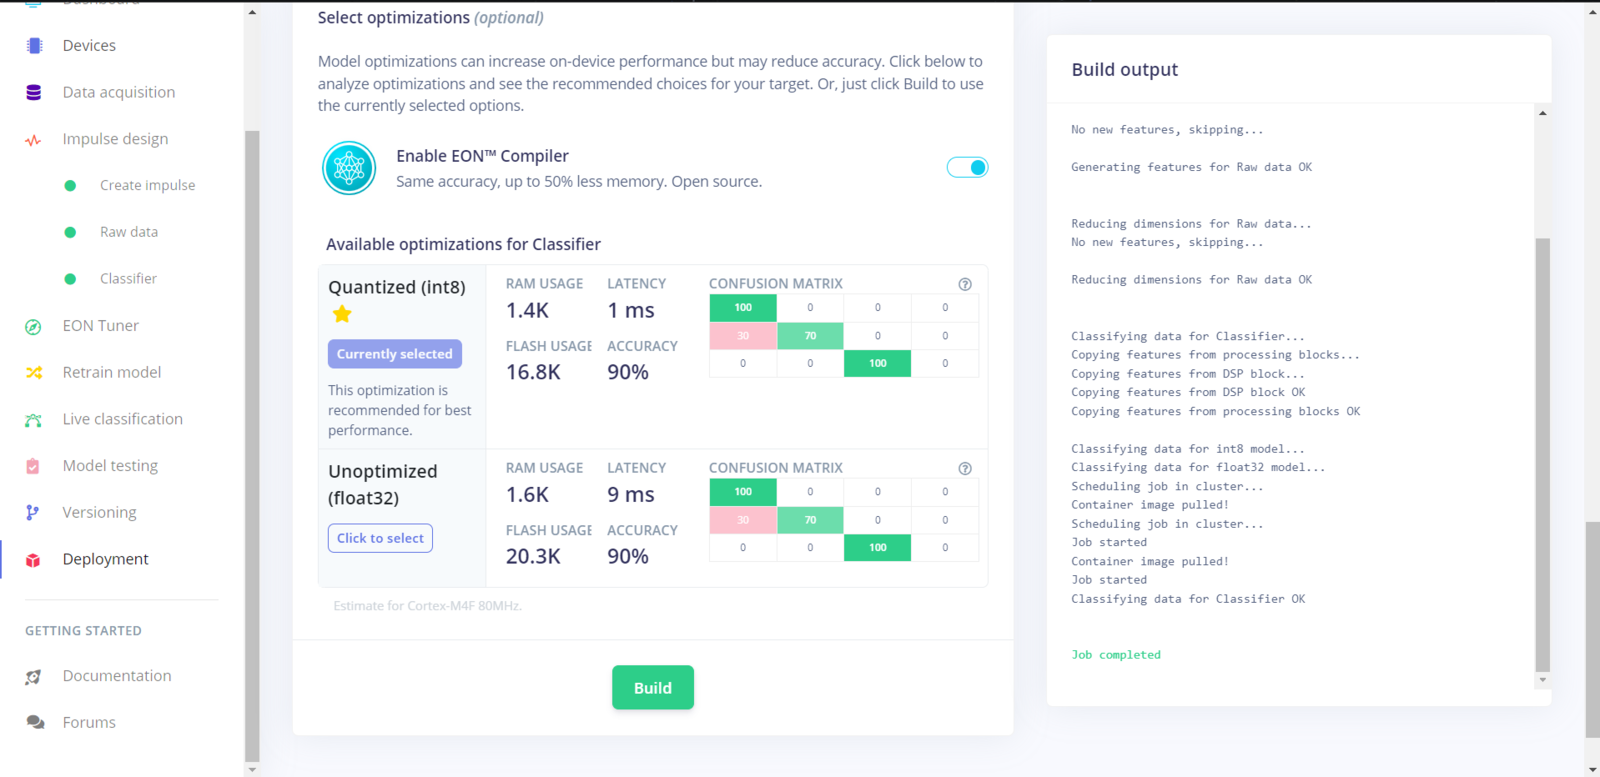
Step 6.4: Evaluating the model accuracy and deploying the model
After building and training my neural network model, I tested its accuracy and validity by utilizing testing samples. The evaluated accuracy of the model is 90%. :hash: To validate the trained model, go to the Model testing page and click Classify all.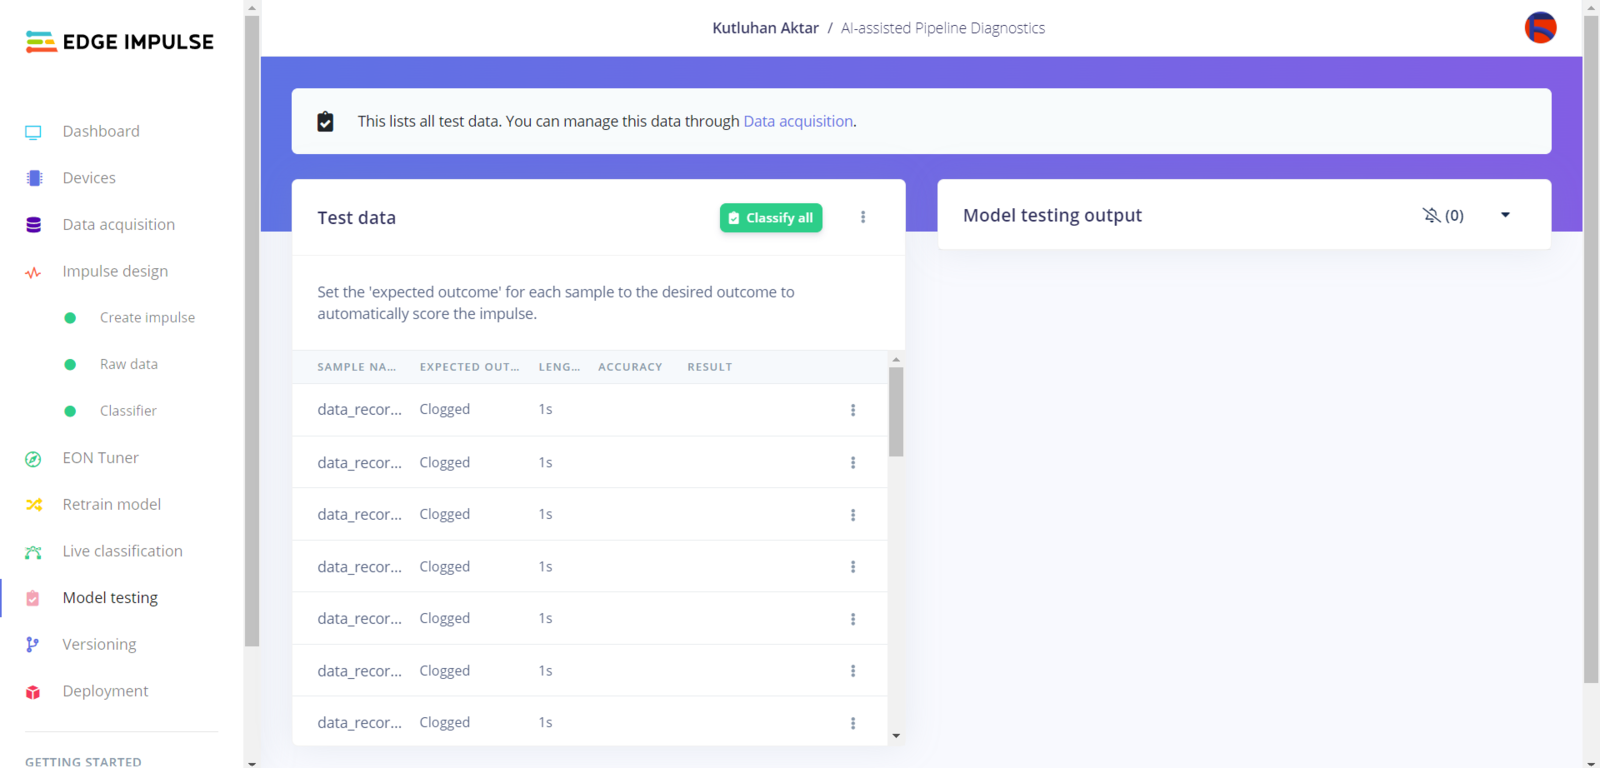
image
image
image
image
image
image
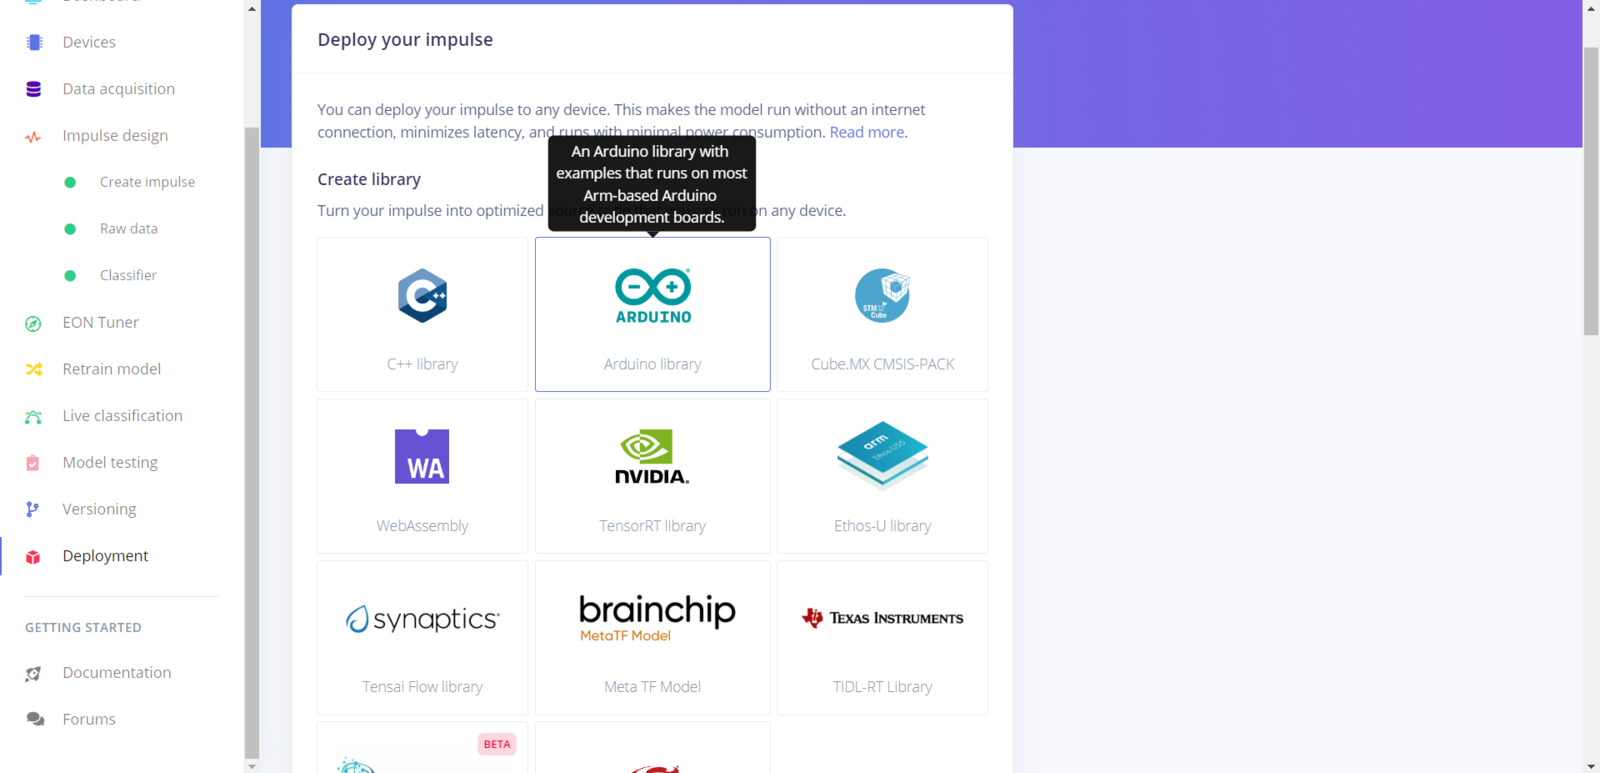
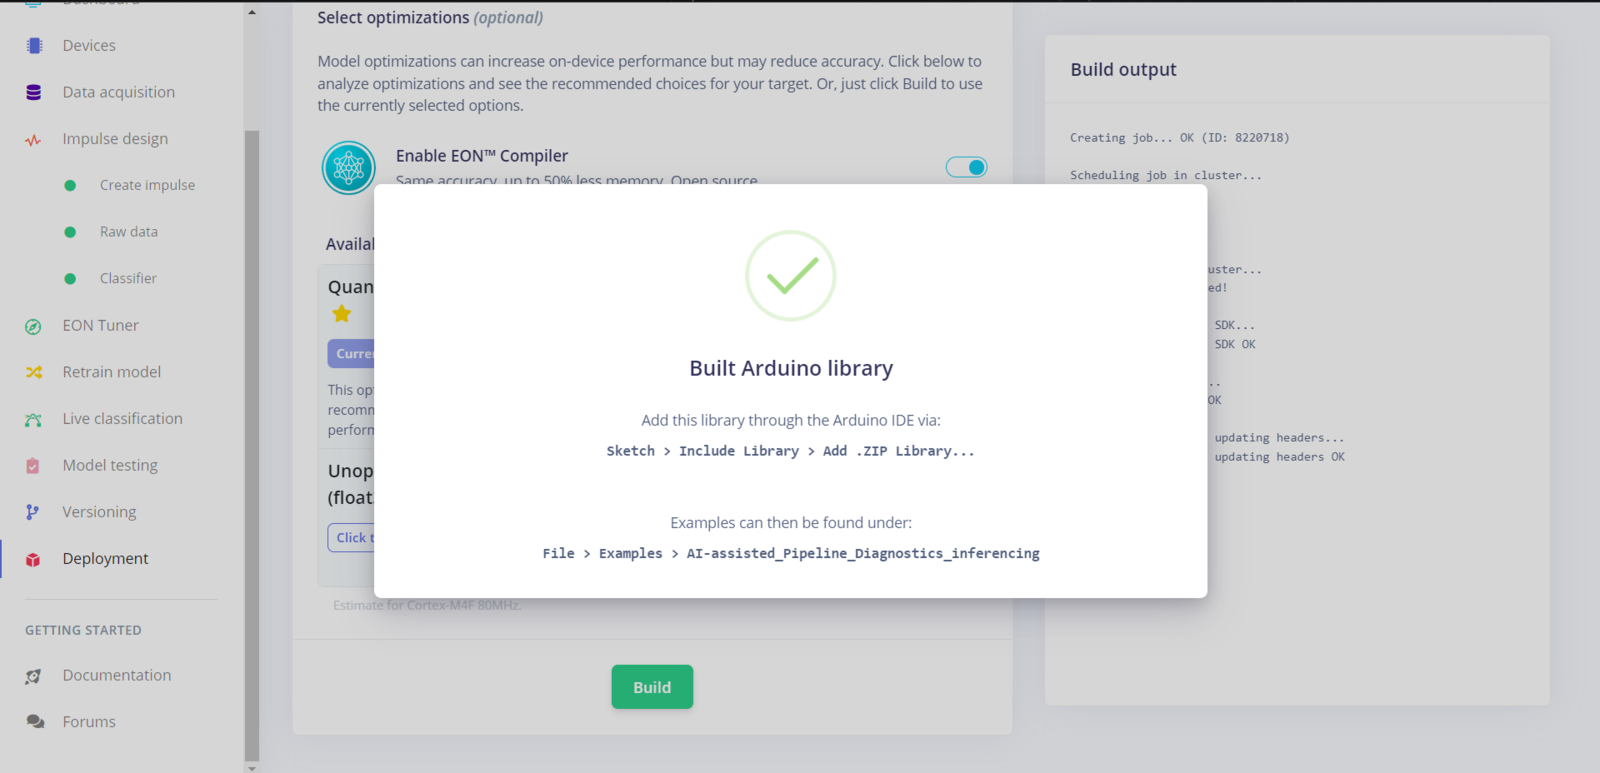
Step 7: Setting up the Edge Impulse model on Nicla Vision
After building, training, and deploying my model as an Arduino library on Edge Impulse, I needed to upload the generated Arduino library on Nicla Vision to run the model directly so as to create a user-friendly and capable mechanism operating with minimal latency, memory usage, and power consumption. Since Edge Impulse optimizes and formats signal processing, configuration, and learning blocks into a single package while deploying models as Arduino libraries, I was able to import my model effortlessly to run inferences. :hash: After downloading the model as an Arduino library in the ZIP file format, go to Sketch ➡ Include Library ➡ Add .ZIP Library… :hash: Then, include the AI_assisted_Pipeline_Diagnostics_run_model.h file to import the Edge Impulse neural network model.- Control Button (D) [Nano] ➡ Run Inference
- Clogged
- Cracked
- Leakage
image
image
image
image
image
image
image
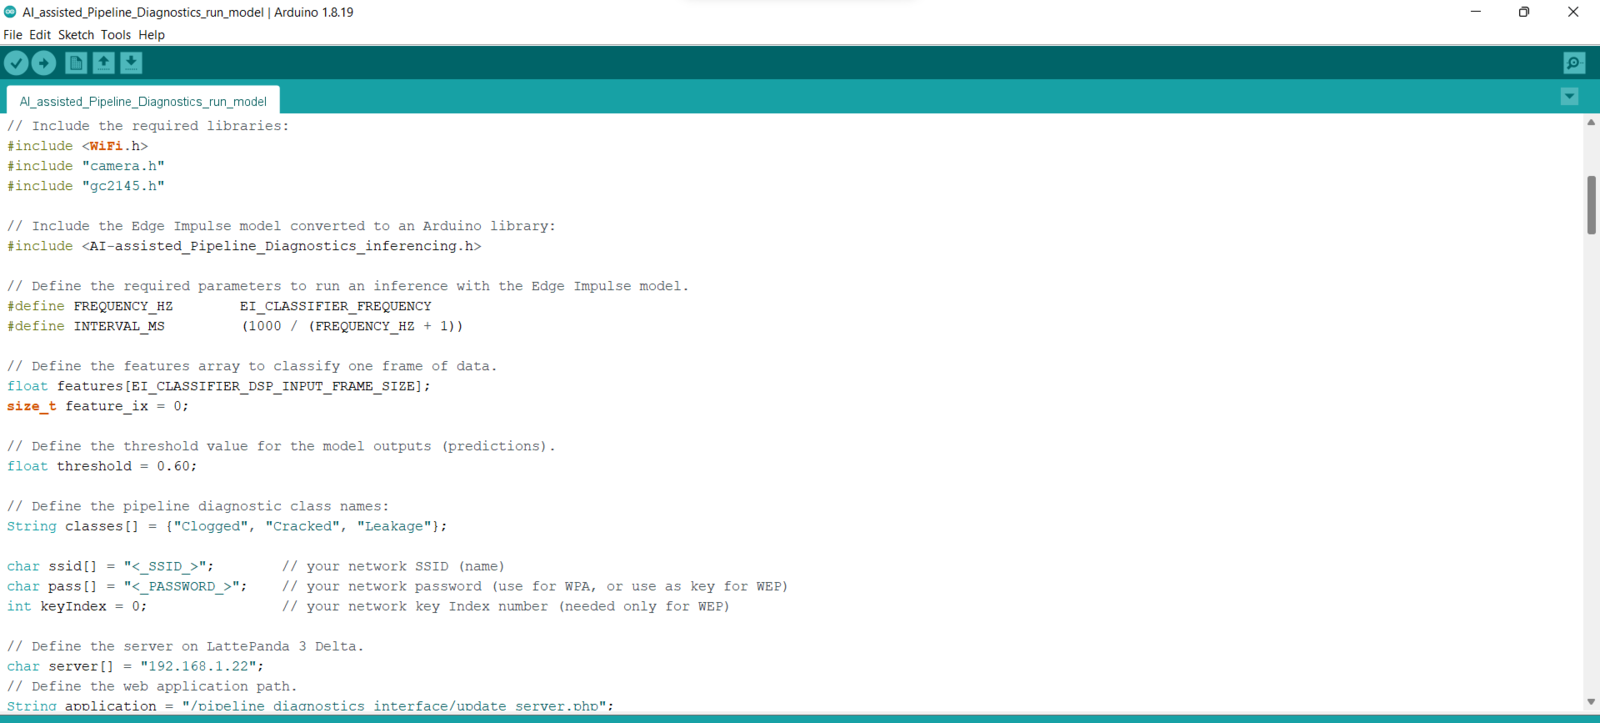
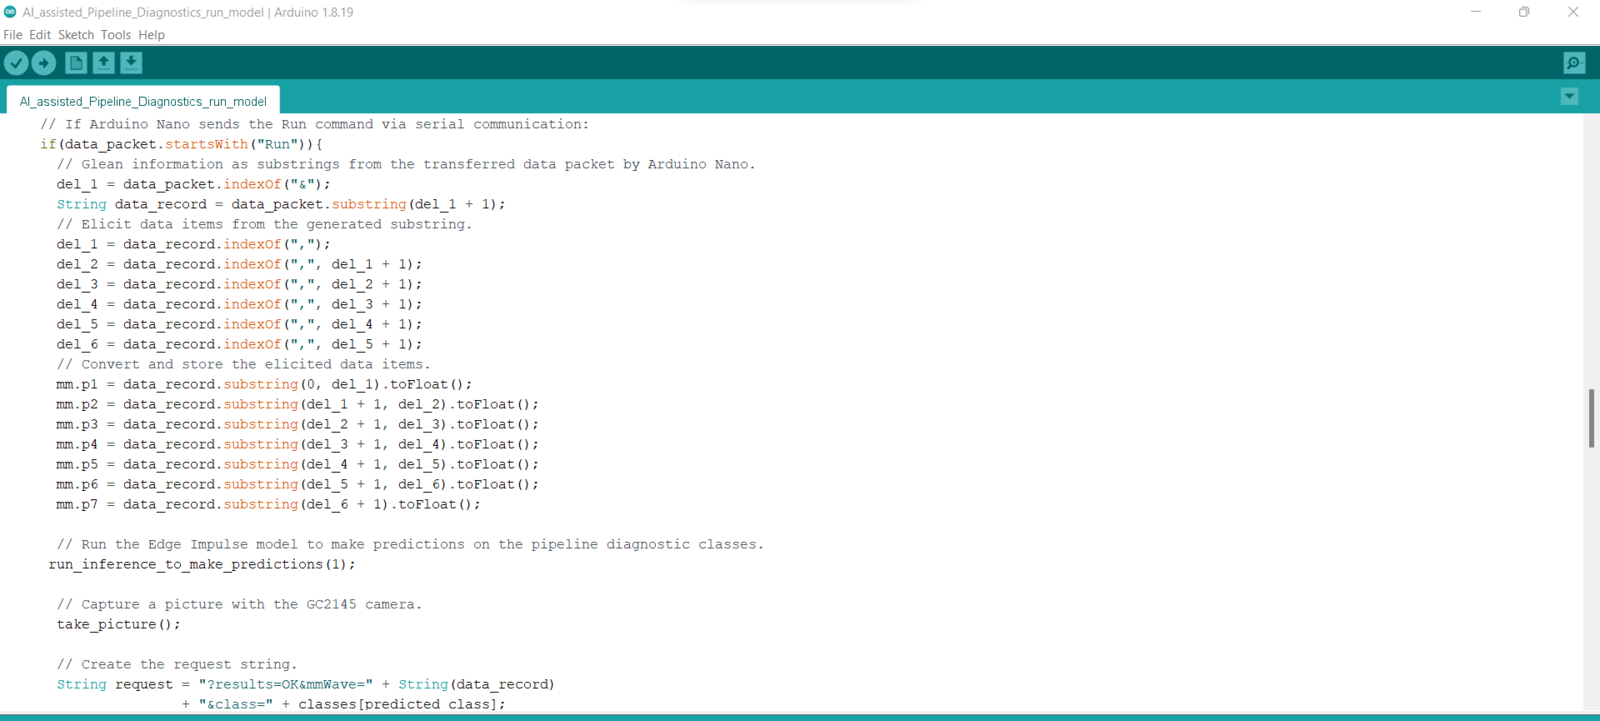
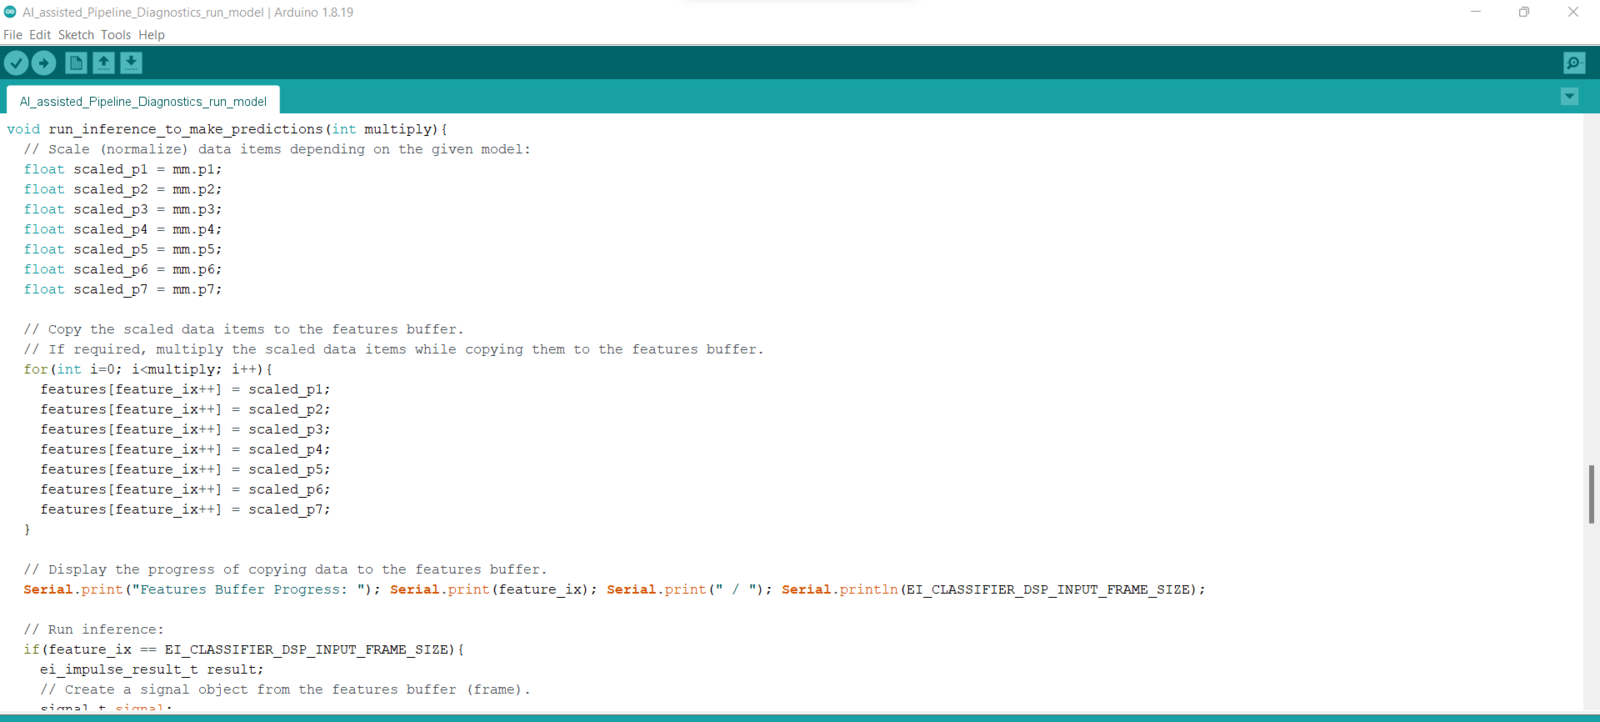
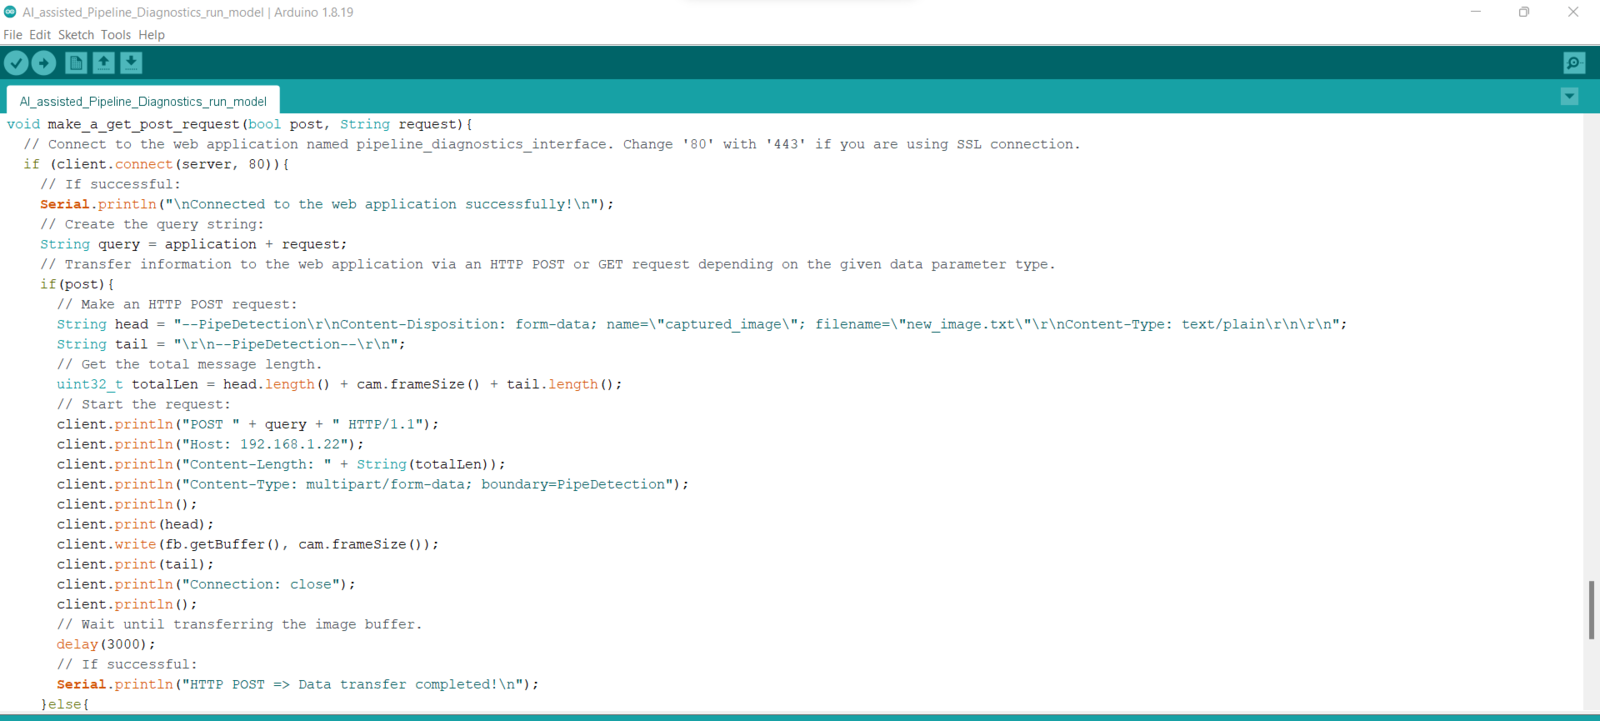
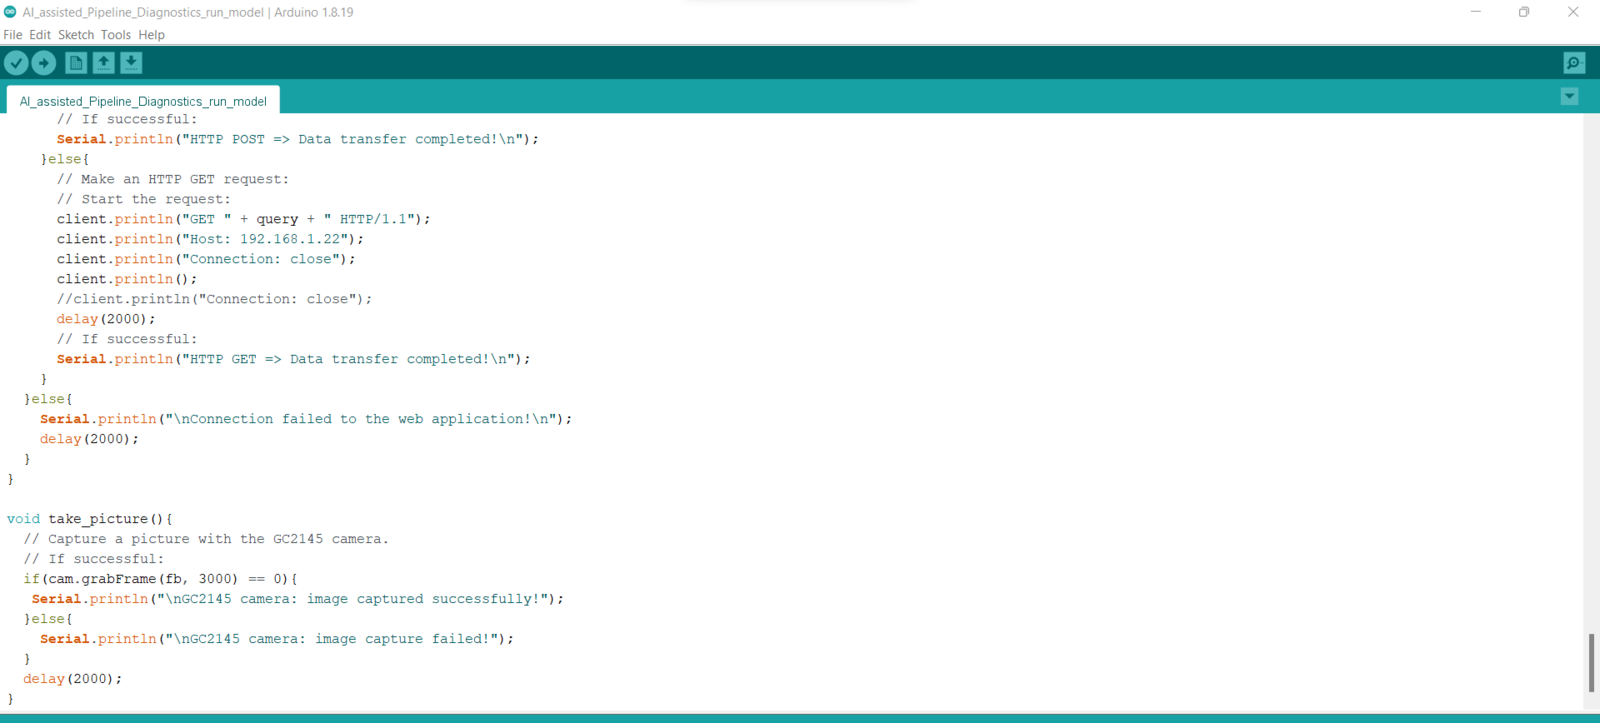
Step 8: Running the model on Nicla Vision to diagnose pipeline defects and transferring model results w/ captured images of the deformed pipes via POST requests
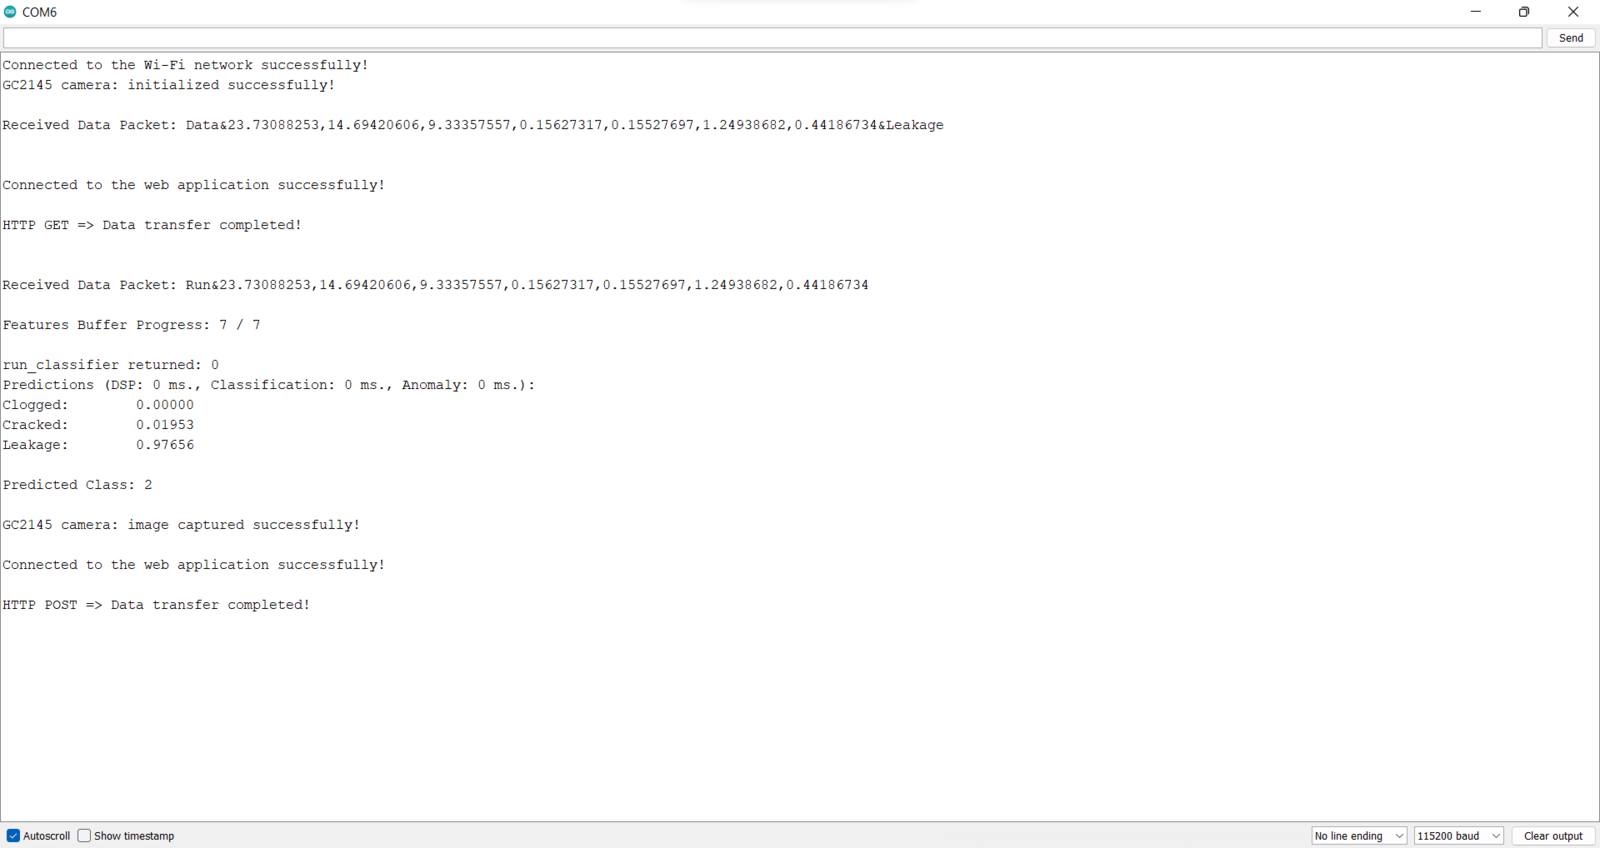
My Edge Impulse neural network model predicts possibilities of labels (pipeline diagnostic classes) for the given features buffer as an array of 3 numbers. They represent the model’s “confidence” that the given features buffer corresponds to each of the three different pipeline diagnostic classes [0 - 2], as shown in Step 6:- 0 — Clogged
- 1 — Cracked
- 2 — Leakage
image
image
image
image
image
image
image

image
image
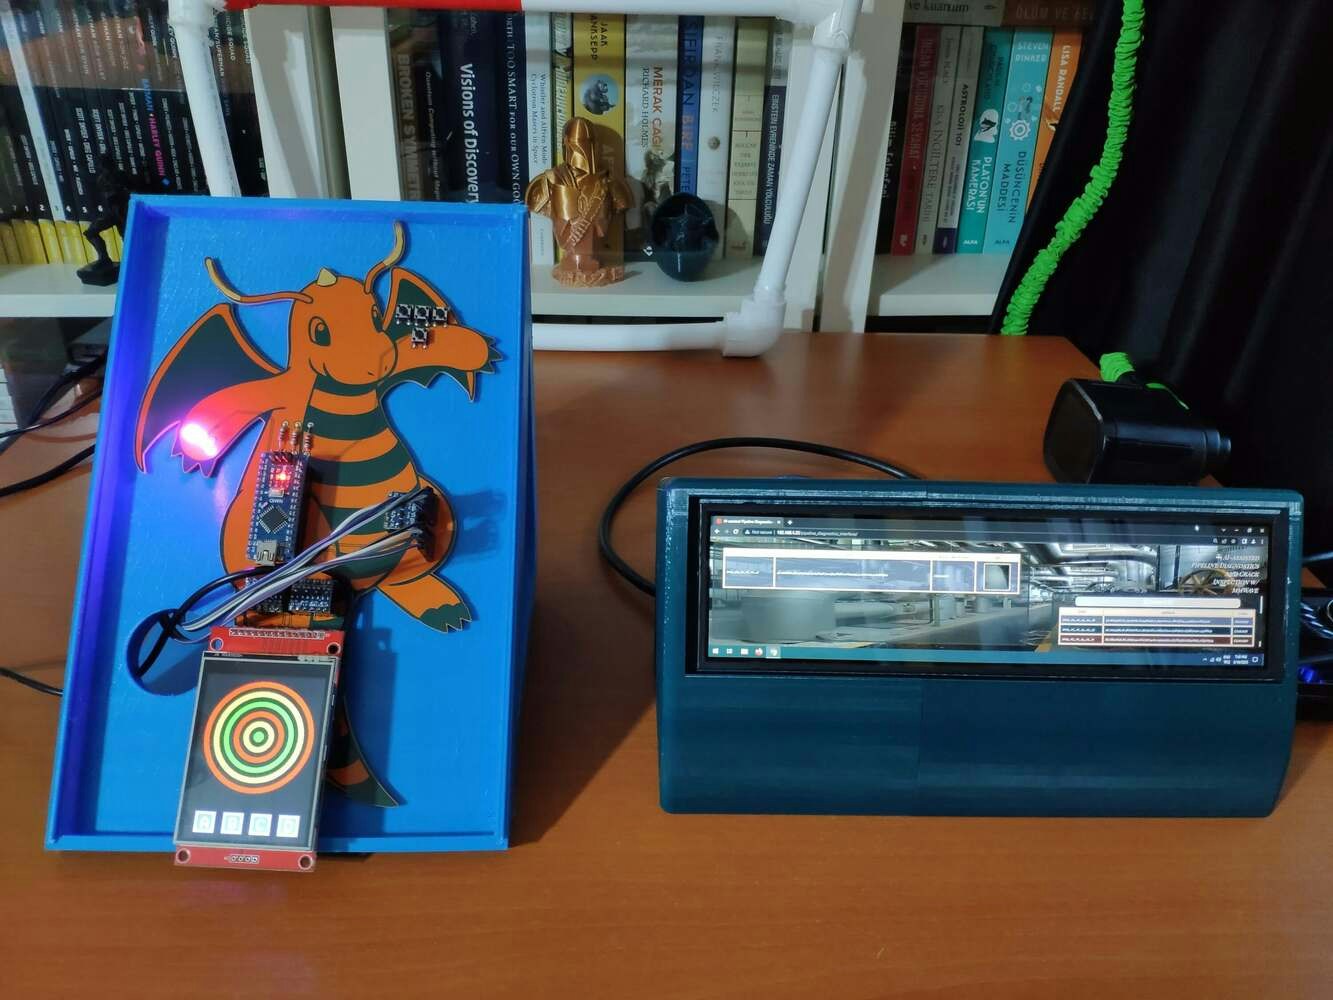
Videos and Conclusion
Data collection | AI-assisted Pipeline Diagnostics w/ mmWave Data collection (web app interface) | AI-assisted Pipeline Diagnostics w/ mmWave Experimenting with the model | AI-assisted Pipeline Diagnostics w/ mmWave Experimenting with the model (web app interface) | AI-assisted Pipeline Diagnostics w/ mmWaveFurther Discussions
By applying neural network models trained on pipeline diagnostic classes in detecting pipeline system defects, we can achieve to: 🚿🔎📲 keep machine operations sustainable, profitable, and stable, 🚿🔎📲 prevent faulty pipeline systems from engendering expensive manufacturing problems, 🚿🔎📲 assist small businesses with limited budgets in establishing an efficient and accurate pipeline diagnostics mechanism, 🚿🔎📲 reducing repair costs of high-value machine components, 🚿🔎📲 provide a non-destructive testing and evaluation (NDT&E) mechanism based on vibration characteristics.image
References
[^1] Ahmed Sachit Hashim, Bogdan Gramescu, Constantin Nitu, PIPE CRACKS DETECTION METHODS – A REVIEW, International Journal of Mechatronics and Applied Mechanics, 2018, Issue 3, https://ijomam.com/wp-content/uploads/2017/02/pag.-114-119\_PIPE-CRACKS-DETECTION-METHODS.pdf [^2] Prabhat Sharma, Bambam Kumar, Dharmendra Singh, Novel Adaptive Buried Nonmetallic Pipe Crack Detection Algorithm for Ground Penetrating Radar, Progress In Electromagnetics Research M, Vol. 65, 79-90, 2018, doi:10.2528/PIERM17101002 [^3] M. D. Buhari, G. Y. Tian and R. Tiwari, Microwave-Based SAR Technique for Pipeline Inspection Using Autofocus Range-Doppler Algorithm, IEEE Sensors Journal, vol. 19, no. 5, pp. 1777-1787, March, 2019, https://ieeexplore.ieee.org/document/8520883Schematics
image
image
image
image
image

image
image
image