Background

- Collect data from an ODrive motor controller (though any motor controller that allows querying power data can be used)
- Import our data into the Edge Impulse studio using the Data forwarder
- Discover how to create a K-means anomaly detection model that is small enough to run on a Raspberry Pi Pico
Equipment and software
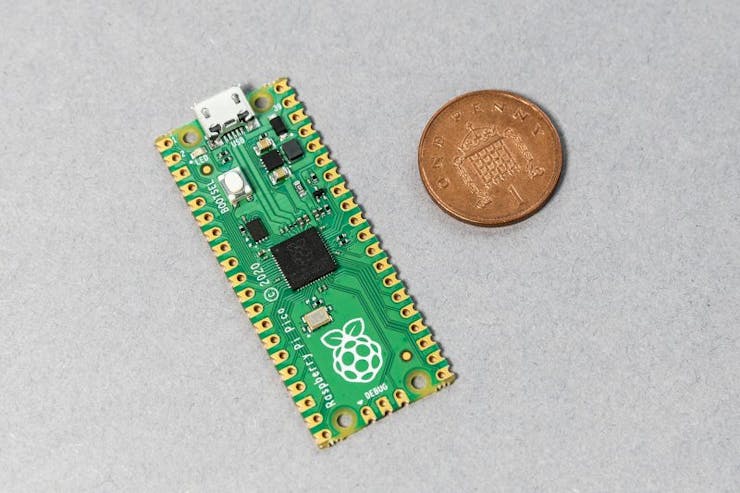
Most of the magic is going to happen in the Edge Impulse studio, so if you’re following along be sure to open a free account! For those who don’t know, Edge Impulse is an engineer-focused platform designed to streamline the process of building machine learning models for edge / embedded devices. Next, for our motor setup we will be using an ODrive V3.6 (24V) controller with a brushless motor (D5065) from the same company. ODrive manufactures affordable yet robust motor control hardware that can be interfaced with via USB or UART serial connection. Any motor controller that allows querying power data over serial connection can be used!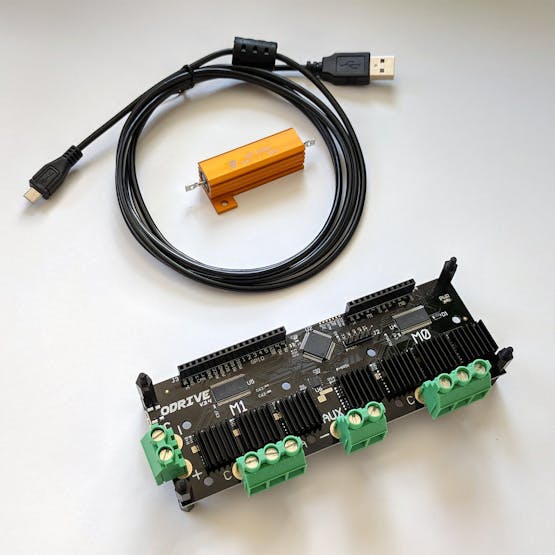
Before we get started…
…let’s define our goal here. This project is meant to serve as a “get started” reference for leveraging Edge Impulse and TinyML to perform industrial motor predictive maintenance (PdM). From a quick glance at the ODrive developer reference document it is plain to see that there are plenty of data elements that we could choose to create features and build our machine learning model, but regardless of what you choose for your specific use case the steps should be similar. For this tutorial we’ll be using motor power as the driving parameter for our predictive maintenance model. Without using any additional sensors and relying on motor power data alone we can create an anomaly detection model that can alert when faults are detected. In future tutorials we will explore the use of classification models to recognize specific faults such as bearing faults, axle misalignments, axle disjoints, etc. For now we will train our model using nominal, intact data, and use anomaly detection to detect behavior that falls outside of the norm.What can motor power data tell us?
Ohm’s law tells us that power = current * voltage, therefore tracking a motor’s power consumption allows us to consider the behavior of both current and voltage concurrently. A popular method used to monitor motor behavior is “Instantaneous Power Signature Analysis”, or IPSA. Essentially a motor’s power is analyzed in the frequency domain in order to uncover external interference - whether mechanical or electrical. You can read more about IPSA in this academic article:In this tutorial we will be using spectral analysis to generate features for our anomaly detection model.
Predictive Maintenance by Electrical Signature Analysis to Induction Motors. 10.5772/48045. Bonaldi, E.L. & Oliveira, Levy & Borges da Silva, Jonas & Lambert-Torres, Germano & SILVA, L.E.. (2012). [page 500].
Data forwarder One of Edge Impulse’s most convenient tools is their data forwarder. This tool allows you to stream data directly to the Edge Impulse platform regardless of the data source. We will use an Arduino script to create a data stream that the data forwarder can listen to.
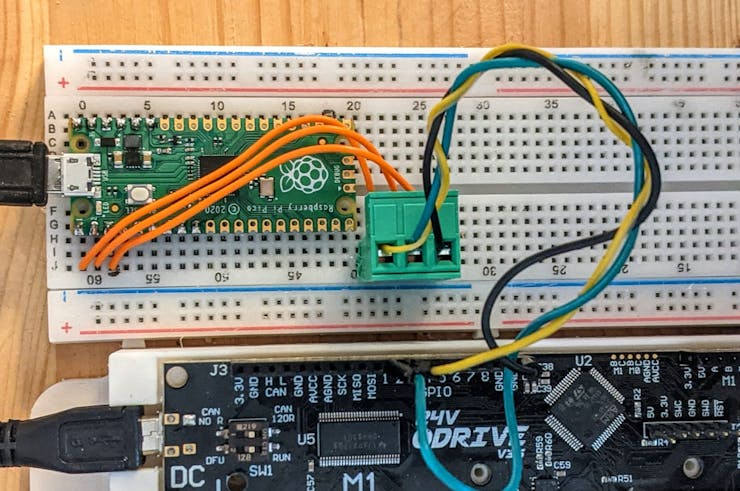
It’s recommended to check out the official guide on Edge Impulse’s data forwarder here, and check out the ODrive specific data forwarding Arduino script attached to this tutorial (“odrive_data_forwarding.ino”)!We’ll run the attached code on our Arduino while it’s connected via UART to our ODrive board. You can read about the ODrive UART interface here.
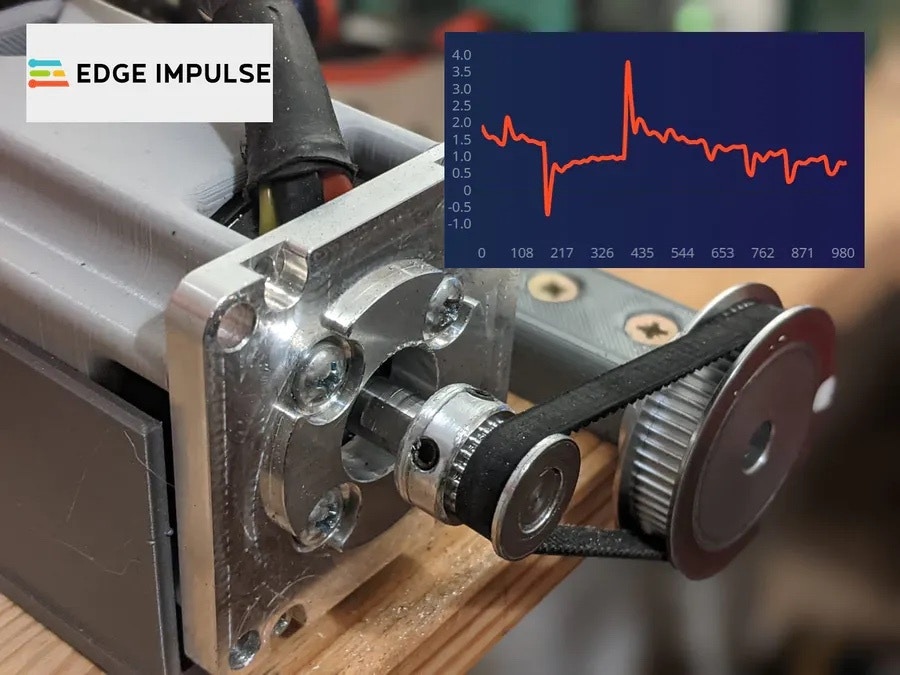
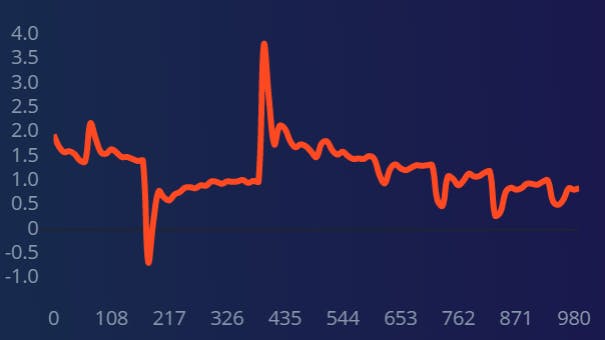
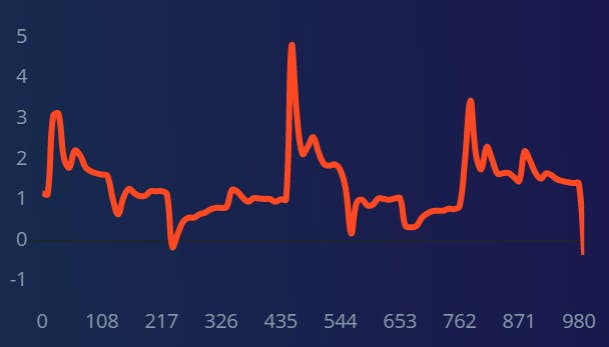
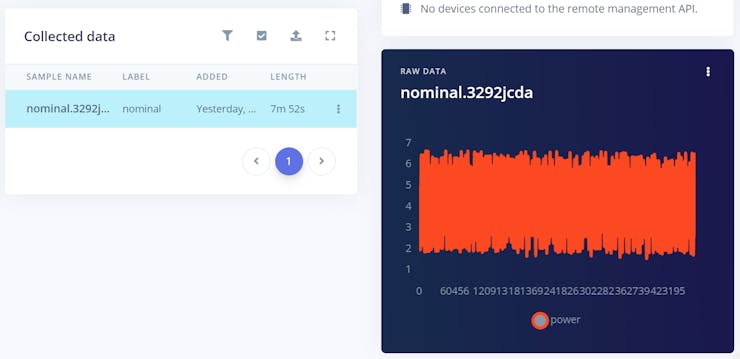
Collecting data We need to collect data to train our machine learning model. For this tutorial we will be recording only nominal performance. That means there is no need to perform fault simulation in order to detect “faulty” data, which can be an intrusive and dangerous process. The anomaly detection model will tell us when the power signal from the motor is behaving in a way that the model hasn’t seen before. There are plenty of ways to upload training data using Edge Impulse. For example, it’s possible to upload .CSV files with the relevant data, or you can use the convenient Edge Impulse Data Forwarder to stream data live over serial, which is what we’ll be doing in this tutorial. Let’s say we set a motor rotating with random changes in velocity in order to simulate the motion of a robotic arm or something of the like. Let’s take a look at 1 second of power consumption data from this motion:
Streaming our data to the Edge Impulse studio
Assuming you’ve gone through the Getting Started guide and have made an account with Edge Impulse, go ahead and make a new project. Following the guide for using Edge Impulse’s data forwarder we should see our virtual device appear when we click Data acquisition: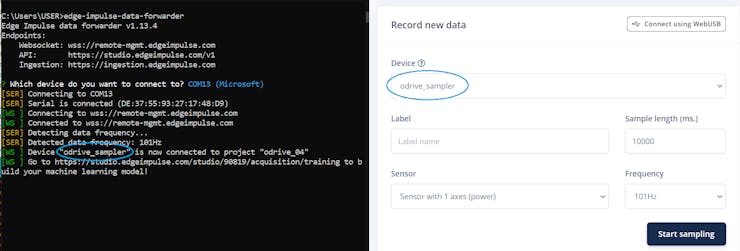
Creating an impulse
It’s time to create an impulse, which is comprised of a series of configuration / processing blocks. First up is setting the type of data we’re using, which in this case is “Time series data”. This block will split our long samples into shorter windows. Next we decide what type of processing we want performed on our data. In this tutorial we’ll be using “Spectral analysis”, which looks at the behavior of the signals in the frequency domain. Finally we decide what sort of neural network we want to feed the results of the spectral analysis to. For this we will select “Anomaly detection (K-means)”: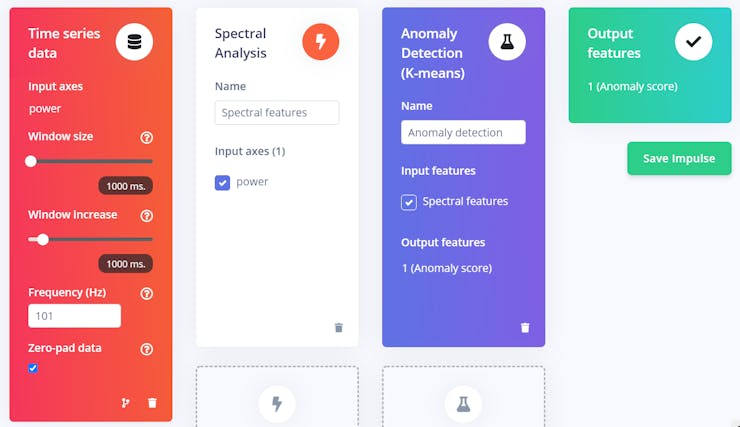
Spectral analysis
When we train our machine learning model we’re not actually feeding raw, signal level samples to the model, rather we feed it features generated by digital signal processing. Using spectral analysis we can create sets of information about how our signal behaves in the frequency domain.After we click “Save Impulse”, let’s navigate to the “Spectral analysis” window. Here we can make adjustments to the DSP block in our impulse. Among other things we can set filter types and immediately view the filtered data. The default filter setting is a low pass filter, but this can and should be adjusted according to the type of anomalies the engineer is trying to detect. Once we’re happy with our DSP block settings, we can click “Save parameters” and then navigate to the next screen - “Generate features”.
Generating features
Now we’re ready to apply the signal processing to our data. In the “Generate features” screen, click “Generate features” and wait a few moments for Edge Impulse to create spectral features for each one of the samples: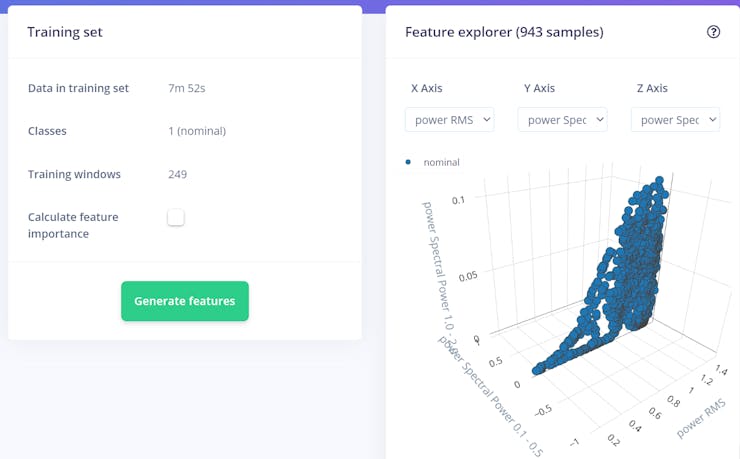
Anomaly Detection
We’re ready to move on to the next block where we create our machine learning model. We’re almost done! Once we’ve generated the DSP features we can navigate to the next screen “Anomaly detection” from the menu on the left. On this screen we can set the number of clusters, as well as select the axes according to which our data will be clustered. For this example all axes were selected, but if you know that certain axes are more / less important it’s best to select them accordingly (this can be determined by using samples where the motor is experiencing faulty behavior and using the Calculate feature importance _option in the Generate features section. More on this here.)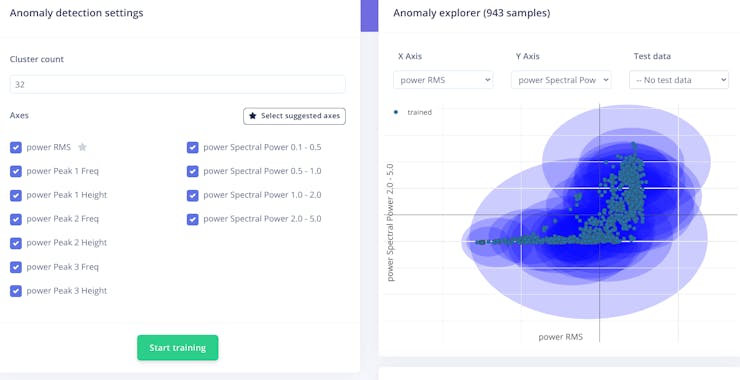
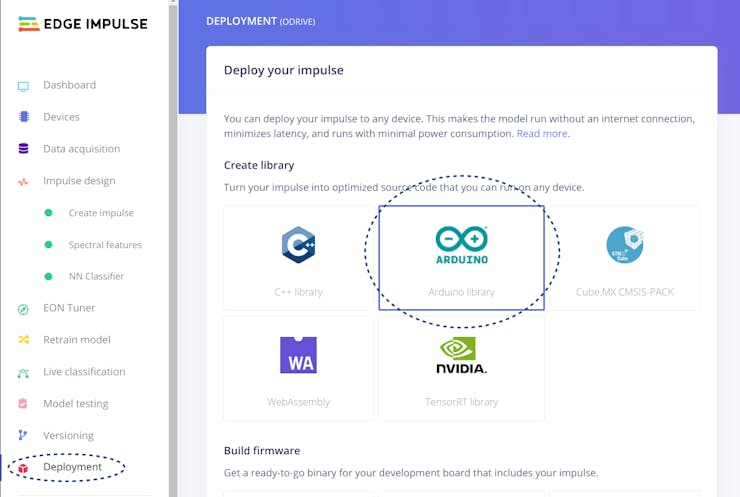
Deploying our model
Our model is ready for deployment in the form of our choosing! For this tutorial we’ll export our model as an Arduino library that we can invoke from within our custom Arduino scripts. Navigate to the “Deployment” screen, select “Arduino library”, and hit “Build” on the bottom of the screen.