Introduction
Sensors are utilized in everything from personal computers, smartphones, cars, airplanes, industrial equipment, even modern fans and refrigerators contain sensors! For some use cases, simple computers are built with a single sensor. For example, a refrigerator will have a temperature sensor, automatic lights will use a motion sensor, a television will use an infrared sensor to receive commands from a remote, etc. However, for advanced use cases, there is need to gather data from multiple sensors so that the system can get a better understanding of the situation. This helps to reduce some uncertainties that come when using an individual sensor.Sensor Fusion, Simply Visualized
To understand sensor fusion, let us consider the image below. In the image, we can see two different scenarios. In the first, a lady is walking on the road and there is a billboard which shows a picture of candles. In the next scenario, we see a gentleman walking along a road that has fire. In these two situations, it is clear that the gentleman is walking on a dangerous path since there are “real” flames. The lady will simply look at the stunning candles, and continue walking.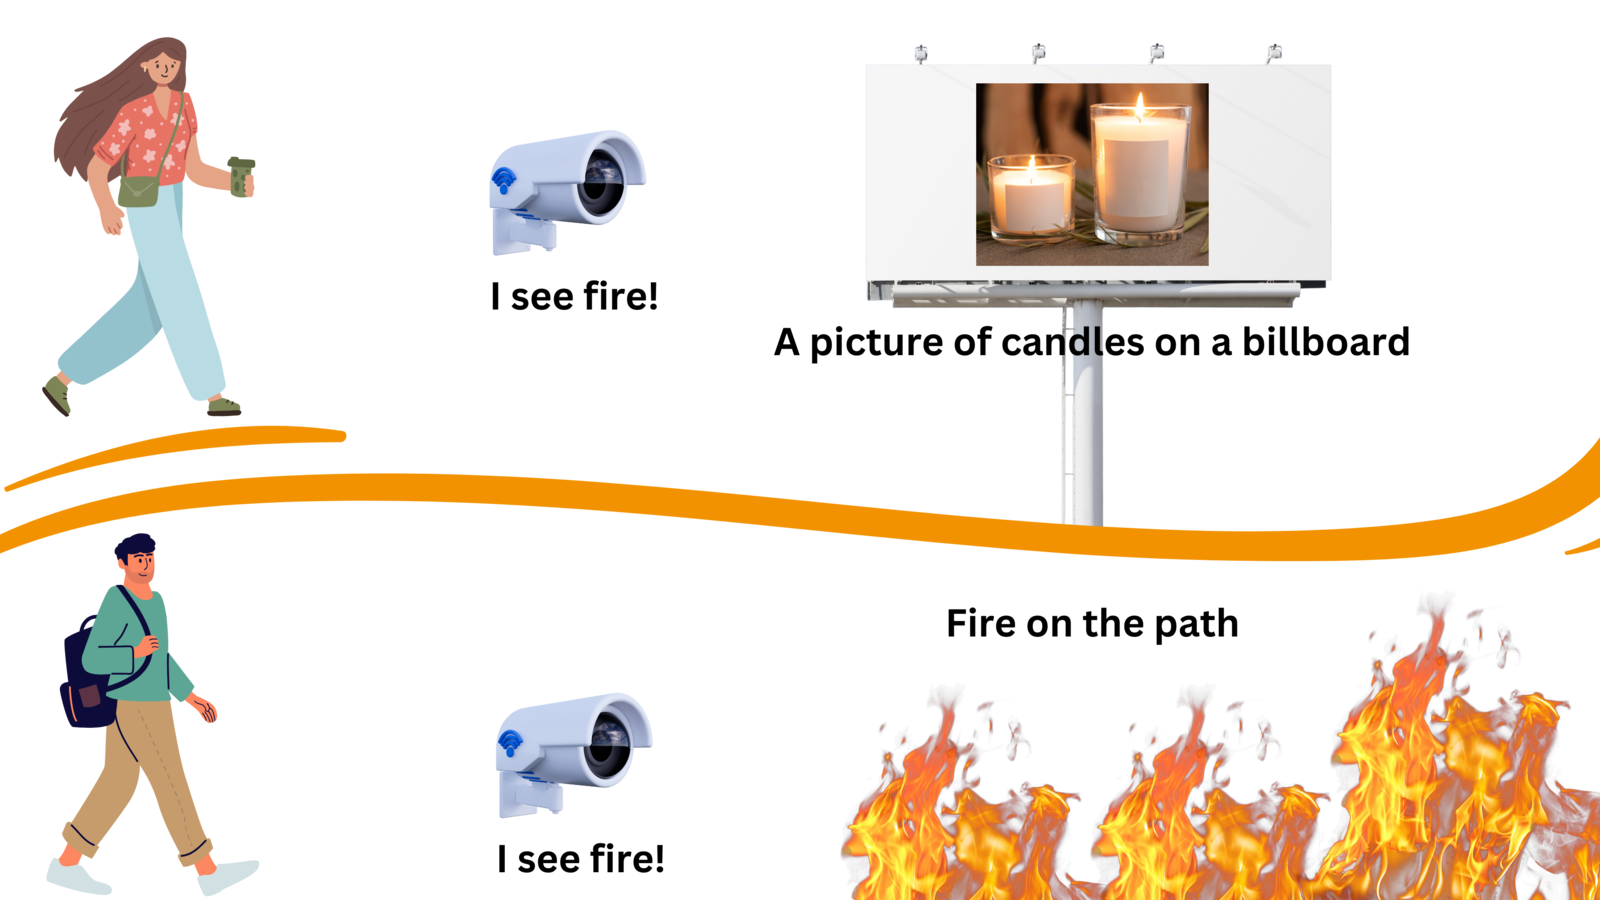
Project Use-Case Demonstration
One of our greatest fears is the danger of a fire in our homes, workplaces, on our properties, or even while we are inside vehicles. Although devices and algorithms have been created to detect fires, they have their limitations. In some cases, there are limitations that are obtained by using the vision sensors, while in others a smoke detector can fail to detect a fire if the smoke is not reaching the sensor. To demonstrate sensor fusion, I trained a Machine Learning model to detect if an indoor fire is present using both image and environmental (temperature) data. I used a custom multi-input Convolutional Neural Network (CNN) model to classify if there is a fire or not. To achieve this, I utilized a tensor slicing technique to work with sub-sections of tensors. Each input to the model consists of both an image and a corresponding scalar value (temperature). The model’s input tensor is sliced into an image and temperature tensor. The outputs from these two tensors are then combined and processed further to produce an output (classification of the various classes). The tensor slicing technique is advantageous in this case as well because Edge Impulse does not support multi-input models at the time of this writing. Finally, after training and testing the model, I used the Edge Impulse platform to deploy the sensor fusion model to an Arduino Tiny Machine Learning Kit.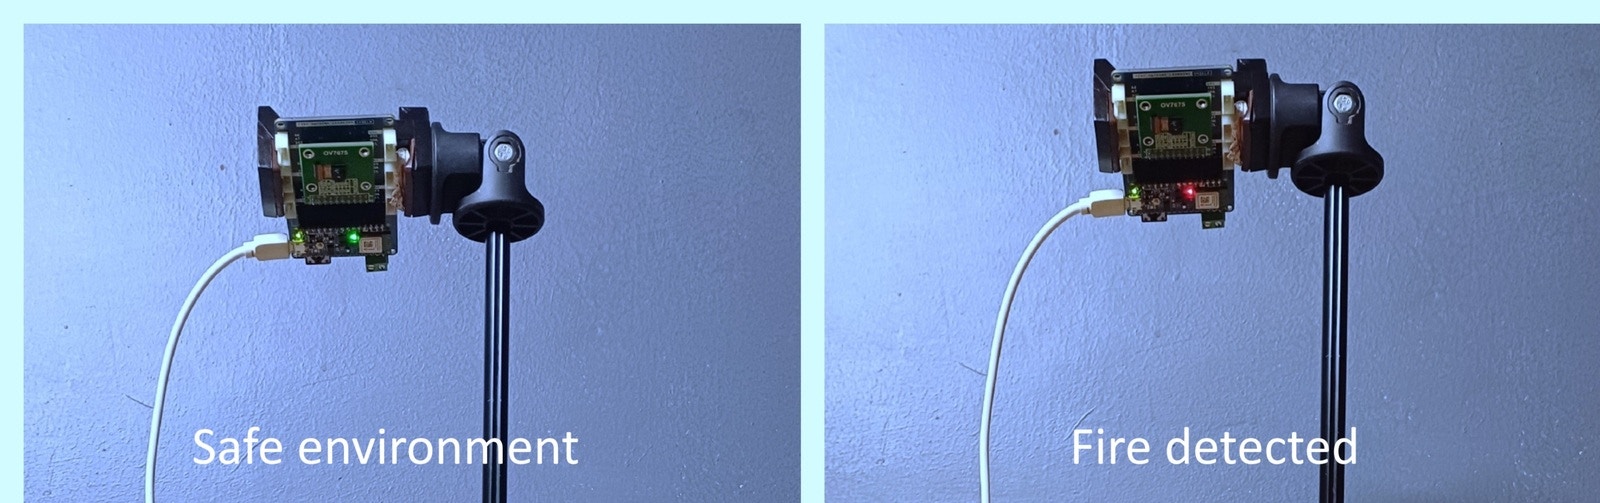
Arduino - fire and no fire
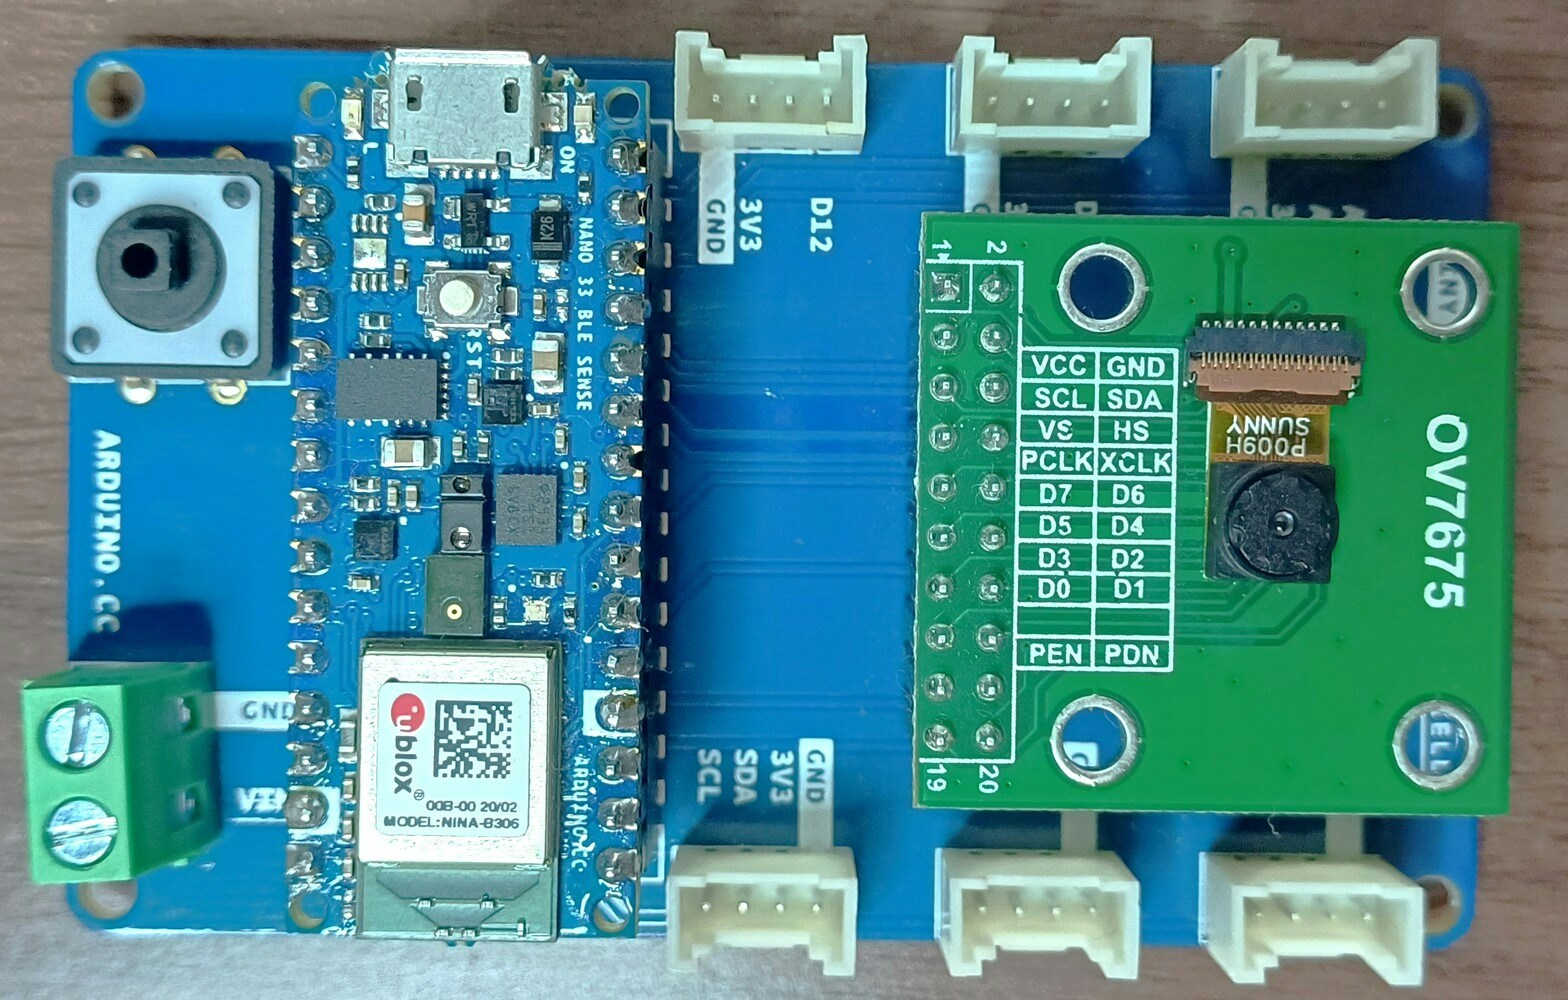
Arduino TinyML Kit
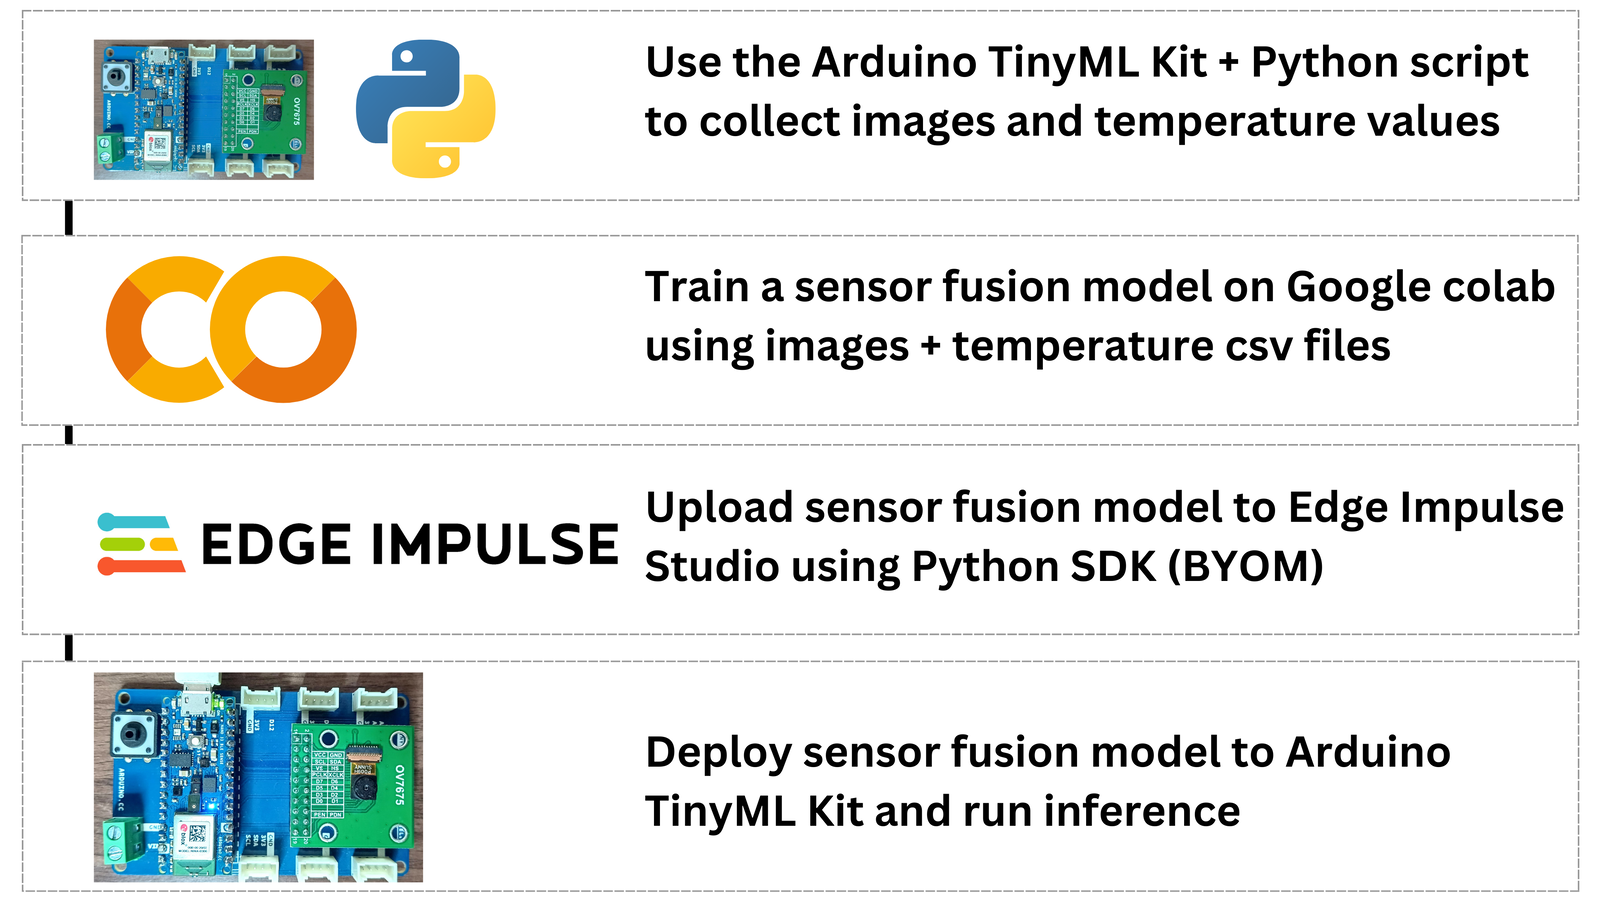
Project flow
Components and Hardware Configuration
Software components:- Arduino IDE
- Python
- Google Colab
- Edge Impulse Studio account
- Arduino TinyML Kit
- A personal computer
Data Collection Process
In this project, the Machine Learning model will be using an image and a temperature value as the inputs. The goal is to train a model to effectively classify if an environment has a fire or not. I created two classes for the different environments:fire and safe_environment. That being said, it sounded like an easy task.
First, I created an Arduino sketch for the Arduino Nano 33 BLE Sense. The Arduino code records the room temperature using the onboard HTS221 temperature sensor and prints it via UART. Afterwards, the code captures an image using the OV7675 camera module. While working with the OV767X library, I realized that the code takes a very long time to capture an image. In this case, I modified the nano_33ble_sense_camera.ino camera example from Edge Impulse’s Arduino library deployment to capture an image. The Edge Impulse’s Arduino camera code for the OV7675 has a custom driver that makes it faster to get image data from the camera. After an image has been captured, it is then encoded to base64. For this, I utilized the open-source Edge Impulse’s Arduino Nano 33 BLE Sense firmware. From the code, I used parts of the take_snapshot function to take a snapshot, encode it as base64 and print it to UART. With this code, the Arduino Nano 33 BLE Sense constantly samples a snapshot and temperature value, and they are then printed via UART (Serial). Note that it is not a good idea to send Strings via Serial due to memory leaks, but in this case I worked with Strings. The image width and height can be controlled with the variables WIDTH and HEIGHT respectively; the default image size is 240x240 pixels. Note that increasing the image dimensions will increase the time that the Arduino board will take to capture an image and also for the Python script to decode the base64 data and save it to a .JPG image.
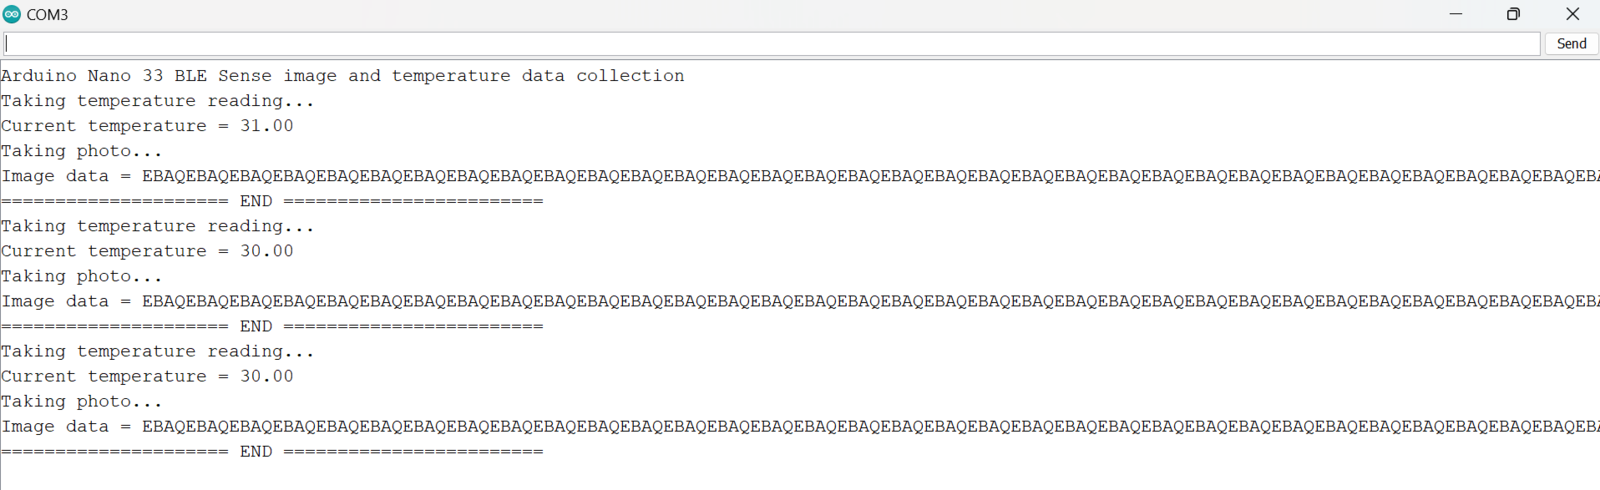
Arduino Nano 33 BLE Sense data collection logs
number_of_samples_to_collect.
To use the Arduino code and Python scripts to create a dataset, we first upload the Arduino code to an Arduino Nano 33 BLE Sense. Once the code is uploaded, we identify the COM port of the board and update the SERIAL_PORT variable accordingly in the Python script. Install the Python libraries on your computer using pip install -r requirements.txt and finally run the Python script with the command python read_and_save_serial_data.py. The Python script will automatically process the serial data, save photos as .JPG, and store temperature values in a .CSV file. The images are numerically numbered, and their file names are also put in the .CSV file, the same row as the temperature recorded at the moment the photo was taken.
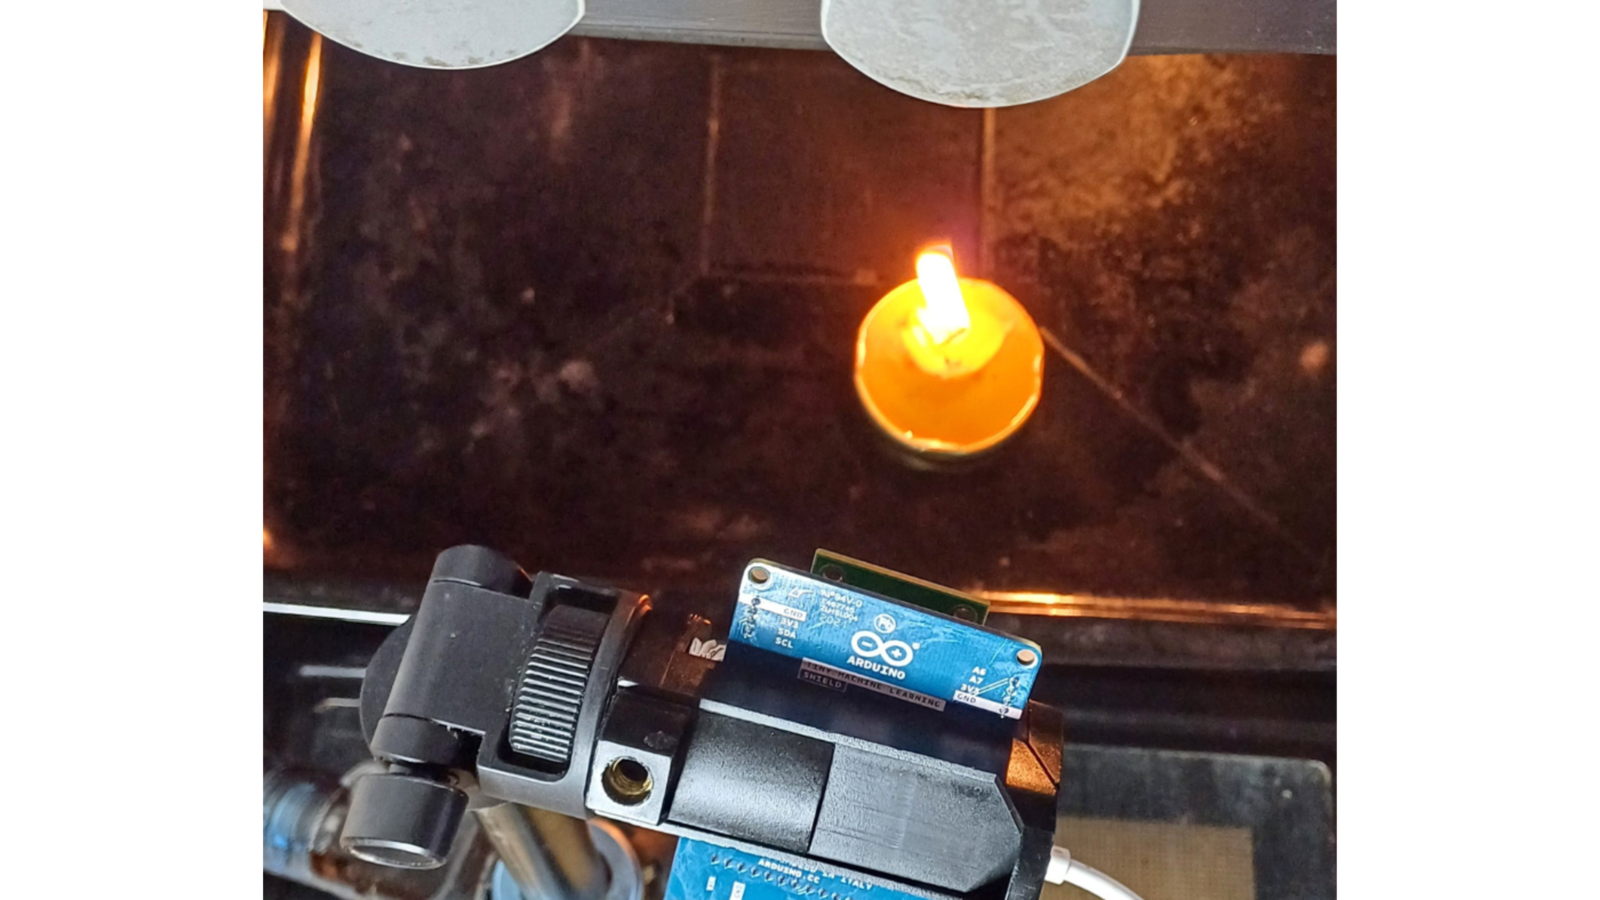
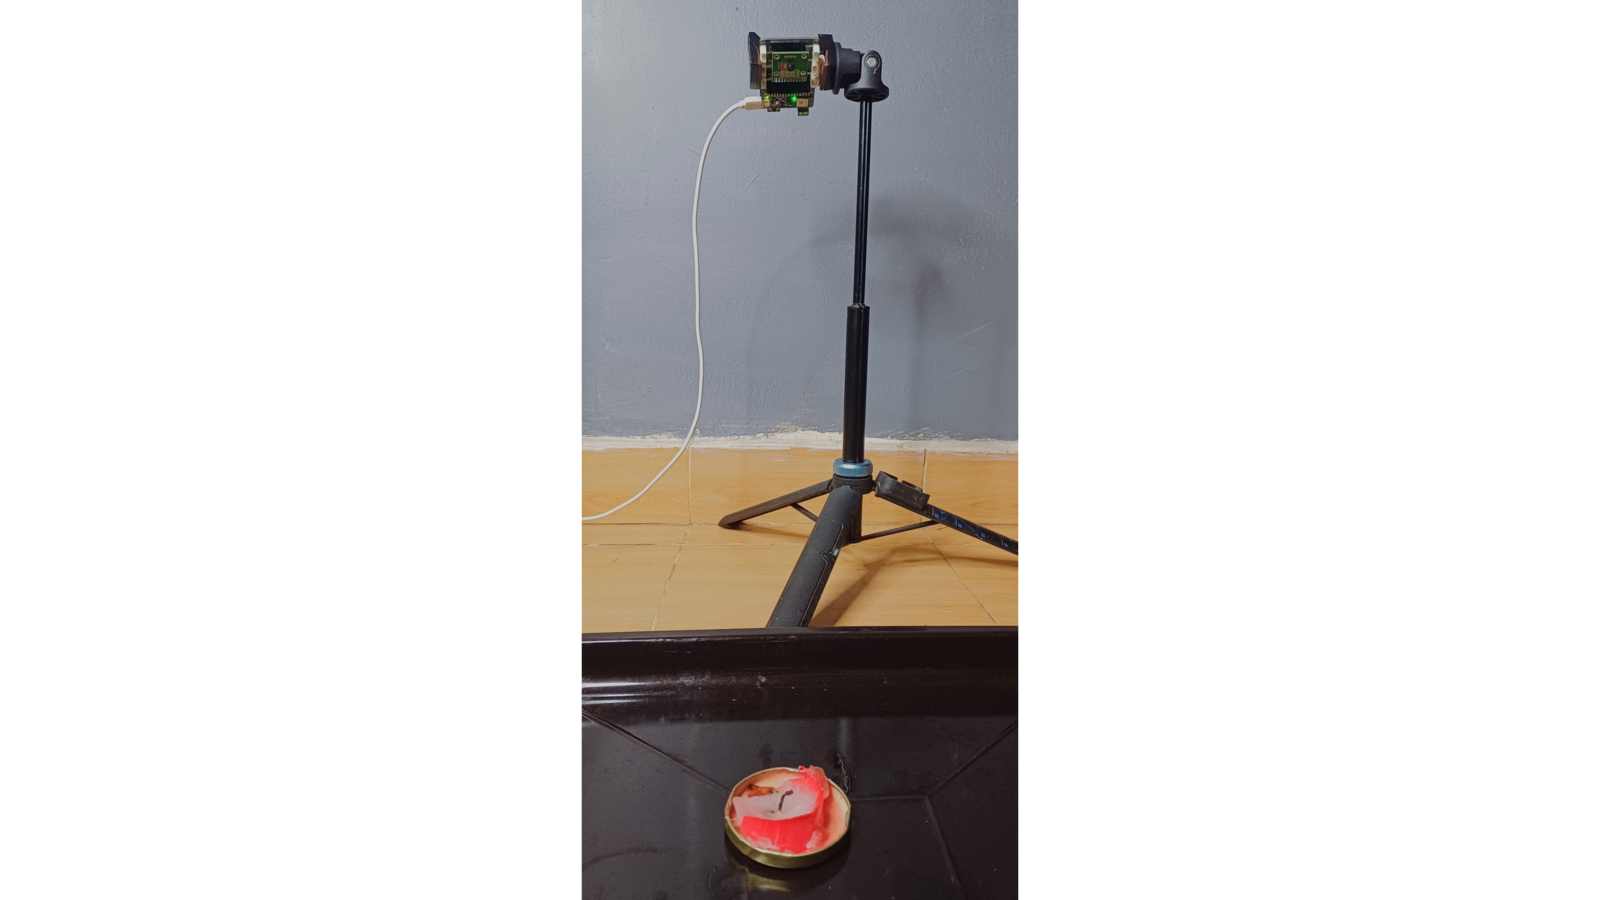
Since fire is dangerous and difficult to control, I used an oven and a candle to collect data. The oven generates temperatures higher than the ambient room temperatures and this can be detected by a temperature sensor. The candles gives a flame which can be optically detected by a camera. Therefore, both sensors compliment each other. I secured the Arduino TinyML kit on a tripod stand and faced it to an oven. For the safe environment (safe_environment class), I had the oven switched off and the candle was not lit. In total, I collected 60 images and 60 temperature values that were ranging between 23 and 27 degrees Celsius. The images below show photos of how the Arduino board was placed next to an oven, an image that was captured and also the .CSV file with the temperature values and the class label.
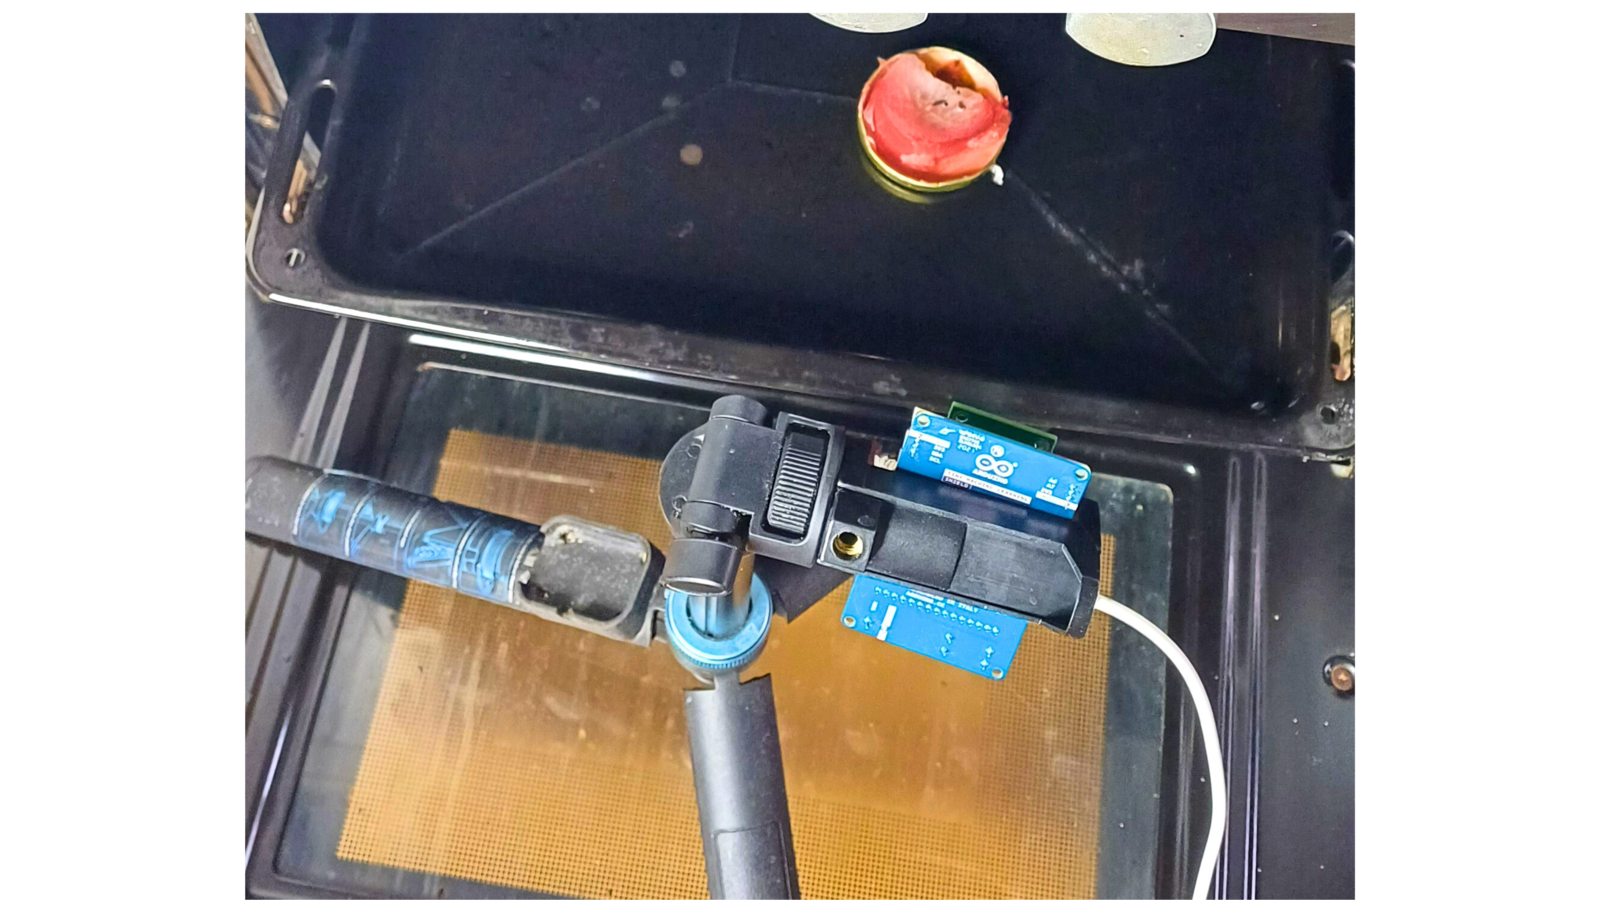
Arduino board sampling safe environment data
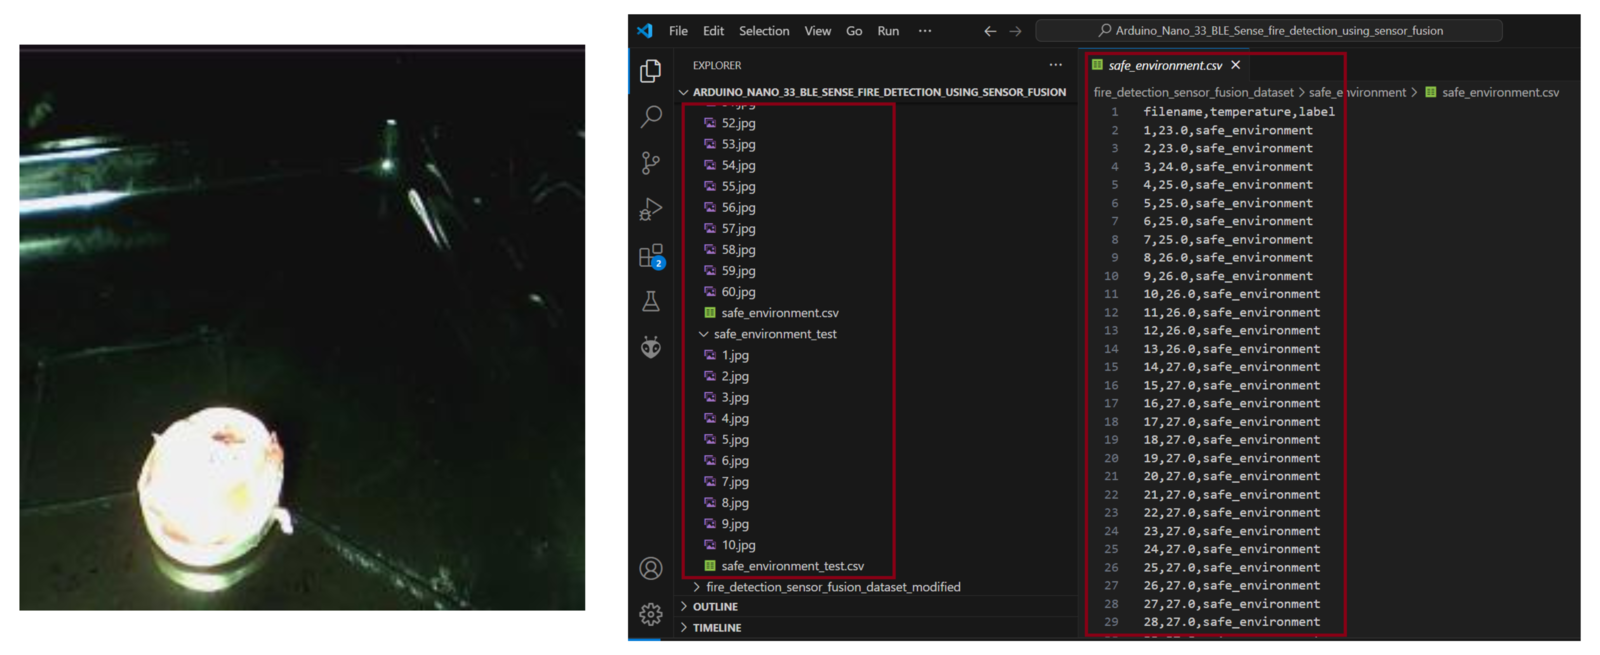
Safe image and temperature values
dataset_class variable to "fire" and this makes the Python script save the images and .CSV file to a folder named fire. Since the HTS221 is only guaranteed to operate over a temperature range from -40 to +120 degrees Celsius, I did not put the Arduino board inside the oven to prevent overheating and damaging the board. In this case, the board recorded temperatures of 60 to 70 degrees Celsius while it was next to the oven, placed on the oven door.
Arduino board sampling environment data
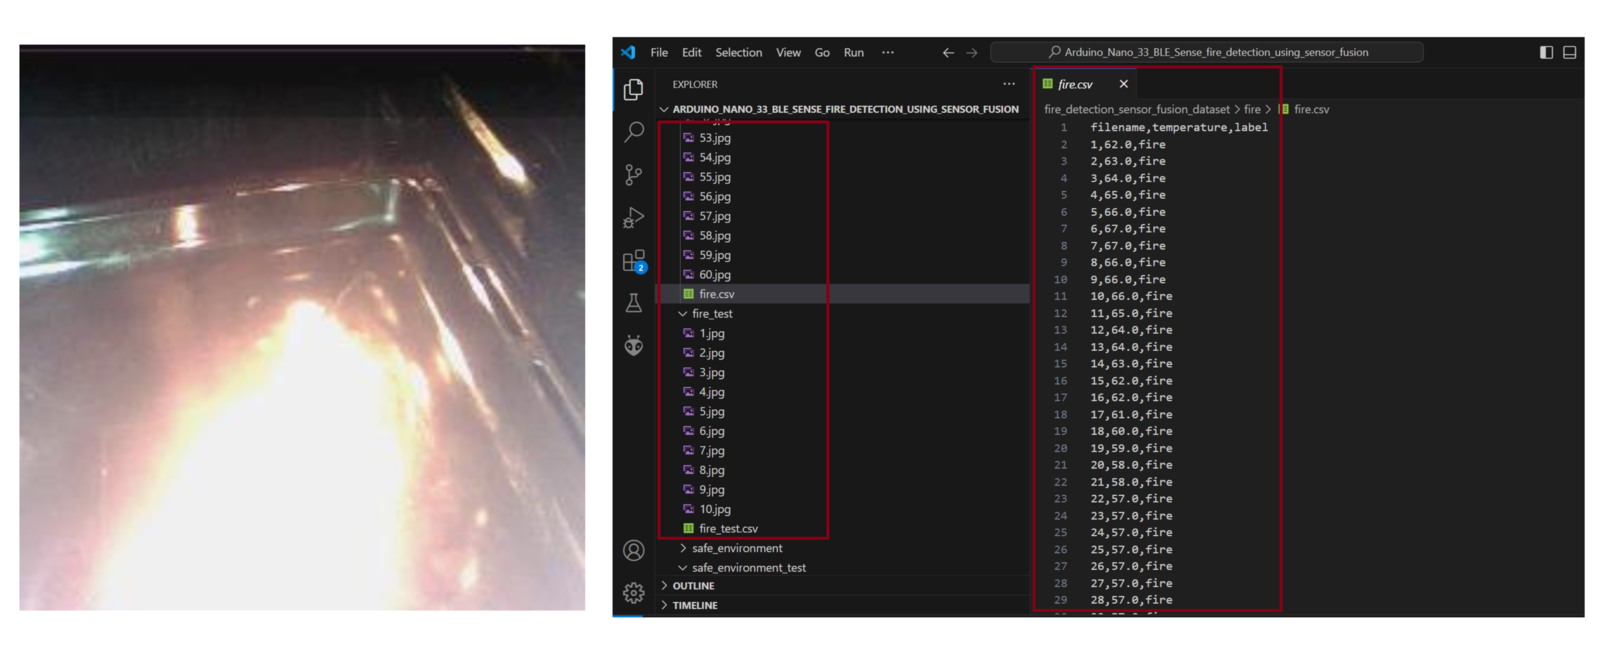
Fire image and temperature values
fire class. I replaced half of the images and temperature values with the one’s obtained in the safe environment class. In this case, the model was able to better understand the relationship between the two inputs. A fire can be seen but the temperature value being recorded is as low as 20 degrees. In this case, the temperature sensor may not be within a good range of the fire. At the same time in an environment with fire, no flames may be seen but the temperatures may be as high as 70 degrees. The flame may not be detected by the camera but the high temperature can be felt.
Training and Building the Model
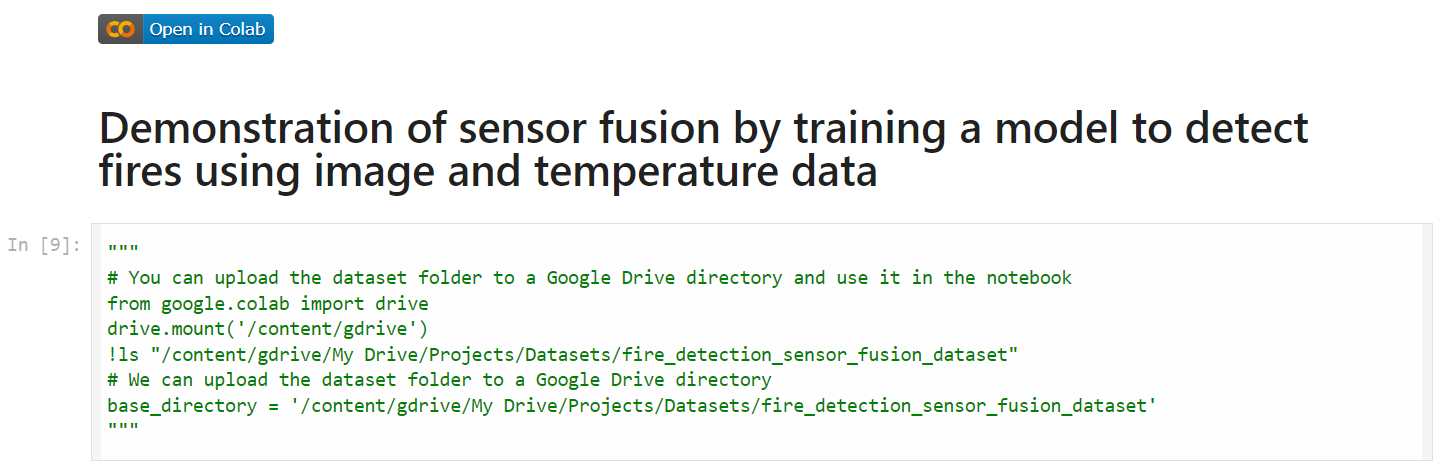
Once the Arduino and Python script have been used to gather the data, I developed this notebook on Google Colab to load the dataset and train the Machine Learning model. For this notebook, we only need to set the dataset source and put an API key for an Edge Impulse project. Once these two are set, we can run the entire notebook and the model will be trained, tested and profiled with the Edge Impulse Python SDK. Once the profiling is completed, we can then open the Edge Impulse project and deploy the model. First, let us go through the notebook. The first operation is to clone the GitHub repository which also has the dataset for this demonstration project. Instead of this dataset, you can uncomment the first cell of the notebook (and comment thegit clone command) to load a custom dataset folder on your Google Drive.
Google Colab load dataset
fire and safe_environment folders to a pandas data frame, defines the image parameters, and loads the images.
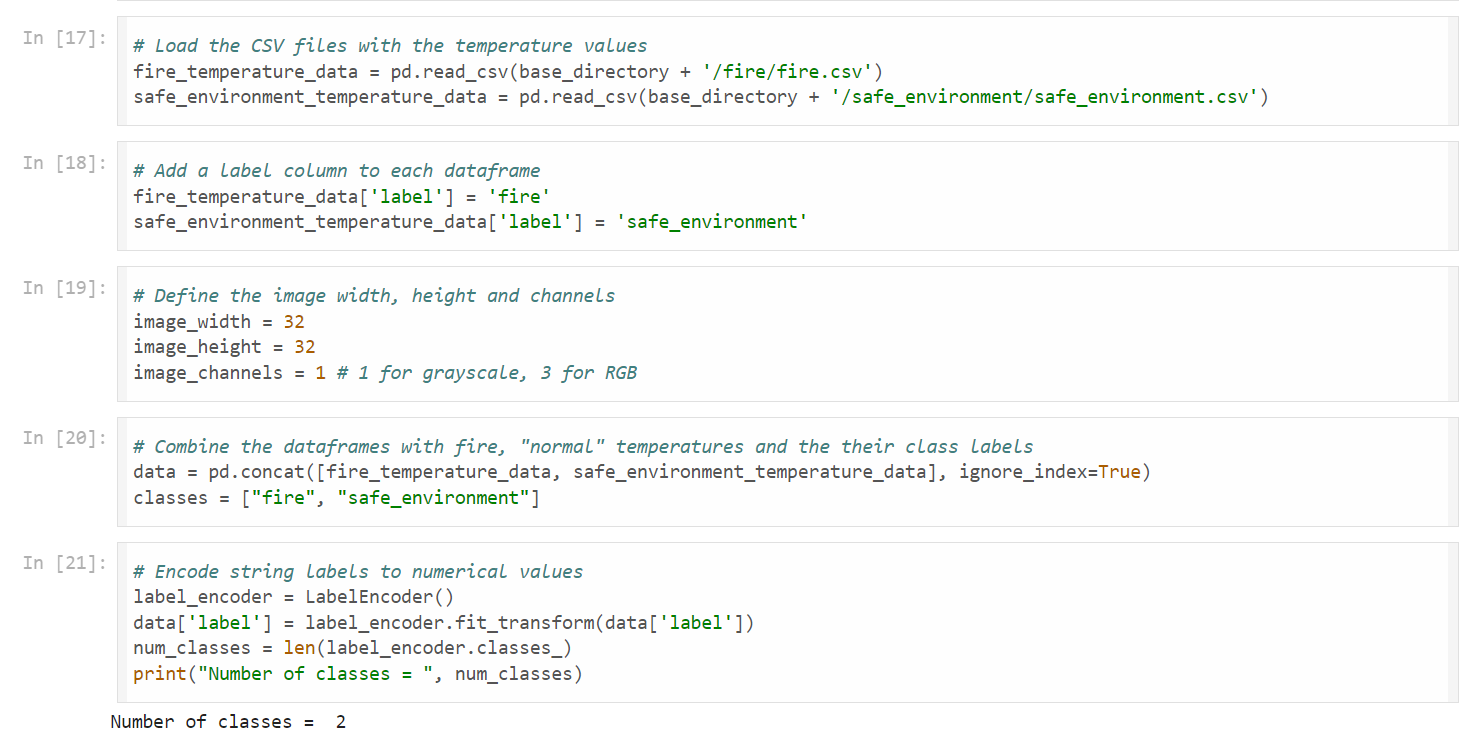
Google Colab define variables
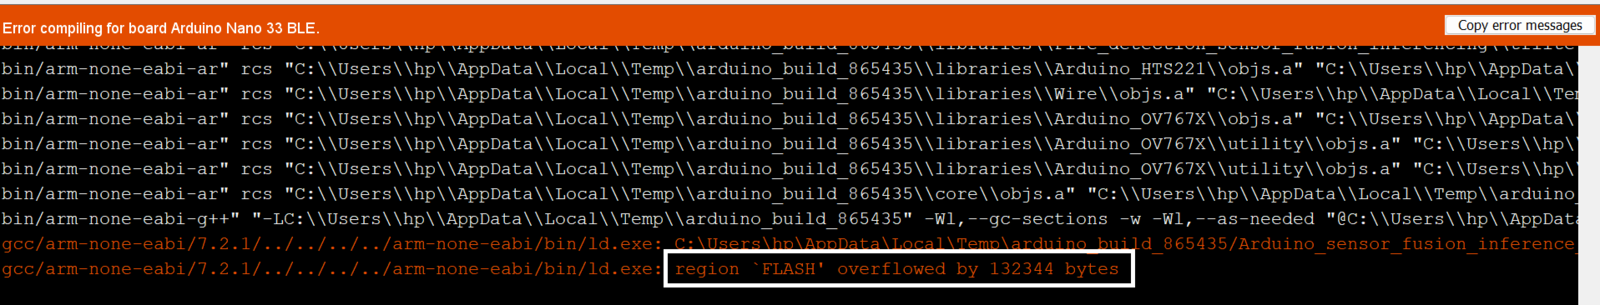
Arduino IDE flash overflow
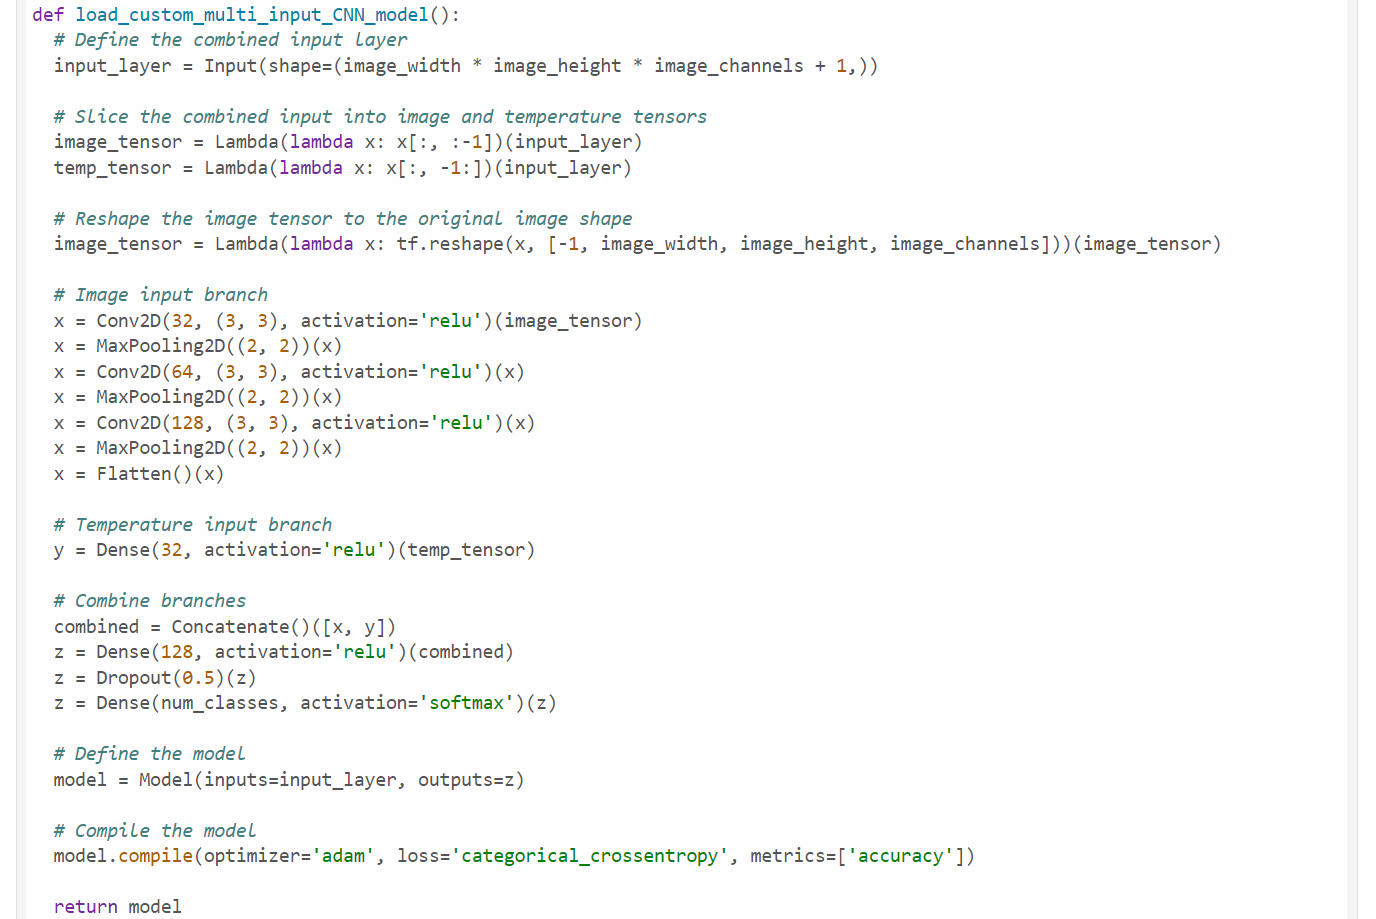
Google Colab model architecture
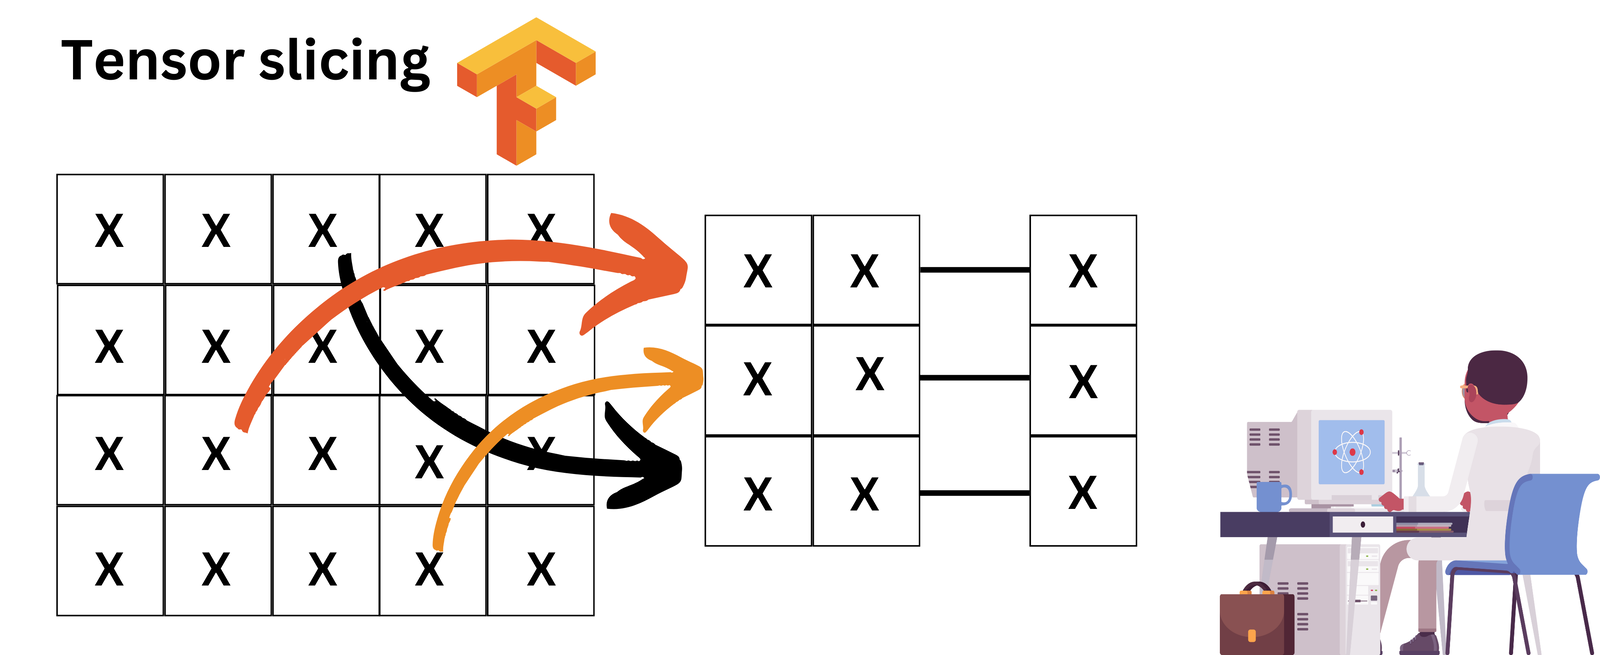
Tensor slicing
ei.API_KEY variable in the notebook.
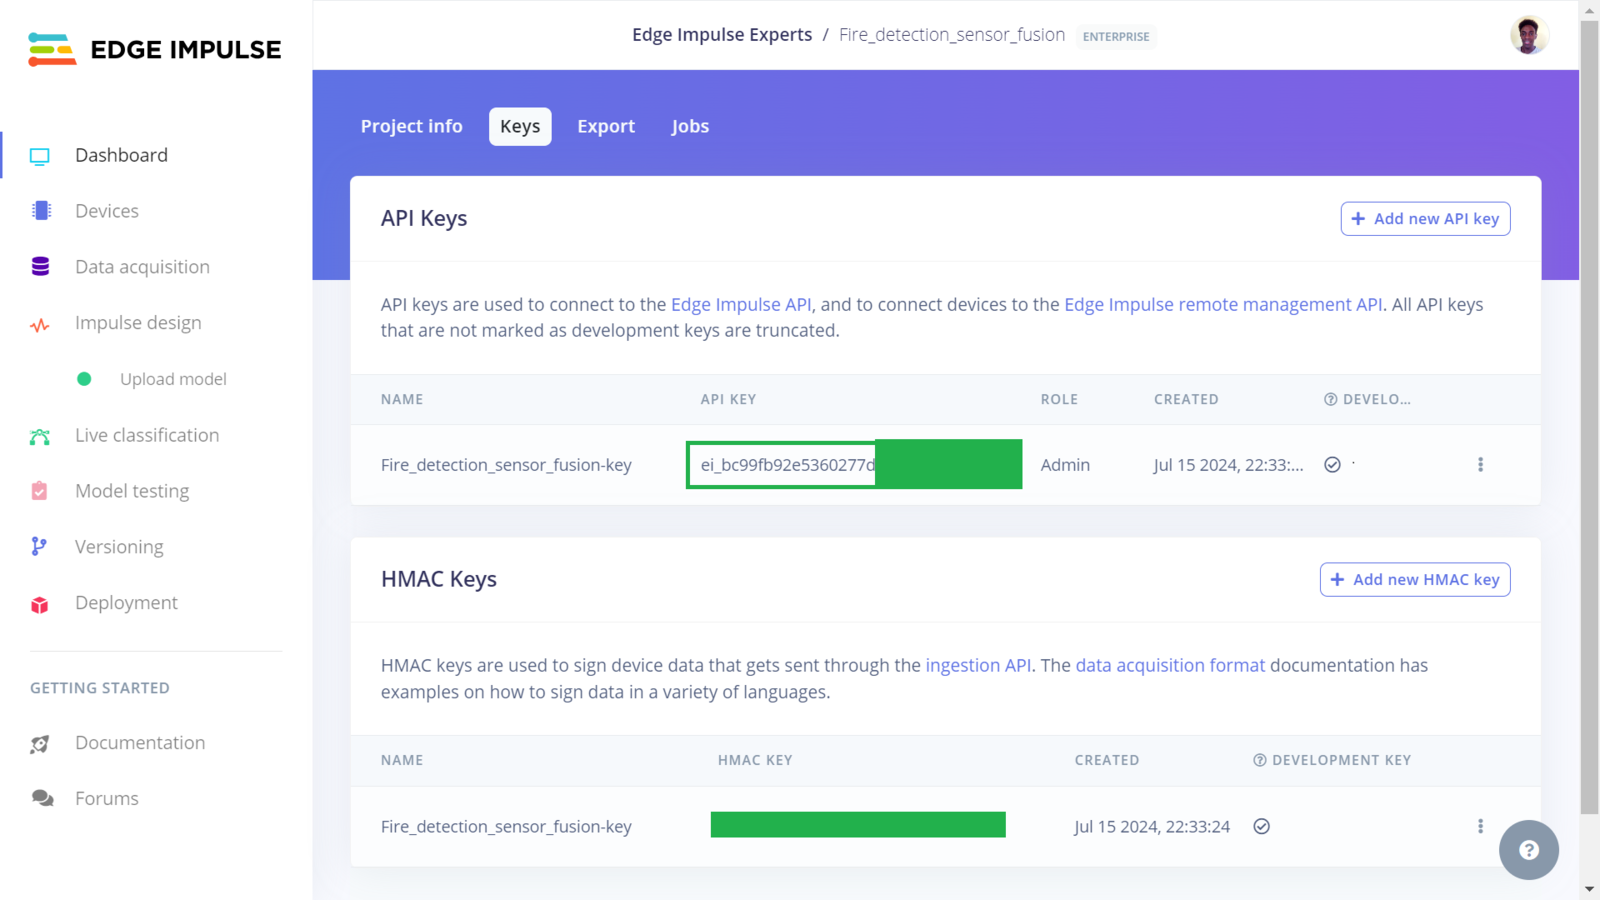
Edge Impulse API keys
safe_environment class is in a safe_environment_test folder, and the test data for the fire class is in a fire_test folder.
After training the model, the model achieved a validation accuracy of 100%. However, this does not imply that the model is perfect! In this case, the features that the model was classifying are simple, only 50 epochs were used, and the dataset had 120 images and 120 temperature values for training. To improve the model, we can add more data, update the model architecture and and increase the number of training cycles. For this demonstration however, I determined this is acceptable.
Model testing
Testing the Model in Edge Impulse Studio
After testing the model, the notebook uses the Edge Impulse Python SDK for profiling and this enables us to get RAM, ROM and inference times of our model on a wide range of hardware from MCUs, CPUs, GPUs and AI accelerated boards, incredibly fascinating! We can see the performance estimates for the Arduino Nano 33 BLE Sense in the screenshot below. Also, during this profiling, the model is uploaded to the Edge Impulse project. You can clone my public Edge Impulse project and access the model using this link: Fire_detection_sensor_fusion.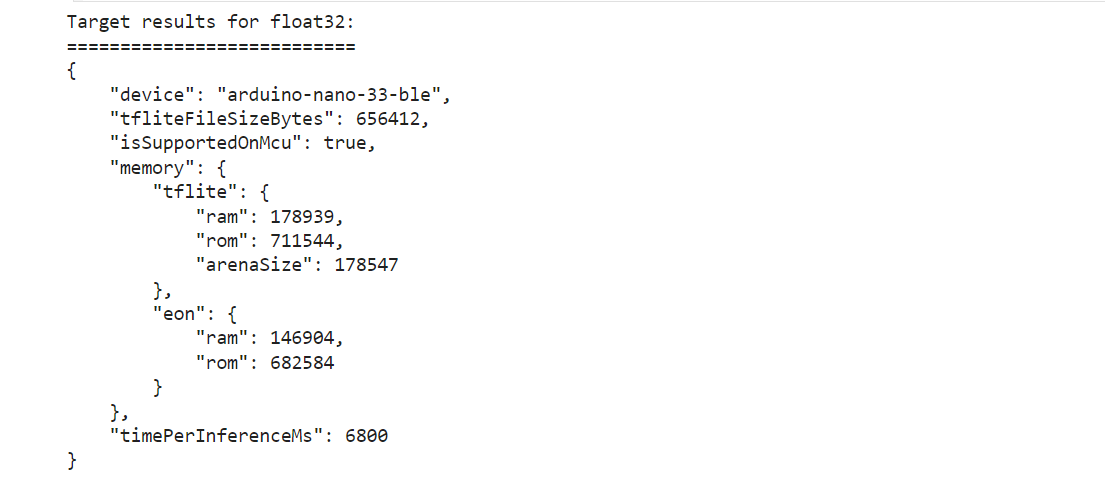
Model performance
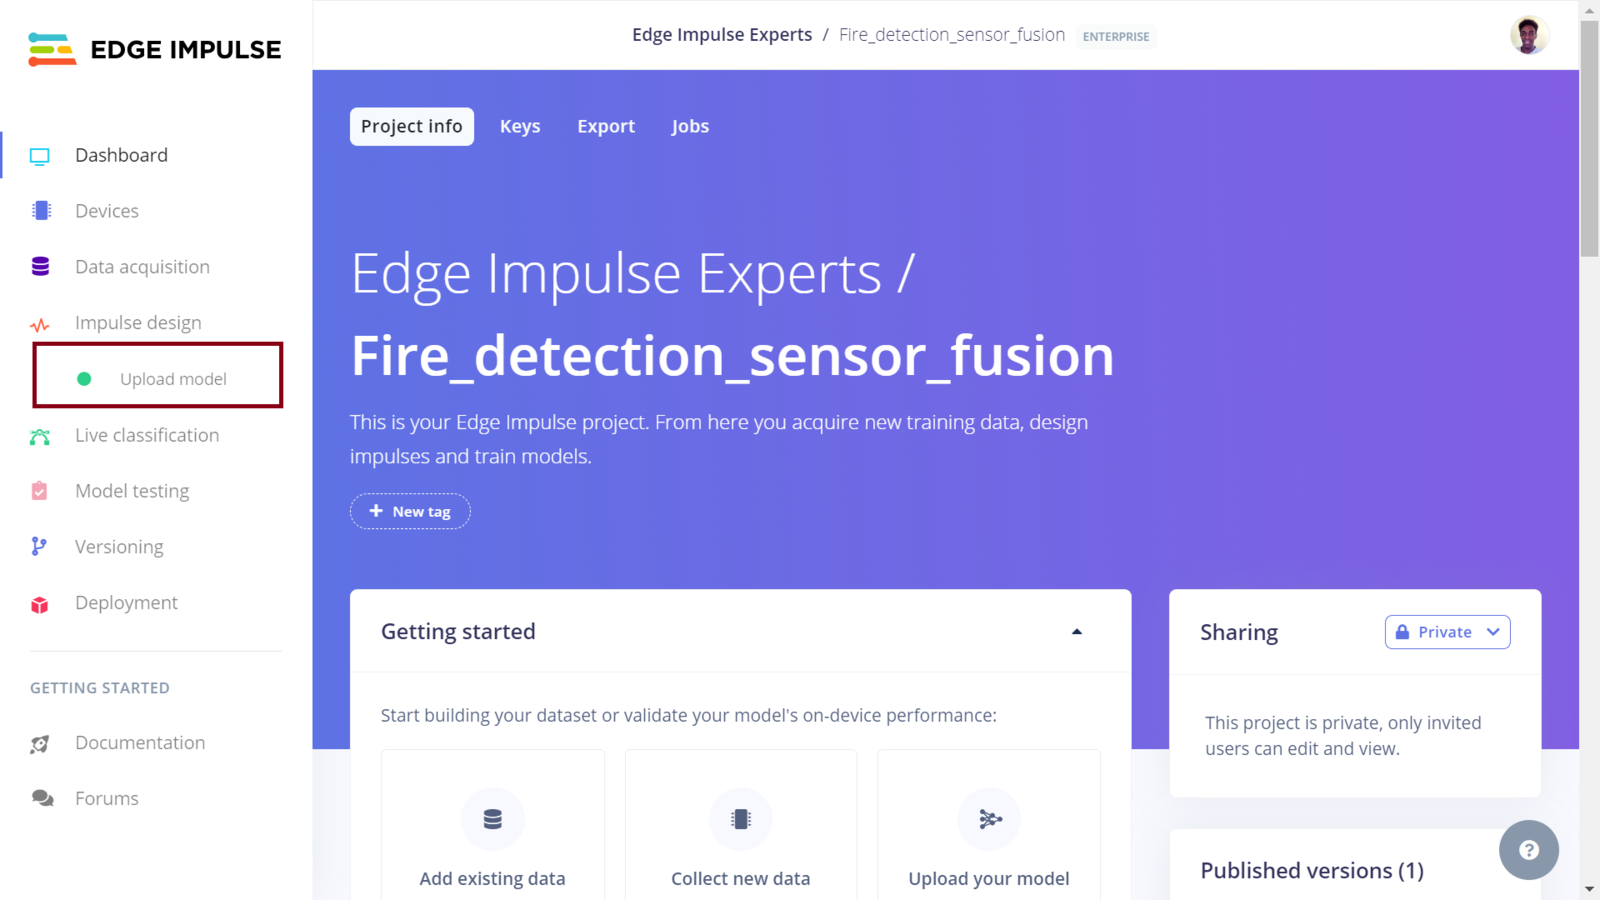
Edge Impulse Dashboard
fire, safe_environment. Click “Save model” to finish the configuration.
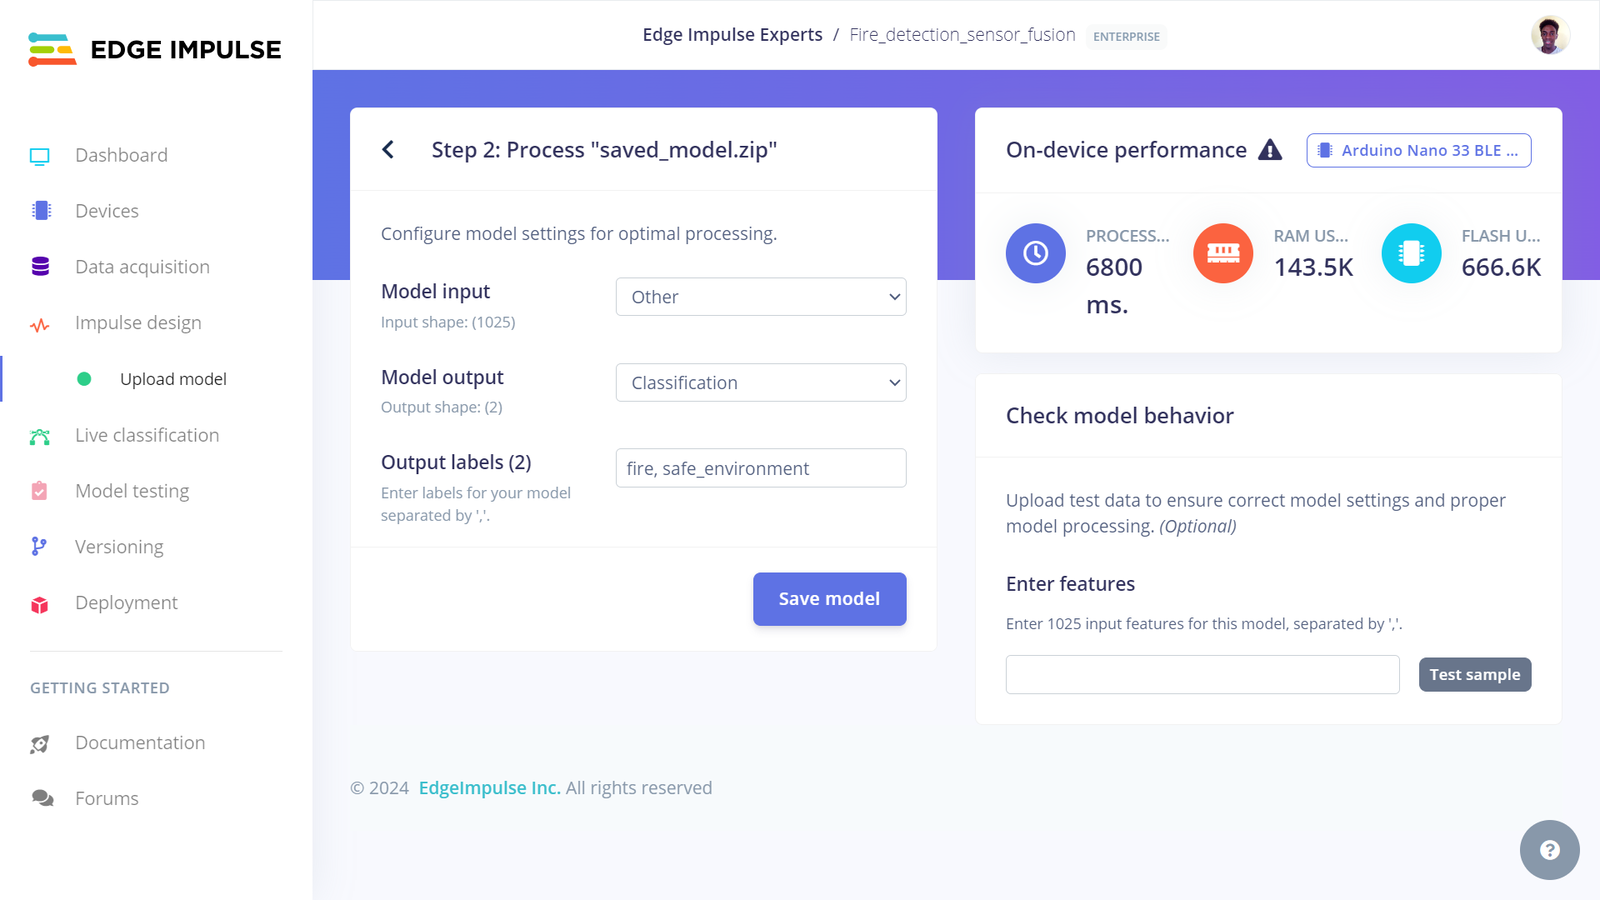
Edge Impulse upload model
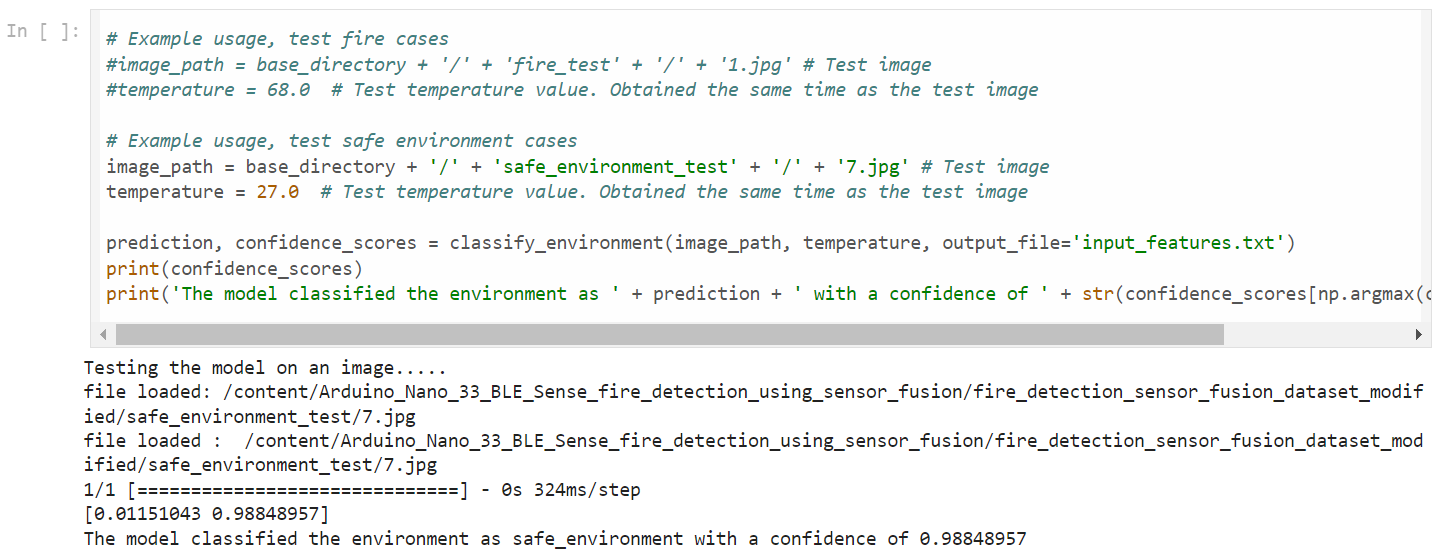
input_features.txt which can be seen in the notebook files. We can copy the contents of the text file and paste them in the Edge Impulse project to test our model on the platform. In the screenshot below, we can see that the model classified the features to belong to the fire class and this was the correct classification.
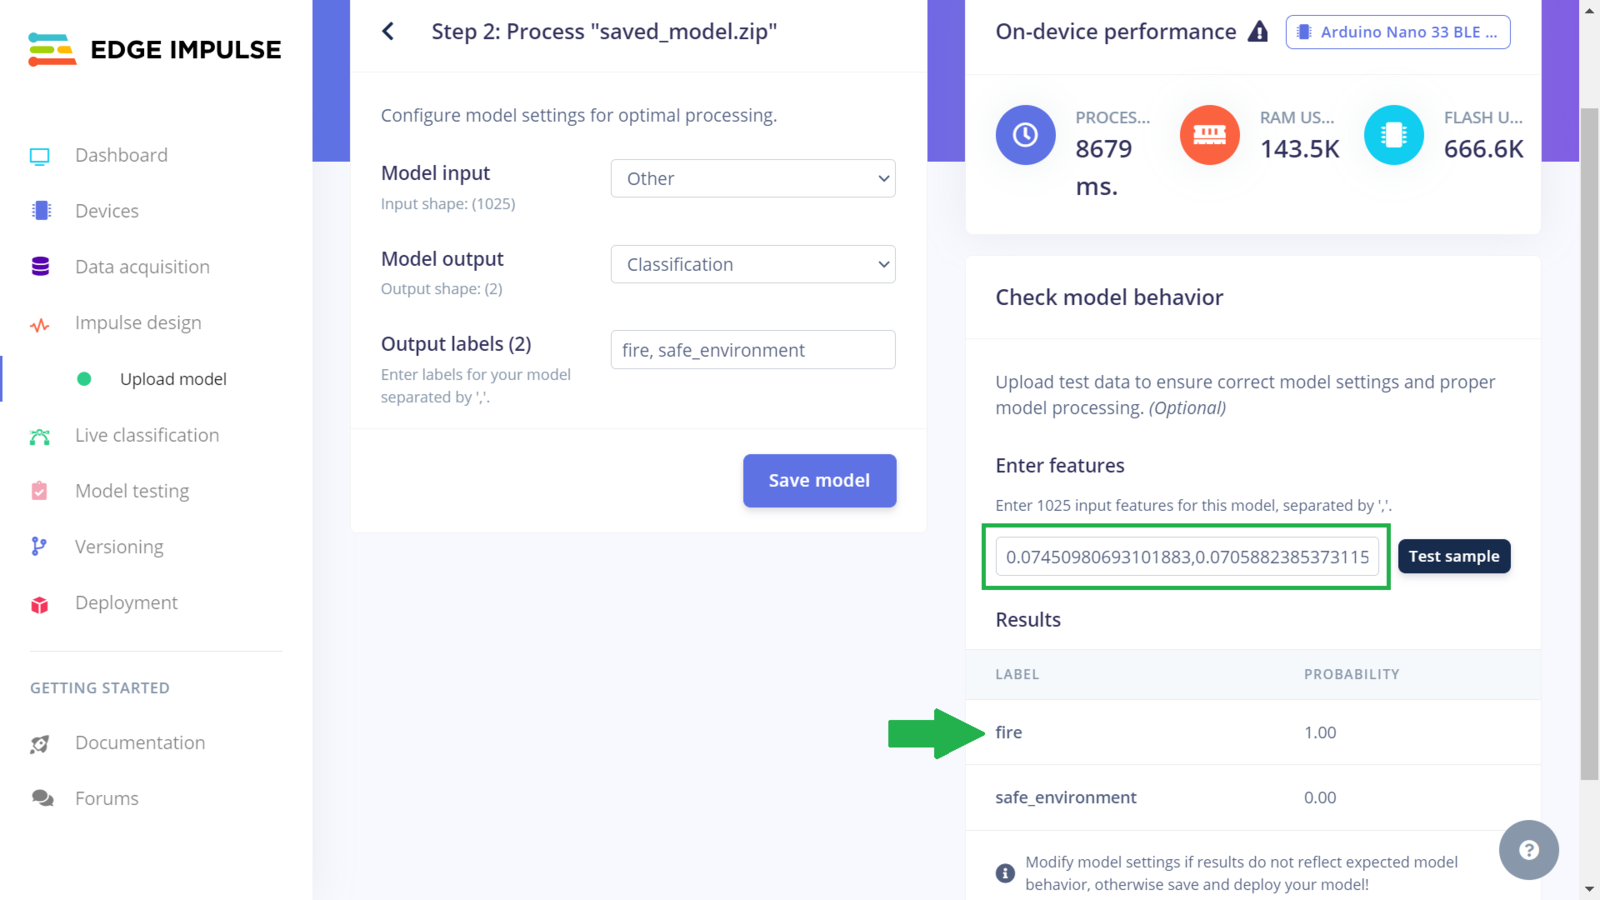
Edge Impulse model testing
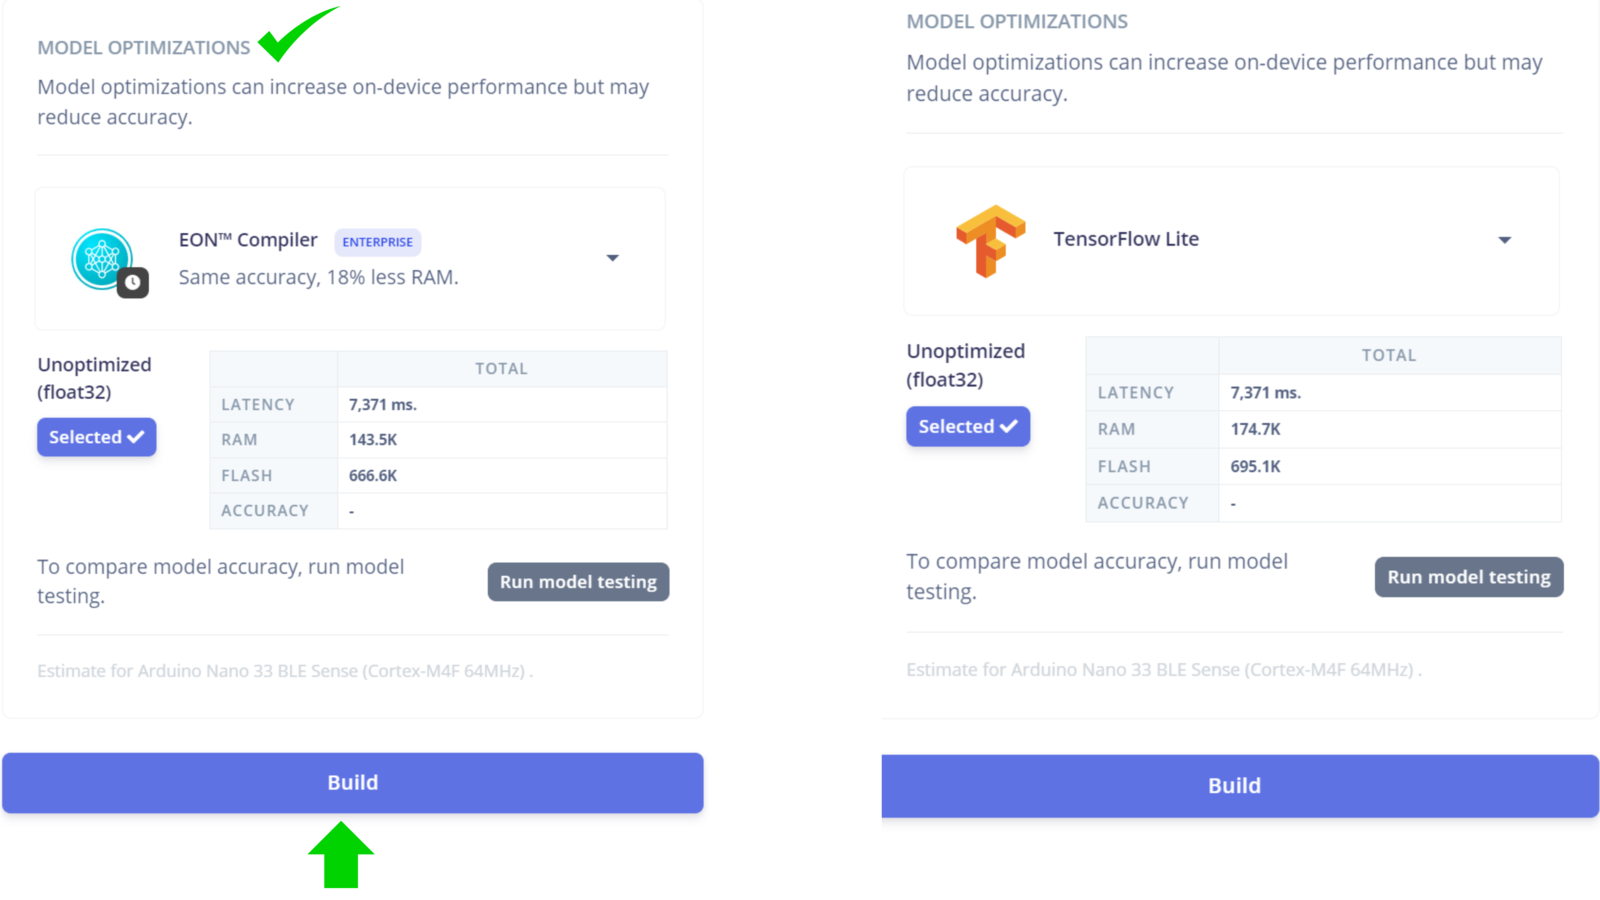
Edge Impulse model optimizations
Deploying the Model to a Microcontroller
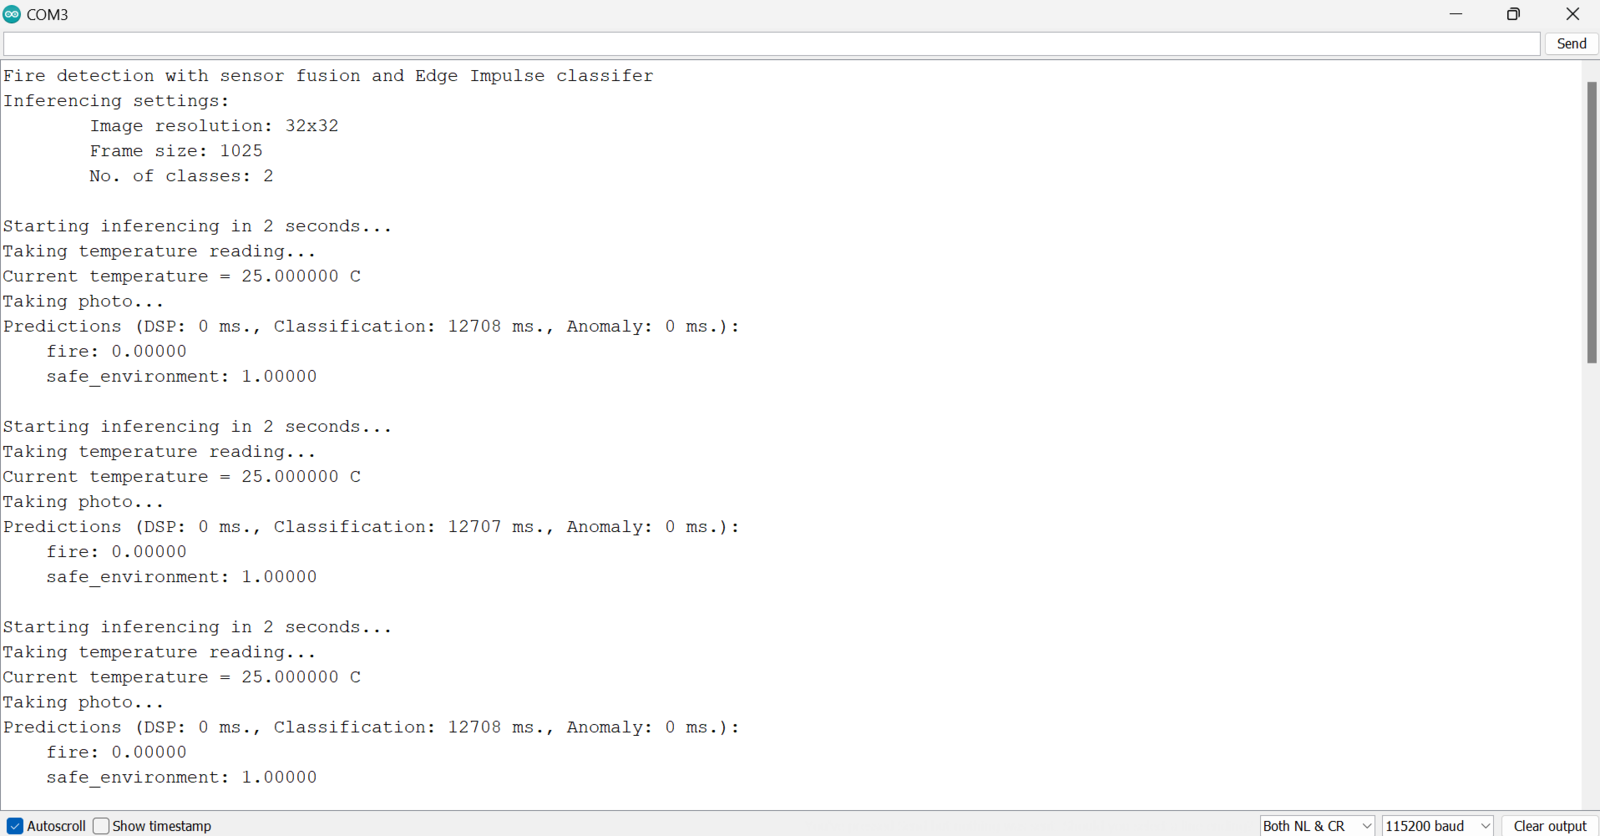
After the Arduino library has finished downloading, we can open the Arduino IDE and install the zipped library. Afterwards we open the inference Sketch in the Arduino IDE. Feel free to clone the GitHub repository or copy and paste the code to an Arduino Sketch on your computer. In the inference Sketch, we need to ensure that the variablesEI_CAMERA_RAW_FRAME_BUFFER_COLS, EI_CAMERA_RAW_FRAME_BUFFER_ROWS, WIDTH, and HEIGHT have the same image dimensions as the one used in the model training. Finally, we can upload the inference Sketch on the Arduino Nano 33 BLE Sense. Once the code is uploaded, the Arduino board will record the room temperature, capture an image, and then classify if the environment is safe or has a fire. The inference Sketch follows a similar operation as the data collection code. The main difference in this case is that the data are not printed to Serial. In fact, the inference Sketch is also built from the nano_33ble_sense_camera.ino example code. I updated the code to also get temperature value and then in the function ei_camera_cutout_get_data, we can append the temperature value to the buffer that will afterwards be passed to the classifier which in this case is our multi-input model.
Arduino inference logs
Results
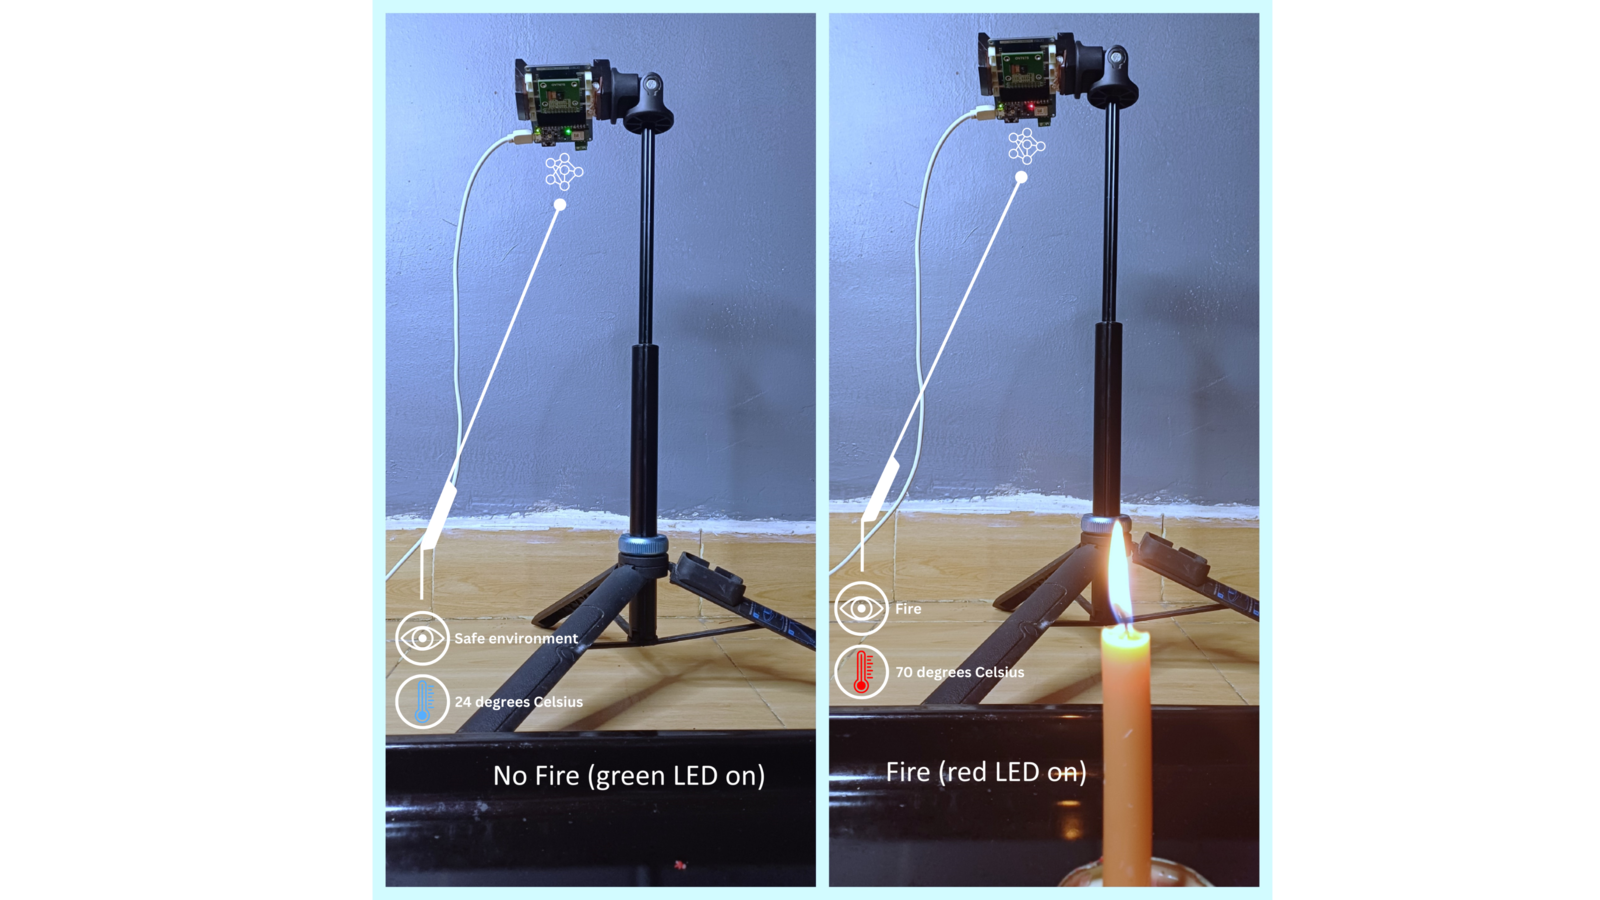
Finally, after collecting the dataset, training, and deployment, we have a multi-input sensor fusion application that is running on a small, low-power and resource-constrained Arduino Nano 33 BLE Sense. To test the model on the Arduino board, I placed it back next to the oven. In the first scenario, I had the oven turned off and a candle was in front of the OV7675 camera but it was not lit. In this situation, the model accurately classified that the environment is safe, and the onboard RGB LED turned to green. Afterwards, I turned on the oven to increase the temperatures and lit the candle. In this situation also, the model accurately classified that the environment belongs in thefire class and the onboard RGB LED turned to red.

Inference demo on oven
Inference safe environment
fire class and the Arduino’s onboard RGB LED turned red.

Inference fire environment