Project Demo
Intro
A fall could be dangerous in any situation, but for certain working scenarios, consequences can be very harmful. Therefore, the idea of developing a Machine Learning fall detection and reporting system could be quite useful in some industries.How Does it Work?
Each worker has a small TinyML device in charge of detecting falls via the onboard accelerometer data, and reporting to a server through Bluetooth. The server is a Raspberry Pi running a Python script that scans specific BT announcements, parses the fall alert information, and stores it into a SQL Lite database for reports and alerts.Client Devices
The electronics part of the client build is easy: just a battery, a TP4056 and the Arduino Nano 33 BLE Sense. The board has an onboard accelerometer, onboard RGB led, and enough processing power to run an Edge Impulse library for inferencing locally.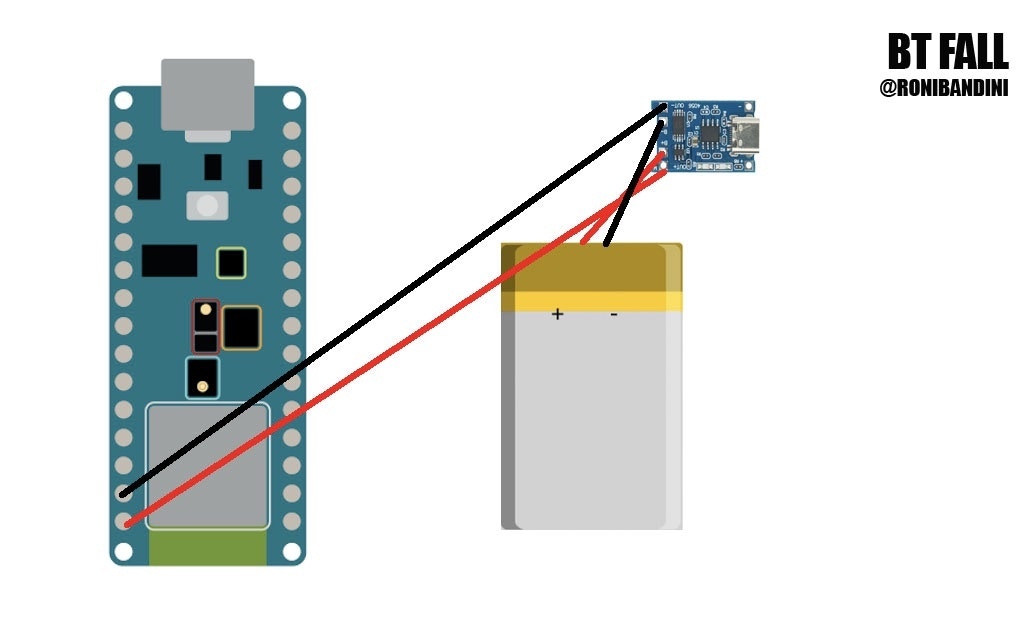
flash_window.bat from inside the folder (or the Mac or Linux commands if you are on one of those platforms).
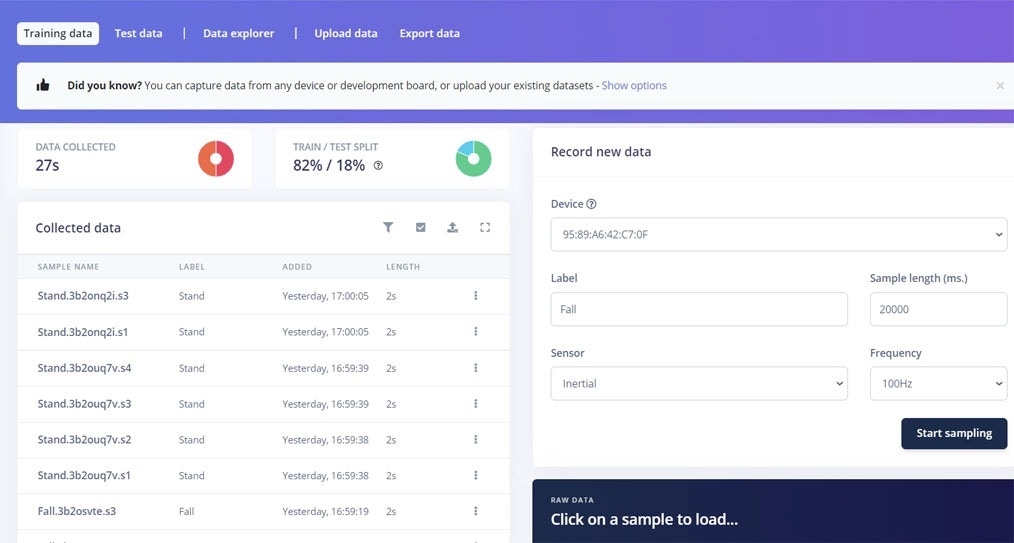
If you want to train your own fall model, go to the Edge Impulse Studio and log in, click on Data Acquisition, WebUSB, and choose the Inertial sensor. Obtain 5 minutes of data; Standing normally and Falling Down samples.
advertiseFall("Fall-"+worker+"-"+String(myCounter));
For example: Fall-Smith-1922
The device will change it’s RGB LED from green to red, whenever a fall is detected.
All of the code for this project, including both the Client script file and the Python server files can be downloaded from this Github link.
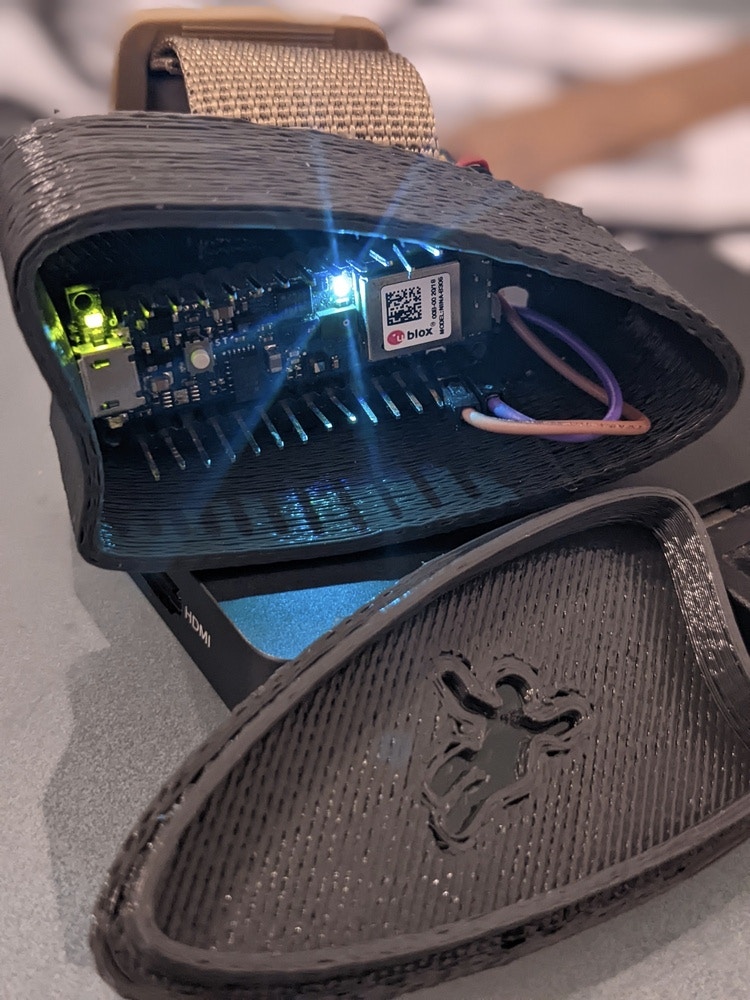
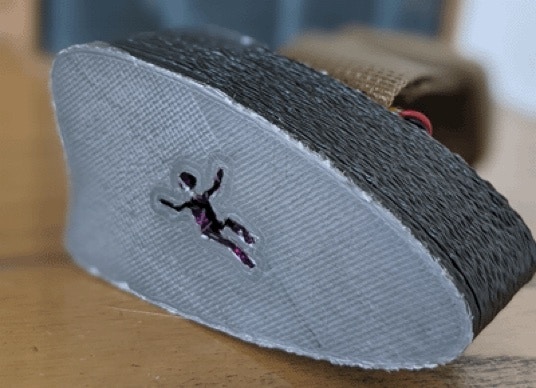
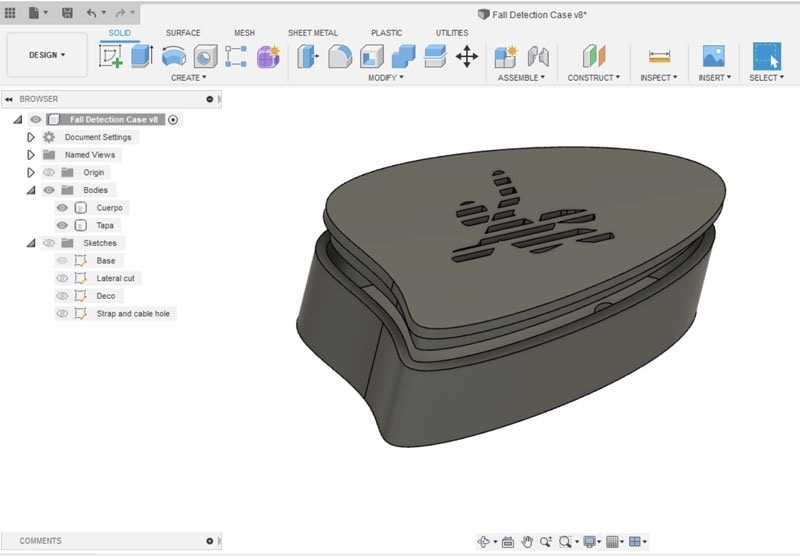
Client 3D Printed Case
Server Setup
The other component we need to build next is the Python and database server, listening for bluetooth data coming from the Arduino. A Raspberry Pi will run the code fine, so, simply install Raspberry Pi OS Lite on an SD Card, boot up, and upload the Python files linked above from the GitHub repo. Next, create a database structure with:$ sudo python3 databaseSetup.py
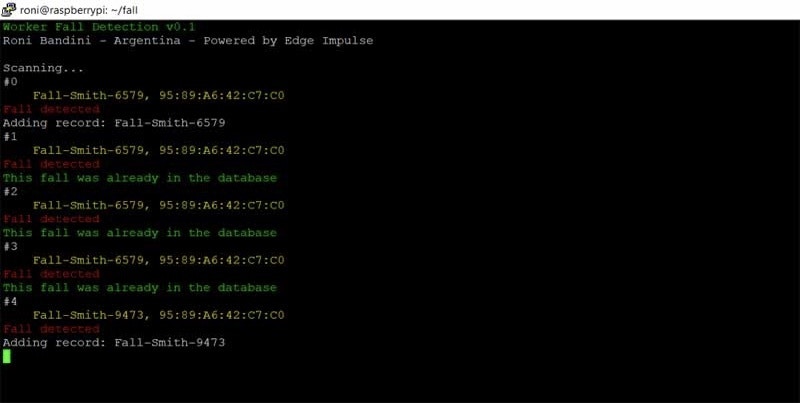
Start scanning for bluetooth packets from the Arduino with:
$ sudo python3 scan.py
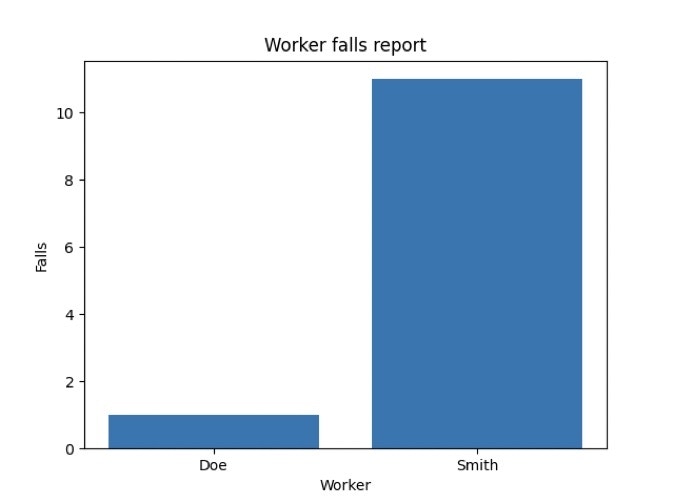
clearDatabase.py (removes all database records), and chart.py (creates a chart rendered from all of the database records).