What You’ll Need
- A free Edge Impulse account.
- Images of the object or scene you want to measure, each labeled with its numeric value. For this tutorial you can use the Vial Tubes dataset or collect your own.
Getting Started
The quickest way to follow along is to clone the public project, which already contains the dataset, impulse design, and a trained model:- Open the Vial Tubes public project in Edge Impulse Studio.
- Click the Clone this project button in the top-right corner.
- Follow the prompts to copy the project into your account.
Building the Project Pipeline
Collect and label data
For visual regression, every image needs a numeric label — the value the model will learn to predict. In this dataset, images are labeled with the fill level of the vial (e.g.,0, 0.5, 1, 1.5, 2), where -1 indicates an empty or inverted vial.
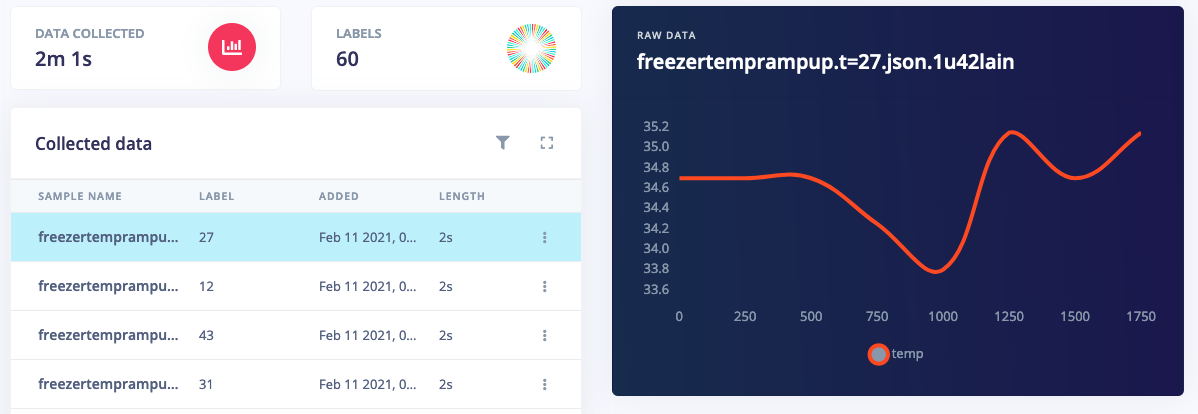
Labeled data samples with numeric regression values
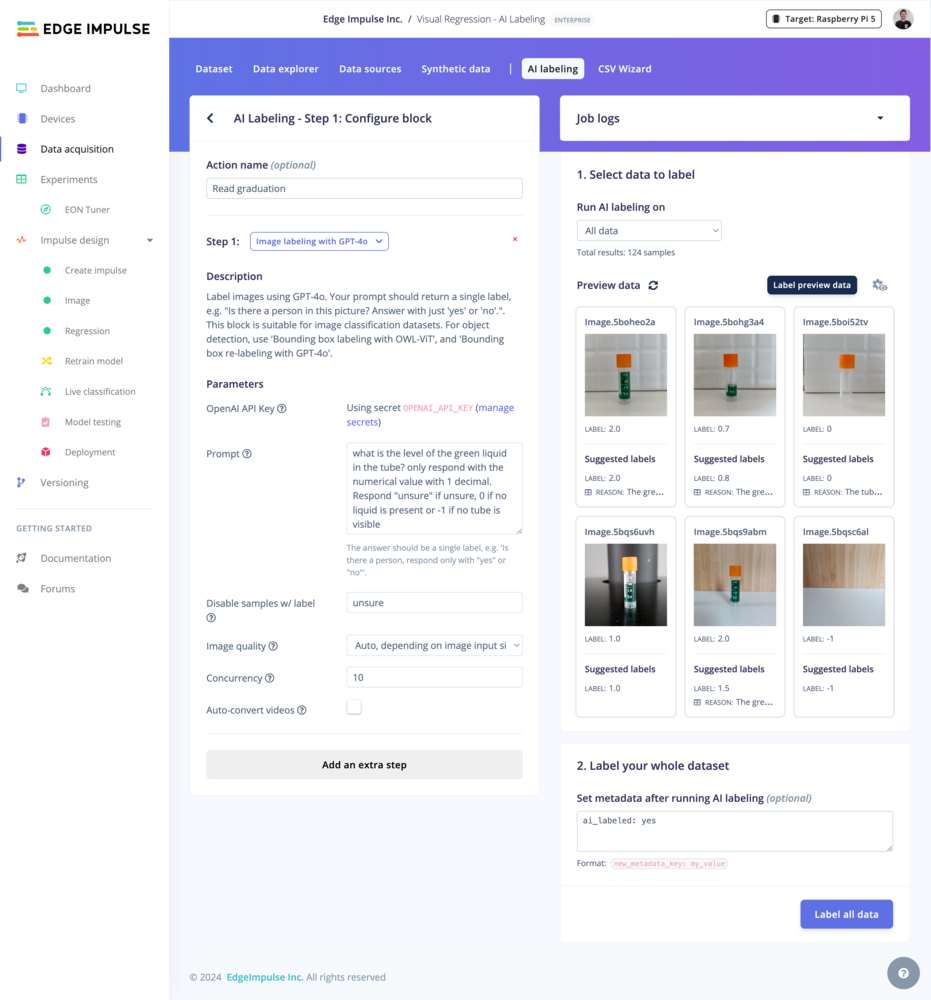
AI-assisted labeling for visual regression
Create the impulse
Go to Create Impulse in the menu. Add an Image processing block and a Regression learning block.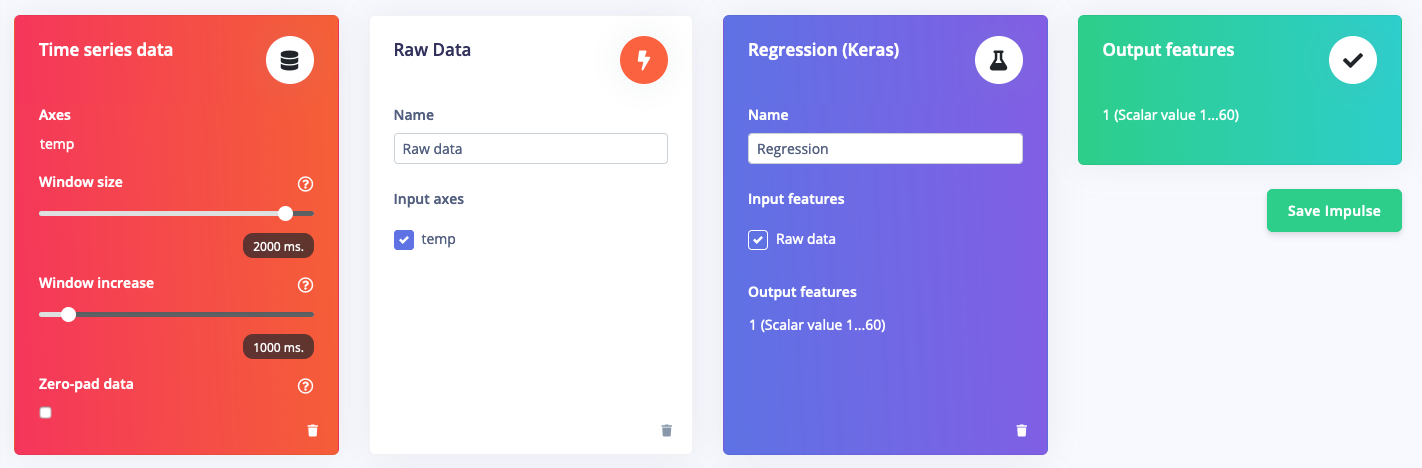
Impulse design for visual regression
Generate features
Open the Image section from the menu and click Save parameters, then navigate to the Generate features tab and click Generate features. Edge Impulse will extract visual features from every image in the Training set. When complete, the Feature Explorer shows a 2D projection of those features — images that look similar appear close together. For regression, you should see a smooth gradient across the feature space that correlates with the labeled values.Training the model
Navigate to the Regression section and click Start training. Edge Impulse trains a neural network that maps image features to a predicted numeric value. After training you will see metrics including Mean Absolute Error (MAE) — the average difference between the predicted and true values across the test set. Lower MAE indicates better accuracy.Testing the Model
Model testing
Go to Model Testing and click Classify all. Edge Impulse runs every image in the Test set through the trained model and displays the predicted value alongside the true label.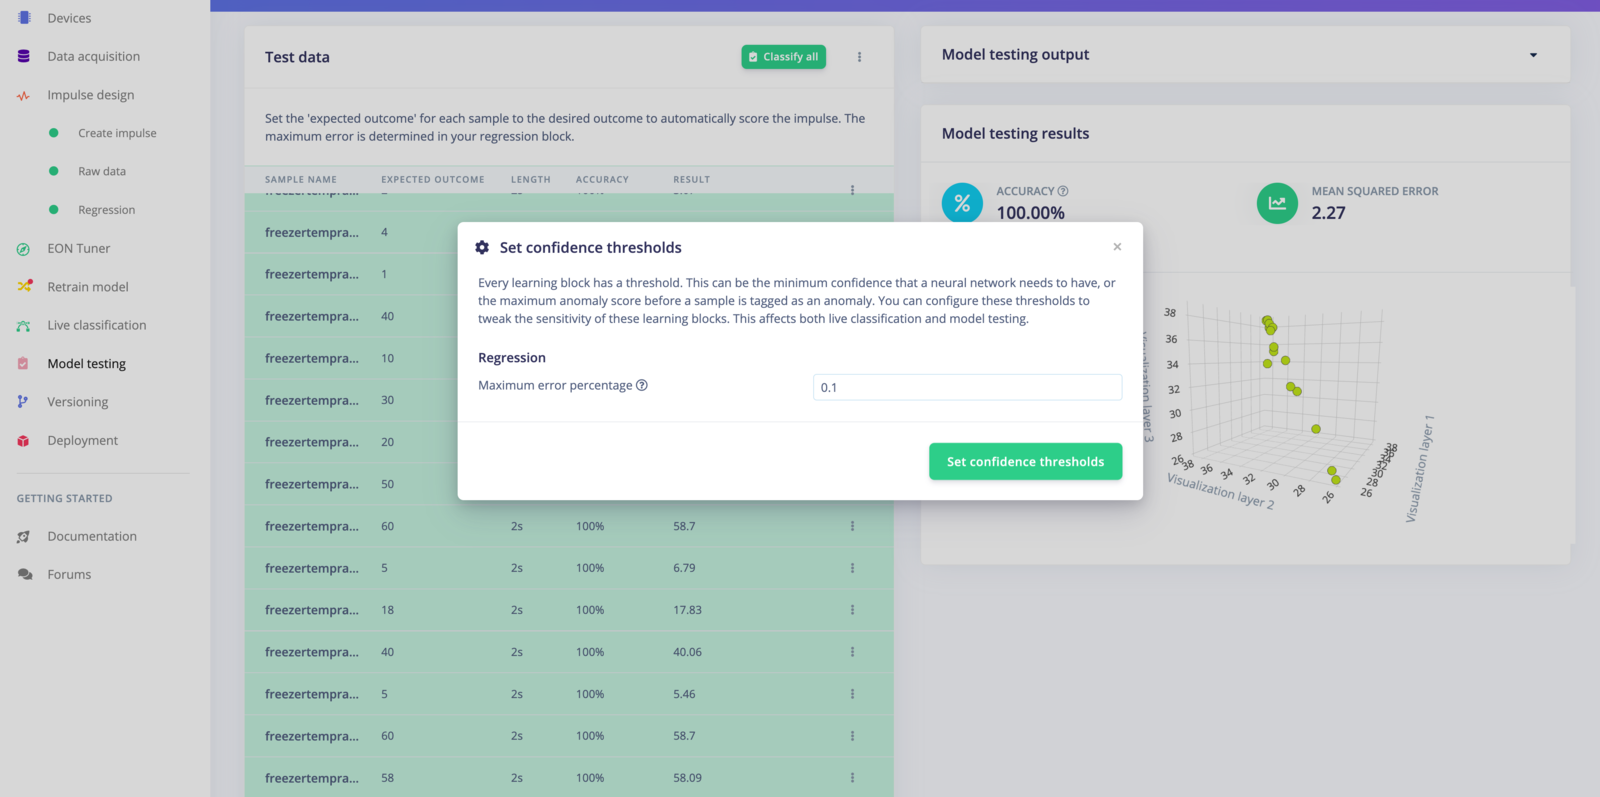
Model testing results for visual regression
- Collecting more images, especially near values where the model struggles.
- Increasing image resolution.
- Rebalancing the Training/Test split.
- Using the EON Tuner to automatically find better impulse configurations.
Live classification
Connect a device or upload an image directly in the Live classification tab to test the model against new, unseen images in real time.Deploying the Model
Once you are satisfied with accuracy, go to Deployment to export the model for your target hardware. Edge Impulse supports a wide range of embedded targets — see the full list of supported hardware. The regression block produces a single floating-point output per inference, which your application can read and act on directly (for example, triggering an alert when the predicted fill level drops below a threshold).Next Steps
- Explore the full Vial Tubes dataset page for dataset details and citation information.
- Read about the Regression learning block to understand available configuration options.
- Browse supported hardware to find the right deployment target for your project.
- Create a new Edge Impulse project to apply visual regression to your own data.