This tutorial shows you how to use Edge Impulse’s regression block to design an Embedded Machine Learning model based on the concept of linear regression. Linear Regression can be useful for Predictive Maintenance applications. We’ll use the [cold chain use case[(https://edgeimpulse.com/blog/embedded-machine-learning-cold-chain)] discussed in our previous blog post and explain how to apply the regression learning block to the same training dataset. As a quick refresher, here is part of the training dataset from our previous anomaly detection model, which captures the slope increase from the temperature of 26 degrees F to 38 degrees F. This training data represents the time from when the freezer door was open (time t = 0) to 1 min after the freezer door was opened (time t = 60). With the regression model we can predict how “far” the current temperature sensor readings are from hitting a critical temperature, let’s say to be designated here at time = 60 seconds. Our prediction output will tell us how close we are to hitting that critical temperature. The lower the score, the closer the system is to hitting that critical temperature range.

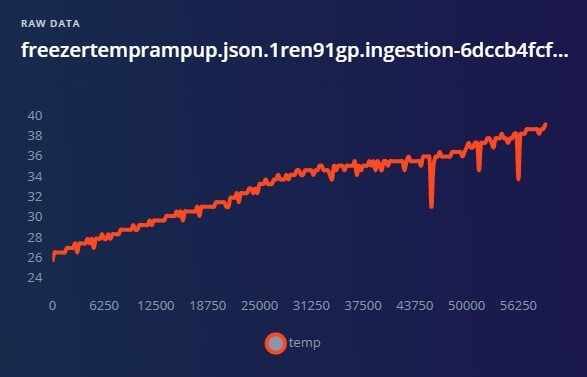
Temperature Increase 'Slope of Interest'

##Step 1: Split up the previous training data set into overlapping training windows The first step is to take our 60 second slope of interest and create training data samples that represent each graduation on the slope. For this example, we chose to use a window size of 2 seconds, with a 1 second overlapping window. If things were done correctly, you will end up with a training data set like so with 60 labels, each labeled from 1 through 60.

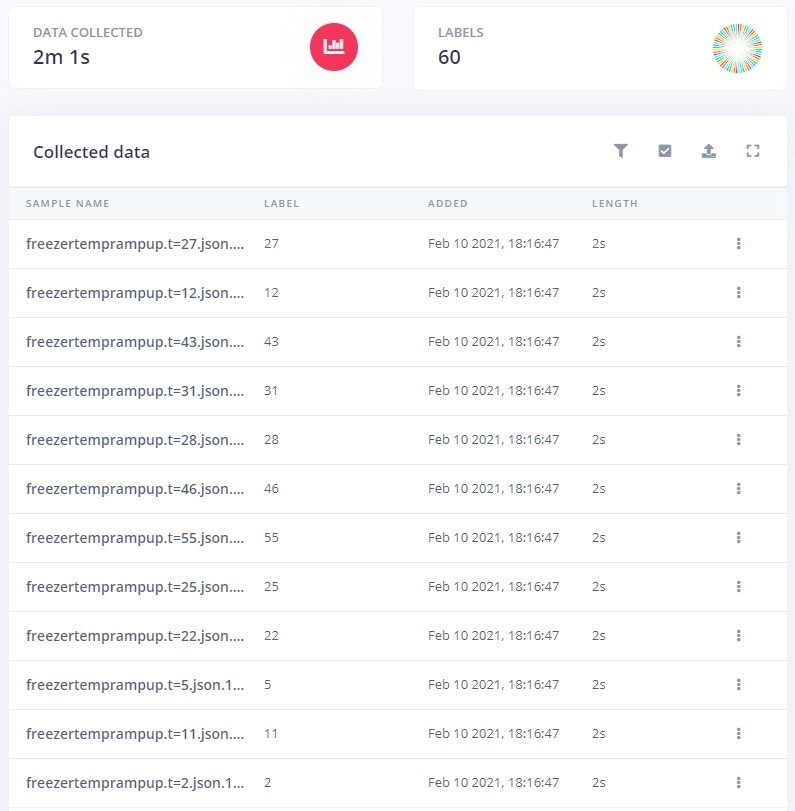
Training Data Set for Regression

##Step 2: Design the Impulse and train the regression model The next step is to design the impulse and for this we again use a window size of 2 seconds and a window increase of 1 second. We select “Raw Data” for the processing block and select “Regression (Keras) for the learning block. Follow the usual steps of saving the parameters then generating the features and you will end up with something looking like the following. The color coding is a nice visual representation as well of how close we are to hitting the critical temperature the system is trying to avoid. For example, a prediction value of 59 based on the current temperature is shown here as “purple”, meaning that the system is not close to being in any danger of hitting the critical temperature. However, a prediction value of 10 or less means that the system is dangerously close to hitting the critical temperature.

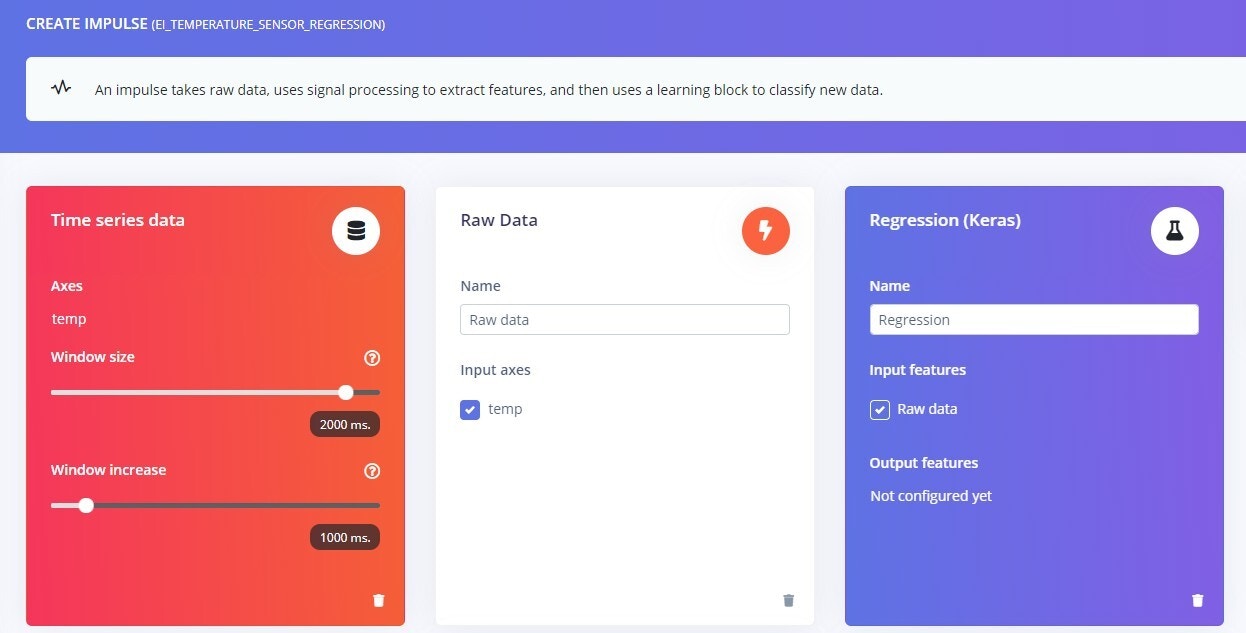
Impulse Design for Regression

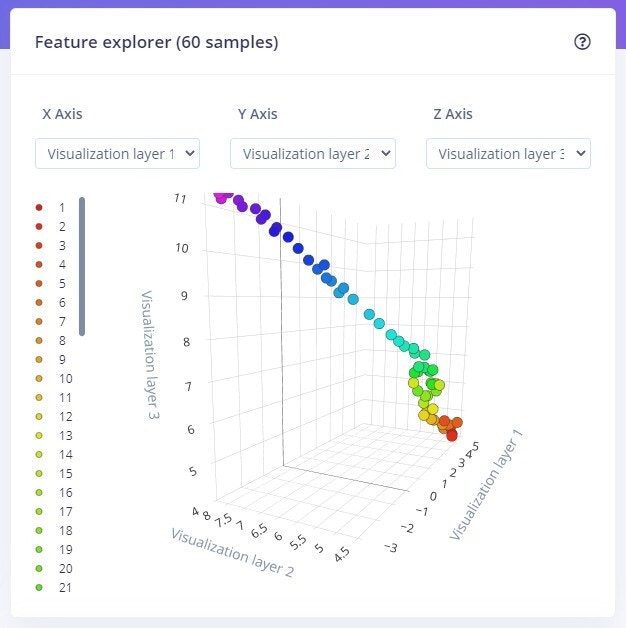
Features representing each graduation along the slope of interest

The final step in the Impulse design is to train the model as shown below and one thing important to note here is the number of training cycles required for the regression model to get an acceptable level of accuracy in this context.

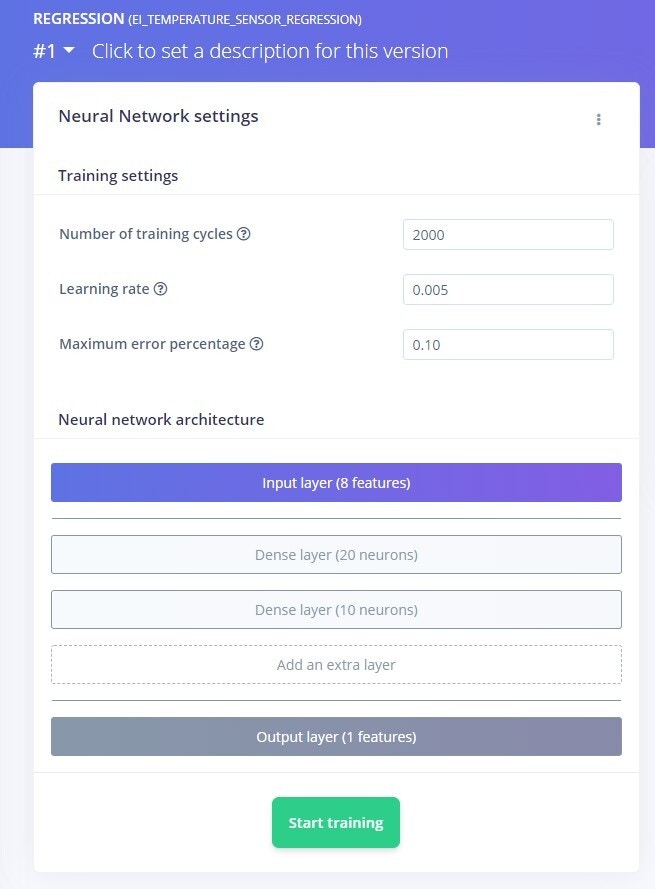
NN Classifier Block Design for Regression
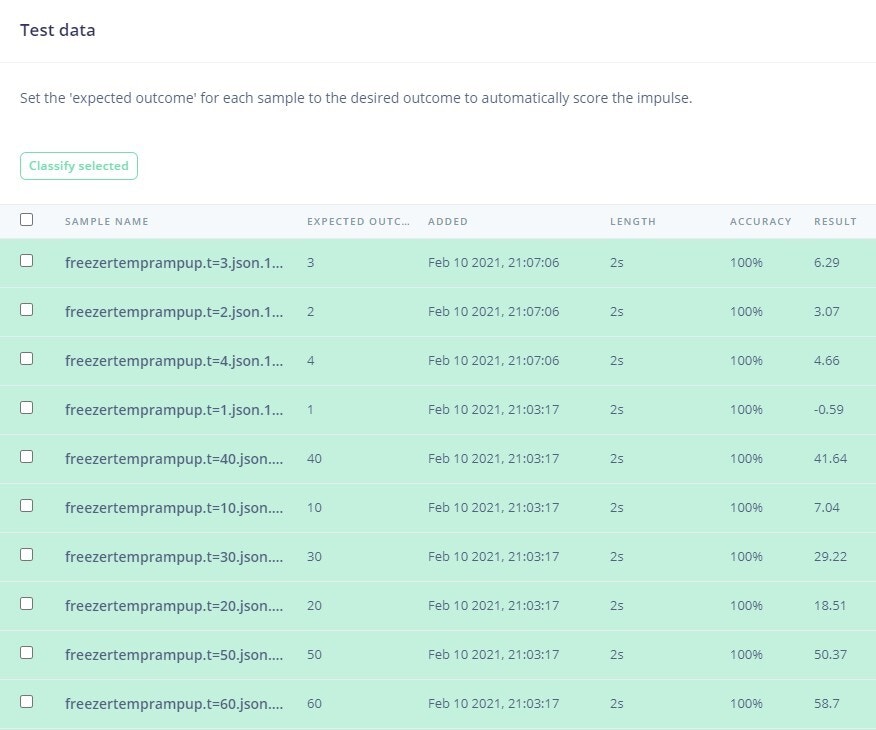
##Step 3: Validate the Regression Model The final step is to validate our model and for this we have used the similar splicing method from before to assemble some data samples in our test dataset. We label the expected outcome according to where the data was gathered from along the slope, and then use the “Model Testing” tab to validate our model. Our results are within acceptable accuracy. From an end application standpoint, it can make sense to use these numbers to create similar color coded “zones” as mentioned before for indicating to the system operator how close the system is to arriving at a failure condition.

Validated Results

Access the public version of the Edge Impulse project here to see how this is all setup in more detail. Clone the project if you want to experiment with this in your own account.