Supported input types: Model monitoring is currently supported for image and audio projects when using the Linux runner with camera or microphone input. Support for additional input types, such as timeseries, is coming soon.
Why use model monitoring?
Model monitoring is useful when you want to:- detect gaps between training data and real-world production inputs
- identify silent failures such as poor lighting, camera occlusion, background noise, or sensor degradation
- observe drift as conditions change over time
- compare how different deployment variants behave on real hardware
How it works
- Train your model in Edge Impulse Studio and prepare it for deployment.
- Run the Edge Impulse Linux runner on your device with the
--monitorflag. - The runner downloads the selected model, performs continuous inferencing locally, and periodically uploads monitoring summaries to Studio.
- Open Model monitoring in your project to review summary statistics and graphs over time.
Model monitoring runs through the Edge Impulse Linux runner. The model continues to execute on-device; Studio receives monitoring summaries from the running deployment.
Prerequisites
Before you start, make sure you have:- a trained project in Edge Impulse Studio
- at least one Linux device connected to your project in Edge Impulse Studio
- the Edge Impulse Linux CLI installed at version
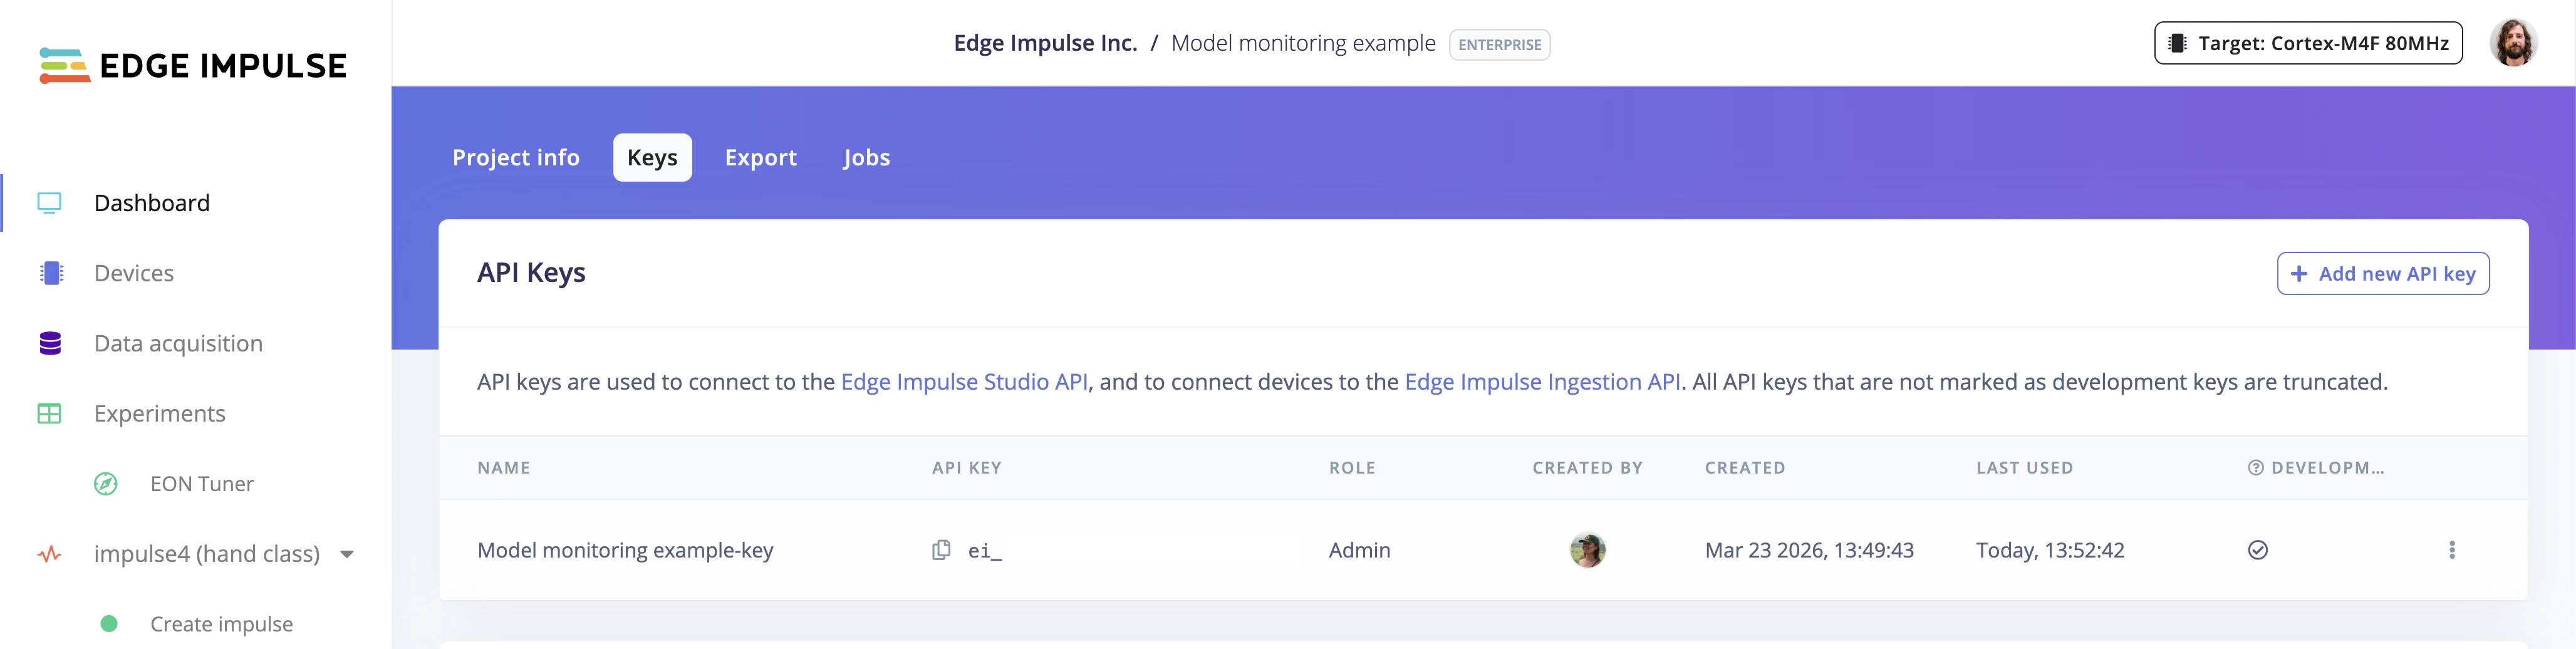
1.15.2or later - a project API key from Dashboard > Keys
- an active internet connection on the target device
- the appropriate input device attached and available, such as a camera for image models or a microphone for audio models
Start model monitoring on the device
- Open your project in Studio.
- Copy a project API key from Dashboard > Keys.
- On the device, start the runner with model monitoring enabled:
- fetch the selected impulse and prepare the deployment for the device
- start continuous inferencing on the device
- send periodic monitoring summaries back to Studio
Ctrl+C to stop the runner.
Optional runner flags
To control which deployment variant is used or to adjust monitoring behavior, you can add flags such as:--impulse-idto select a specific impulse--quantizedto run the int8 version instead of the float32 version--cameraor--microphoneto select a specific input device--monitor-summary-interval-msto adjust how often monitoring summaries are sent
Overriding classification thresholds
For classification projects, the runner applies a default threshold of 0.001 for class scores. For object detection and visual anomaly detection, the threshold defined in your project settings is used. When you start the runner, you may see log output like:42.min_score=0.8). Using just min_score=0.8 will fail to parse:
View results in Studio
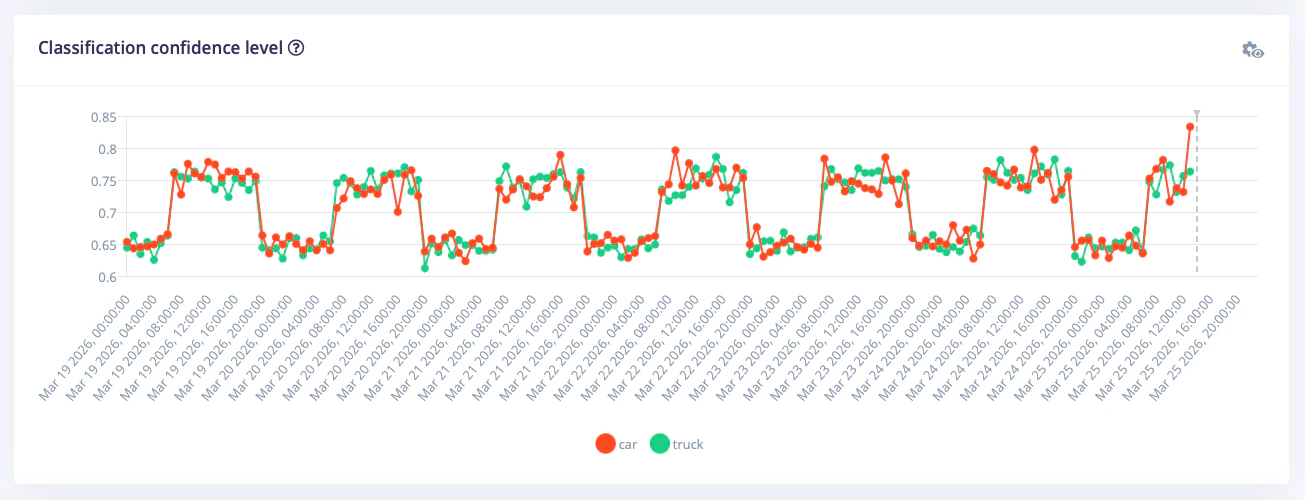
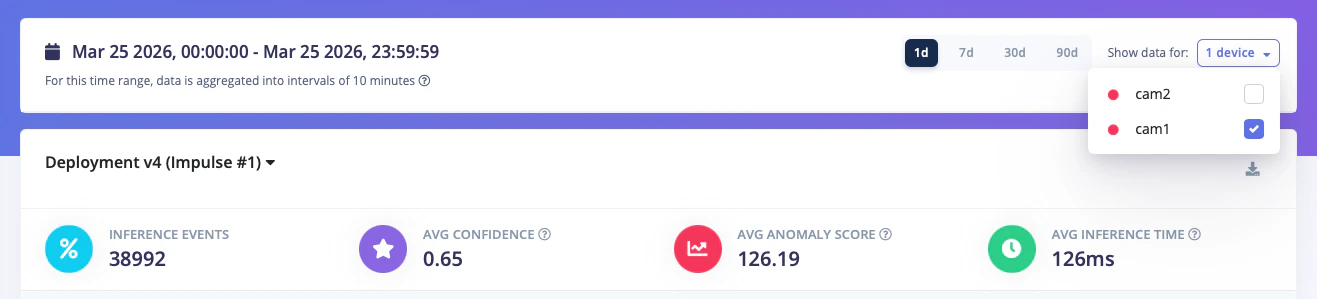
Once the runner has been active for a few minutes, open Model monitoring in your project navigation. The page shows summary cards and time-series visualizations to help you understand how the deployed model behaves in the field.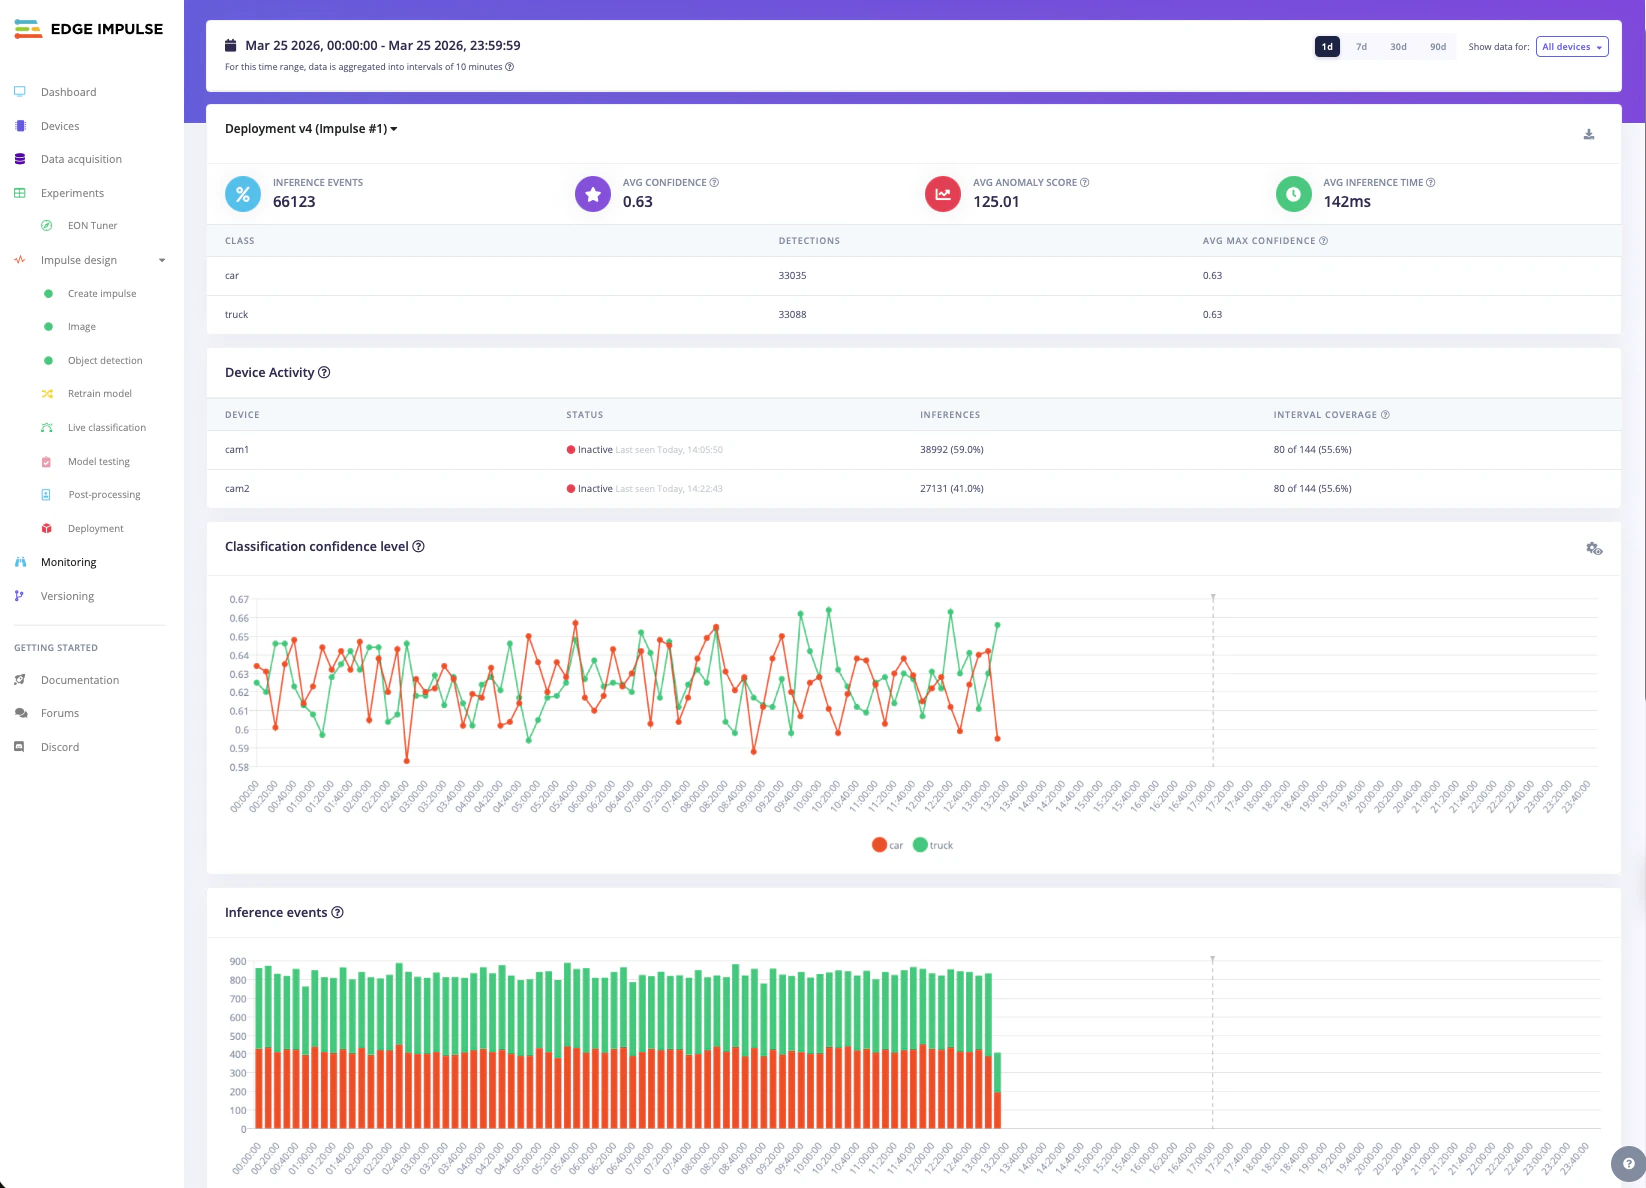
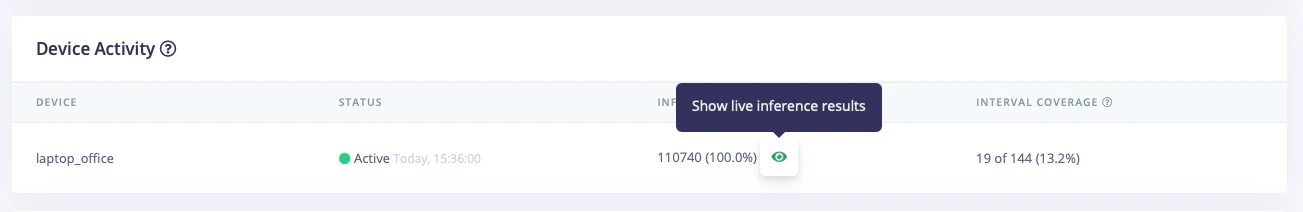
Live inference drill-down
For deeper analysis, you can drill down into a specific device to view live inference activity and detailed statistics. This lets you:- see real-time predictions as they are made on the device
- monitor confidence levels and class scores for each inference
- spot anomalies or unexpected results immediately
Recommended evaluation scenarios
Model monitoring is most useful when testing conditions that are difficult to reproduce in a static dataset. Common scenarios include:Reality gap
Train on synthetic or highly controlled data, then run the model on real camera or microphone inputs to see how well it transfers into production. To prototype quickly, you can start from one of our public datasets or generate image data with synthetic data workflows.Silent failures
Introduce controlled faults such as reduced lighting, a partially covered camera, motion blur, background noise, or an off-angle sensor. This helps you understand how the deployed model behaves when hardware or environmental conditions degrade.Drift
Leave the device running while conditions change over time, for example from day to night, across a shift change, or as objects in a scene vary. Monitoring trends over a longer period can surface changes that may not appear during short spot checks.API endpoints (coming soon)
The following API endpoints will be made public soon for accessing model monitoring data:- GET
/api/{projectId}/devices/inference-history— get summary metrics for past on-device inferences, aggregated by device and time - GET
/api/{projectId}/deployment/monitoring— get information about deployments available for model monitoring - POST
/api/{projectId}/jobs/export-inference-history— start a job to collate and export on-device inference history data for a given time range - GET
/api/{projectId}/devices/inference-history/download-export— download exported on-device inference history data
These endpoints are currently internal-only. Public documentation will be added when they become available.
Troubleshooting
If you do not see data in Studio:- confirm that the device has internet connectivity
- verify that the project API key is correct
- check that the Linux runner version is
1.15.2or later - leave the runner active long enough for summaries to be uploaded
- confirm that the required input source, such as a camera or microphone, is available to the runner