- Model Comparison: Metrics allow you to compare different models and see which one performs better.
- Model Tuning: They help you adjust and improve your model by showing where it might be going wrong.
- Model Validation: Metrics ensure that your model generalizes well to new data, rather than just memorizing the training data (a problem known as overfitting).
When to Use Different Metrics
Choosing the right metric depends on your specific task and the application’s requirements:- Precision: Needed when avoiding false positives, such as in medical diagnosis. (Read on Scikit-learn Precision | Read on TensorFlow Precision)
- Recall: Vital when missing detections is costly, like in security applications. (Read on Scikit-learn Recall | Read on TensorFlow Recall)
- Lower IoU Thresholds: Suitable for tasks where rough localization suffices.
- Higher IoU Thresholds: Necessary for tasks requiring precise localization.
Types of Evaluation Metrics
- Classification Metrics
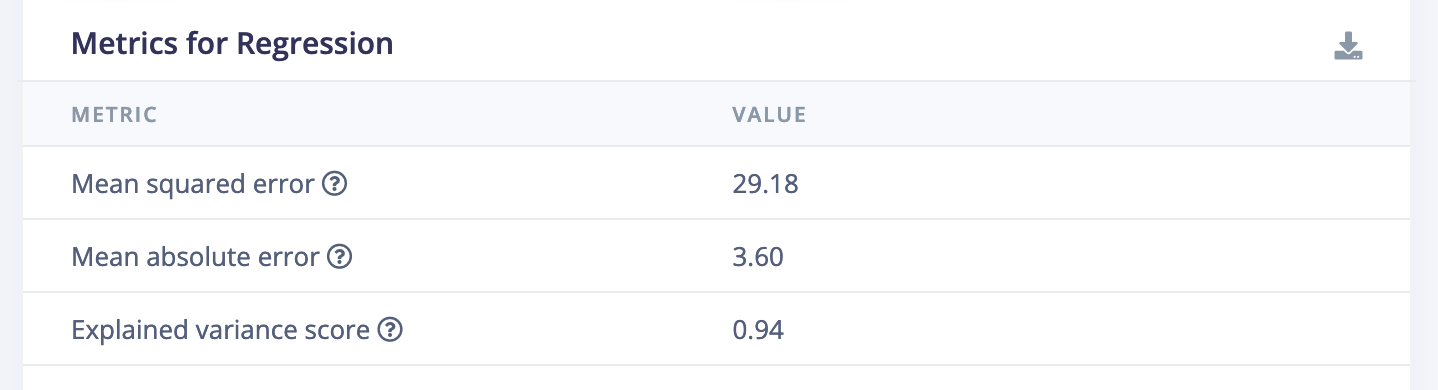
- Regression Metrics
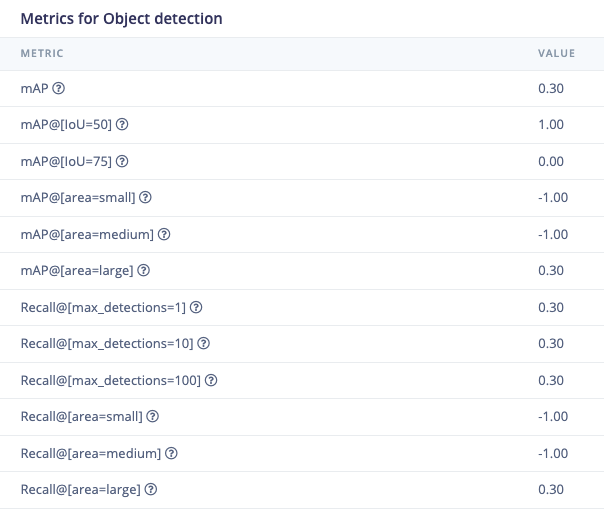
- Object Detection Metrics
Classification Metrics
-
Accuracy: Measures the percentage of correct predictions out of all predictions. For instance, in a model that classifies sounds on a wearable device, accuracy tells you how often the model gets it right. (Read on Scikit-learn Accuracy | Read on TensorFlow Accuracy)
- ( TP ): True Positives
- ( TN ): True Negatives
- ( FP ): False Positives
- ( FN ): False Negatives
- Precision: The percentage of true positive predictions out of all positive predictions made by the model. This is crucial in cases where false positives can have significant consequences, such as in health monitoring devices. (Read on Scikit-learn Precision | Read on TensorFlow Precision)
- Recall: The percentage of actual positive instances that the model correctly identified. For example, in a fall detection system, recall is vital because missing a fall could lead to serious consequences. (Read on Scikit-learn Recall | Read on TensorFlow Recall)
- F1 Score: The harmonic mean of precision and recall, useful when you need to balance the trade-offs between false positives and false negatives. (Read on Scikit-learn F1 Score | Read on TensorFlow F1 Score)
- Confusion Matrix: A table that shows the number of correct and incorrect predictions made by the model. It helps visualize the model’s performance across different classes. (Read on Scikit-learn Confusion Matrix | Read on TensorFlow Confusion Matrix)
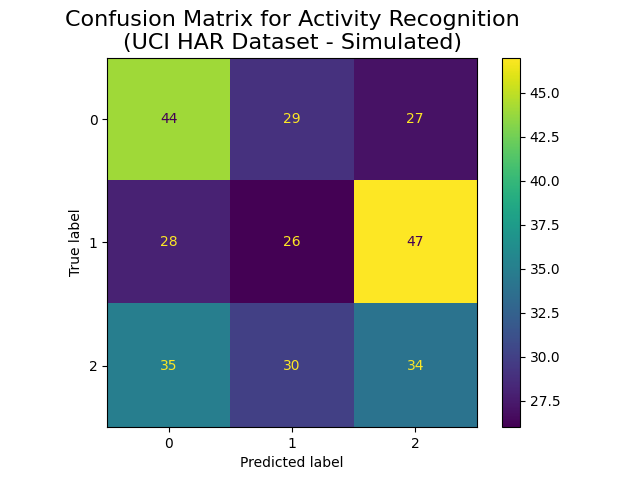
Confusion Matrix for Activity Recognition (UCI HAR Dataset - Simulated)
- Labels: The “True label” on the Y-axis represents the actual class labels of the activities. The “Predicted label” on the X-axis represents the class labels predicted by the model.
- Classes: The dataset seems to have three classes, represented as 0, 1, and 2. These likely correspond to different human activities.
-
Matrix Cells: The cells in the matrix contain the number of samples classified in each combination of actual versus predicted class.
- For instance: The top-left cell (44) indicates that the model correctly predicted class 0 for 44 instances where the true label was also 0.
- The off-diagonal cells represent misclassifications. For example, the cell at row 0, column 1 (29) shows that 29 samples were true class 0 but were incorrectly predicted as class 1.
- Color Scale: The color scale on the right represents the intensity of the values in the cells, with lighter colors indicating higher values and darker colors indicating lower values.
-
ROC-AUC: The area under the receiver operating characteristic curve, showing the trade-off between true positive rate and false positive rate. (Read on Scikit-learn ROC-AUC | Read on TensorFlow AUC)
- The ROC curve plots True Positive Rate (Recall) against False Positive Rate (FPR), where:
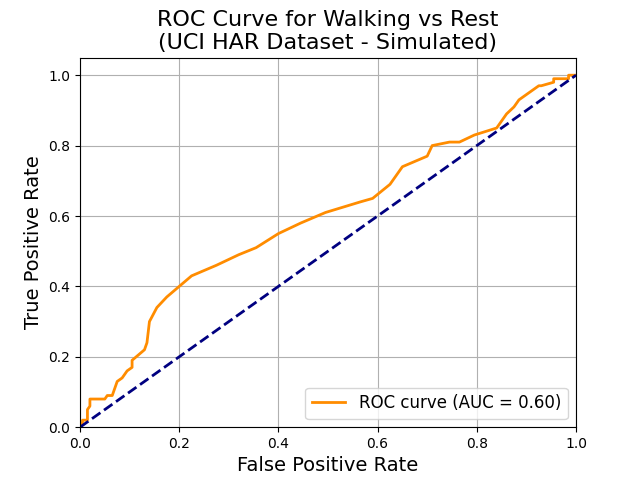
ROC Curve for Walking vs Rest (UCI HAR Dataset - Simulated)
- True Positive Rate (Y-axis): This is the proportion of actual positives (walking instances) that the model correctly identifies (recall).
- False Positive Rate (X-axis): This is the proportion of actual negatives (rest instances) that the model incorrectly identifies as positives (false positives).
-
Precision-Recall Curve: Useful in evaluating binary classification models, especially when dealing with imbalanced datasets, like in the context of walking vs resting activities. The Precision-Recall curve shows the trade-off between precision and recall for various threshold settings of the classifier.
- Precision (Y-axis): Precision measures the proportion of true positive predictions among all positive predictions made by the model. High precision means that when the model predicts “Walking,” it is correct most of the time.
-
Recall (X-axis): Recall (or True Positive Rate) measures the proportion of actual positives (walking instances) that the model correctly identifies. High recall indicates that the model successfully identifies most instances of walking.
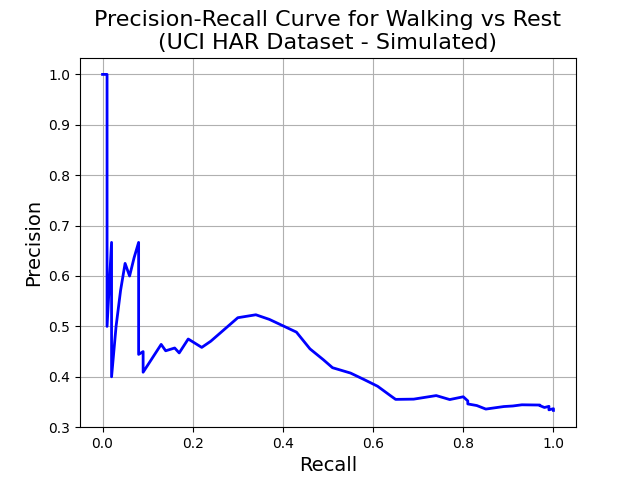
Precision-Recall Curve for Walking vs Rest (UCI HAR Dataset - Simulated)
-
Log Loss: The negative log-likelihood of the true labels given the model predictions. (Read on Scikit-learn Log Loss | Read on TensorFlow Log Loss)
- ( y_i ): Actual label
- ( p_i ): Predicted probability
- ( N ): Number of samples
Importance of Evaluation Metrics
Evaluation metrics serve multiple purposes in the impulse lifecycle:- Model Selection: They enable you to compare different models and choose the one that best suits your needs.
- Model Tuning: Metrics guide you in fine-tuning models by providing feedback on their performance.
- Model Interpretation: Metrics help understand how well a model performs and where it might need improvement.
- Model Deployment: Before deploying a model in real-world applications, metrics are used to ensure it meets the required standards.
- Model Monitoring: After deployment, metrics continue to monitor the model’s performance over time.
How to Choose the Right Metric
Choosing the right metric depends on the specific task and application requirements:- For classification: In an Edge AI application like sound detection on a wearable device, precision might be more important if you want to avoid false alarms, while recall might be critical in safety applications where missing a critical event could be dangerous.
- For regression: If you’re predicting energy usage in a smart home, MSE might be preferred because it penalizes large errors more, ensuring your model’s predictions are as accurate as possible.
- For object detection: If you’re working on an edge-based animal detection camera, mAP with a higher IoU threshold might be crucial for ensuring the camera accurately identifies and locates potential animals.