> ## Documentation Index
> Fetch the complete documentation index at: https://docs.edgeimpulse.com/llms.txt
> Use this file to discover all available pages before exploring further.
# Generate time-series data using MATLAB
> Generate synthetic time-series motion data in MATLAB using the Signal Processing Toolbox, and upload it to Edge Impulse for training.
export const CardOpenStudioTutorial = ({href}) =>
Skip the setup: clone a ready-to-use Edge Impulse project with the dataset, impulse, and trained model.
;
[MATLAB](https://matlab.mathworks.com/) is a powerful tool for generating synthetic motion data for machine learning applications. With built-in functions such as the Signal Processing Toolbox and Image Processing Toolbox and capabilities, MATLAB makes it easy to simulate real-world sensor data, generate labelled datasets, and preprocess data for edge AI applications.
In this tutorial, you will learn how to:
1. Define simulation parameters ([sampling frequency](https://uk.mathworks.com/help/signal/ug/changing-signal-sample-rate.html), [signal duration](https://uk.mathworks.com/help/stateflow/ref/duration.html?searchHighlight=signal+duration\&s_tid=srchtitle_support_results_1_signal+duration), [random seed](https://uk.mathworks.com/help/matlab/ref/rng.html?searchHighlight=random+seed\&s_tid=srchtitle_support_results_1_random+seed)).
2. Generate multiple motion classes (e.g., “idle,” “snake,” “up-down”).
3. Add realistic noise and emulate sensor characteristics.
4. Label data automatically in MATLAB.
5. Save your signals to CSV.
6. Import the labeled CSV into Edge Impulse.
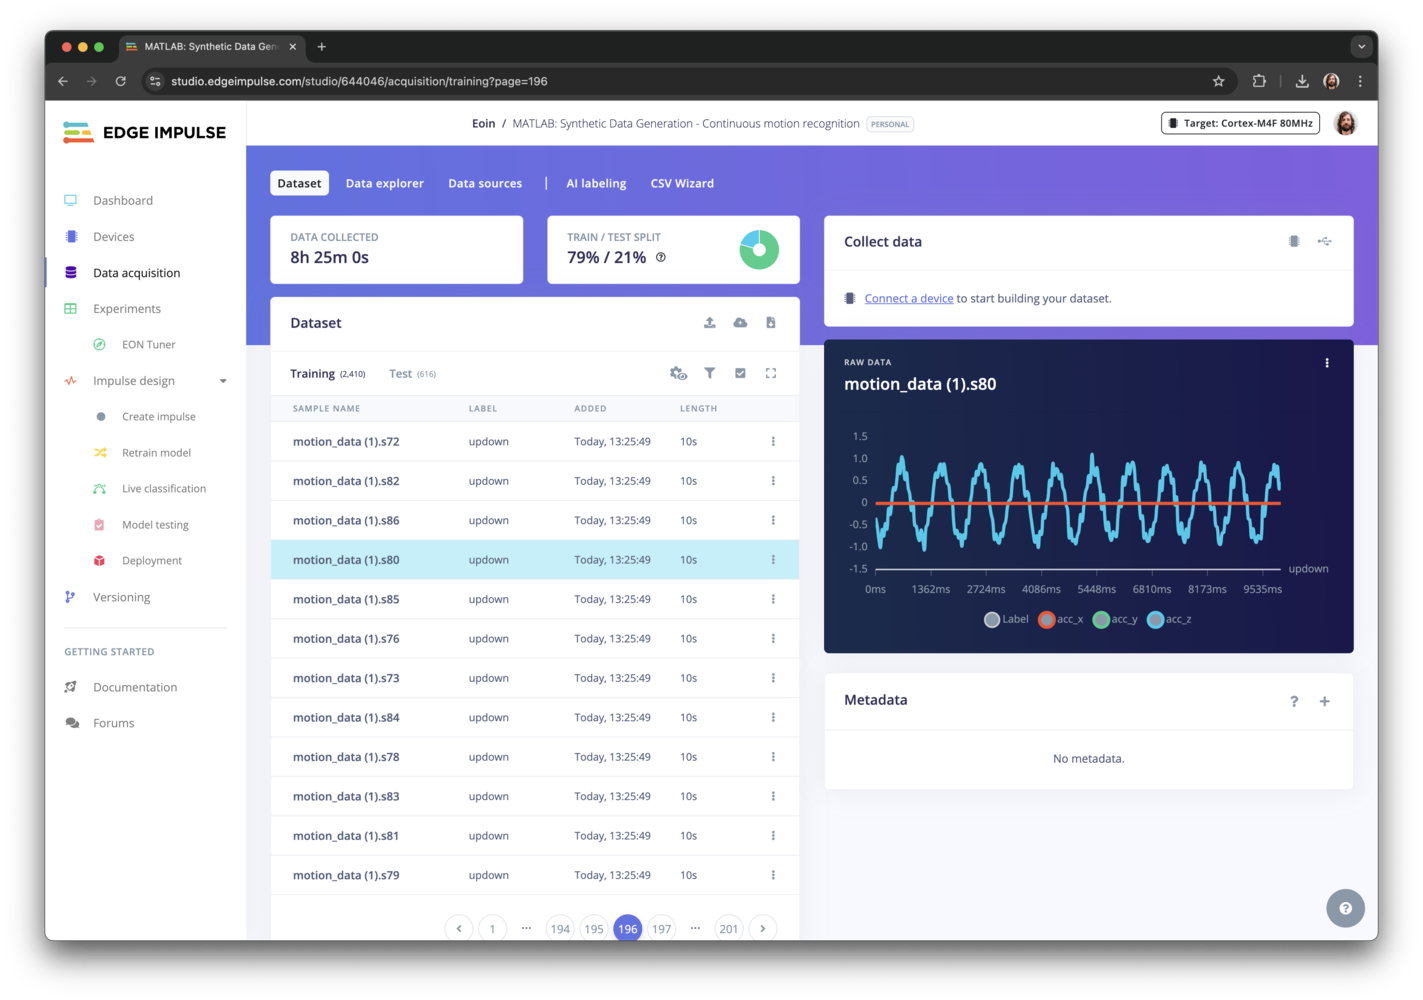 ## Example: Generating continuous motion data (up-down snake wave and idle) in MATLAB
Below, we recreate a continuous motion sample project that could be used to test wearable sensors, monitor vibrations, or simulate small repetitive movements in an industrial setting.
## Example: Generating continuous motion data (up-down snake wave and idle) in MATLAB
Below, we recreate a continuous motion sample project that could be used to test wearable sensors, monitor vibrations, or simulate small repetitive movements in an industrial setting.
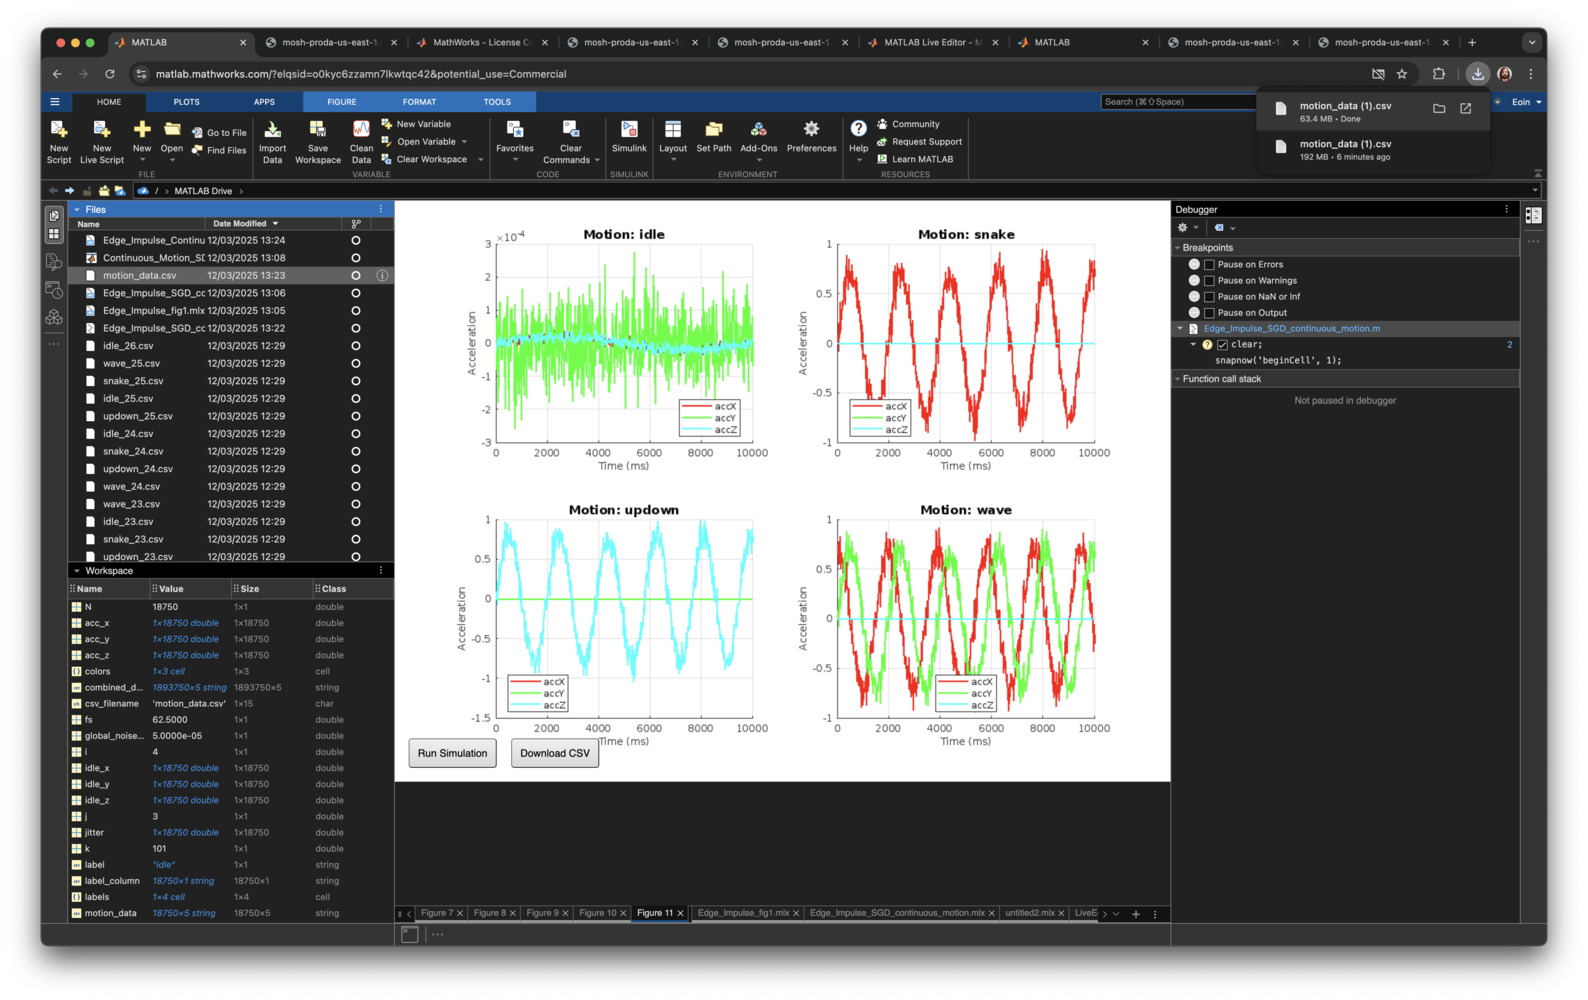 #### MATLAB Online
You can run MATLAB entirely in the browser using MATLAB Online. This makes it easy to share your project, collaborate, or quickly try out scripts without installing anything locally.
## Prerequisites
You will need:
* A MATLAB license or MathWorks account to access [MATLAB Online](https://matlab.mathworks.com/).
* Our synthetic motion generation script see the [public project description](https://studio.edgeimpulse.com/public/644046/live) for the full script.
## Getting Started
1. Open **MATLAB** or go to **MATLAB Online**.
2. Create a new Live Script (.mlx) or MATLAB script (.m).
3. Copy-paste the synthetic motion generation code from the [public project description](https://studio.edgeimpulse.com/public/644046/live) for continuous motion data.
#### MATLAB Online
You can run MATLAB entirely in the browser using MATLAB Online. This makes it easy to share your project, collaborate, or quickly try out scripts without installing anything locally.
## Prerequisites
You will need:
* A MATLAB license or MathWorks account to access [MATLAB Online](https://matlab.mathworks.com/).
* Our synthetic motion generation script see the [public project description](https://studio.edgeimpulse.com/public/644046/live) for the full script.
## Getting Started
1. Open **MATLAB** or go to **MATLAB Online**.
2. Create a new Live Script (.mlx) or MATLAB script (.m).
3. Copy-paste the synthetic motion generation code from the [public project description](https://studio.edgeimpulse.com/public/644046/live) for continuous motion data.
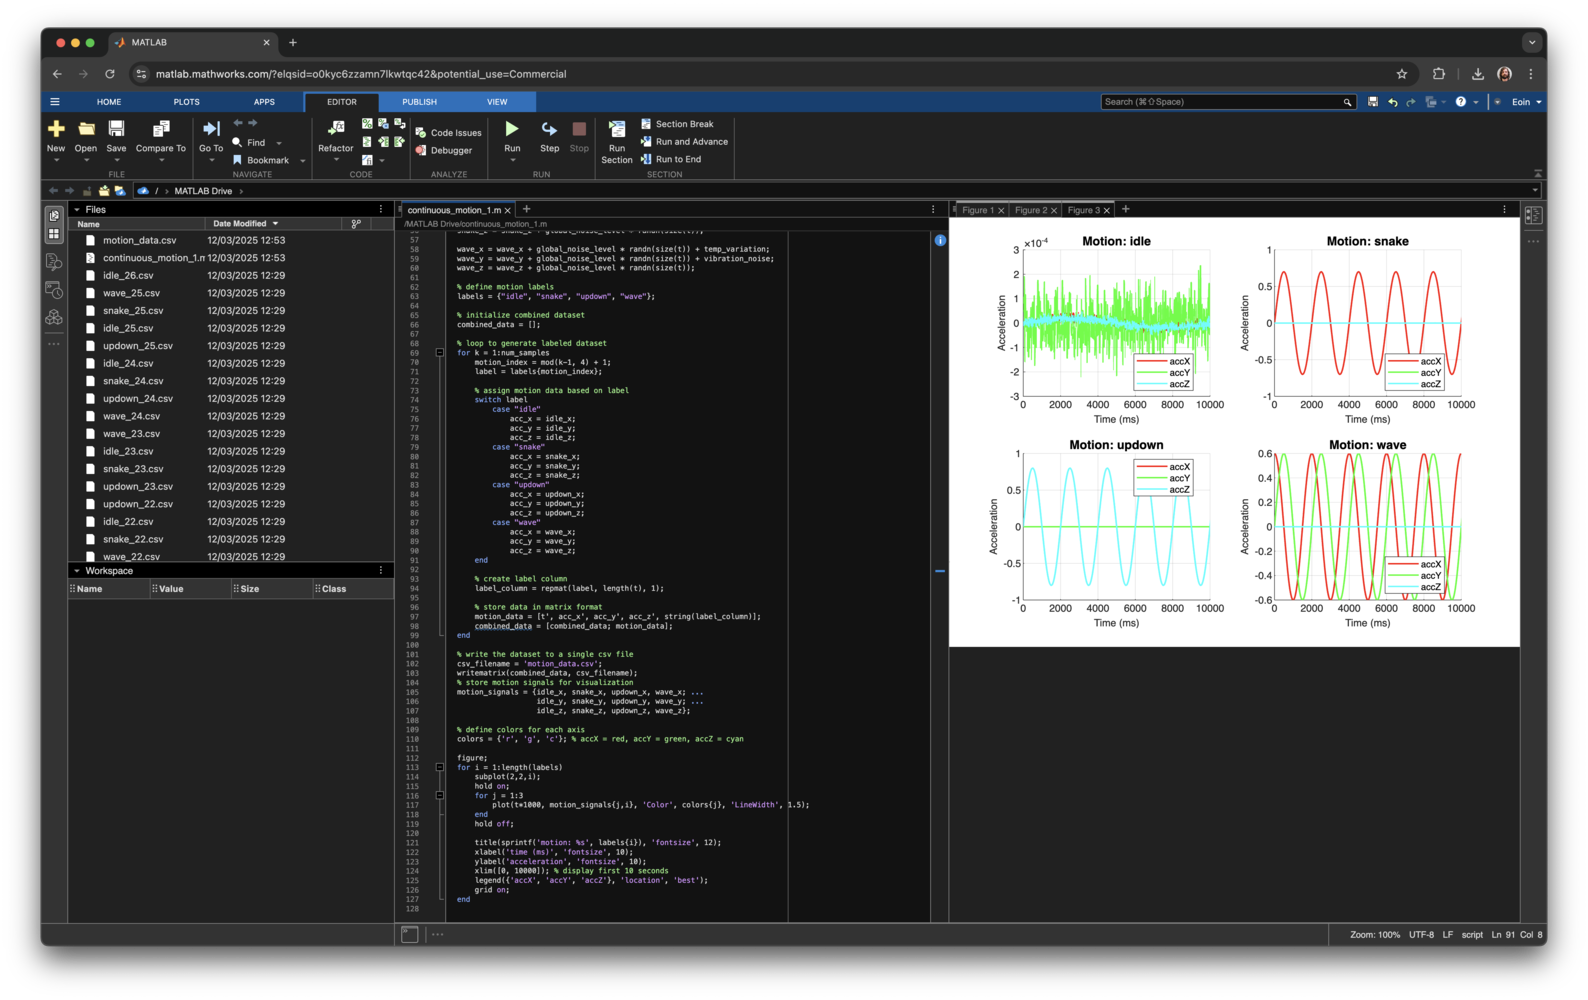 ## Customizing parameters to simulate motion data
There are several parameters to consider when generating synthetic motion data.
You can customize:
* **Sampling Frequency (fs):** Controls how frequently data is sampled (e.g., 62.5 Hz).
* **Total Duration (t\_end):** How long the simulated signal is (e.g., 15 minutes).
* **Types of Motion:**
* **Up-Down Motion:** Simple sinusoidal vertical oscillations.
* **Snake Motion:** Horizontal oscillation with amplitude modulation.
* **Wave Motion:** Circular or elliptical motion in the XY-plane.
* Add realistic noise or drift to make the data look more authentic. Consider sensor-specific noise levels and random jitter.
In this basic example we generate a simple up-down motion, but you can extend this to include more complex motions or multiple classes of motion.
### Script overview
**Running the Script:** Generates labeled time-series data (e.g., **idle, snake, updown, wave**).
**Save to CSV:** The script automatically writes to **motion\_data.csv.**
**Visualize:** MATLAB’s plot and subplot functions help verify that the signals make sense.
Below is a minimal code snippet compare with your own script for advanced features:
```matlab theme={"system"}
% Clear workspace to start fresh
clear; clc;
% Sampling settings
fs = 62.5;
t_end = 15 * 60;
t = 0:1/fs:t_end-1/fs;
% Generate signals
jitter = 0.1 * randn(size(t)); % random noise
updown_z = 0.8 * sin(2*pi*0.5 * t) + jitter; % up-down motion
% Combine or loop over motions
combined_data = [t' updown_z'];
csv_filename = 'motion_data.csv';
writematrix(combined_data, csv_filename);
disp(['Data saved as ', csv_filename]);
% Quick plot
figure;
plot(t, updown_z, 'LineWidth', 1.5);
xlabel('Time (s)');
ylabel('Amplitude');
title('Synthetic Up-Down Motion');
```
### Multi-axis acc\_x, acc\_y, acc\_z example
In many real applications, you have multiple axes (e.g., acc\_x, acc\_y, acc\_z). You can extend the same logic for each axis:
```matlab theme={"system"}
rng(0); % For reproducibility
fs = 62.5;
t_end = 15;
t = 0:1/fs:t_end-1/fs;
% Generate multiple axes
noise_x = 0.05*randn(size(t));
noise_y = 0.05*randn(size(t));
noise_z = 0.05*randn(size(t));
signal_x = sin(2*pi*1.0 * t) + noise_x;
signal_y = 0.5 * sin(2*pi*0.5 * t) + noise_y;
signal_z = 0.8 * sin(2*pi*0.2 * t) + noise_z;
combined_data_3axis = [t' signal_x' signal_y' signal_z'];
```
### Generating and Labeling Multiple Classes
If you want to generate multiple classes like idle, snake, updown, wave you can segment your time vector and assign labels programmatically.
Here’s a minimal example:
```matlab theme={"system"}
% Clear workspace
clear; clc; rng(0); % set random seed
% Sampling settings
fs = 62.5;
t_end = 60; % 1 minute total for example
t = 0:1/fs:t_end-1/fs;
% Pre-allocate signal arrays
motion_signal = zeros(size(t));
labels = strings(size(t)); % label each sample
% Example: define time ranges for each motion
idle_duration = 10; % first 10s idle
snake_duration = 20; % next 20s snake
updown_duration = 30; % last 30s up-down
% Generate Idle
idle_idx = t <= idle_duration;
motion_signal(idle_idx) = 0 + 0.05*randn(1, sum(idle_idx));
labels(idle_idx) = "idle";
% Generate Snake motion
snake_idx = t > idle_duration & t <= (idle_duration + snake_duration);
snake_t = t(snake_idx) - idle_duration;
motion_signal(snake_idx) = 0.3 * sin(2*pi*0.8 * snake_t) + 0.05*randn(size(snake_t));
labels(snake_idx) = "snake";
% Generate Up-Down motion
updown_idx = t > (idle_duration + snake_duration);
updown_t = t(updown_idx) - (idle_duration + snake_duration);
motion_signal(updown_idx) = 0.8 * sin(2*pi*0.5 * updown_t) + 0.1*randn(size(updown_t));
labels(updown_idx) = "updown";
% Combine data and labels into one matrix
combined_data = [t' motion_signal'];
csv_filename = 'motion_data.csv';
% Write numeric data
writematrix(combined_data, csv_filename);
% Write labels in a second file or append to CSV with e.g. "writetable"
T = table(t', motion_signal', labels', 'VariableNames', {'time','motion','label'});
writetable(T, 'motion_data_labeled.csv');
disp(['Data saved as ', csv_filename, ' and motion_data_labeled.csv']);
% Quick plot
figure;
plot(t, motion_signal, 'LineWidth', 1.2);
xlabel('Time (s)');
ylabel('Amplitude');
title('Synthetic Multi-Class Motion');
```
In practice, you can repeat this process for each axis (e.g., x, y, z) and store all signals plus labels in a single table.
## Benefits of using MATLAB for time-series data generation
* Enhance Data Quality: Create reliable time-series signals that closely mimic real-world conditions.
* Increase Dataset Diversity: Generate multiple classes of motion, from subtle vibrations to large, sinusoidal oscillations.
* Save Time and Resources: No need to set up physical experiments to capture sensor data—scripted generation is repeatable and cost-effective.
* Improve Model Accuracy: High-quality, diverse signals help close dataset gaps, reducing overfitting and improving real-world performance.
## Importing synthetic motion data into Edge Impulse
Once you have your synthetic data, you can use it to train a model in Edge Impulse. Check out the [Continuous motion recognition](https://studio.edgeimpulse.com/public/644046/live) project for a complete example.
### Use the CSV Wizard to import your data into a project.
Now that you have your synthetic motion data, you can import it into your project using the CSV Wizard.
## Customizing parameters to simulate motion data
There are several parameters to consider when generating synthetic motion data.
You can customize:
* **Sampling Frequency (fs):** Controls how frequently data is sampled (e.g., 62.5 Hz).
* **Total Duration (t\_end):** How long the simulated signal is (e.g., 15 minutes).
* **Types of Motion:**
* **Up-Down Motion:** Simple sinusoidal vertical oscillations.
* **Snake Motion:** Horizontal oscillation with amplitude modulation.
* **Wave Motion:** Circular or elliptical motion in the XY-plane.
* Add realistic noise or drift to make the data look more authentic. Consider sensor-specific noise levels and random jitter.
In this basic example we generate a simple up-down motion, but you can extend this to include more complex motions or multiple classes of motion.
### Script overview
**Running the Script:** Generates labeled time-series data (e.g., **idle, snake, updown, wave**).
**Save to CSV:** The script automatically writes to **motion\_data.csv.**
**Visualize:** MATLAB’s plot and subplot functions help verify that the signals make sense.
Below is a minimal code snippet compare with your own script for advanced features:
```matlab theme={"system"}
% Clear workspace to start fresh
clear; clc;
% Sampling settings
fs = 62.5;
t_end = 15 * 60;
t = 0:1/fs:t_end-1/fs;
% Generate signals
jitter = 0.1 * randn(size(t)); % random noise
updown_z = 0.8 * sin(2*pi*0.5 * t) + jitter; % up-down motion
% Combine or loop over motions
combined_data = [t' updown_z'];
csv_filename = 'motion_data.csv';
writematrix(combined_data, csv_filename);
disp(['Data saved as ', csv_filename]);
% Quick plot
figure;
plot(t, updown_z, 'LineWidth', 1.5);
xlabel('Time (s)');
ylabel('Amplitude');
title('Synthetic Up-Down Motion');
```
### Multi-axis acc\_x, acc\_y, acc\_z example
In many real applications, you have multiple axes (e.g., acc\_x, acc\_y, acc\_z). You can extend the same logic for each axis:
```matlab theme={"system"}
rng(0); % For reproducibility
fs = 62.5;
t_end = 15;
t = 0:1/fs:t_end-1/fs;
% Generate multiple axes
noise_x = 0.05*randn(size(t));
noise_y = 0.05*randn(size(t));
noise_z = 0.05*randn(size(t));
signal_x = sin(2*pi*1.0 * t) + noise_x;
signal_y = 0.5 * sin(2*pi*0.5 * t) + noise_y;
signal_z = 0.8 * sin(2*pi*0.2 * t) + noise_z;
combined_data_3axis = [t' signal_x' signal_y' signal_z'];
```
### Generating and Labeling Multiple Classes
If you want to generate multiple classes like idle, snake, updown, wave you can segment your time vector and assign labels programmatically.
Here’s a minimal example:
```matlab theme={"system"}
% Clear workspace
clear; clc; rng(0); % set random seed
% Sampling settings
fs = 62.5;
t_end = 60; % 1 minute total for example
t = 0:1/fs:t_end-1/fs;
% Pre-allocate signal arrays
motion_signal = zeros(size(t));
labels = strings(size(t)); % label each sample
% Example: define time ranges for each motion
idle_duration = 10; % first 10s idle
snake_duration = 20; % next 20s snake
updown_duration = 30; % last 30s up-down
% Generate Idle
idle_idx = t <= idle_duration;
motion_signal(idle_idx) = 0 + 0.05*randn(1, sum(idle_idx));
labels(idle_idx) = "idle";
% Generate Snake motion
snake_idx = t > idle_duration & t <= (idle_duration + snake_duration);
snake_t = t(snake_idx) - idle_duration;
motion_signal(snake_idx) = 0.3 * sin(2*pi*0.8 * snake_t) + 0.05*randn(size(snake_t));
labels(snake_idx) = "snake";
% Generate Up-Down motion
updown_idx = t > (idle_duration + snake_duration);
updown_t = t(updown_idx) - (idle_duration + snake_duration);
motion_signal(updown_idx) = 0.8 * sin(2*pi*0.5 * updown_t) + 0.1*randn(size(updown_t));
labels(updown_idx) = "updown";
% Combine data and labels into one matrix
combined_data = [t' motion_signal'];
csv_filename = 'motion_data.csv';
% Write numeric data
writematrix(combined_data, csv_filename);
% Write labels in a second file or append to CSV with e.g. "writetable"
T = table(t', motion_signal', labels', 'VariableNames', {'time','motion','label'});
writetable(T, 'motion_data_labeled.csv');
disp(['Data saved as ', csv_filename, ' and motion_data_labeled.csv']);
% Quick plot
figure;
plot(t, motion_signal, 'LineWidth', 1.2);
xlabel('Time (s)');
ylabel('Amplitude');
title('Synthetic Multi-Class Motion');
```
In practice, you can repeat this process for each axis (e.g., x, y, z) and store all signals plus labels in a single table.
## Benefits of using MATLAB for time-series data generation
* Enhance Data Quality: Create reliable time-series signals that closely mimic real-world conditions.
* Increase Dataset Diversity: Generate multiple classes of motion, from subtle vibrations to large, sinusoidal oscillations.
* Save Time and Resources: No need to set up physical experiments to capture sensor data—scripted generation is repeatable and cost-effective.
* Improve Model Accuracy: High-quality, diverse signals help close dataset gaps, reducing overfitting and improving real-world performance.
## Importing synthetic motion data into Edge Impulse
Once you have your synthetic data, you can use it to train a model in Edge Impulse. Check out the [Continuous motion recognition](https://studio.edgeimpulse.com/public/644046/live) project for a complete example.
### Use the CSV Wizard to import your data into a project.
Now that you have your synthetic motion data, you can import it into your project using the CSV Wizard.
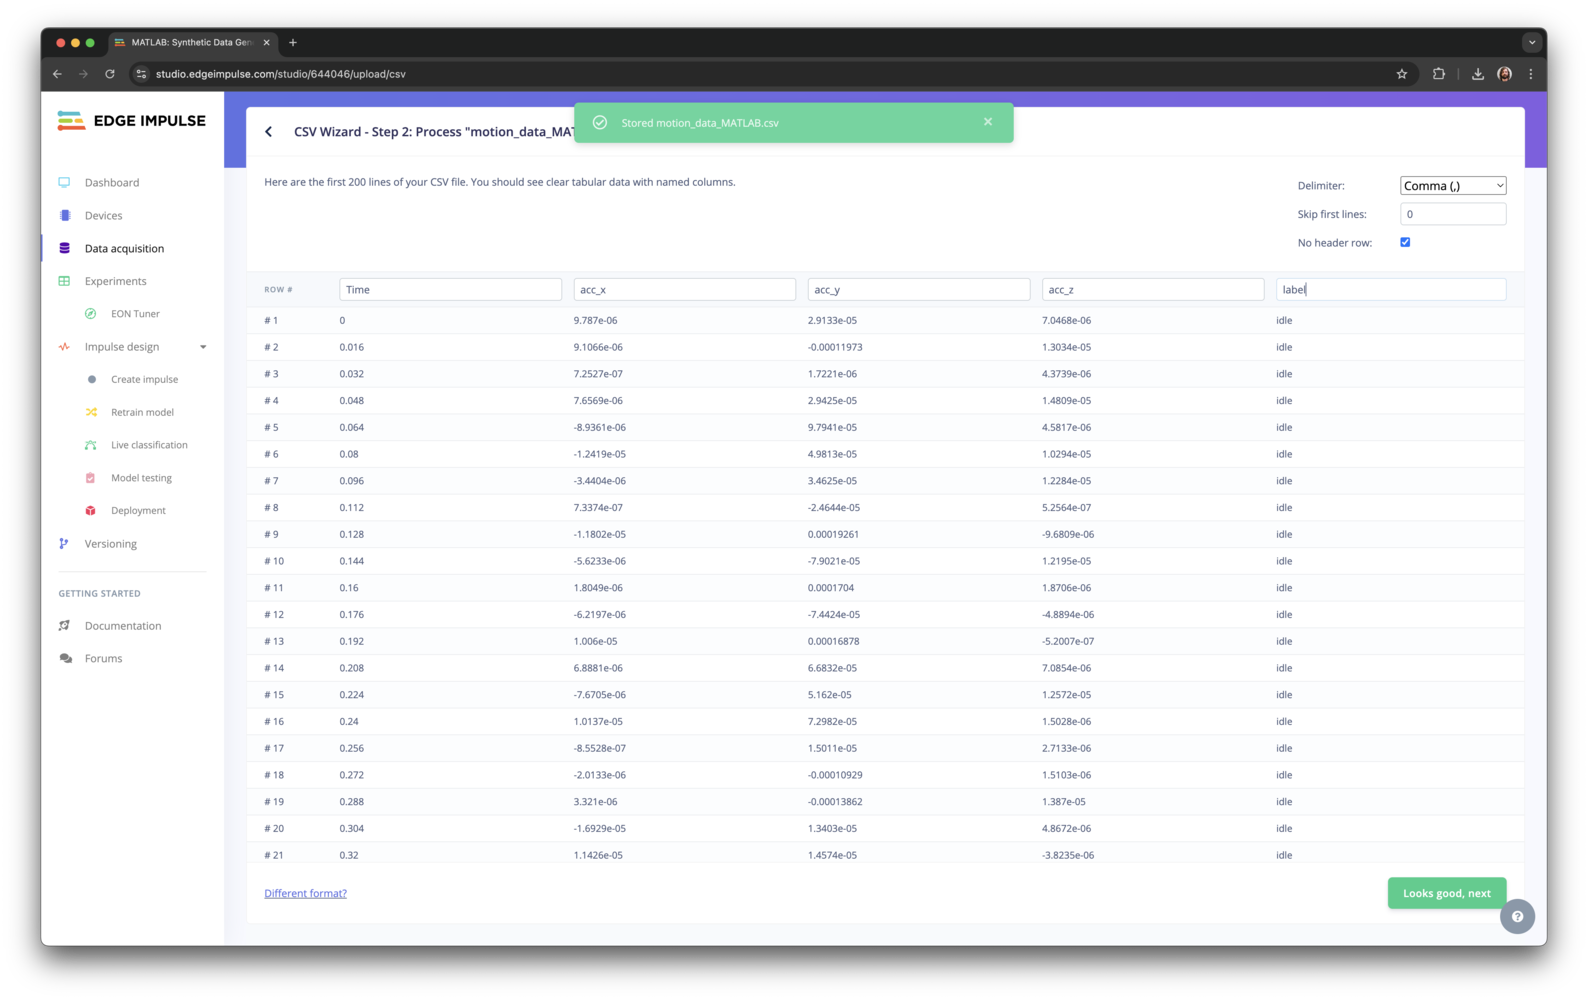 1. Open the Edge Impulse Studio and navigate to the Data Acquisition tab.
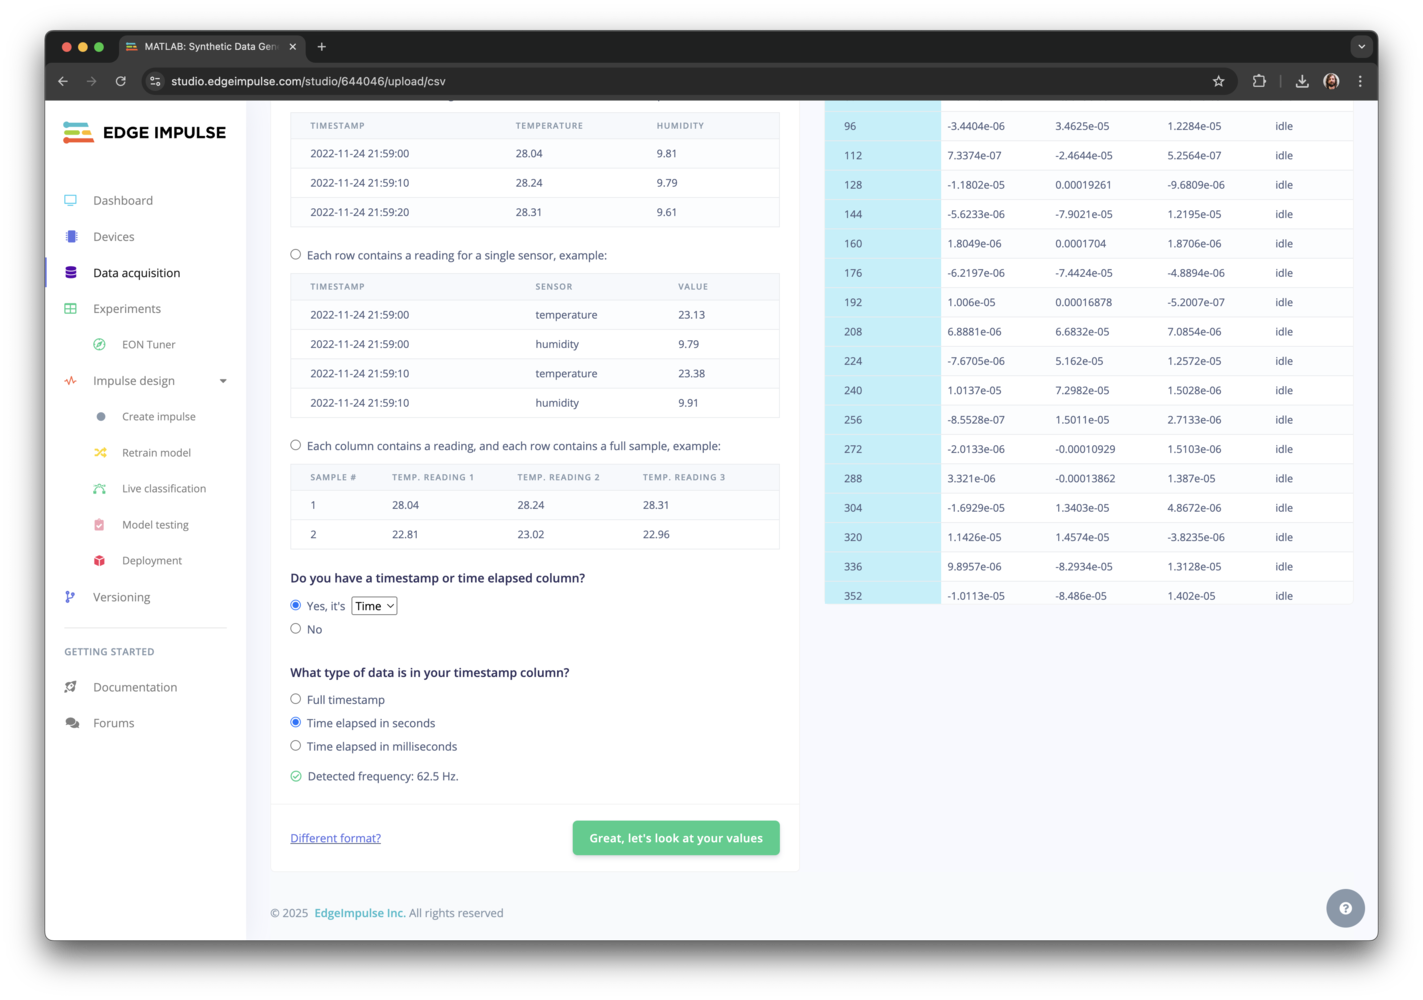 2. Click on the CSV Wizard.
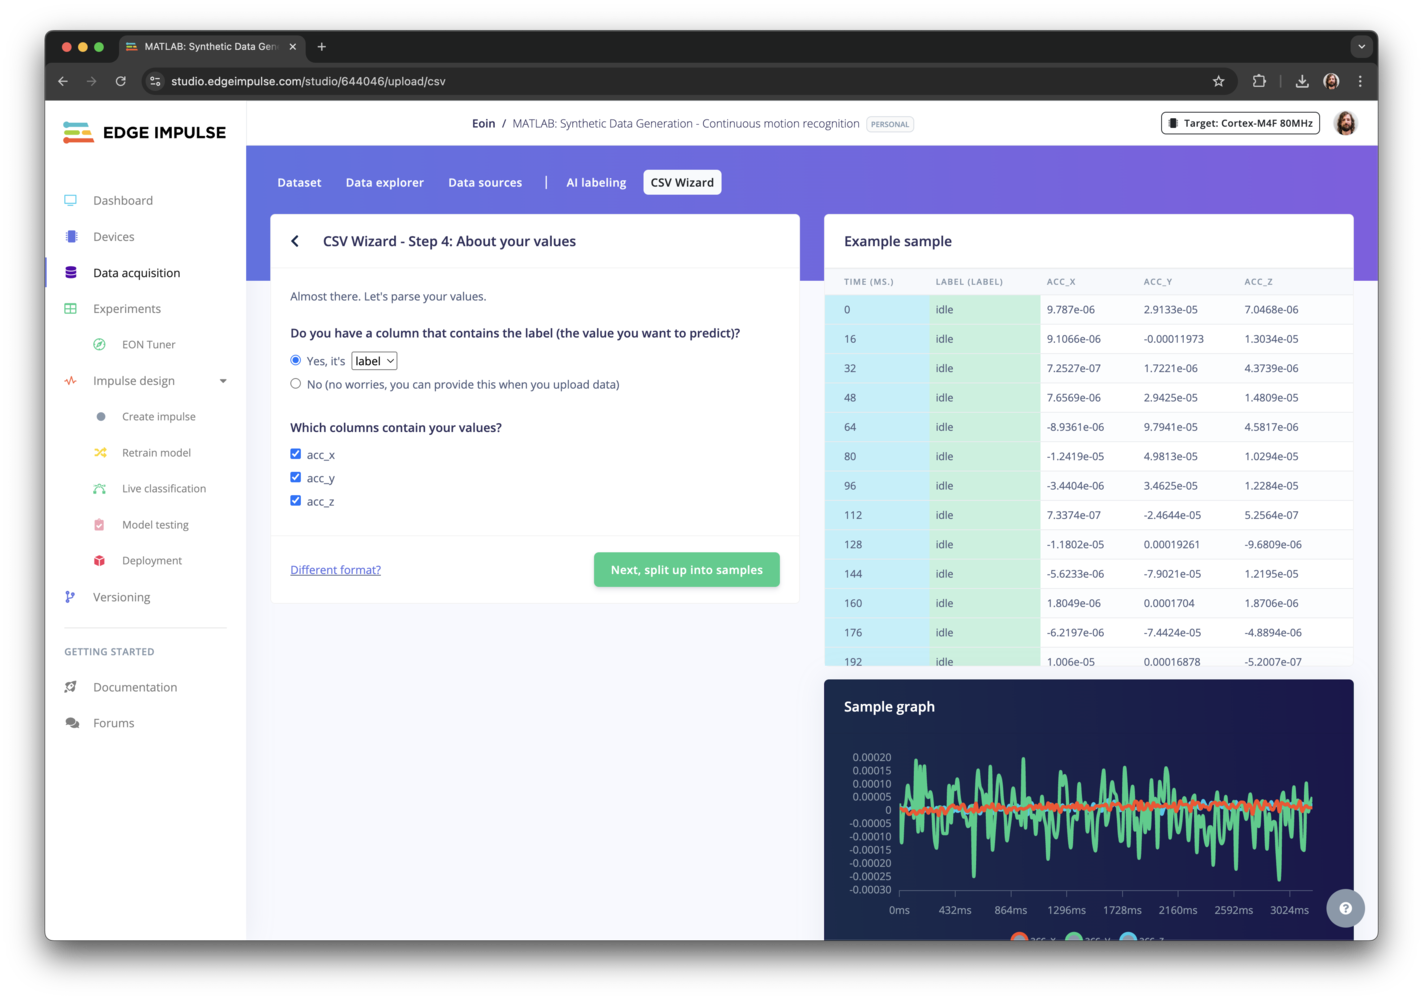 3. Upload the motion\_data.csv file.
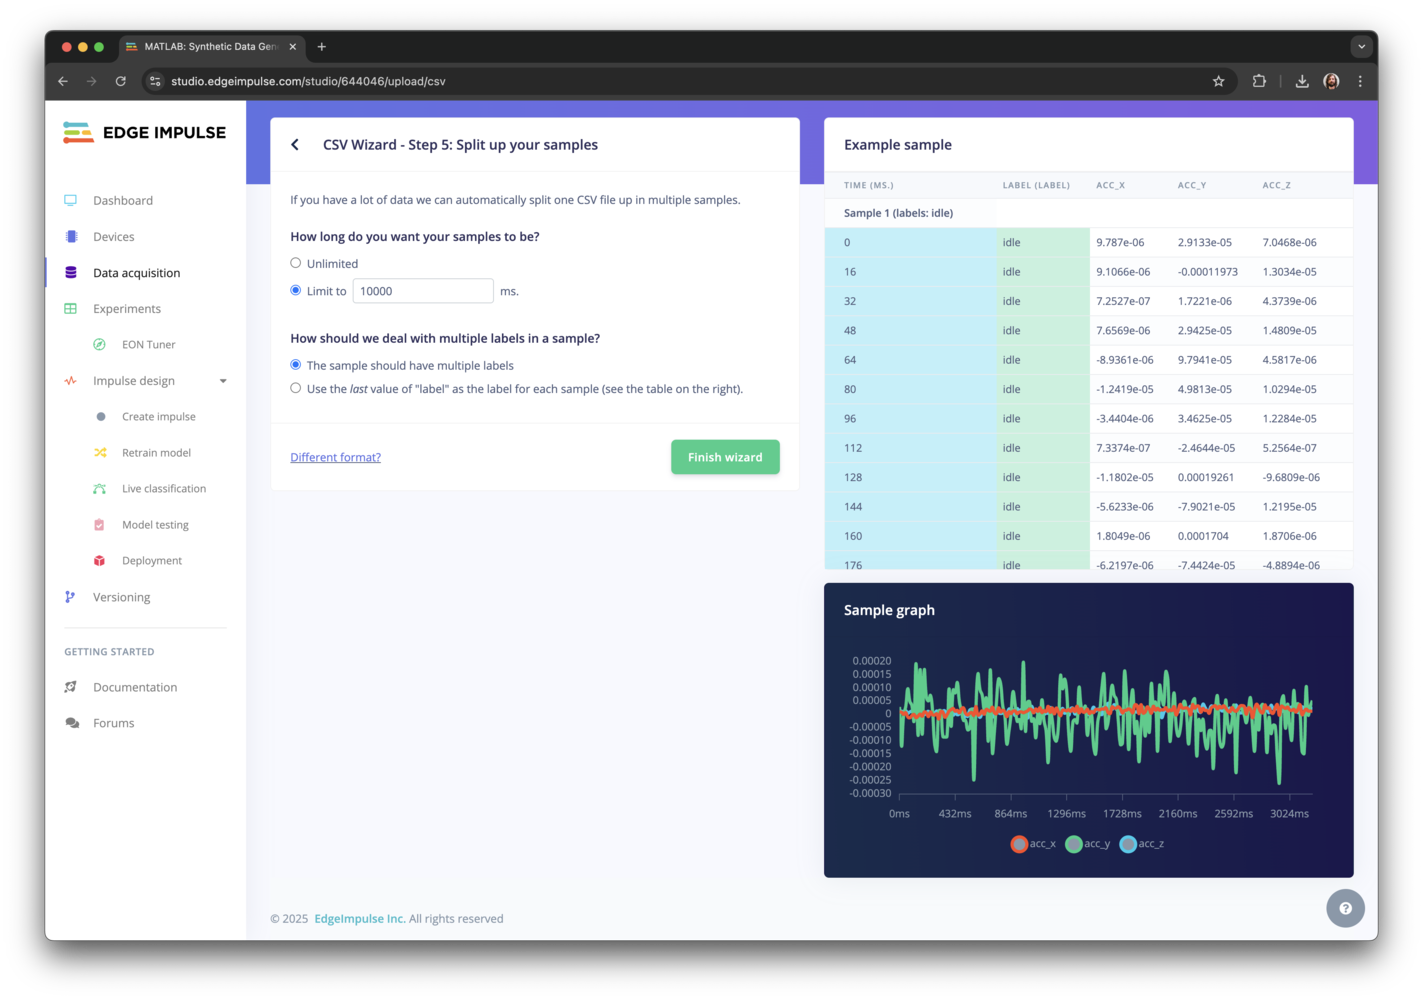 4. Follow the steps to label and import the data.
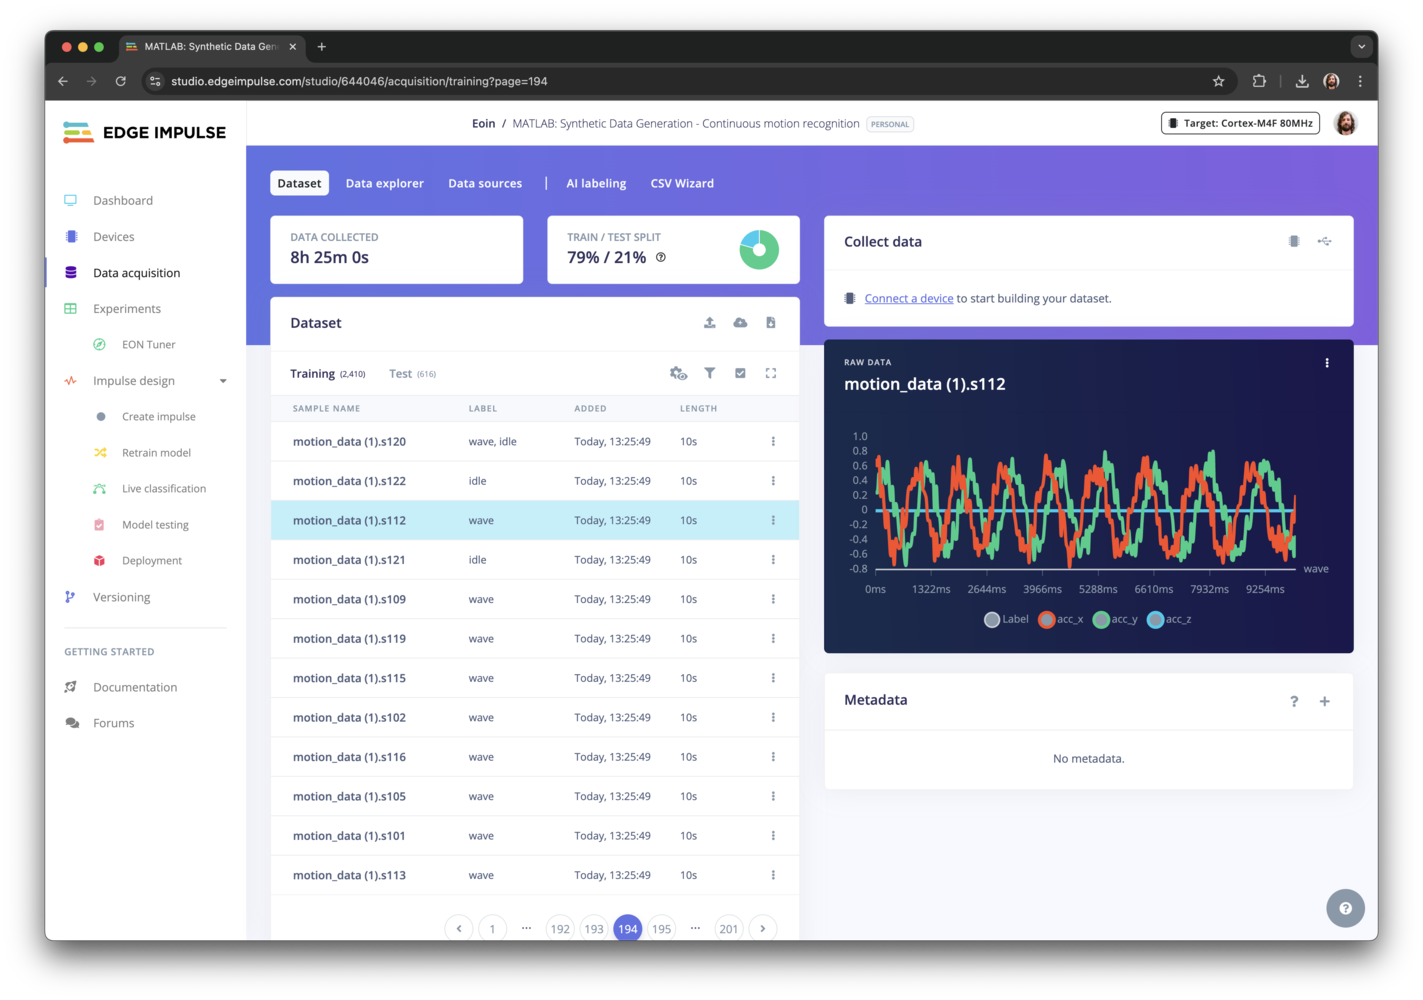 5. Once the data is imported, you can start training your model using the synthetic motion data.
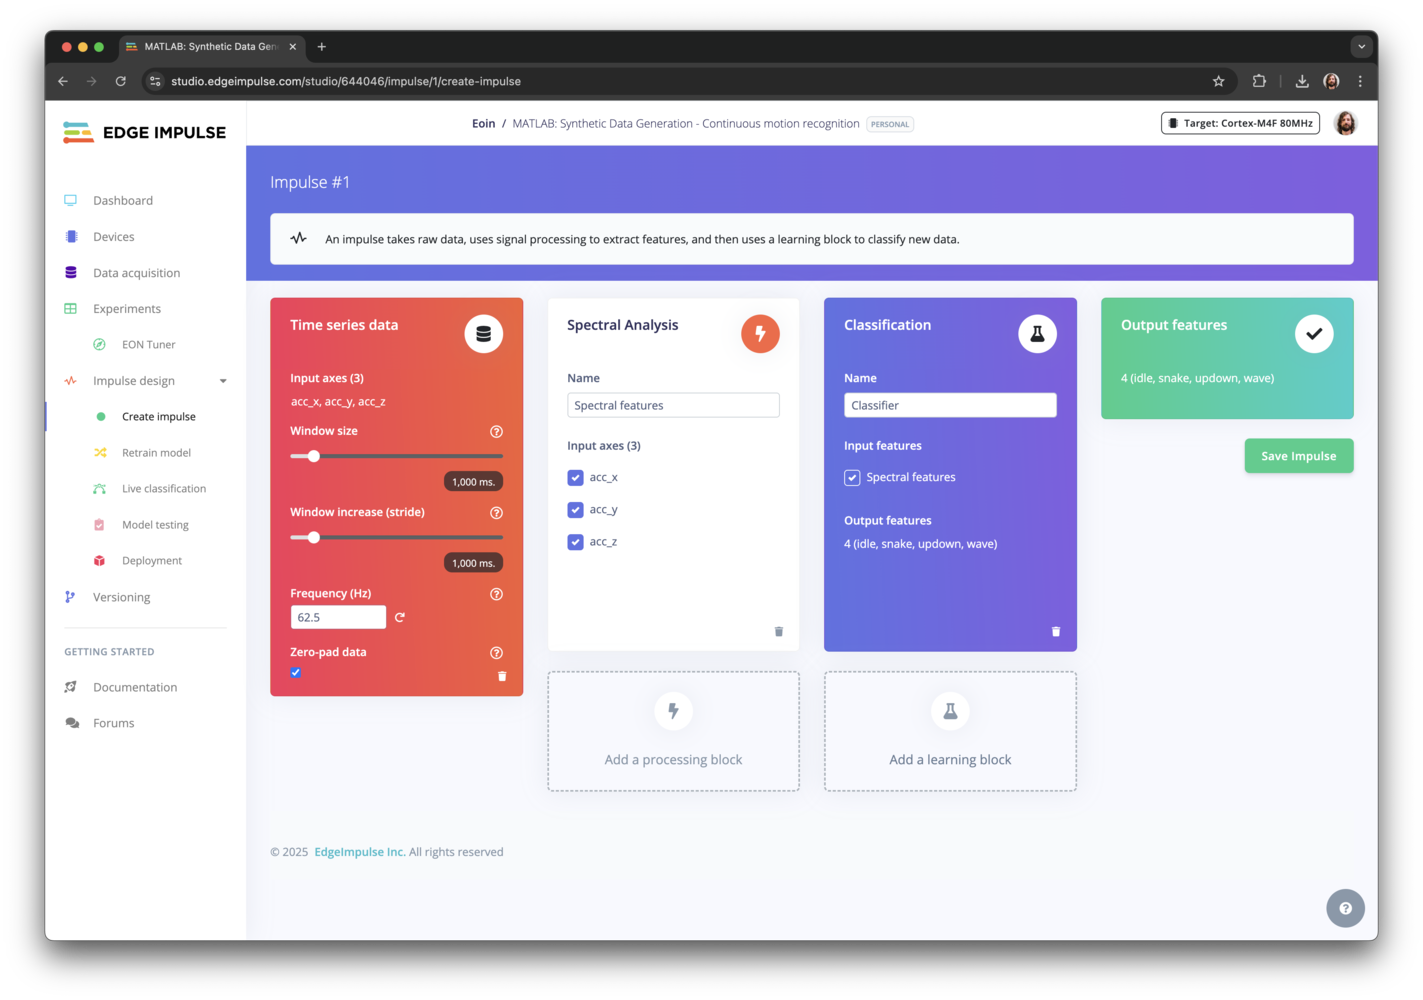 6. Configure the model settings and train the model using the synthetic motion data.
For more advanced motion data generation, consider adding sensor noise, drift, or more complex motion patterns.
## Next steps
For a more advanced example, see the public project:[Rolling Element Bearing Fault Diagnosis](https://studio.edgeimpulse.com/public/618309/live) that uses MATLAB to generate synthetic vibration data for bearing fault detection, based on the [MATLAB](https://matlab.mathworks.com/) Rolling Element Bearing Fault Diagnosis [example](https://matlab.mathworks.com/).
## Conclusion
By leveraging **MATLAB** for **synthetic data generation**, you can rapidly prototype and iterate without the overhead of physical sensors or mechanical rigs. This approach helps fill in dataset gaps, improves model robustness, and speeds up development cycles. Please share your own experience with MATLAB and other uses or projects with us on our [forum](https://forum.edgeimpulse.com/).
## Further reading
* Integrate Custom **MATLAB DSP blocks** in Edge Impulse for advanced preprocessing before training your models. Check out the [MATLAB DSP custom processing block](https://github.com/edgeimpulse/example-custom-processing-block-matlab).
* Bearing wear analysis: [Public Project](https://studio.edgeimpulse.com/public/618309/live)
6. Configure the model settings and train the model using the synthetic motion data.
For more advanced motion data generation, consider adding sensor noise, drift, or more complex motion patterns.
## Next steps
For a more advanced example, see the public project:[Rolling Element Bearing Fault Diagnosis](https://studio.edgeimpulse.com/public/618309/live) that uses MATLAB to generate synthetic vibration data for bearing fault detection, based on the [MATLAB](https://matlab.mathworks.com/) Rolling Element Bearing Fault Diagnosis [example](https://matlab.mathworks.com/).
## Conclusion
By leveraging **MATLAB** for **synthetic data generation**, you can rapidly prototype and iterate without the overhead of physical sensors or mechanical rigs. This approach helps fill in dataset gaps, improves model robustness, and speeds up development cycles. Please share your own experience with MATLAB and other uses or projects with us on our [forum](https://forum.edgeimpulse.com/).
## Further reading
* Integrate Custom **MATLAB DSP blocks** in Edge Impulse for advanced preprocessing before training your models. Check out the [MATLAB DSP custom processing block](https://github.com/edgeimpulse/example-custom-processing-block-matlab).
* Bearing wear analysis: [Public Project](https://studio.edgeimpulse.com/public/618309/live)