> ## Documentation Index
> Fetch the complete documentation index at: https://docs.edgeimpulse.com/llms.txt
> Use this file to discover all available pages before exploring further.
# OBD Automotive data
> Process OBD-II and CAN bus time-series data to classify vehicle faults, and run inference on a Linux SBC.
export const CardOpenStudioTutorial = ({href}) =>
Skip the setup: clone a ready-to-use Edge Impulse project with the dataset, impulse, and trained model.
;
This tutorial shows how to process automotive or industrial time-series data (**OBD-II** / **CAN**) data in your project. We’ll keep things general by working from CSV logs and then replaying them into an exported .eim model on a Linux SBC (e.g., Raspberry Pi).
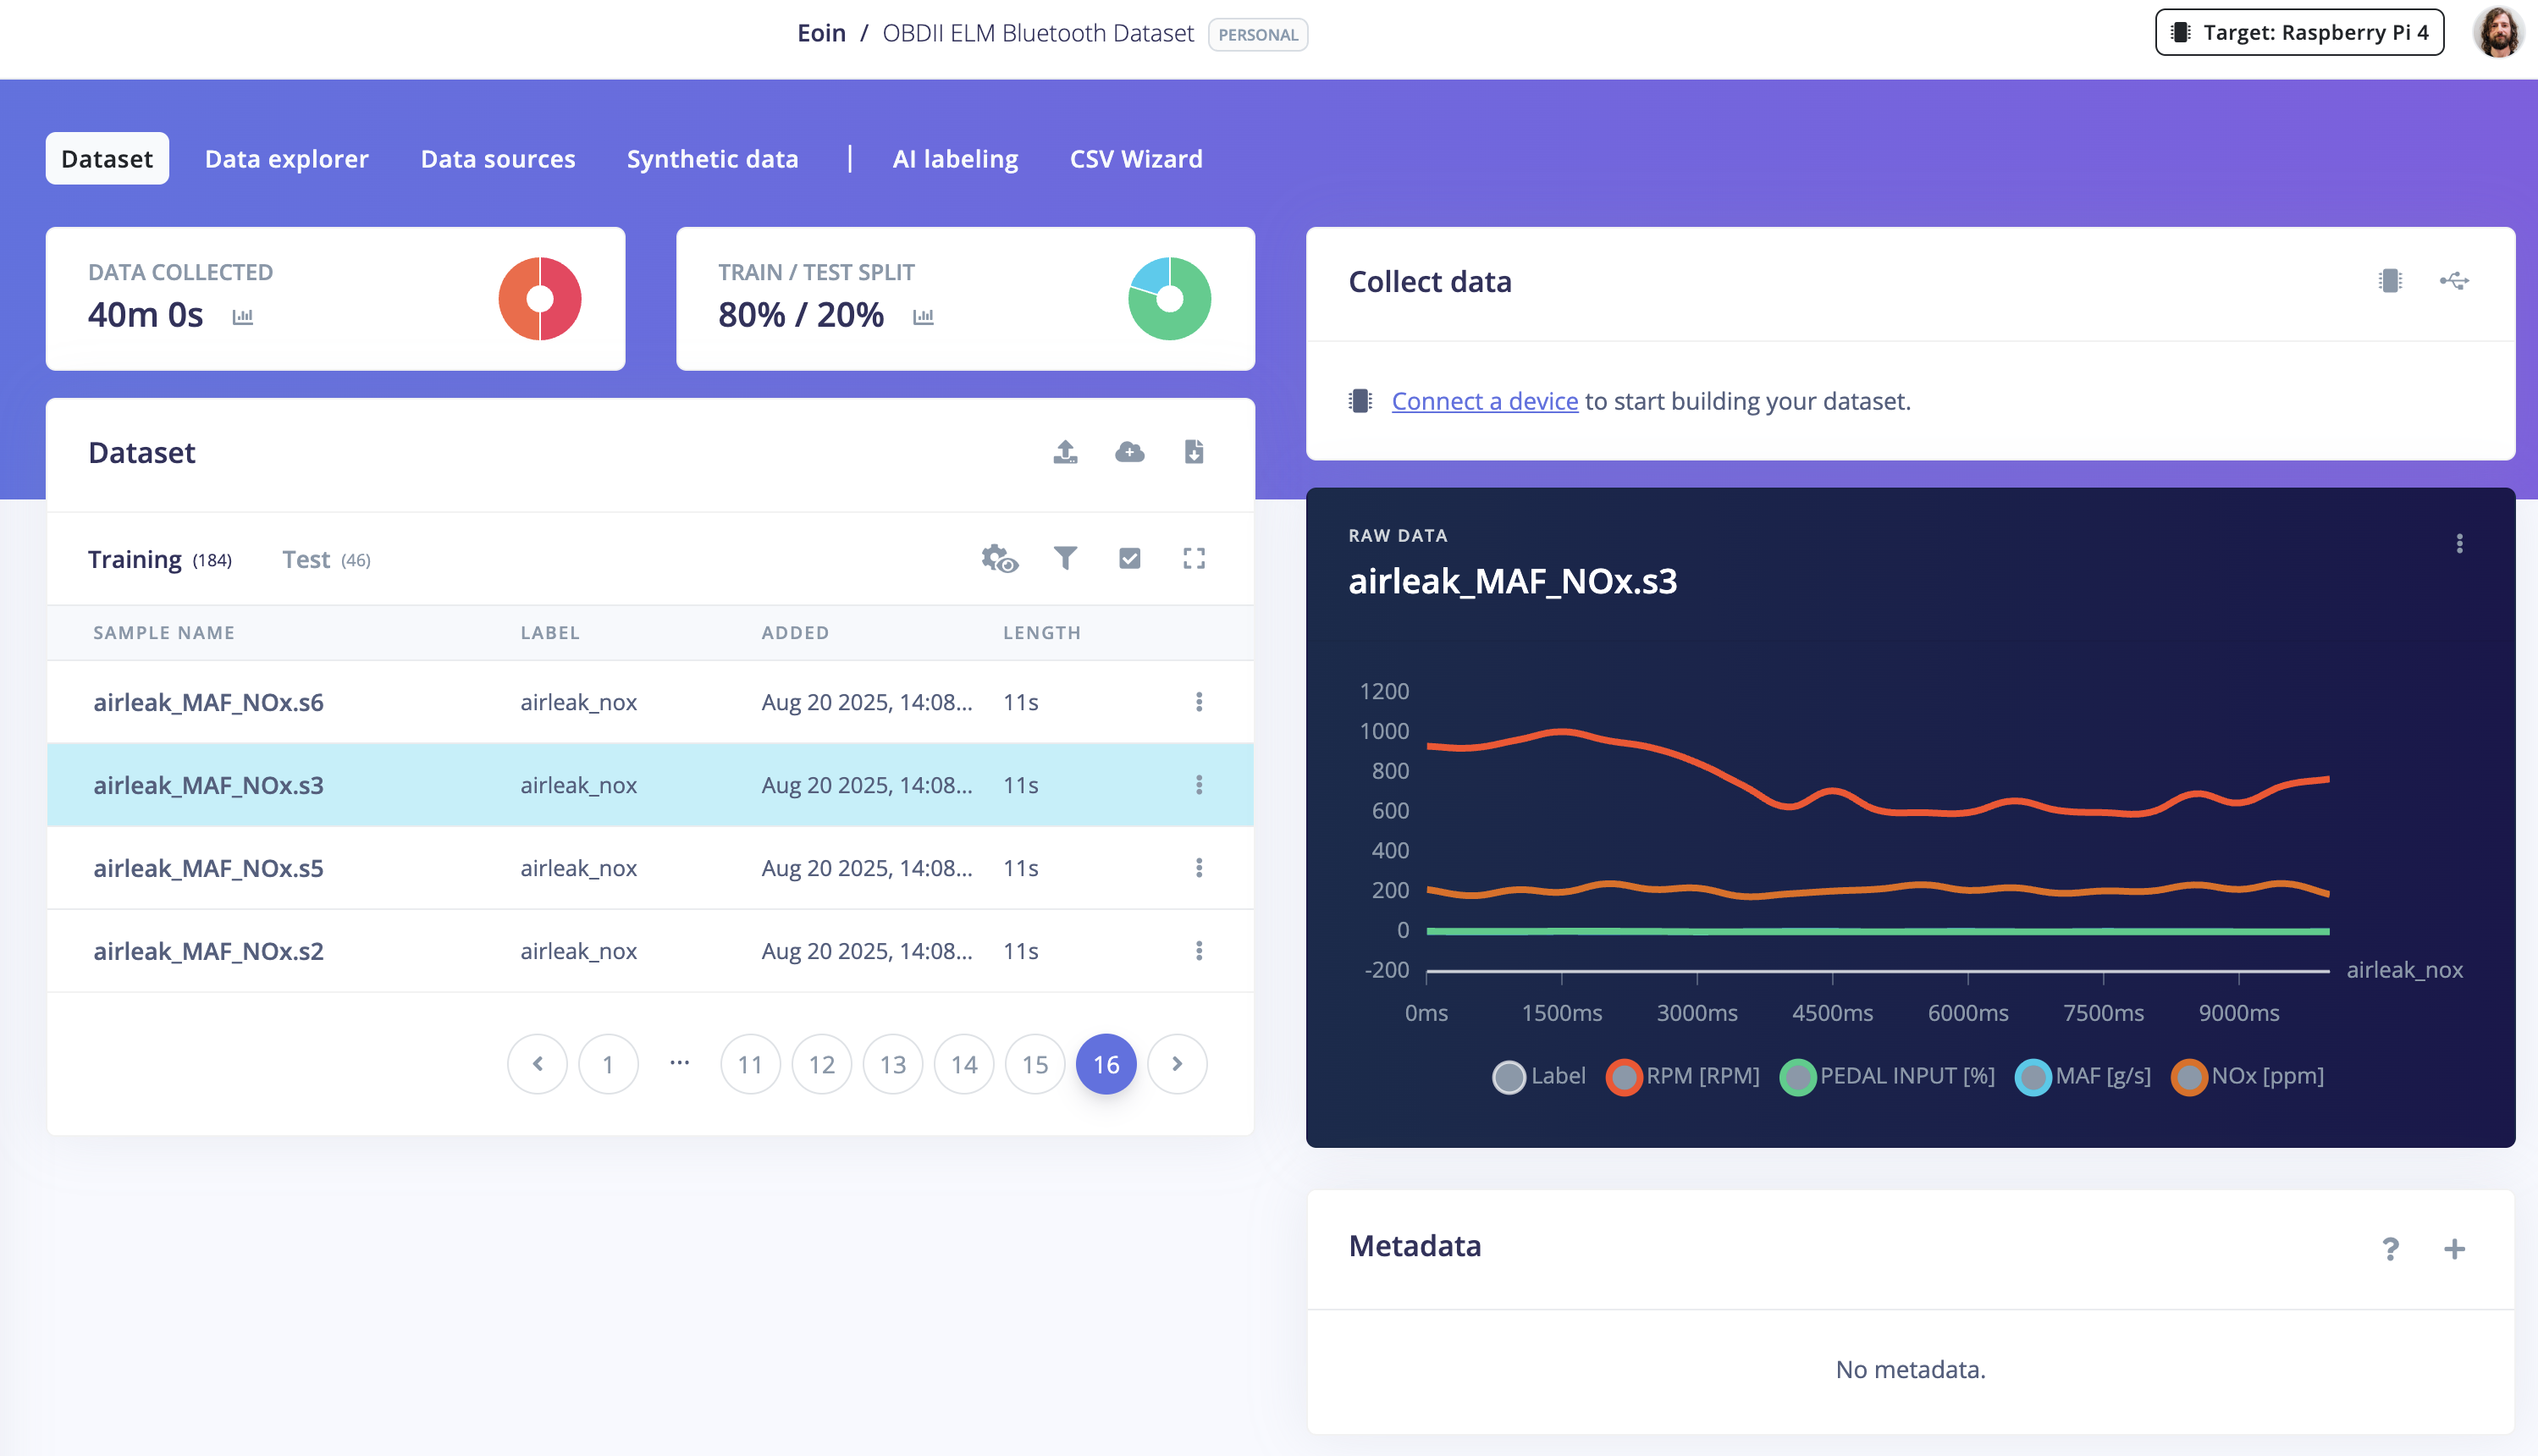
We’ll classify short windows as healthy vs air-leak + NOx fault. If you don’t have live hardware, you can still follow along entirely with CSV files.
We’ll validate a known drivability issue: an intake air leak (lean condition) that can elevate NOx, often associated with P0171/P0174 DTCs. If you don’t have a vehicle or adapter handy, use the public project dataset: [public project](https://studio.edgeimpulse.com/public/767694/live) created for this tutorial.
## Prerequisites
Before you begin, ensure you have the following:
* An Edge Impulse account
* A compatible **OBD-II** adapter (e.g., **ELM327**)
* CSV of **OBD-II** data for healthy and unhealthy vehicle states
> Take the sample CSV to get started or collect a sample from your **OBD-II** interface using your pi and the [telemetry-obd project](https://github.com/thatlarrypearson/telemetry-obd).
## 1. Problem overview
**Goal:** Detect an **intake air leak** from **OBD-II** signals by finding windows where **NOx** is disproportionately high **relative to load** (throttle / airflow / RPM).
### Signals we will use
We’ll use a minimal, interpretable set (more can be added later):
* **MAF \[g/s]** : proxy for air mass entering the engine (load).
* **NOx \[ppm]** : emission outcome; rises with lean burn / mis-mix.
* **PEDAL INPUT \[%]** : driver demand / load request.
* *(Optional)* **RPM**, **MAP \[kPa]**, **Lambda**, **STFT/LTFT** for context.
**Healthy hypothesis:** For a given load (MAF / throttle / RPM), **NOx** stays within a predictable range.\
**Leak hypothesis:** With unmetered air, mixture trends lean > **NOx** is **higher than expected** for the same load.
### Capture options
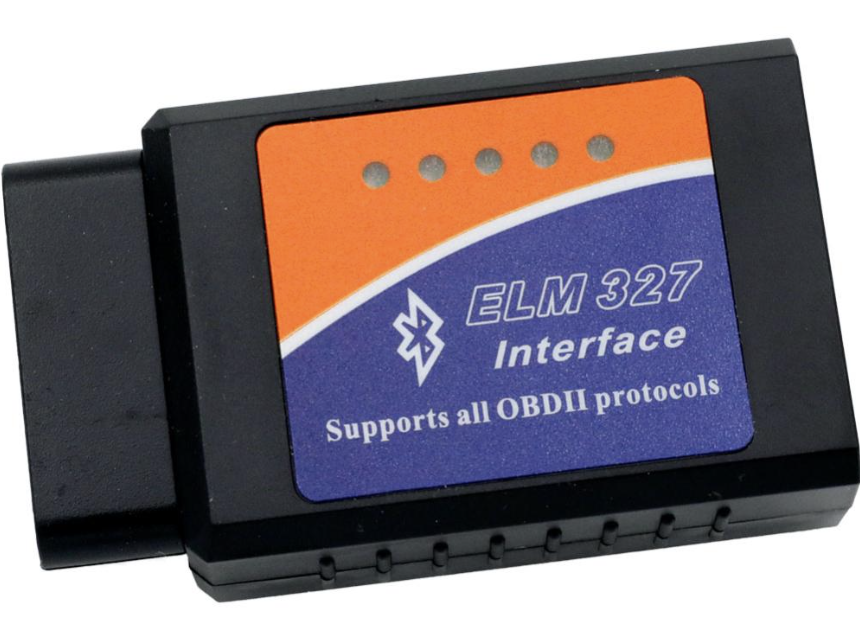
**ELM327(USB/Bluetooth):** simplest path to Mode 01 PIDs (RPM, throttle, MAF, etc.).
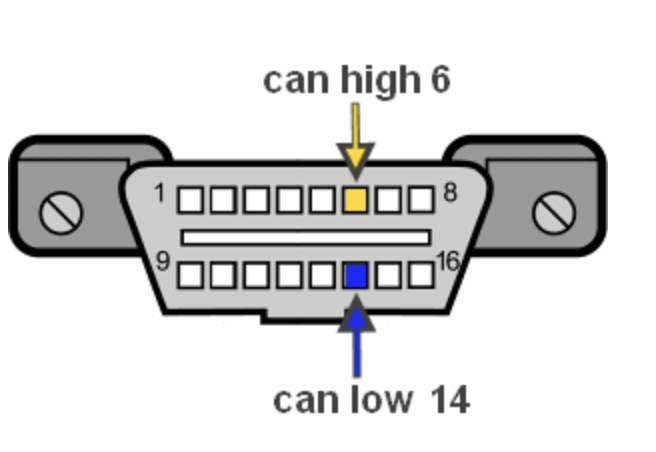
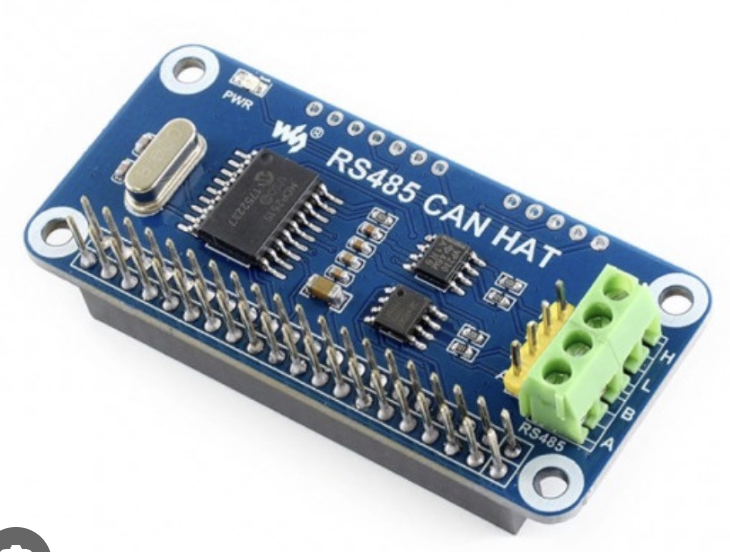
**CAN HAT (direct bus):** robust for field installs/industrial; wire **OBD-II** **PIN 6 (CAN-H), PIN 14 (CAN-L), PIN 4 (GND)**.
**Pi HAT wiring**
> **Safety note:** Induce a small, reversible leak (loosen an intake boot or remove a tiny vacuum cap). **unplug the airflow sensor** (MAF/MAP) : this can trigger limp mode and confound data.
### Data capture (reproducible method)
Capture
* **Sampling:** 2 Hz (every 500 ms).
* **Drive cycle:** idle > gentle accelerations > light cruise > decel.
* **Classes:**
* `healthy`: intact intake, warmed-up closed loop.
* `airleak_nox`: the same drive cycle with a small, controlled leak.
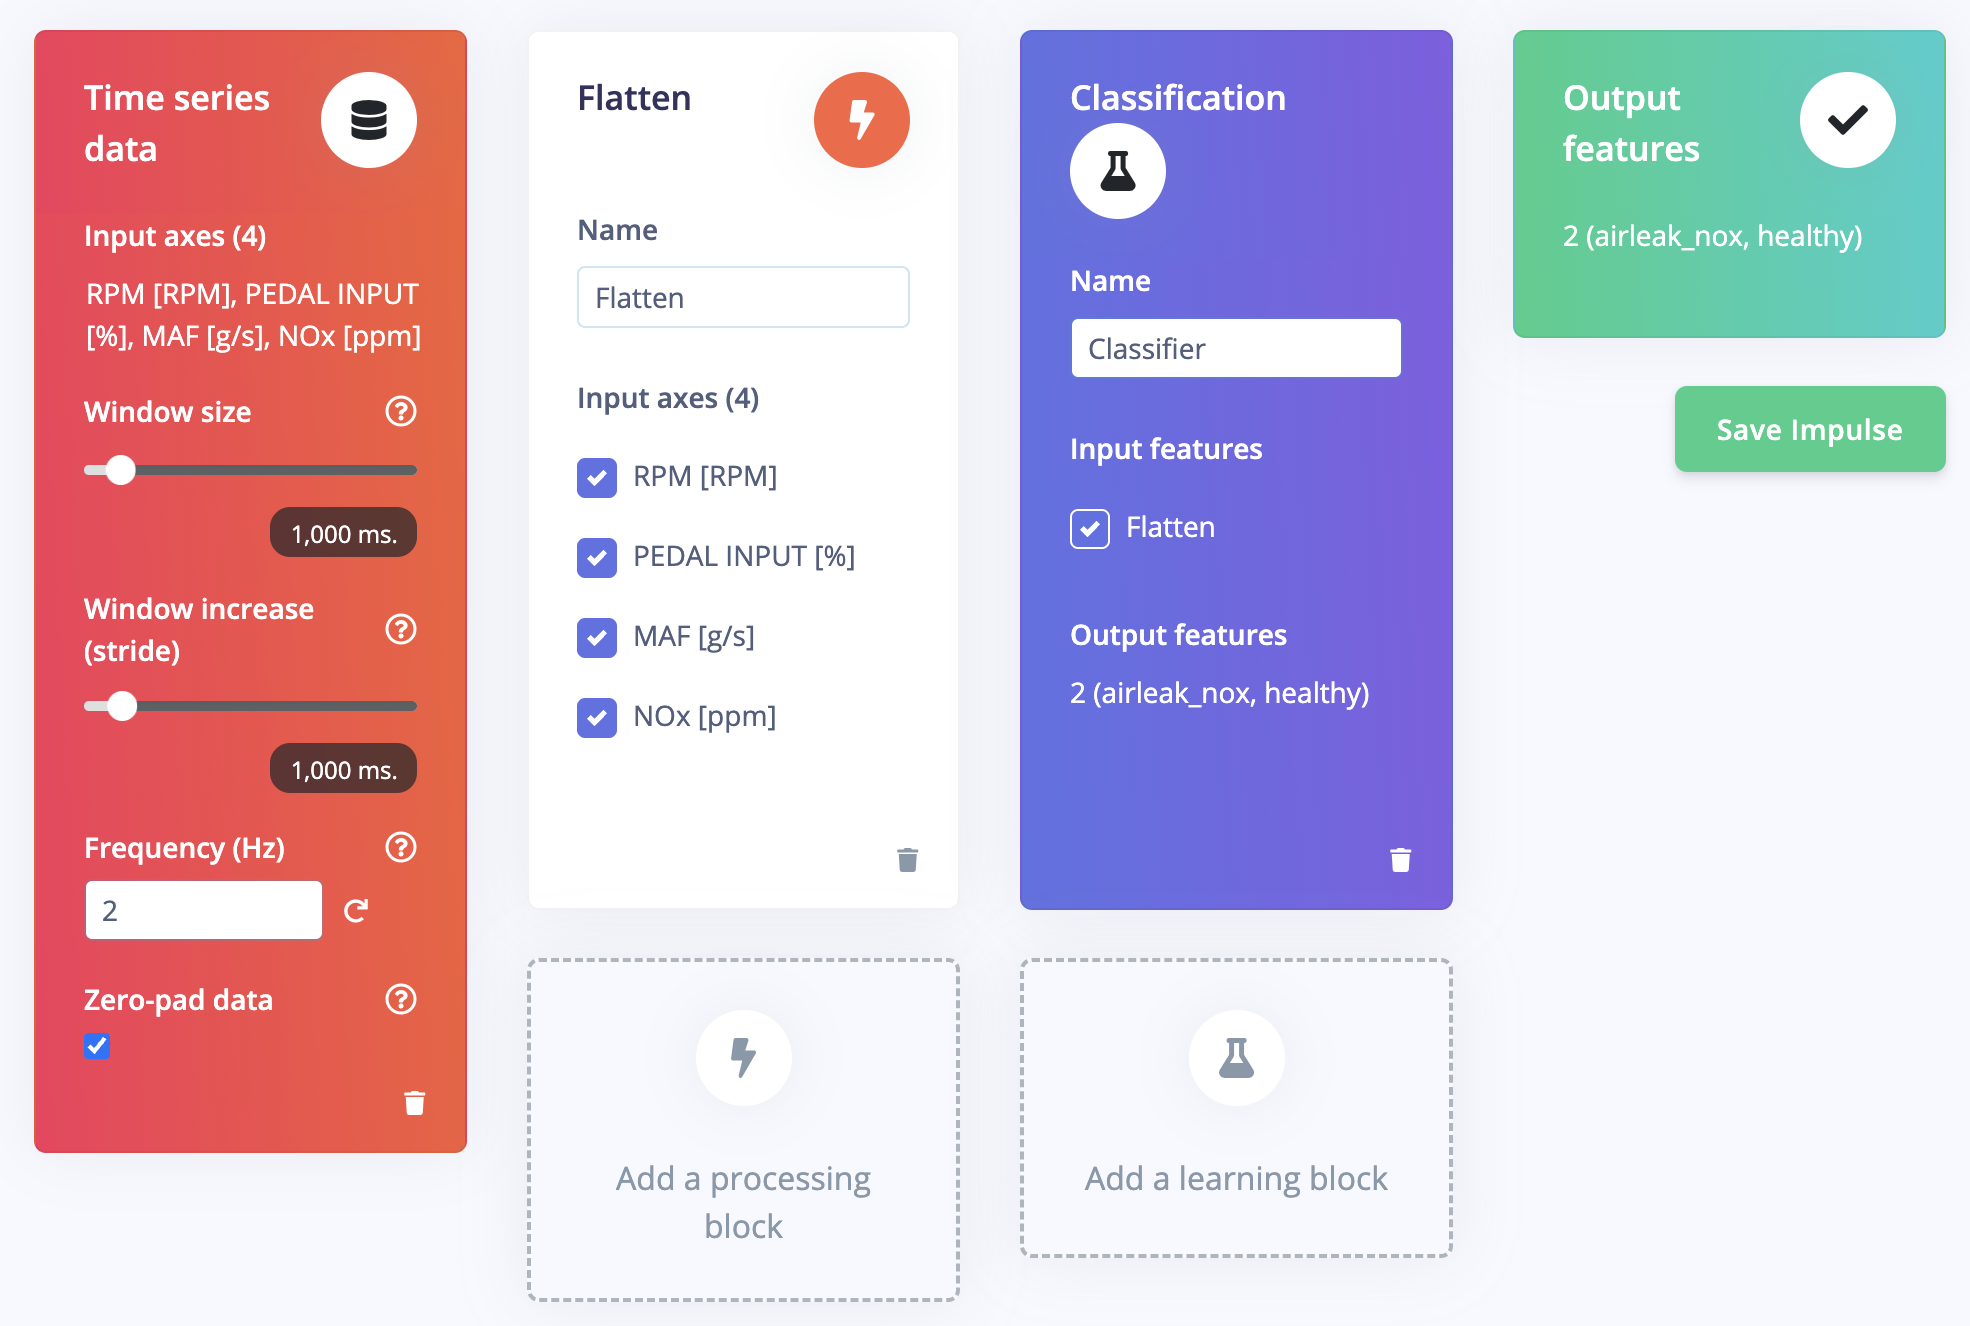
* **Windows:** 2000 ms window, 1000 ms step (overlapping).
* **Duration target:** \~10 min per class (balanced).
### Window examples
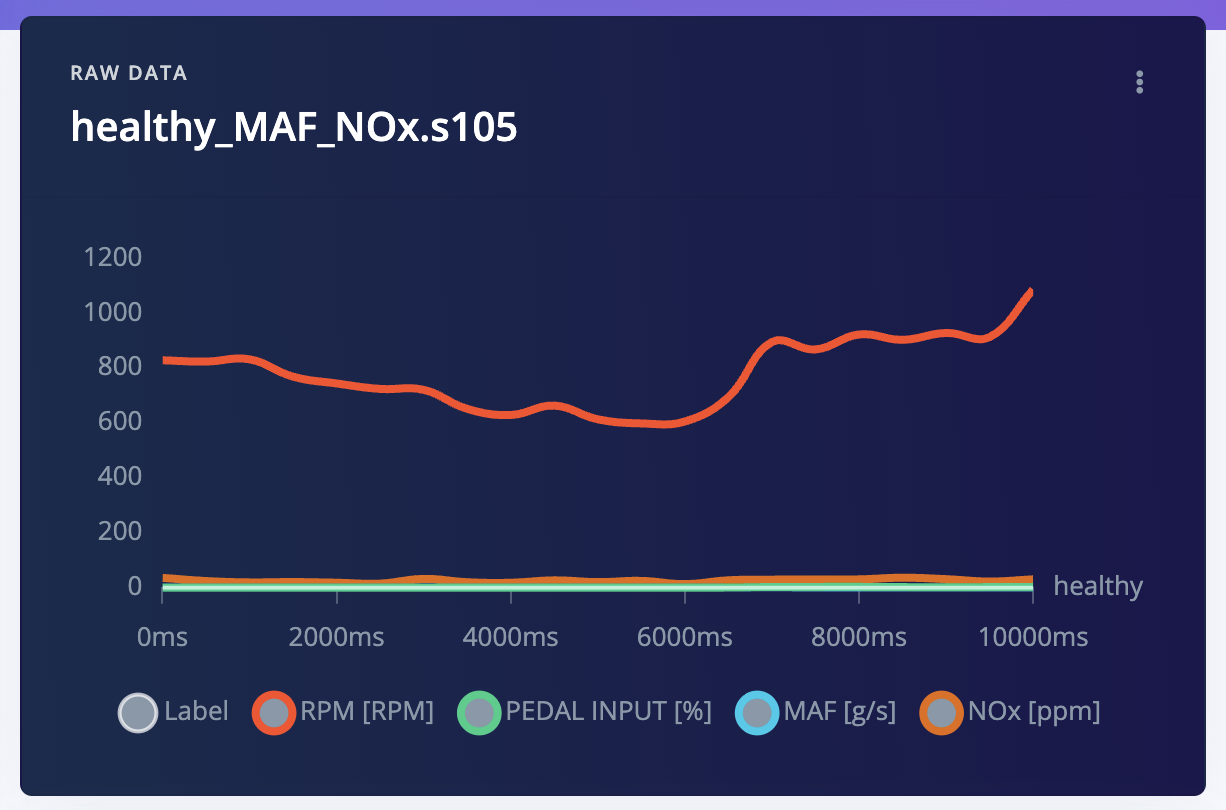
**Healthy window example**
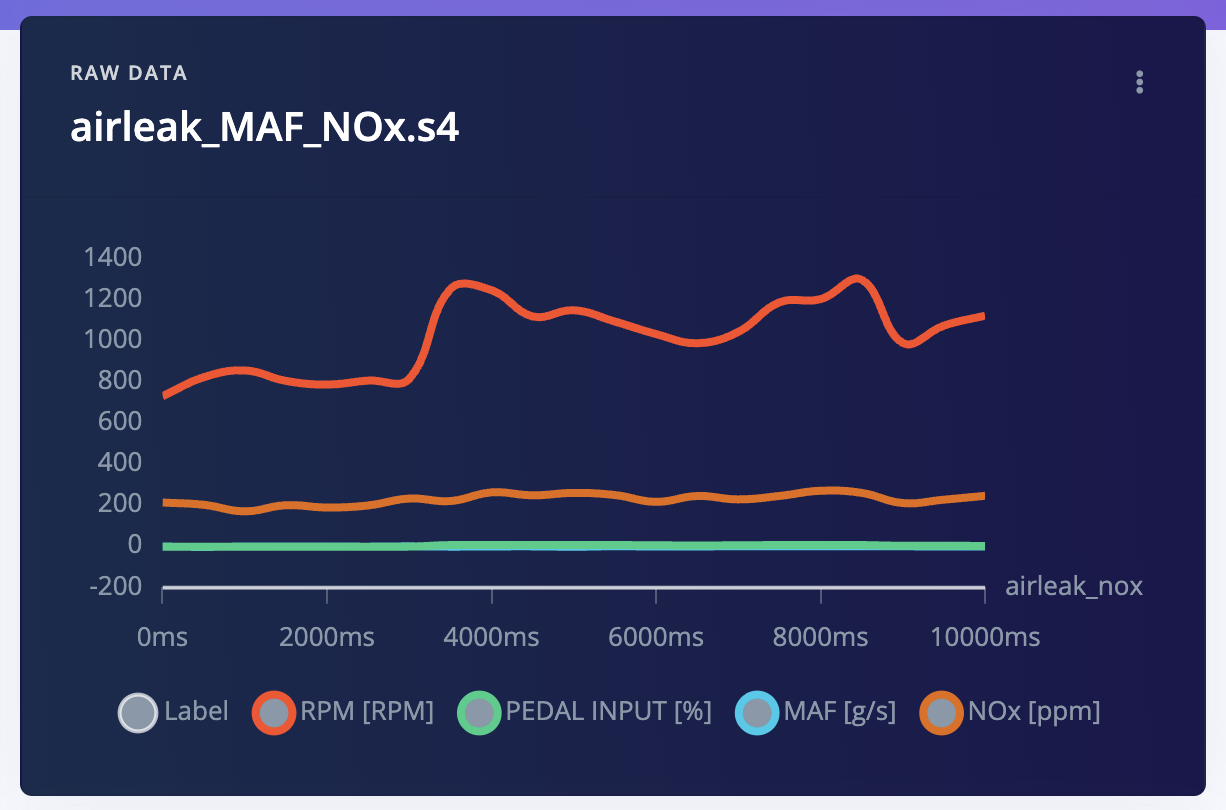
**Leak window example** : **NOx** too high relative to throttle/MAF (typical of a vacuum leak)
### Simple, interpretable features
The ratios below are conceptual aids that explain the physics; you can compute them offline for analysis. In Studio, the **Flatten** block summarizes the raw channels directly. Over each 2 s window:
* `nox_per_maf = NOx / max(MAF, 0.1)`
* `nox_per_throttle = NOx / max(throttle, 1)`
* `maf_per_rpm = MAF / max(RPM, 500)`
* Short-window **mean** and \*\*slope \*\* for NOx and MAF
**Decision intuition:** Windows with **high `nox_per_maf`** and/or **positive NOx slope** at modest load are more likely **air-leak**.
With the signals defined, wiring settled, and an explicit labeling protocol, we can now build the model.
## 2. Prepare the CSV
The **CSV Wizard** expects:
* A time column named **`time (ms.)`** (milliseconds since the first sample)
* One **label column** (here **`fault_label`**)
* One numeric column per OBD signal
> Take the sample CSV to get started or collect a sample from your **OBD-II** interface using your pi and the [telemetry-obd project](https://github.com/thatlarrypearson/telemetry-obd).
The CSVs for the sample project have the following headings:
```
time (ms.),fault_label,RPM [RPM],PEDAL INPUT [%],MAF [g/s],NOx [ppm]
```
## 3. Import with the CSV Wizard
1. Open your project → **Data acquisition** → **CSV Wizard**
2. Upload `n53_healthy_ei.csv` and `n53_faulty_ei.csv` (or your own files)
3. Set **Label column** = `fault_label` and **Time column** = `time (ms.)`
4. Confirm sampling rate ≈ **2 Hz** (every 500 ms)
5. Finish import : the wizard converts each file into time-aligned samples
## 4. Windowing (time-series slicing)
Use windows long enough for trims/lambda to show trends:
* **Window size:** `2000 ms`
* **Window increase:** `1000 ms`
This creates overlapping 2-second windows sliding every 1 s, matching the capture settings above.
## 5. Create the impulse
1. Go to **Create impulse**
2. **Input:** your time-series window
3. **Processing block:** **Flatten** *(start simple)*
* *(Optional)* add **Spectral features** for fast-changing channels (e.g., `MAF [g/s]`, `NOx [ppm]`)
* *(Optional)* enable **Normalization** if feature scales differ by ≥10×
4. **Learning block:** **Classification (Keras)**
**Flatten settings:** defaults are fine.
> Start with **Flatten** only. If accuracy plateaus, add **Spectral features** as a second block.
## 6. Generate features
Open **Generate features** and run on all samples.\
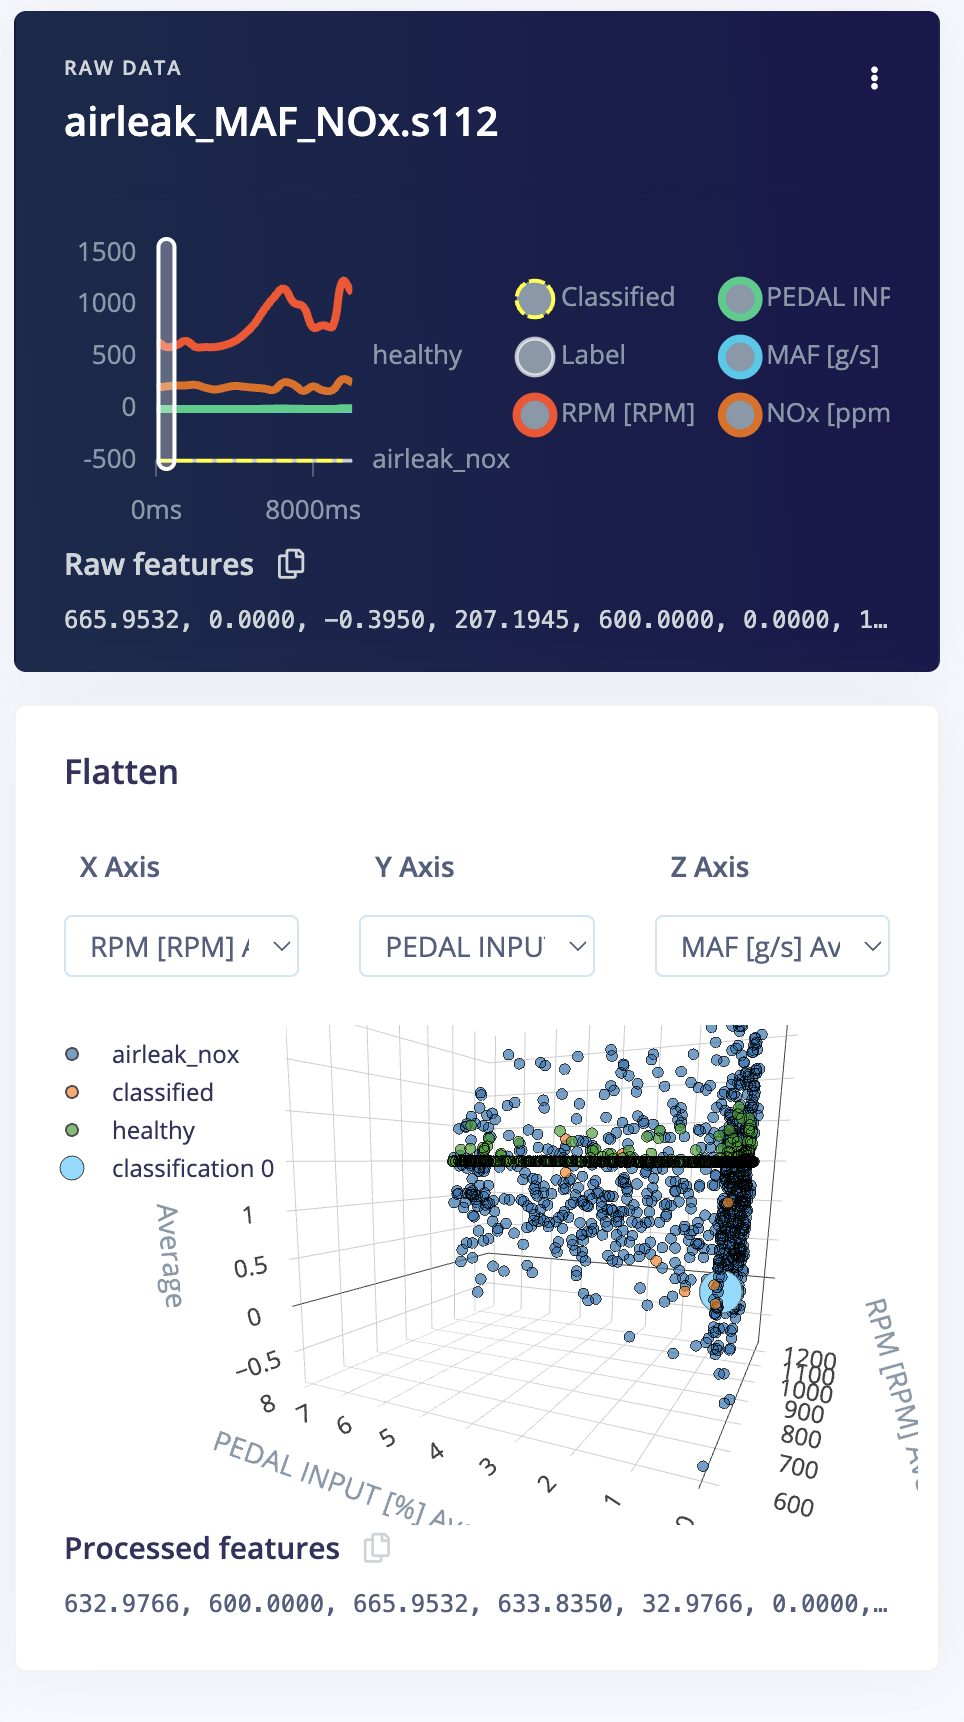
Use **Feature explorer** to verify clusters separate (healthy vs. fault).
## 7. Train the classifier
In **Classification (Keras)**:
**Network (starter):**
* Dense **128** (ReLU) → Dropout **0.20**
* Dense **64** (ReLU)
* Dense **N\_classes** (Softmax)
**Training:**
* Split: **70/30** train/validation
* Epochs: **50–100**
* Batch size: **32**
* Enable **Class weighting** if classes are imbalanced
Click **Start training** and review metrics.\
**Target:** ≥ **95%** precision/recall per class on the validation set.
## 8. Evaluate the model
* **Confusion matrix:** identify misclassifications (e.g., healthy ↔ fault)
* **Feature explorer:** confirm separation (trims/lambda/MAF/MAP)
* If one sensor dominates (e.g., only NOx), add more context:
* **STFT/LTFT** (fuel trims)
* **Lambda** (bank1/2)
* **Ratios** (e.g., `maf_per_rpm`, `map_per_throttle`)
## 9. Deploy
Open **Deploy** and choose your target:
* **Linux/Aarch64** (Raspberry Pi4)
### Scripts
We have created a short script that will play back a recording of the CSV file and simulate real-time classification of the **OBD-II** signals. This allows us to test the model's performance in a controlled environment before deploying it to a live vehicle, scripts and instructions are available from the public repository. [obd automotive data](https://github.com/edgeimpulse/obd-automotive-data)
Run the collection script to log data from your **ELM327**:
```
python3 collect_obd_data.py \
--model ./obd_fault.eim \
--csv ./airleak_MAF_NOx.csv \
--axes "RPM [RPM],PEDAL INPUT [%],MAF [g/s],NOx [ppm]" \
--hz 2 --window-ms 2000 --step-ms 1000 --label-col fault_label
```
Play back the CSV file:
```
python3 play_csv_to_eim.py \
--model ./obd_fault.eim \
--csv ./airleak_MAF_NOx.csv \
--axes "RPM [RPM],PEDAL INPUT [%],MAF [g/s],NOx [ppm]" \
--hz 2 --window-ms 2000 --step-ms 1000 --label-col fault_label
```
For live capture on Pi, a wired **CAN HAT** is typically more reliable than Bluetooth ELM clones. **USB ELM327** also works well.
## Conclusion
In this tutorial, we explored how to collect **OBD-II** data from vehicles using both Bluetooth adapters and direct CAN bus connections, then trained and deployed a classifier that flags an intake air leak from the relationship between NOx and engine load. This workflow generalizes to other vehicle faults (misfire, EGR, sensor bias) and industrial CAN signals.
## Related work
If you use this tutorial or build on the approach described here, please cite the following paper:
E. Jordan, M. Serrano, A. Gyrard, E. Song, T. Roth and D. Wollman, "Semantics for Enhancing Communications- and Edge-Intelligence-enabled Smart Sensors: A Practical Use Case in Federated Automotive Diagnostics," *IECON 2024 - 50th Annual Conference of the IEEE Industrial Electronics Society*, Chicago, IL, USA, 2024, pp. 1-6, doi: [10.1109/IECON55916.2024.10905565](https://ieeexplore.ieee.org/document/10905565).
This tutorial draws on the federated automotive diagnostics use case explored in the paper above, which applies semantic technologies and ontology engineering to edge-intelligence-enabled smart sensors. For further reading, see the full paper on [IEEE Xplore](https://ieeexplore.ieee.org/document/10905565).
**BibTeX**
```bibtex theme={"system"}
@inproceedings{jordan2024semantics,
author = {Jordan, E. and Serrano, M. and Gyrard, A. and Song, E. and Roth, T. and Wollman, D.},
title = {Semantics for Enhancing Communications- and Edge-Intelligence-enabled Smart Sensors: A Practical Use Case in Federated Automotive Diagnostics},
booktitle = {IECON 2024 - 50th Annual Conference of the IEEE Industrial Electronics Society},
address = {Chicago, IL, USA},
year = {2024},
pages = {1--6},
doi = {10.1109/IECON55916.2024.10905565}
}
```
 We’ll classify short windows as healthy vs air-leak + NOx fault. If you don’t have live hardware, you can still follow along entirely with CSV files.
 We’ll validate a known drivability issue: an intake air leak (lean condition) that can elevate NOx, often associated with P0171/P0174 DTCs. If you don’t have a vehicle or adapter handy, use the public project dataset: [public project](https://studio.edgeimpulse.com/public/767694/live) created for this tutorial.
## Prerequisites
Before you begin, ensure you have the following:
* An Edge Impulse account
* A compatible **OBD-II** adapter (e.g., **ELM327**)
* CSV of **OBD-II** data for healthy and unhealthy vehicle states
> Take the sample CSV to get started or collect a sample from your **OBD-II** interface using your pi and the [telemetry-obd project](https://github.com/thatlarrypearson/telemetry-obd).
## 1. Problem overview
**Goal:** Detect an **intake air leak** from **OBD-II** signals by finding windows where **NOx** is disproportionately high **relative to load** (throttle / airflow / RPM).
### Signals we will use
We’ll use a minimal, interpretable set (more can be added later):
* **MAF \[g/s]** : proxy for air mass entering the engine (load).
* **NOx \[ppm]** : emission outcome; rises with lean burn / mis-mix.
* **PEDAL INPUT \[%]** : driver demand / load request.
* *(Optional)* **RPM**, **MAP \[kPa]**, **Lambda**, **STFT/LTFT** for context.
**Healthy hypothesis:** For a given load (MAF / throttle / RPM), **NOx** stays within a predictable range.\
**Leak hypothesis:** With unmetered air, mixture trends lean > **NOx** is **higher than expected** for the same load.
### Capture options
We’ll validate a known drivability issue: an intake air leak (lean condition) that can elevate NOx, often associated with P0171/P0174 DTCs. If you don’t have a vehicle or adapter handy, use the public project dataset: [public project](https://studio.edgeimpulse.com/public/767694/live) created for this tutorial.
## Prerequisites
Before you begin, ensure you have the following:
* An Edge Impulse account
* A compatible **OBD-II** adapter (e.g., **ELM327**)
* CSV of **OBD-II** data for healthy and unhealthy vehicle states
> Take the sample CSV to get started or collect a sample from your **OBD-II** interface using your pi and the [telemetry-obd project](https://github.com/thatlarrypearson/telemetry-obd).
## 1. Problem overview
**Goal:** Detect an **intake air leak** from **OBD-II** signals by finding windows where **NOx** is disproportionately high **relative to load** (throttle / airflow / RPM).
### Signals we will use
We’ll use a minimal, interpretable set (more can be added later):
* **MAF \[g/s]** : proxy for air mass entering the engine (load).
* **NOx \[ppm]** : emission outcome; rises with lean burn / mis-mix.
* **PEDAL INPUT \[%]** : driver demand / load request.
* *(Optional)* **RPM**, **MAP \[kPa]**, **Lambda**, **STFT/LTFT** for context.
**Healthy hypothesis:** For a given load (MAF / throttle / RPM), **NOx** stays within a predictable range.\
**Leak hypothesis:** With unmetered air, mixture trends lean > **NOx** is **higher than expected** for the same load.
### Capture options
 **ELM327(USB/Bluetooth):** simplest path to Mode 01 PIDs (RPM, throttle, MAF, etc.).
**CAN HAT (direct bus):** robust for field installs/industrial; wire **OBD-II** **PIN 6 (CAN-H), PIN 14 (CAN-L), PIN 4 (GND)**.
**ELM327(USB/Bluetooth):** simplest path to Mode 01 PIDs (RPM, throttle, MAF, etc.).
**CAN HAT (direct bus):** robust for field installs/industrial; wire **OBD-II** **PIN 6 (CAN-H), PIN 14 (CAN-L), PIN 4 (GND)**.
 **Pi HAT wiring**
 > **Safety note:** Induce a small, reversible leak (loosen an intake boot or remove a tiny vacuum cap). **unplug the airflow sensor** (MAF/MAP) : this can trigger limp mode and confound data.
### Data capture (reproducible method)
Capture
* **Sampling:** 2 Hz (every 500 ms).
* **Drive cycle:** idle > gentle accelerations > light cruise > decel.
* **Classes:**
* `healthy`: intact intake, warmed-up closed loop.
* `airleak_nox`: the same drive cycle with a small, controlled leak.
* **Windows:** 2000 ms window, 1000 ms step (overlapping).
* **Duration target:** \~10 min per class (balanced).
### Window examples
**Healthy window example**
> **Safety note:** Induce a small, reversible leak (loosen an intake boot or remove a tiny vacuum cap). **unplug the airflow sensor** (MAF/MAP) : this can trigger limp mode and confound data.
### Data capture (reproducible method)
Capture
* **Sampling:** 2 Hz (every 500 ms).
* **Drive cycle:** idle > gentle accelerations > light cruise > decel.
* **Classes:**
* `healthy`: intact intake, warmed-up closed loop.
* `airleak_nox`: the same drive cycle with a small, controlled leak.
* **Windows:** 2000 ms window, 1000 ms step (overlapping).
* **Duration target:** \~10 min per class (balanced).
### Window examples
**Healthy window example**
 **Leak window example** : **NOx** too high relative to throttle/MAF (typical of a vacuum leak)
 ### Simple, interpretable features
The ratios below are conceptual aids that explain the physics; you can compute them offline for analysis. In Studio, the **Flatten** block summarizes the raw channels directly. Over each 2 s window:
* `nox_per_maf = NOx / max(MAF, 0.1)`
* `nox_per_throttle = NOx / max(throttle, 1)`
* `maf_per_rpm = MAF / max(RPM, 500)`
* Short-window **mean** and \*\*slope \*\* for NOx and MAF
**Decision intuition:** Windows with **high `nox_per_maf`** and/or **positive NOx slope** at modest load are more likely **air-leak**.
With the signals defined, wiring settled, and an explicit labeling protocol, we can now build the model.
## 2. Prepare the CSV
The **CSV Wizard** expects:
* A time column named **`time (ms.)`** (milliseconds since the first sample)
* One **label column** (here **`fault_label`**)
* One numeric column per OBD signal
> Take the sample CSV to get started or collect a sample from your **OBD-II** interface using your pi and the [telemetry-obd project](https://github.com/thatlarrypearson/telemetry-obd).
The CSVs for the sample project have the following headings:
```
time (ms.),fault_label,RPM [RPM],PEDAL INPUT [%],MAF [g/s],NOx [ppm]
```
## 3. Import with the CSV Wizard
1. Open your project → **Data acquisition** → **CSV Wizard**
2. Upload `n53_healthy_ei.csv` and `n53_faulty_ei.csv` (or your own files)
3. Set **Label column** = `fault_label` and **Time column** = `time (ms.)`
4. Confirm sampling rate ≈ **2 Hz** (every 500 ms)
5. Finish import : the wizard converts each file into time-aligned samples
## 4. Windowing (time-series slicing)
Use windows long enough for trims/lambda to show trends:
* **Window size:** `2000 ms`
* **Window increase:** `1000 ms`
This creates overlapping 2-second windows sliding every 1 s, matching the capture settings above.
## 5. Create the impulse
1. Go to **Create impulse**
2. **Input:** your time-series window
3. **Processing block:** **Flatten** *(start simple)*
* *(Optional)* add **Spectral features** for fast-changing channels (e.g., `MAF [g/s]`, `NOx [ppm]`)
* *(Optional)* enable **Normalization** if feature scales differ by ≥10×
4. **Learning block:** **Classification (Keras)**
**Flatten settings:** defaults are fine.
> Start with **Flatten** only. If accuracy plateaus, add **Spectral features** as a second block.
## 6. Generate features
Open **Generate features** and run on all samples.\
Use **Feature explorer** to verify clusters separate (healthy vs. fault).
## 7. Train the classifier
In **Classification (Keras)**:
### Simple, interpretable features
The ratios below are conceptual aids that explain the physics; you can compute them offline for analysis. In Studio, the **Flatten** block summarizes the raw channels directly. Over each 2 s window:
* `nox_per_maf = NOx / max(MAF, 0.1)`
* `nox_per_throttle = NOx / max(throttle, 1)`
* `maf_per_rpm = MAF / max(RPM, 500)`
* Short-window **mean** and \*\*slope \*\* for NOx and MAF
**Decision intuition:** Windows with **high `nox_per_maf`** and/or **positive NOx slope** at modest load are more likely **air-leak**.
With the signals defined, wiring settled, and an explicit labeling protocol, we can now build the model.
## 2. Prepare the CSV
The **CSV Wizard** expects:
* A time column named **`time (ms.)`** (milliseconds since the first sample)
* One **label column** (here **`fault_label`**)
* One numeric column per OBD signal
> Take the sample CSV to get started or collect a sample from your **OBD-II** interface using your pi and the [telemetry-obd project](https://github.com/thatlarrypearson/telemetry-obd).
The CSVs for the sample project have the following headings:
```
time (ms.),fault_label,RPM [RPM],PEDAL INPUT [%],MAF [g/s],NOx [ppm]
```
## 3. Import with the CSV Wizard
1. Open your project → **Data acquisition** → **CSV Wizard**
2. Upload `n53_healthy_ei.csv` and `n53_faulty_ei.csv` (or your own files)
3. Set **Label column** = `fault_label` and **Time column** = `time (ms.)`
4. Confirm sampling rate ≈ **2 Hz** (every 500 ms)
5. Finish import : the wizard converts each file into time-aligned samples
## 4. Windowing (time-series slicing)
Use windows long enough for trims/lambda to show trends:
* **Window size:** `2000 ms`
* **Window increase:** `1000 ms`
This creates overlapping 2-second windows sliding every 1 s, matching the capture settings above.
## 5. Create the impulse
1. Go to **Create impulse**
2. **Input:** your time-series window
3. **Processing block:** **Flatten** *(start simple)*
* *(Optional)* add **Spectral features** for fast-changing channels (e.g., `MAF [g/s]`, `NOx [ppm]`)
* *(Optional)* enable **Normalization** if feature scales differ by ≥10×
4. **Learning block:** **Classification (Keras)**
**Flatten settings:** defaults are fine.
> Start with **Flatten** only. If accuracy plateaus, add **Spectral features** as a second block.
## 6. Generate features
Open **Generate features** and run on all samples.\
Use **Feature explorer** to verify clusters separate (healthy vs. fault).
## 7. Train the classifier
In **Classification (Keras)**:
 **Network (starter):**
* Dense **128** (ReLU) → Dropout **0.20**
* Dense **64** (ReLU)
* Dense **N\_classes** (Softmax)
**Training:**
* Split: **70/30** train/validation
* Epochs: **50–100**
* Batch size: **32**
* Enable **Class weighting** if classes are imbalanced
Click **Start training** and review metrics.\
**Target:** ≥ **95%** precision/recall per class on the validation set.
## 8. Evaluate the model
* **Confusion matrix:** identify misclassifications (e.g., healthy ↔ fault)
* **Feature explorer:** confirm separation (trims/lambda/MAF/MAP)
* If one sensor dominates (e.g., only NOx), add more context:
* **STFT/LTFT** (fuel trims)
* **Lambda** (bank1/2)
* **Ratios** (e.g., `maf_per_rpm`, `map_per_throttle`)
## 9. Deploy
Open **Deploy** and choose your target:
* **Linux/Aarch64** (Raspberry Pi4)
### Scripts
We have created a short script that will play back a recording of the CSV file and simulate real-time classification of the **OBD-II** signals. This allows us to test the model's performance in a controlled environment before deploying it to a live vehicle, scripts and instructions are available from the public repository. [obd automotive data](https://github.com/edgeimpulse/obd-automotive-data)
Run the collection script to log data from your **ELM327**:
```
python3 collect_obd_data.py \
--model ./obd_fault.eim \
--csv ./airleak_MAF_NOx.csv \
--axes "RPM [RPM],PEDAL INPUT [%],MAF [g/s],NOx [ppm]" \
--hz 2 --window-ms 2000 --step-ms 1000 --label-col fault_label
```
Play back the CSV file:
```
python3 play_csv_to_eim.py \
--model ./obd_fault.eim \
--csv ./airleak_MAF_NOx.csv \
--axes "RPM [RPM],PEDAL INPUT [%],MAF [g/s],NOx [ppm]" \
--hz 2 --window-ms 2000 --step-ms 1000 --label-col fault_label
```
For live capture on Pi, a wired **CAN HAT** is typically more reliable than Bluetooth ELM clones. **USB ELM327** also works well.
## Conclusion
In this tutorial, we explored how to collect **OBD-II** data from vehicles using both Bluetooth adapters and direct CAN bus connections, then trained and deployed a classifier that flags an intake air leak from the relationship between NOx and engine load. This workflow generalizes to other vehicle faults (misfire, EGR, sensor bias) and industrial CAN signals.
## Related work
**Network (starter):**
* Dense **128** (ReLU) → Dropout **0.20**
* Dense **64** (ReLU)
* Dense **N\_classes** (Softmax)
**Training:**
* Split: **70/30** train/validation
* Epochs: **50–100**
* Batch size: **32**
* Enable **Class weighting** if classes are imbalanced
Click **Start training** and review metrics.\
**Target:** ≥ **95%** precision/recall per class on the validation set.
## 8. Evaluate the model
* **Confusion matrix:** identify misclassifications (e.g., healthy ↔ fault)
* **Feature explorer:** confirm separation (trims/lambda/MAF/MAP)
* If one sensor dominates (e.g., only NOx), add more context:
* **STFT/LTFT** (fuel trims)
* **Lambda** (bank1/2)
* **Ratios** (e.g., `maf_per_rpm`, `map_per_throttle`)
## 9. Deploy
Open **Deploy** and choose your target:
* **Linux/Aarch64** (Raspberry Pi4)
### Scripts
We have created a short script that will play back a recording of the CSV file and simulate real-time classification of the **OBD-II** signals. This allows us to test the model's performance in a controlled environment before deploying it to a live vehicle, scripts and instructions are available from the public repository. [obd automotive data](https://github.com/edgeimpulse/obd-automotive-data)
Run the collection script to log data from your **ELM327**:
```
python3 collect_obd_data.py \
--model ./obd_fault.eim \
--csv ./airleak_MAF_NOx.csv \
--axes "RPM [RPM],PEDAL INPUT [%],MAF [g/s],NOx [ppm]" \
--hz 2 --window-ms 2000 --step-ms 1000 --label-col fault_label
```
Play back the CSV file:
```
python3 play_csv_to_eim.py \
--model ./obd_fault.eim \
--csv ./airleak_MAF_NOx.csv \
--axes "RPM [RPM],PEDAL INPUT [%],MAF [g/s],NOx [ppm]" \
--hz 2 --window-ms 2000 --step-ms 1000 --label-col fault_label
```
For live capture on Pi, a wired **CAN HAT** is typically more reliable than Bluetooth ELM clones. **USB ELM327** also works well.
## Conclusion
In this tutorial, we explored how to collect **OBD-II** data from vehicles using both Bluetooth adapters and direct CAN bus connections, then trained and deployed a classifier that flags an intake air leak from the relationship between NOx and engine load. This workflow generalizes to other vehicle faults (misfire, EGR, sensor bias) and industrial CAN signals.
## Related work