> ## Documentation Index
> Fetch the complete documentation index at: https://docs.edgeimpulse.com/llms.txt
> Use this file to discover all available pages before exploring further.
# Environmental sensor fusion
> Fuse accelerometer and temperature sensor data to build a multi-sensor classifier, and deploy it to an Arduino Nano 33 BLE Sense.
export const CardOpenStudioTutorial = ({href}) =>
Skip the setup: clone a ready-to-use Edge Impulse project with the dataset, impulse, and trained model.
;
Neural networks are not limited to working with one type of data at a time. One of their biggest advantages is that they are incredibly flexible with the type of input data, so long as the format and ordering of that data stays the same from training to inference. As a result, we can use them to perform *sensor fusion* for a variety of tasks.
Sensor fusion is the process of combining data from different types of sensors or similar sensors mounted in different locations, which gives us more information to make decisions and classifications. For example, you could use temperature data with accelerometer data to get a better idea of a potential anomaly!
In this tutorial, you will learn how to use Edge Impulse to perform sensor fusion on the Arduino Nano 33 BLE Sense.
**Multi-impulse vs multi-model vs sensor fusion**
Running **multi-impulse** refers to running two separate projects (different data, different DSP blocks and different models) on the same target. It will require modifying some files in the EI-generated SDKs. See the [multi-impulse tutorial](/tutorials/topics/inference/run-multiple-impulses-cpp)
Running **multi-model** refers to running two different models (same data, same DSP block but different tflite models) on the same target. See how to run a motion classifier model and an anomaly detection model on the same device in [this tutorial](/tutorials/end-to-end/motion-recognition).
**Sensor fusion** refers to the process of combining data from different types of sensors to give more information to the neural network. To extract meaningful information from this data, you can use the same DSP block (like in this tutorial), multiples DSP blocks, or use neural networks embeddings like this [sensor fusion using Embeddings](/tutorials/topics/feature-extraction/use-embeddings-sensor-fusion) tutorial.
### 1. Prerequisites
For this tutorial, you'll need a [supported device](/hardware).
### 2. Building a dataset
For this demo, we'll show you how to identify different environments by using a fusion of temperature, humidity, pressure, and light data. In particular, I'll have the Arduino board identify different rooms in my house as well as outside. Note that the we assume that the environment is static--if I turn out lights or the outside temperature changes, the model will not work. However, it demonstrates how we can combine different sensor data with machine learning to do classification!
As we will be collecting data from our Arduino board connected to a computer, it helps to have a laptop that you can move to different rooms.
Create a new project on the Edge Impulse studio.
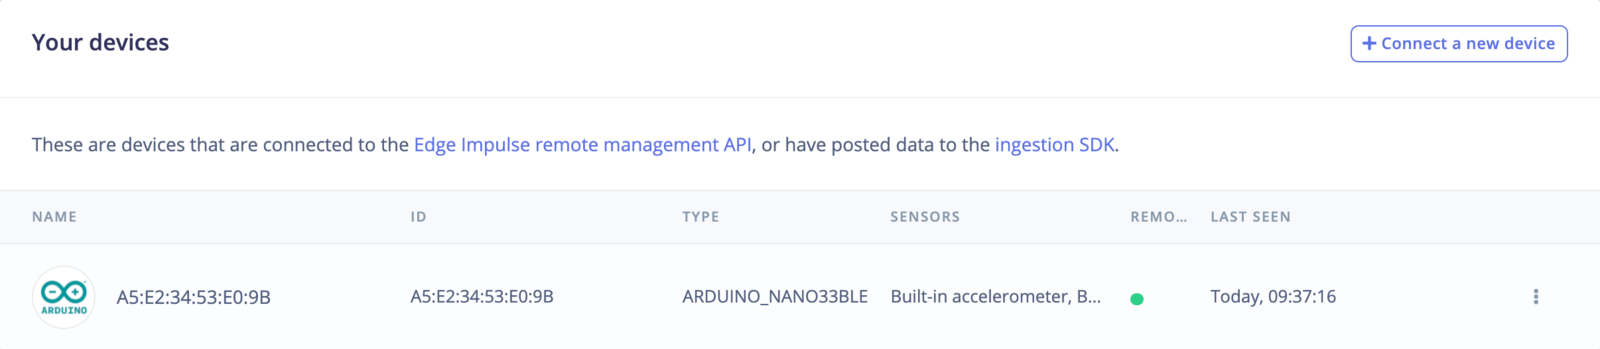
Connect the Arduino Nano 33 BLE to your computer. Follow the [Arduino Nano 33 BLE Sense tutorial](/hardware/boards/arduino-nano-33-ble-sense) to upload the Edge Impulse firmware to the board and connect it to your project.
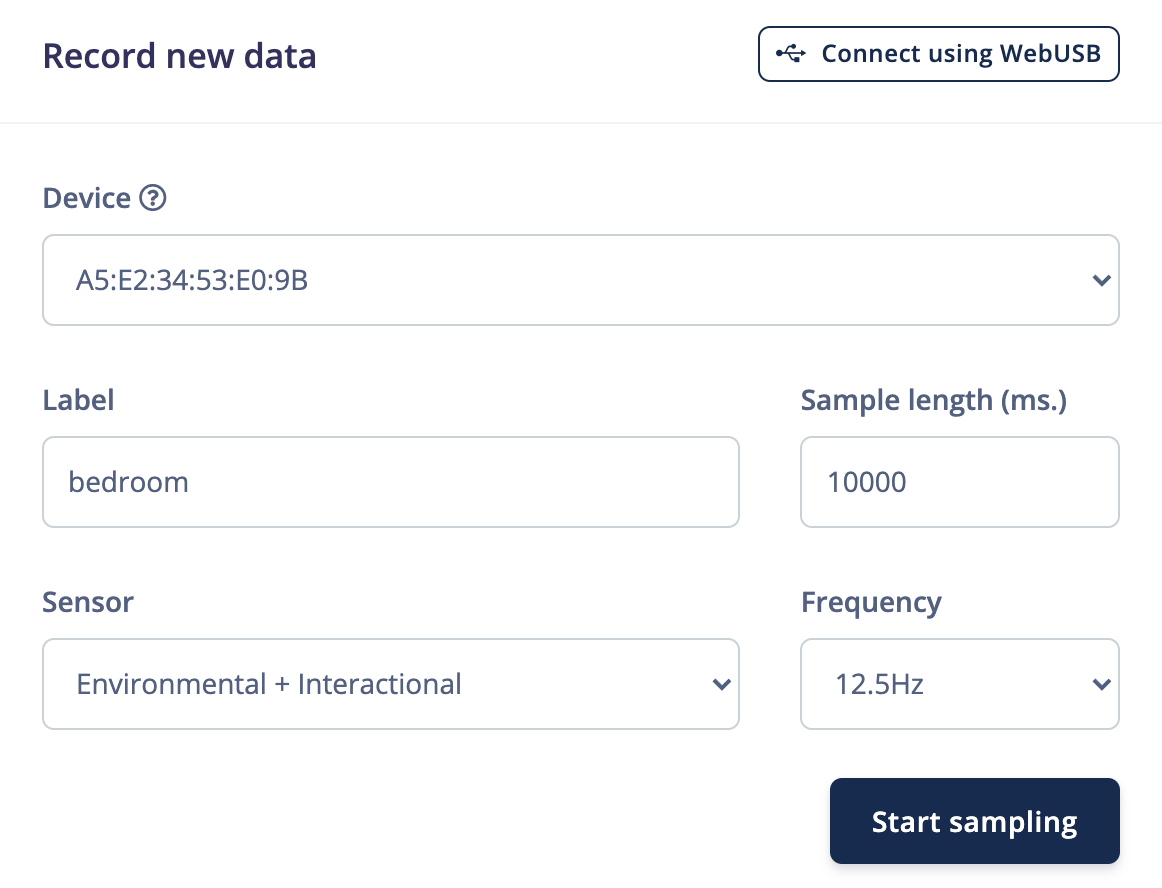
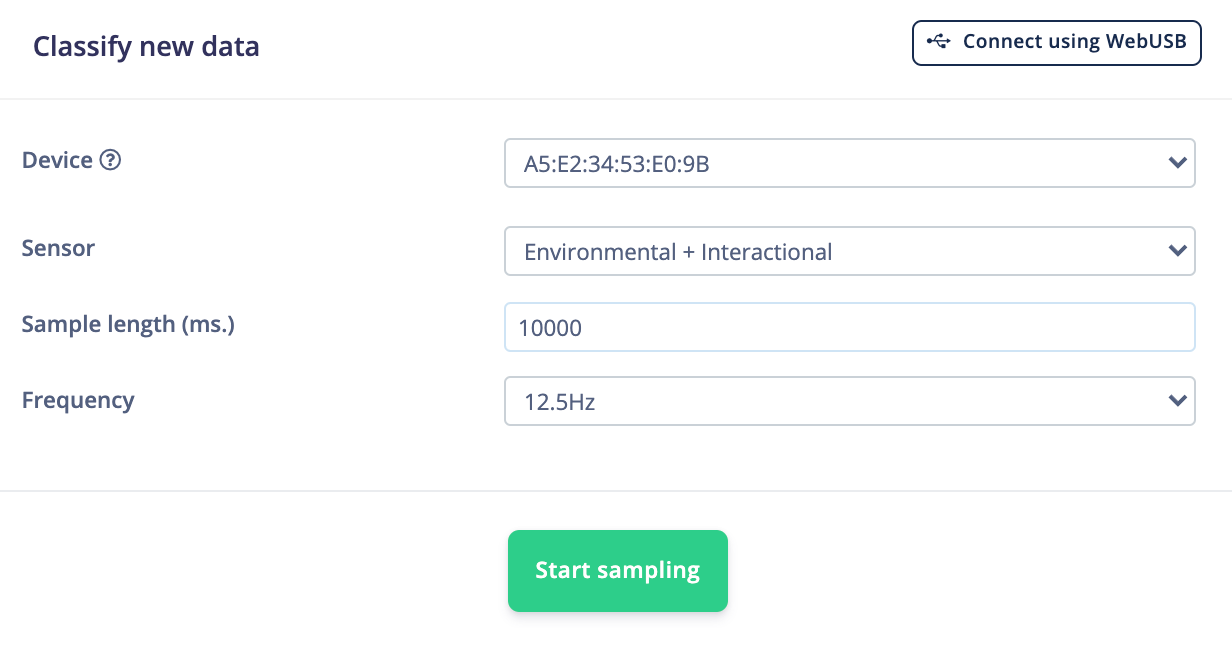
 Go to **Data acquisition**. Under **Record new data**, select your device and set the label to `bedroom`. Change **Sensor** to `Environmental + Interactional`, set the **Sample length** to `10000` ms and **Frequency** to `12.5Hz`.
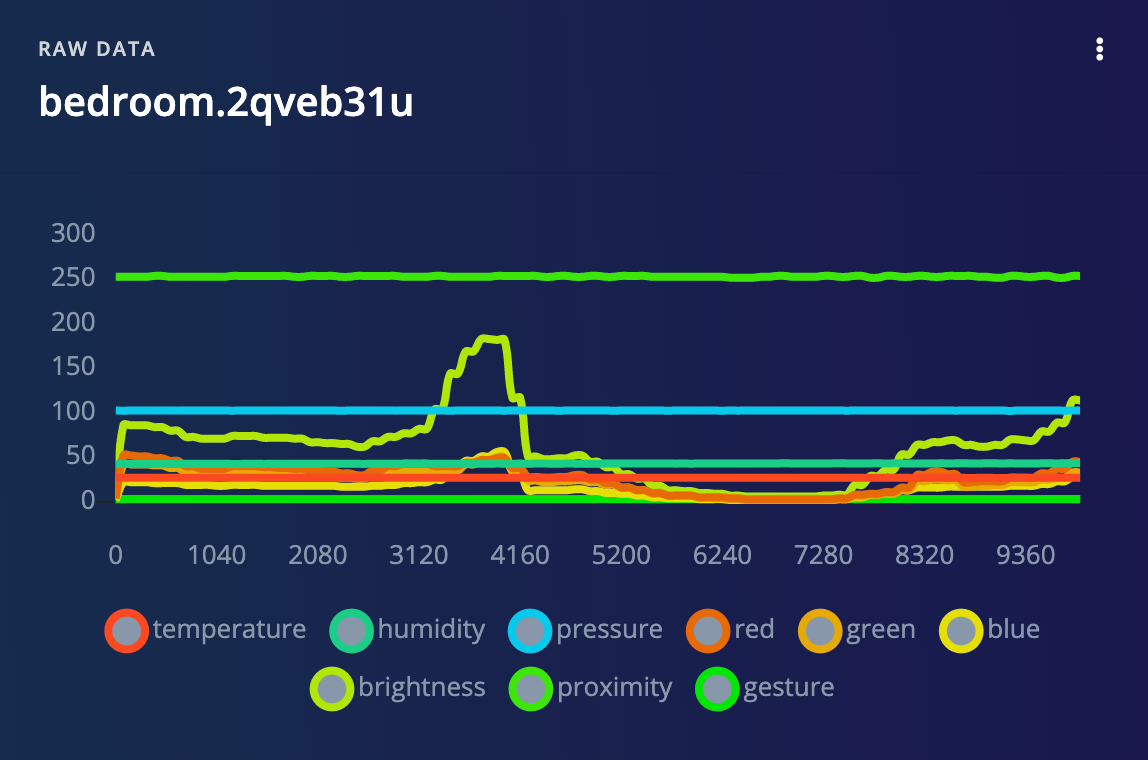
 Stand in one of your rooms with your Arduino board (and laptop). Click **Start sampling** and slowly move the board around while data is collected. After sampling is complete, you should see a new data plot with a different line for each sensor.
 **Variations**
Try to stand in different parts of each room while collecting data.
Repeat this process to record about 3 minutes of data for the *bedroom* class. Try to stand in a different spot in the room while collecting data--we want a robust dataset that represents the features of each room. Head to another room and repeat data collection. Continue doing this until you have around 3 minutes of data for each of the following classes:
* Bedroom
* Hallway
* Outside
You are welcome to try other rooms or locations. For this demo, I found that my bedroom, kitchen, and living room all exhibited similar environmental and lighting properties, so the model struggled to tell them apart.
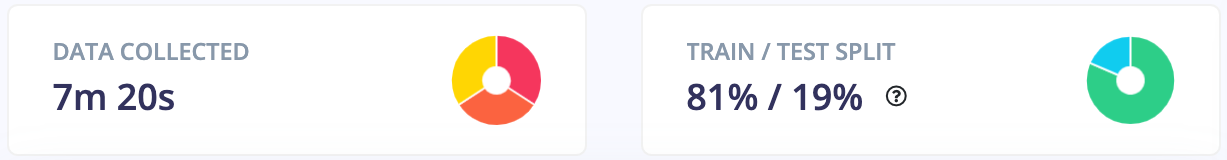
Head to **Dashboard** and scroll down to **Danger zone**. Click **Perform train/test split** and follow the instructions in the pop-up window to split your dataset into training and testing groups. When you're done, you can head back to **Data acquisition** to see that your dataset has been split. You should see about 80% of your samples in **Training data** and about 20% in **Test data**.
**Variations**
Try to stand in different parts of each room while collecting data.
Repeat this process to record about 3 minutes of data for the *bedroom* class. Try to stand in a different spot in the room while collecting data--we want a robust dataset that represents the features of each room. Head to another room and repeat data collection. Continue doing this until you have around 3 minutes of data for each of the following classes:
* Bedroom
* Hallway
* Outside
You are welcome to try other rooms or locations. For this demo, I found that my bedroom, kitchen, and living room all exhibited similar environmental and lighting properties, so the model struggled to tell them apart.
Head to **Dashboard** and scroll down to **Danger zone**. Click **Perform train/test split** and follow the instructions in the pop-up window to split your dataset into training and testing groups. When you're done, you can head back to **Data acquisition** to see that your dataset has been split. You should see about 80% of your samples in **Training data** and about 20% in **Test data**.
 ### 4. Design an Impulse
An impulse is a combination of preprocessing (DSP) blocks followed by machine learning blocks. It will slice up our data into smaller windows, use signal processing to extract features, and then train a machine learning model. Because we are using environmental and light data, which are slow-moving averages, we will use the [Flatten block](/studio/projects/processing-blocks/blocks/flatten) for preprocessing.
Head to **Create impulse**. Change the **Window increase** to `500 ms`. Add a **Flatten block**. Notice that you can choose which environmental and interactional sensor data to include. Deselect **proximity** and **gesture**, as we won't need those to detect rooms. Add a **Classification (Keras)** learning block
### 4. Design an Impulse
An impulse is a combination of preprocessing (DSP) blocks followed by machine learning blocks. It will slice up our data into smaller windows, use signal processing to extract features, and then train a machine learning model. Because we are using environmental and light data, which are slow-moving averages, we will use the [Flatten block](/studio/projects/processing-blocks/blocks/flatten) for preprocessing.
Head to **Create impulse**. Change the **Window increase** to `500 ms`. Add a **Flatten block**. Notice that you can choose which environmental and interactional sensor data to include. Deselect **proximity** and **gesture**, as we won't need those to detect rooms. Add a **Classification (Keras)** learning block
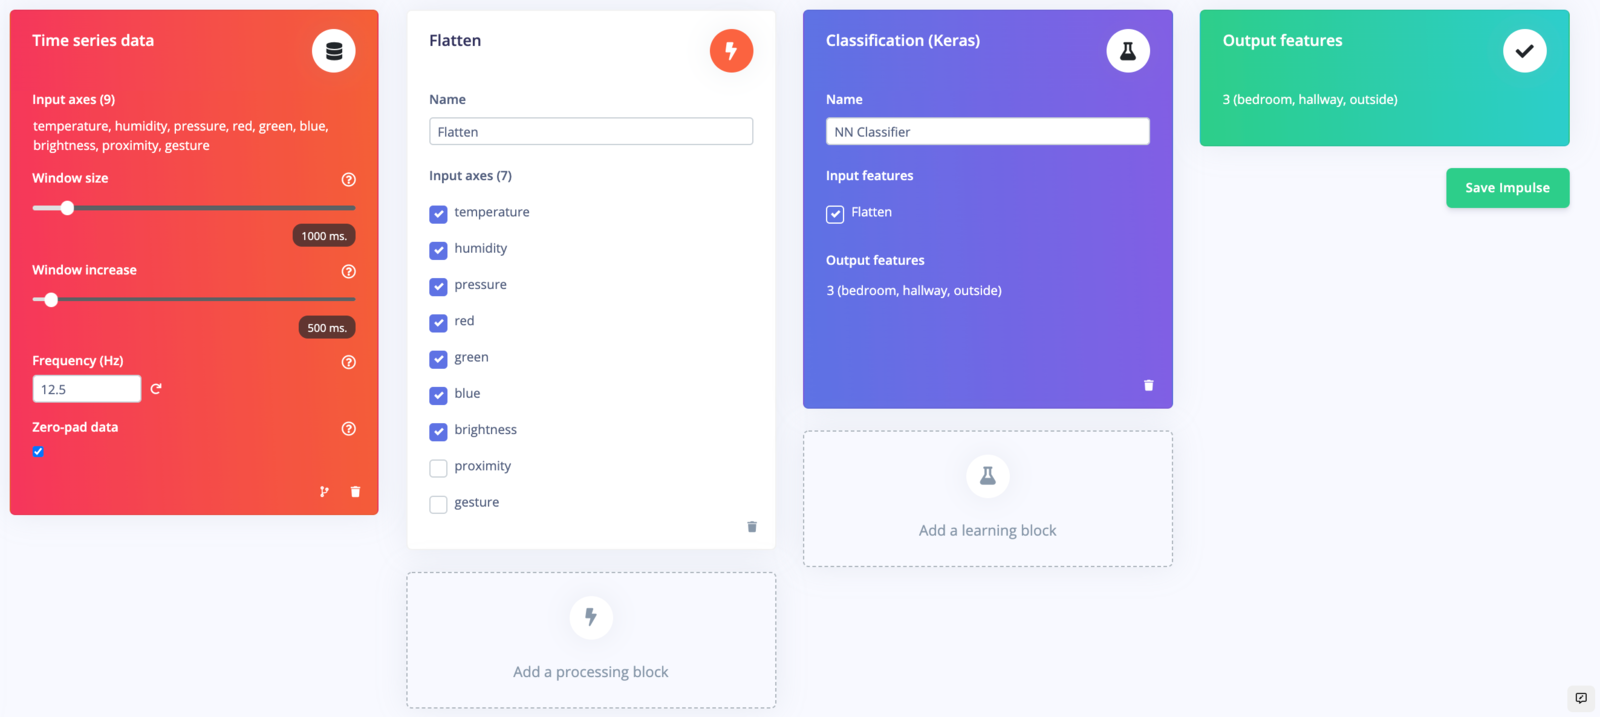 Click **Save impulse**.
### 5. Configure the Flatten block
Head to **Flatten**. You can select different samples and move the window around to see what the DSP result will look like for each set of features to be sent to the learning block.
Click **Save impulse**.
### 5. Configure the Flatten block
Head to **Flatten**. You can select different samples and move the window around to see what the DSP result will look like for each set of features to be sent to the learning block.
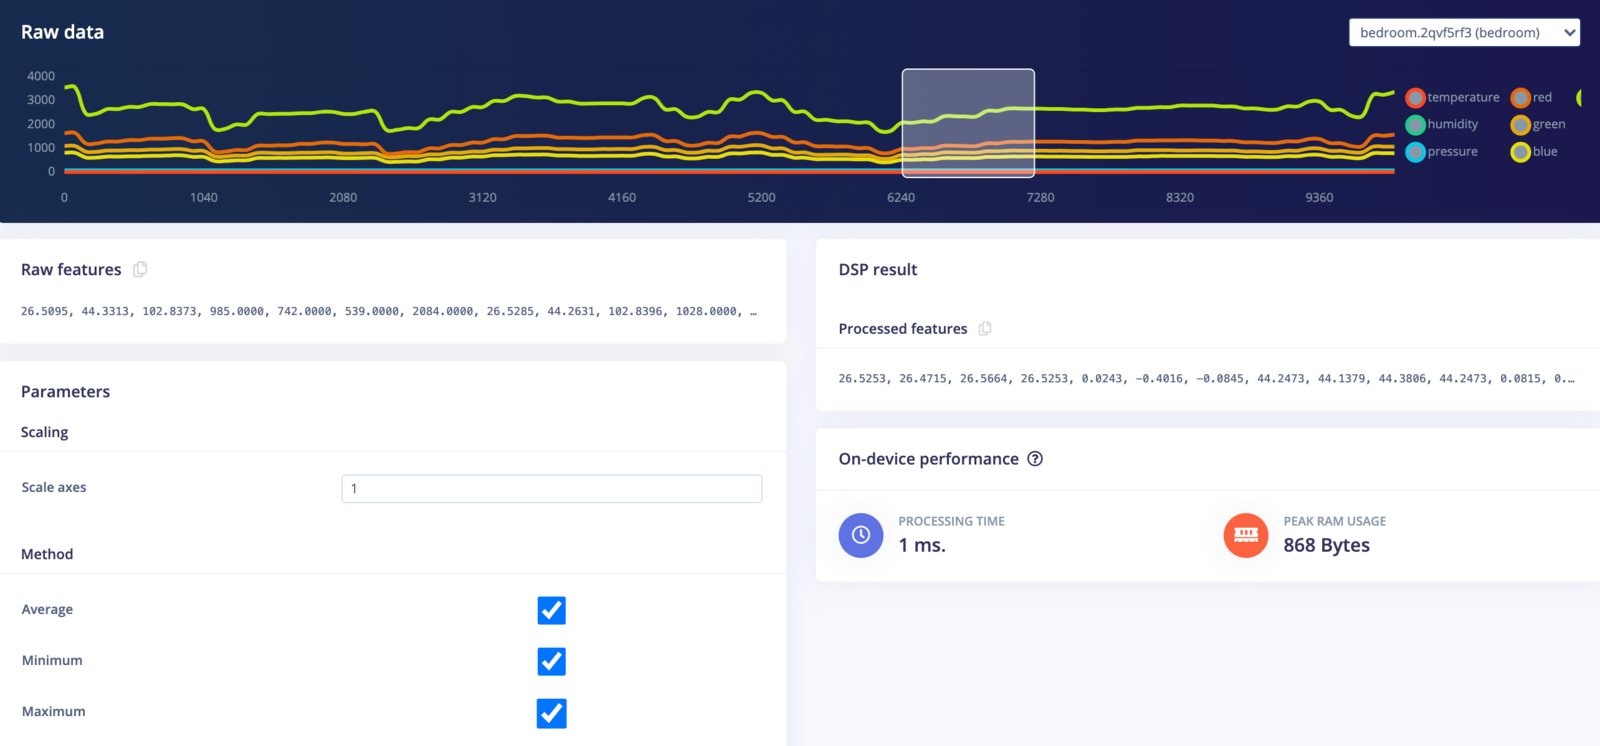 The Flatten block will compute the average, minimum, maximum, root-mean square, standard deviation, skewness, and kurtosis of each axis (e.g. temperature, humidity, brightness, etc.). With 7 axes and 7 features computed for each axis, that gives us 49 features for each window being sent to the learning block. You can see these computed features under **Processed features**.
Click **Save parameters**. On the next screen, select **Calculate feature importance** and click **Generate features**.
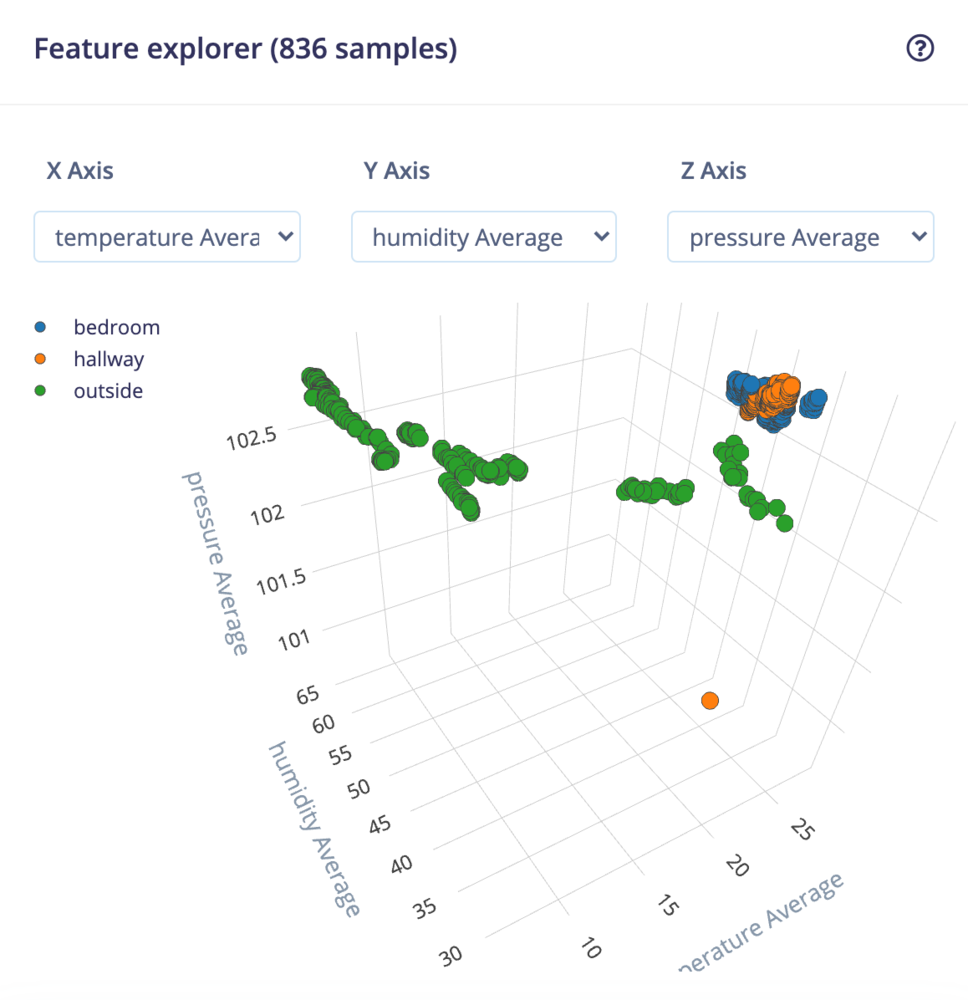
After a few moments, you should be able to explore the features of your dataset to see if your classes are easily separated into categories.
The Flatten block will compute the average, minimum, maximum, root-mean square, standard deviation, skewness, and kurtosis of each axis (e.g. temperature, humidity, brightness, etc.). With 7 axes and 7 features computed for each axis, that gives us 49 features for each window being sent to the learning block. You can see these computed features under **Processed features**.
Click **Save parameters**. On the next screen, select **Calculate feature importance** and click **Generate features**.
After a few moments, you should be able to explore the features of your dataset to see if your classes are easily separated into categories.
 You can also look at the **Feature importance** section to get an idea of which features are the most important in determining class membership. You can read more about feature importance [here](https://edgeimpulse.com/blog/advanced-anomaly-detection-with-feature-importance).
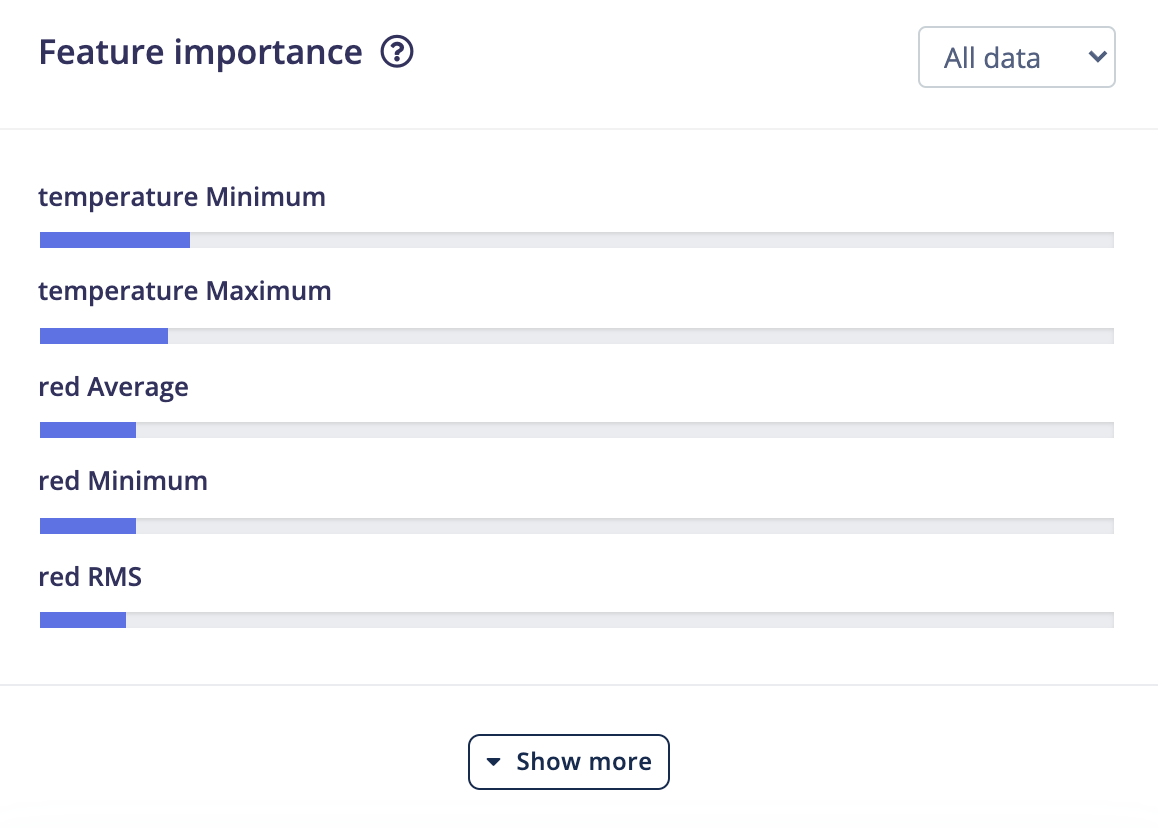 Interestingly enough, it looks like temperature and red light values were the most important features in determining the location of the Arduino board.
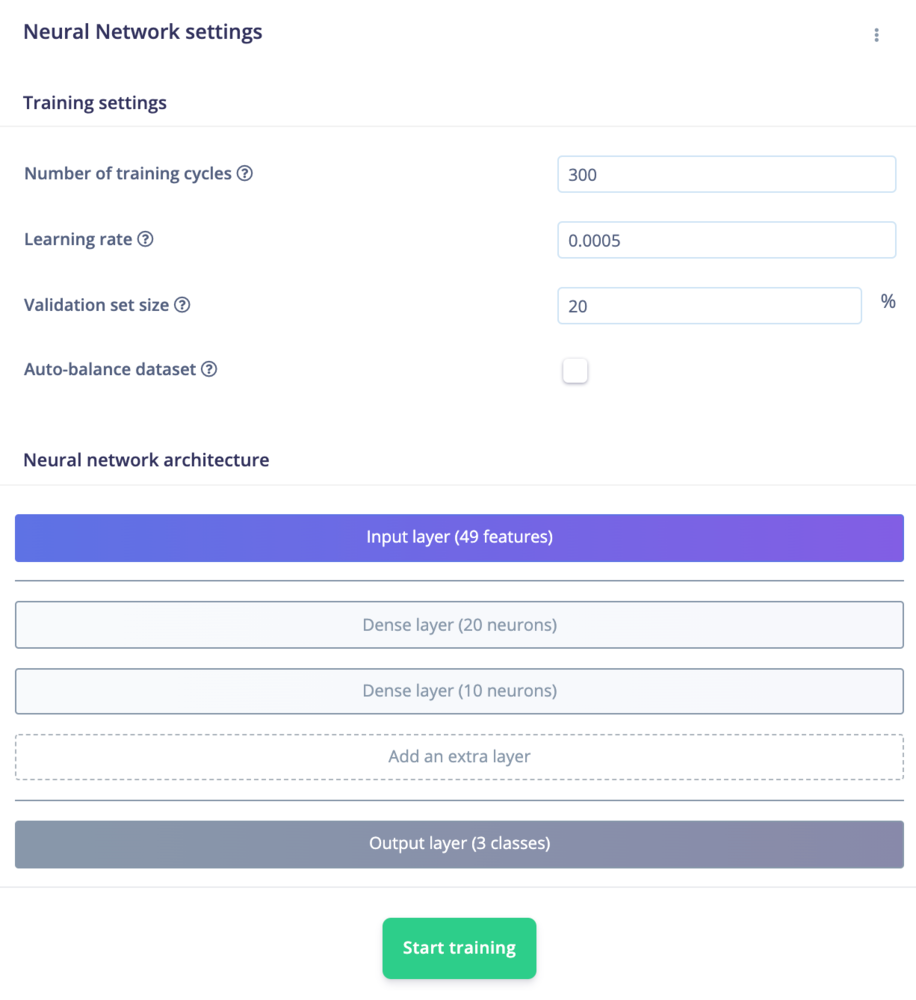
### 6. Configure the neural network
With our dataset collected and features processed, we can train our machine learning model. Click on **NN Classifier**. Change the **Number of training cycles** to `300` and click **Start training**. We will leave the neural network architecture as the default for this demo.
Interestingly enough, it looks like temperature and red light values were the most important features in determining the location of the Arduino board.
### 6. Configure the neural network
With our dataset collected and features processed, we can train our machine learning model. Click on **NN Classifier**. Change the **Number of training cycles** to `300` and click **Start training**. We will leave the neural network architecture as the default for this demo.
 During training, parameters in the neural network's neurons are gradually updated so that the model will try to guess the class of each set of data as accurately as possible. When training is complete, you should see a *Model* panel appear on the right side of the page.
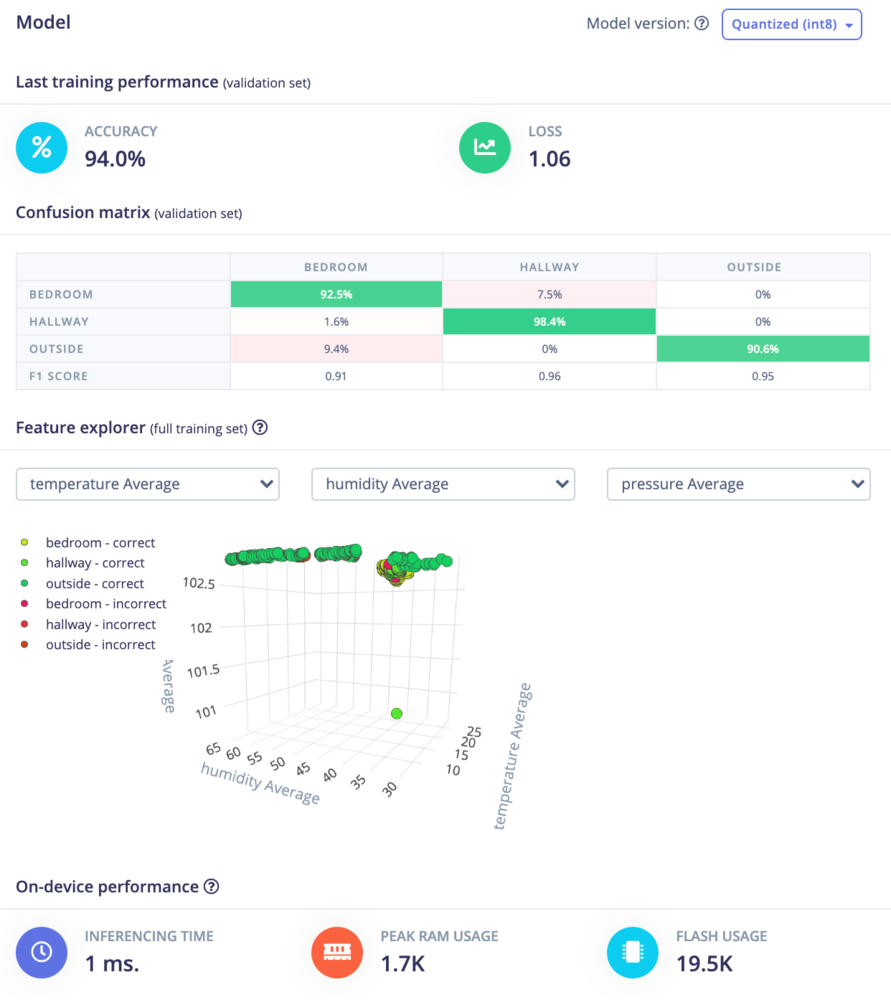 The **Confusion matrix** gives you an idea of how well the model performed at classifying the different sets of data. The top row gives the predicted label and the column on the left side gives the actual (ground-truth) label. Ideally, the model should predict the classes correctly, but that's not always the case. You want the diagonal cells from the top-left to the bottom-right to be as close to 100% as possible.
If you see a lot of confusion between classes, it means you need to gather more data, try different features, use a different model architecture, or train for a longer period of time (more epochs). See [this guide](/knowledge/guides/increasing-model-performance) to learn about ways to increase model performance.
The *On-device performance* provides some statistics about how the model will likely run on a particular device. By default, an Arm Cortex-M4F running at 80 MHz is assumed to be your target device. The actual memory requirements and run time may vary on different platforms.
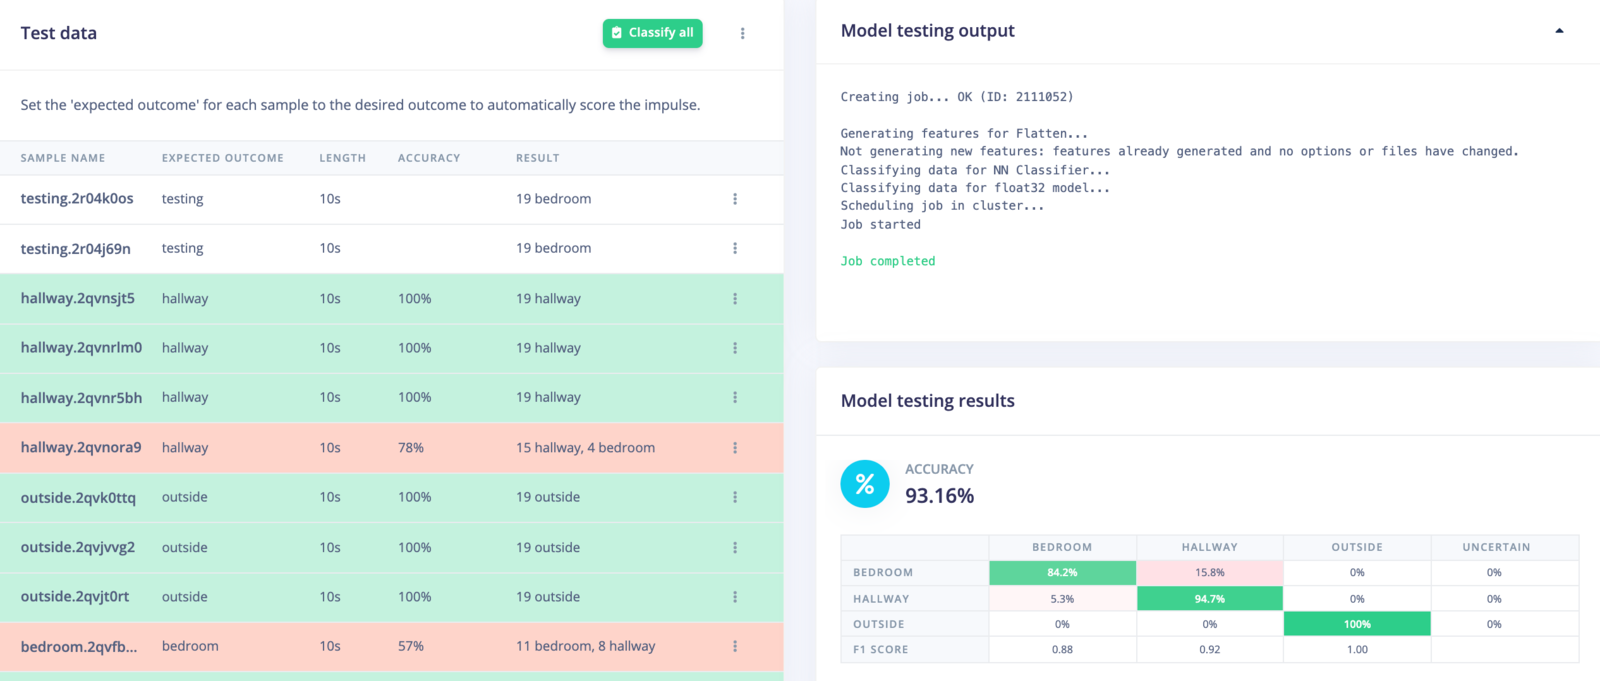
### 7. Model testing
Rather than simply assume that our model will work when deployed, we can run inference on our test dataset as well as on live data.
First, head to **Model testing**, and click **Classify all**. After a few moments, you should see results from your test set.
The **Confusion matrix** gives you an idea of how well the model performed at classifying the different sets of data. The top row gives the predicted label and the column on the left side gives the actual (ground-truth) label. Ideally, the model should predict the classes correctly, but that's not always the case. You want the diagonal cells from the top-left to the bottom-right to be as close to 100% as possible.
If you see a lot of confusion between classes, it means you need to gather more data, try different features, use a different model architecture, or train for a longer period of time (more epochs). See [this guide](/knowledge/guides/increasing-model-performance) to learn about ways to increase model performance.
The *On-device performance* provides some statistics about how the model will likely run on a particular device. By default, an Arm Cortex-M4F running at 80 MHz is assumed to be your target device. The actual memory requirements and run time may vary on different platforms.
### 7. Model testing
Rather than simply assume that our model will work when deployed, we can run inference on our test dataset as well as on live data.
First, head to **Model testing**, and click **Classify all**. After a few moments, you should see results from your test set.
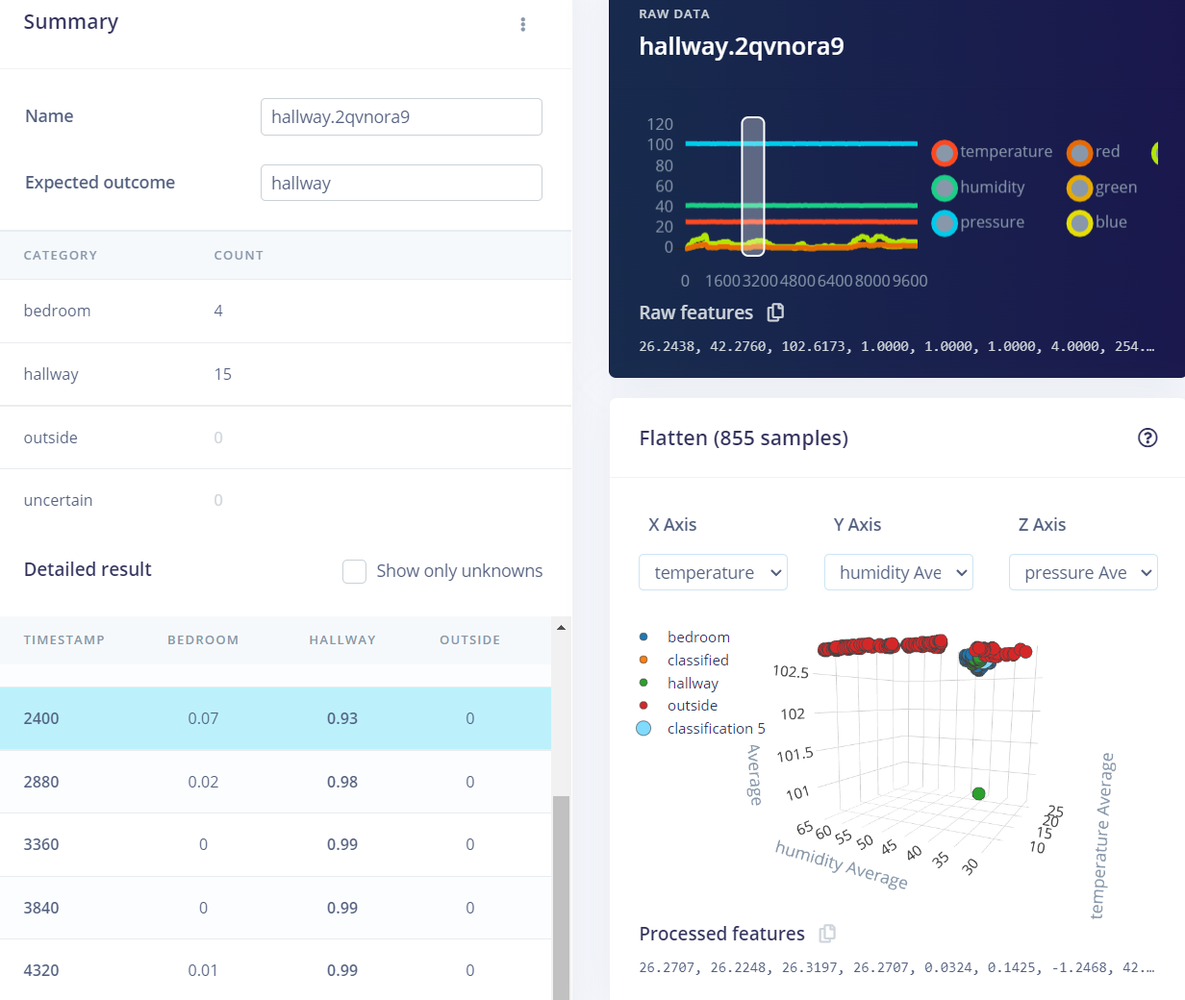
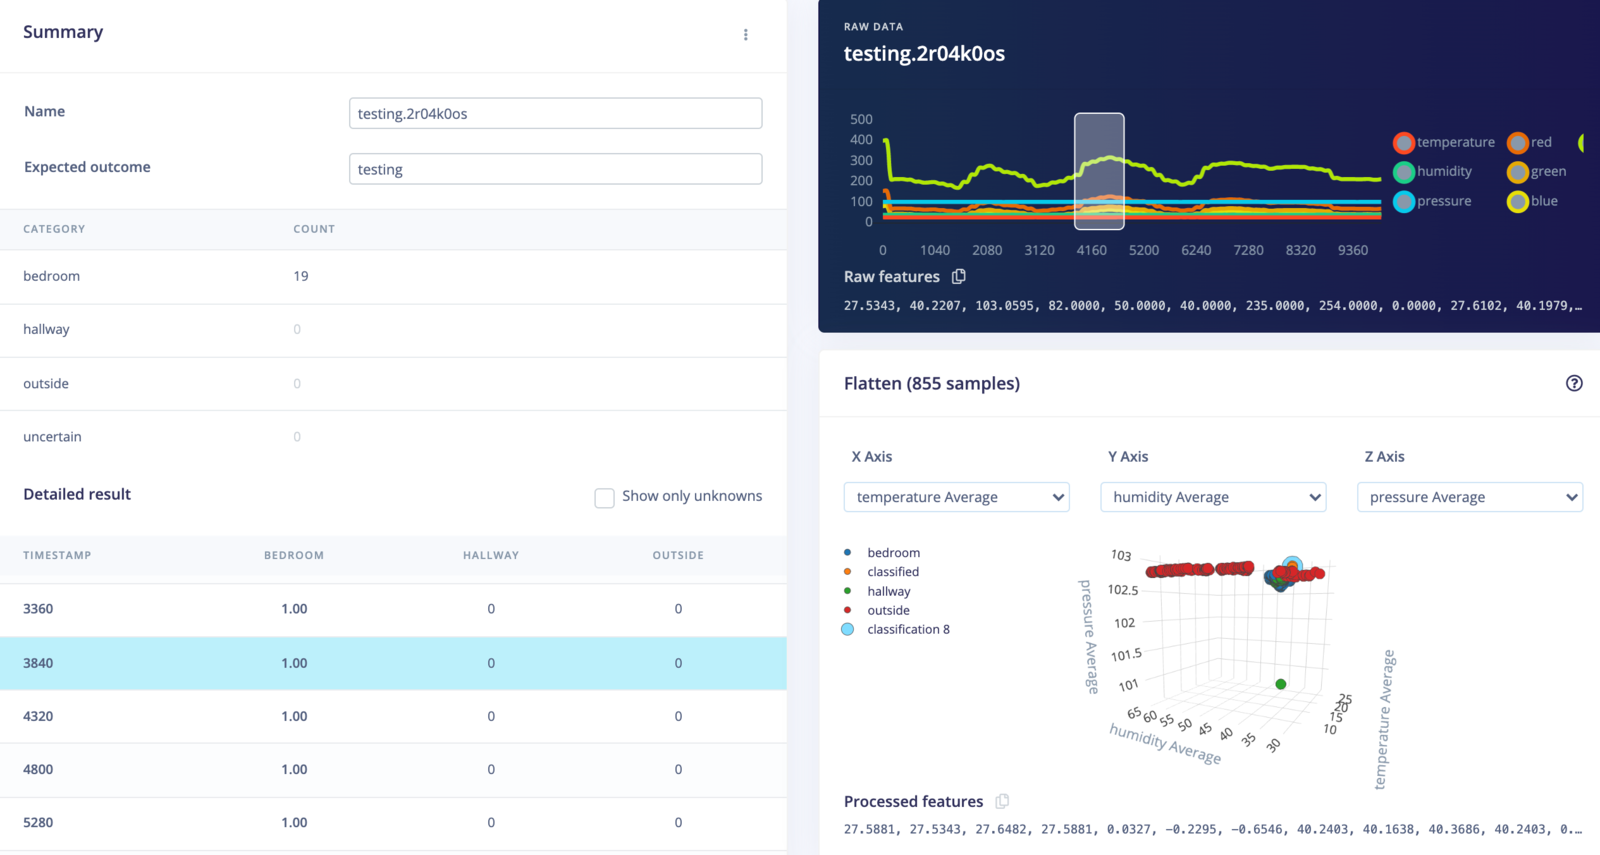
 You can click on the three dots next to an item and select **Show classification**. This will give you a classification result screen where you can see results information in more detail.
 Additionally, we can test the impulse in a real-world environment to make sure the model has not overfit the training data. To do that, head to **Live classification**. Make sure your device is connected to the Studio and that the *Sensor*, *Sample length*, and *Frequency* match what we used to initially capture data.
 Click **Start sampling**. A new sample will be captured from your board, uploaded, and classified. Once complete, you should see the classification results.
 In the example above, we sampled 10 seconds of data from the Arduino. This data is split into 1-second windows (the window moves over 0.5 seconds each time), and the data in that window is sent to the DSP block. The DSP block computes the 49 features that are then sent to the trained machine learning model, which performs a forward pass to give us our inference results.
As you can see, the inference results from all of the windows claimed that the Arduino board was in the bedroom, which was true! This is great news for our model--it seems to work even on unseen data.
### 8. Running the impulse on your device
Now that we have an impulse with a trained model and we've tested its functionality, we can deploy the model back to our device. This means the impulse can run locally without an internet connection to perform inference!
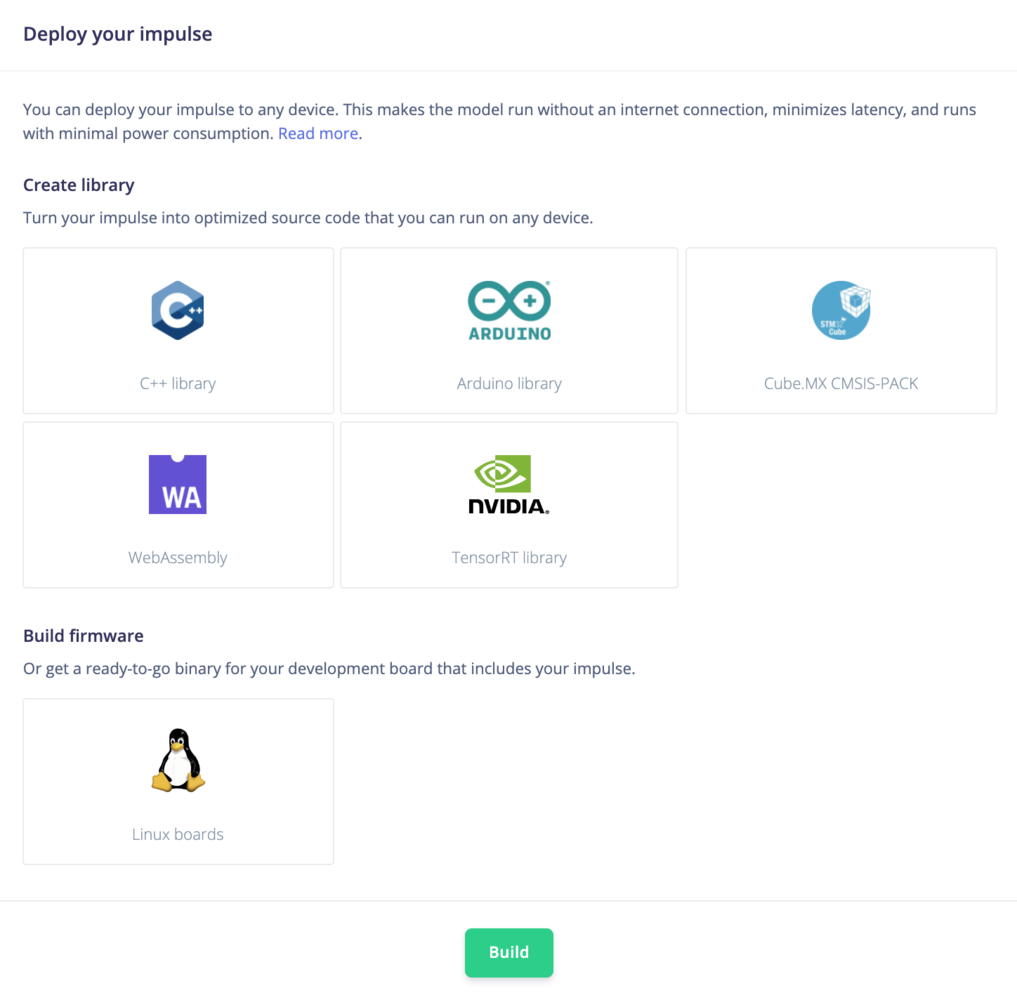
Edge Impulse can package up the entire impulse (preprocessing block, neural network, and classification code) into a single library that you can include in your embedded software.
Click on **Deployment** in the menu. Select the library that you would like to create, and click **Build** at the bottom of the page.
In the example above, we sampled 10 seconds of data from the Arduino. This data is split into 1-second windows (the window moves over 0.5 seconds each time), and the data in that window is sent to the DSP block. The DSP block computes the 49 features that are then sent to the trained machine learning model, which performs a forward pass to give us our inference results.
As you can see, the inference results from all of the windows claimed that the Arduino board was in the bedroom, which was true! This is great news for our model--it seems to work even on unseen data.
### 8. Running the impulse on your device
Now that we have an impulse with a trained model and we've tested its functionality, we can deploy the model back to our device. This means the impulse can run locally without an internet connection to perform inference!
Edge Impulse can package up the entire impulse (preprocessing block, neural network, and classification code) into a single library that you can include in your embedded software.
Click on **Deployment** in the menu. Select the library that you would like to create, and click **Build** at the bottom of the page.
 **Running your impulse locally**
See the [Deployments](/hardware/deployments) tutorials to learn how to deploy your impulse to a variety of platforms.
### 9. Conclusion
Well done! You've trained a neural network to determine the location of a development board based on a fusion of several sensors working in tandem. Note that this demo is fairly limited--as the daylight or temperature changes, the model will no longer be valid. However, it hopefully gives you some ideas about how you can mix and match sensors to achieve your machine learning goals.
If you're interested in more, see our tutorials on [Sound recognition](/tutorials/end-to-end/sound-recognition) or [Image classification](/tutorials/end-to-end/image-classification). If you have a great idea for a different project, that's fine too. Edge Impulse lets you capture data from any sensor, build [custom processing blocks](/studio/organizations/custom-blocks/custom-processing-blocks) to extract features, and you have full flexibility in your Machine Learning pipeline with the learning blocks.
We can't wait to see what you'll build! 🚀
**Running your impulse locally**
See the [Deployments](/hardware/deployments) tutorials to learn how to deploy your impulse to a variety of platforms.
### 9. Conclusion
Well done! You've trained a neural network to determine the location of a development board based on a fusion of several sensors working in tandem. Note that this demo is fairly limited--as the daylight or temperature changes, the model will no longer be valid. However, it hopefully gives you some ideas about how you can mix and match sensors to achieve your machine learning goals.
If you're interested in more, see our tutorials on [Sound recognition](/tutorials/end-to-end/sound-recognition) or [Image classification](/tutorials/end-to-end/image-classification). If you have a great idea for a different project, that's fine too. Edge Impulse lets you capture data from any sensor, build [custom processing blocks](/studio/organizations/custom-blocks/custom-processing-blocks) to extract features, and you have full flexibility in your Machine Learning pipeline with the learning blocks.
We can't wait to see what you'll build! 🚀