> ## Documentation Index
> Fetch the complete documentation index at: https://docs.edgeimpulse.com/llms.txt
> Use this file to discover all available pages before exploring further.
# Training graphs
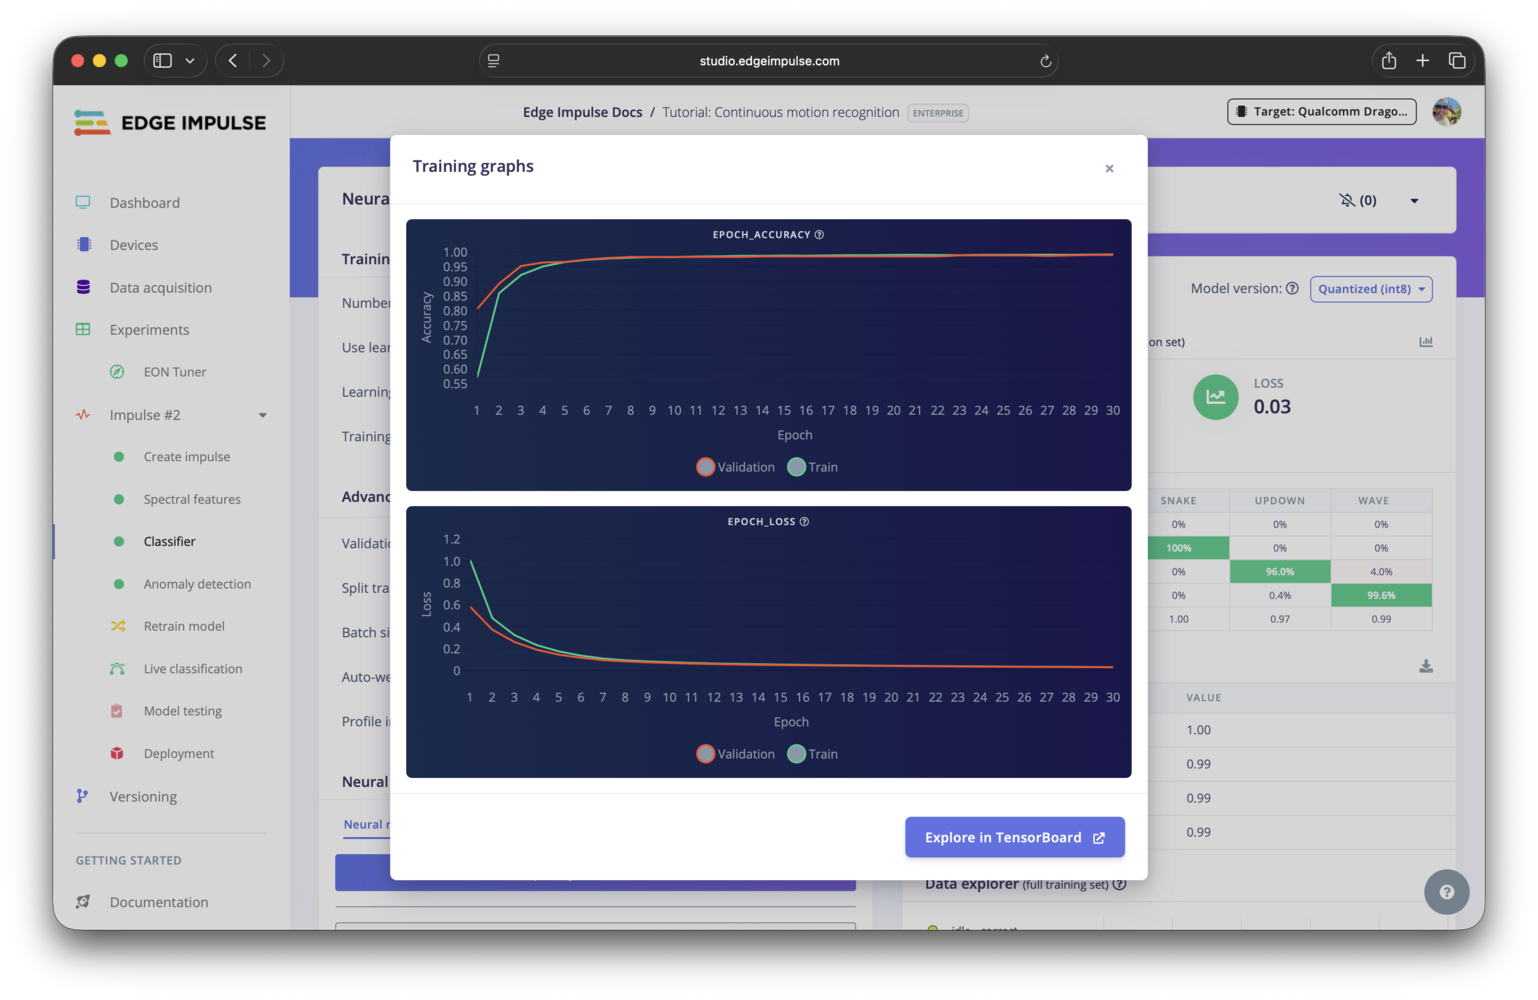
Training graphs provide visual insights into the performance of your machine learning model during the training process. These visualizations help you understand how well your model is learning by identifying issues - overfitting, underfitting, unstable learning, or convergence issues, for example - and can guide you in making adjustments to improve its accuracy and efficiency.
Accuracy and loss graphs are available on the [learning block](/studio/projects/learning-blocks) page after training has been completed, further exploration can be achieved through a [TensorBoard](https://www.tensorflow.org/tensorboard) integration, and custom graphs can be added using [expert mode](/studio/projects/learning-blocks/expert-mode) or [custom learning blocks](/studio/organizations/custom-blocks/custom-learning-blocks).
## Viewing training graphs
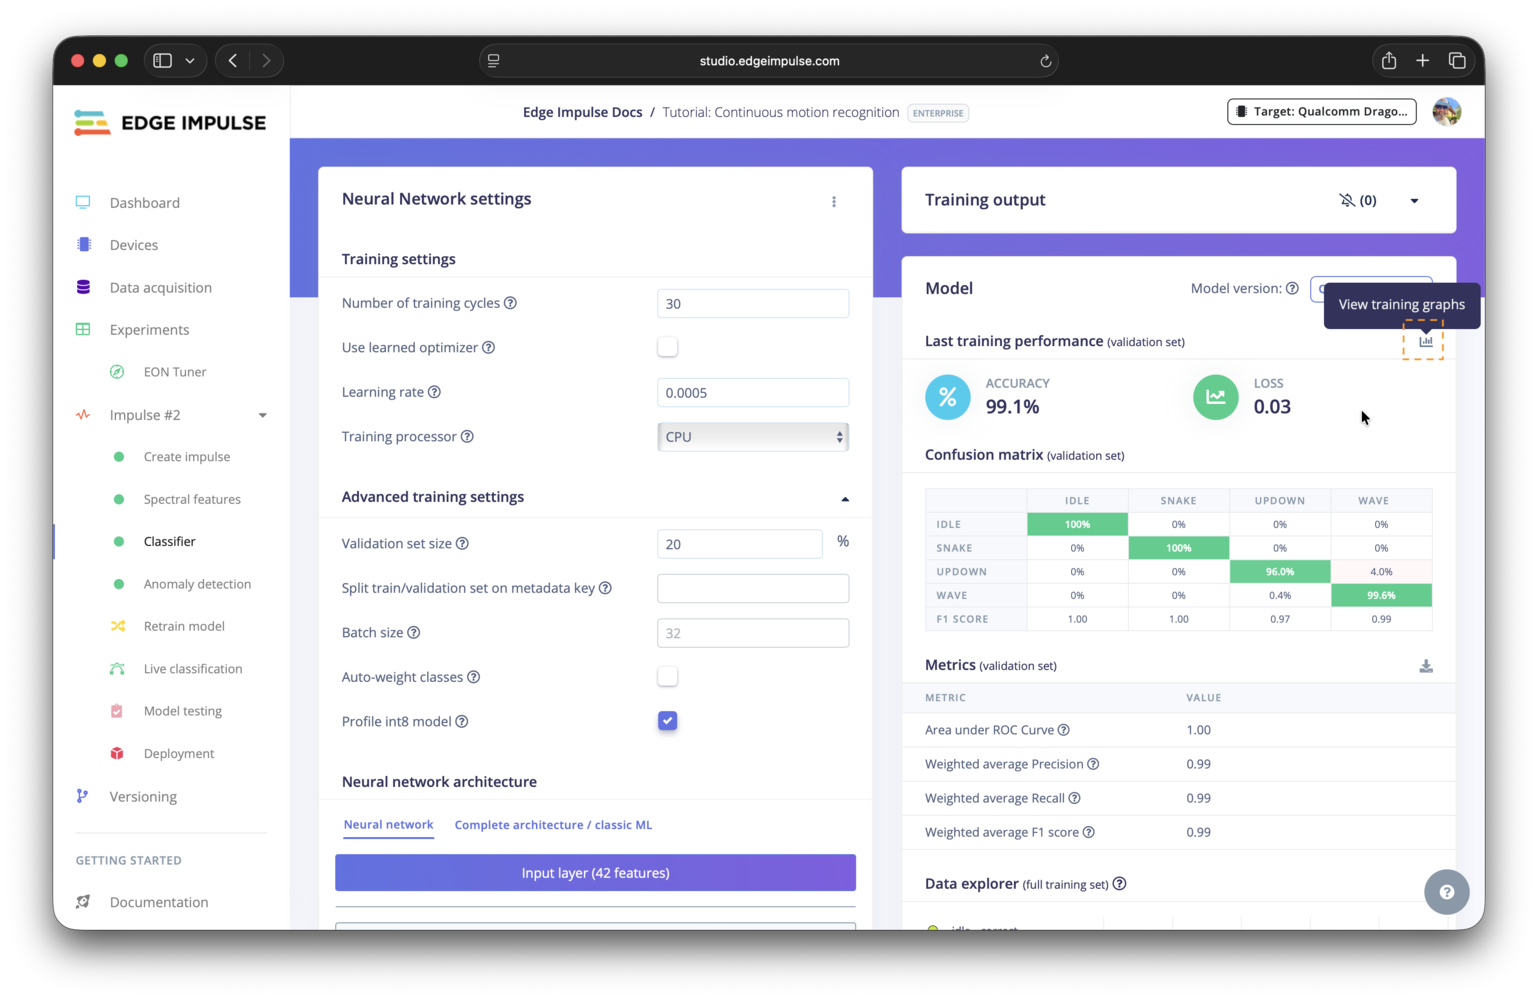
On the learning block page, after training is complete, you can view the accuracy and loss graphs by clicking the graphs icon near the top right of the model performance overview pane. This will open a modal displaying the graphs for both training and validation data, allowing you to analyze the performance of your model over the training epochs.
 ## Going deeper with TensorBoard
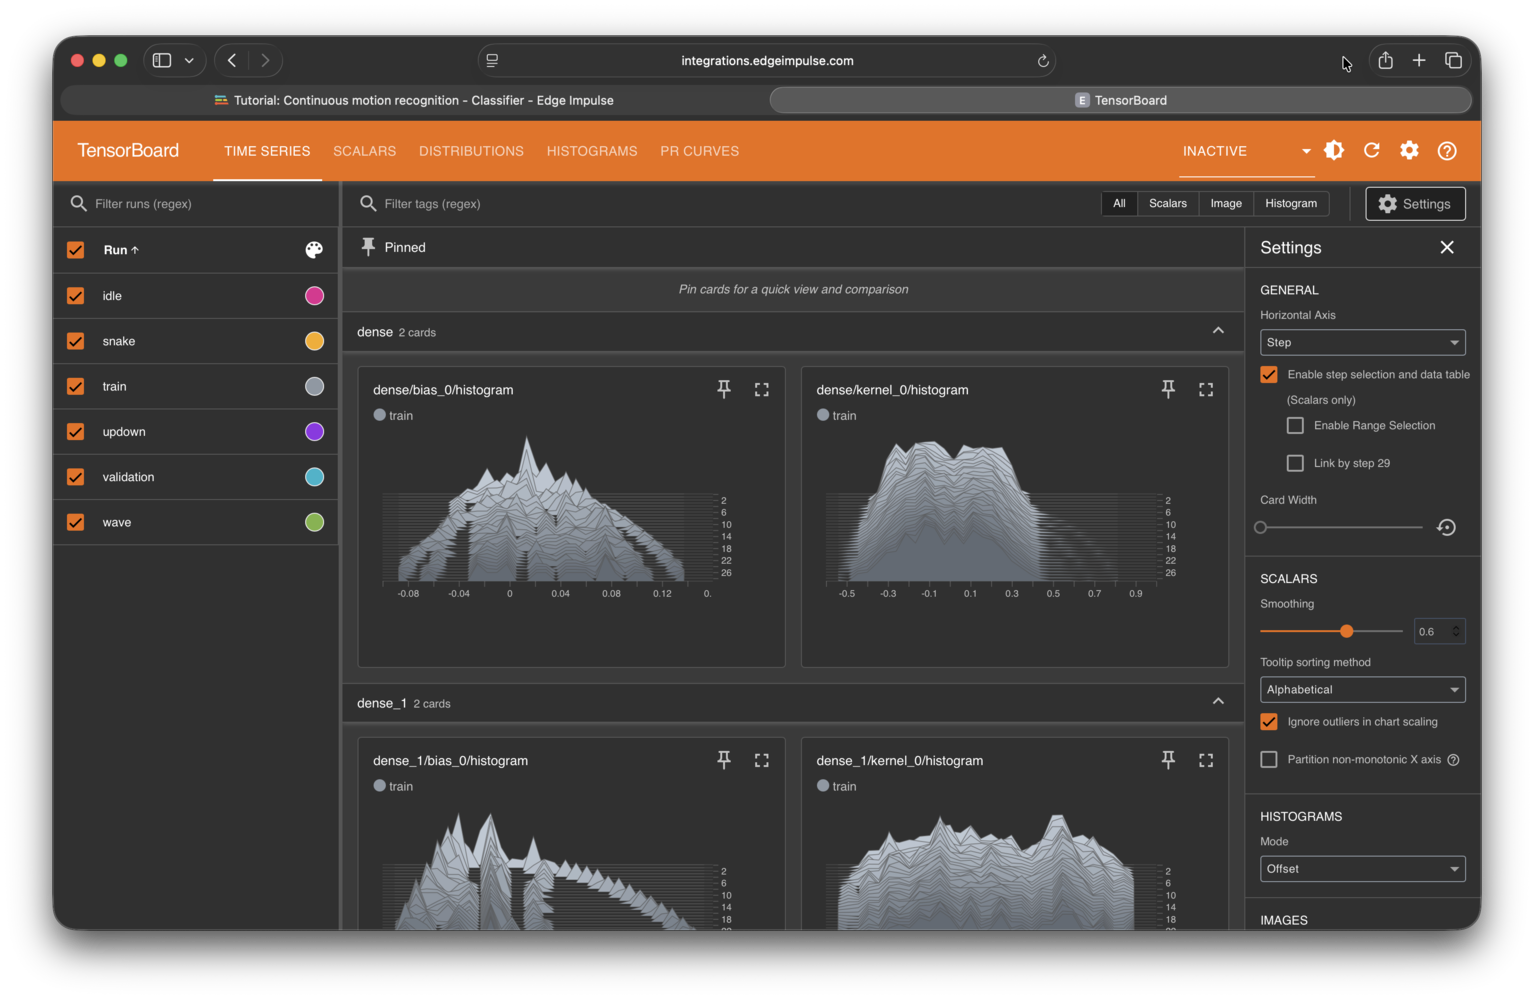
For a more detailed analysis of the model training process, you can use the TensorBoard integration. TensorBoard provides a suite of visualization tools to help you understand, debug, and optimize your model.
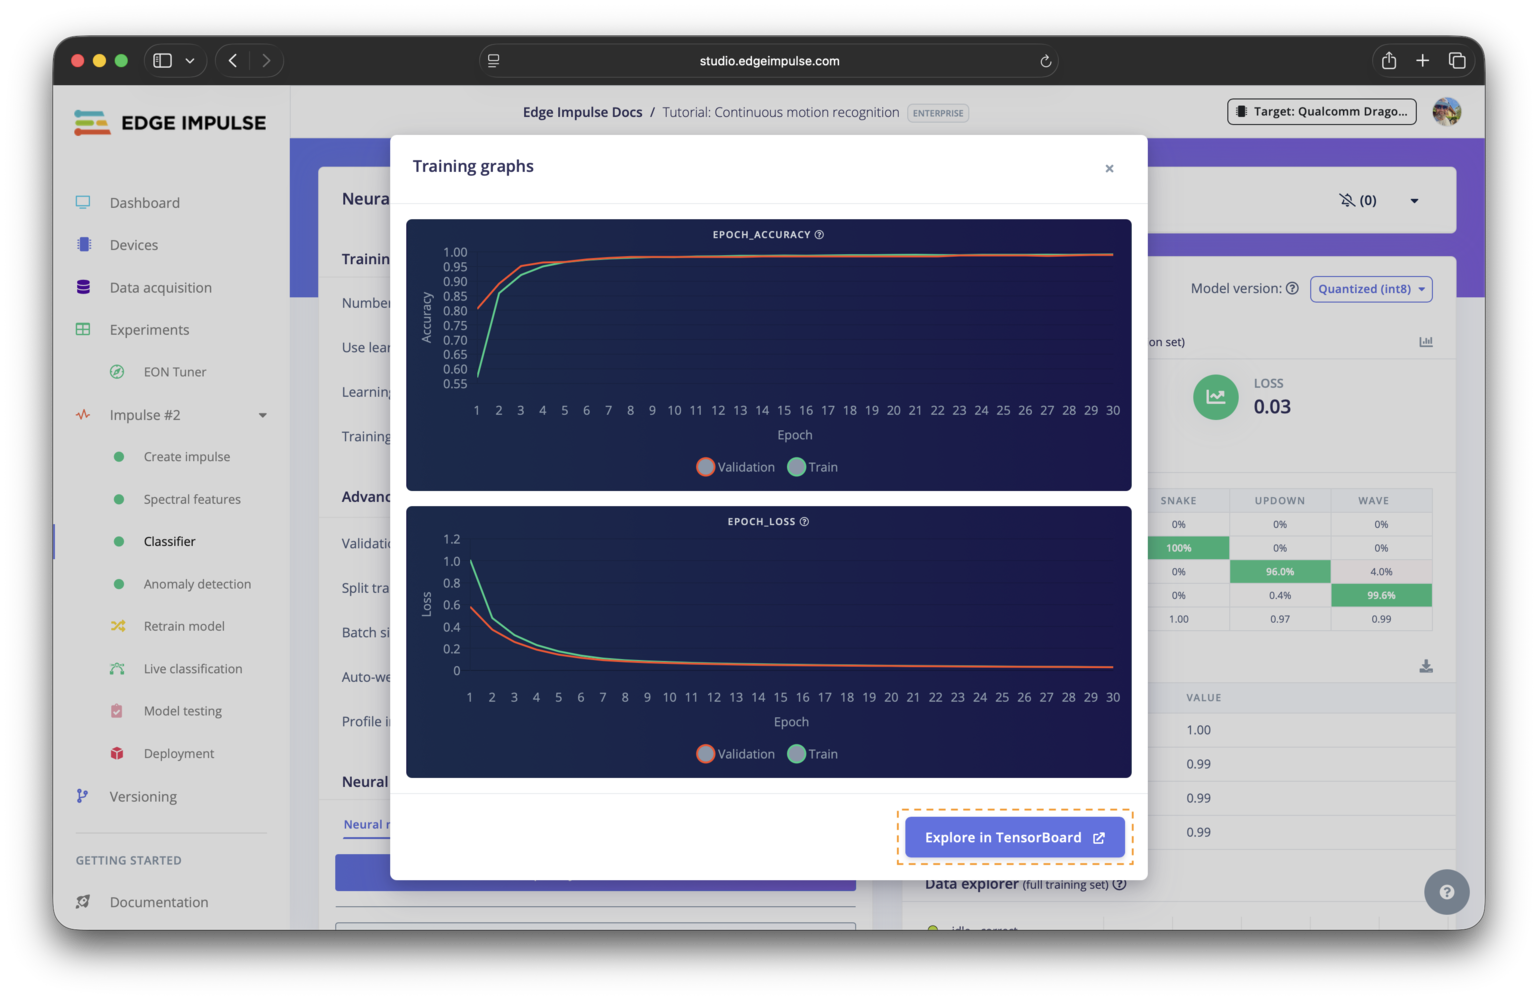
To access TensorBoard, navigate to the learning block page, open the training graphs modal as described above, and click on the `Explore in TensorBoard` button at the bottom of the modal. This will launch a TensorBoard instance in a new tab, where you can explore various metrics, histograms, and other visualizations related to the training of your model.
## Going deeper with TensorBoard
For a more detailed analysis of the model training process, you can use the TensorBoard integration. TensorBoard provides a suite of visualization tools to help you understand, debug, and optimize your model.
To access TensorBoard, navigate to the learning block page, open the training graphs modal as described above, and click on the `Explore in TensorBoard` button at the bottom of the modal. This will launch a TensorBoard instance in a new tab, where you can explore various metrics, histograms, and other visualizations related to the training of your model.
 ### Viewing live visualizations
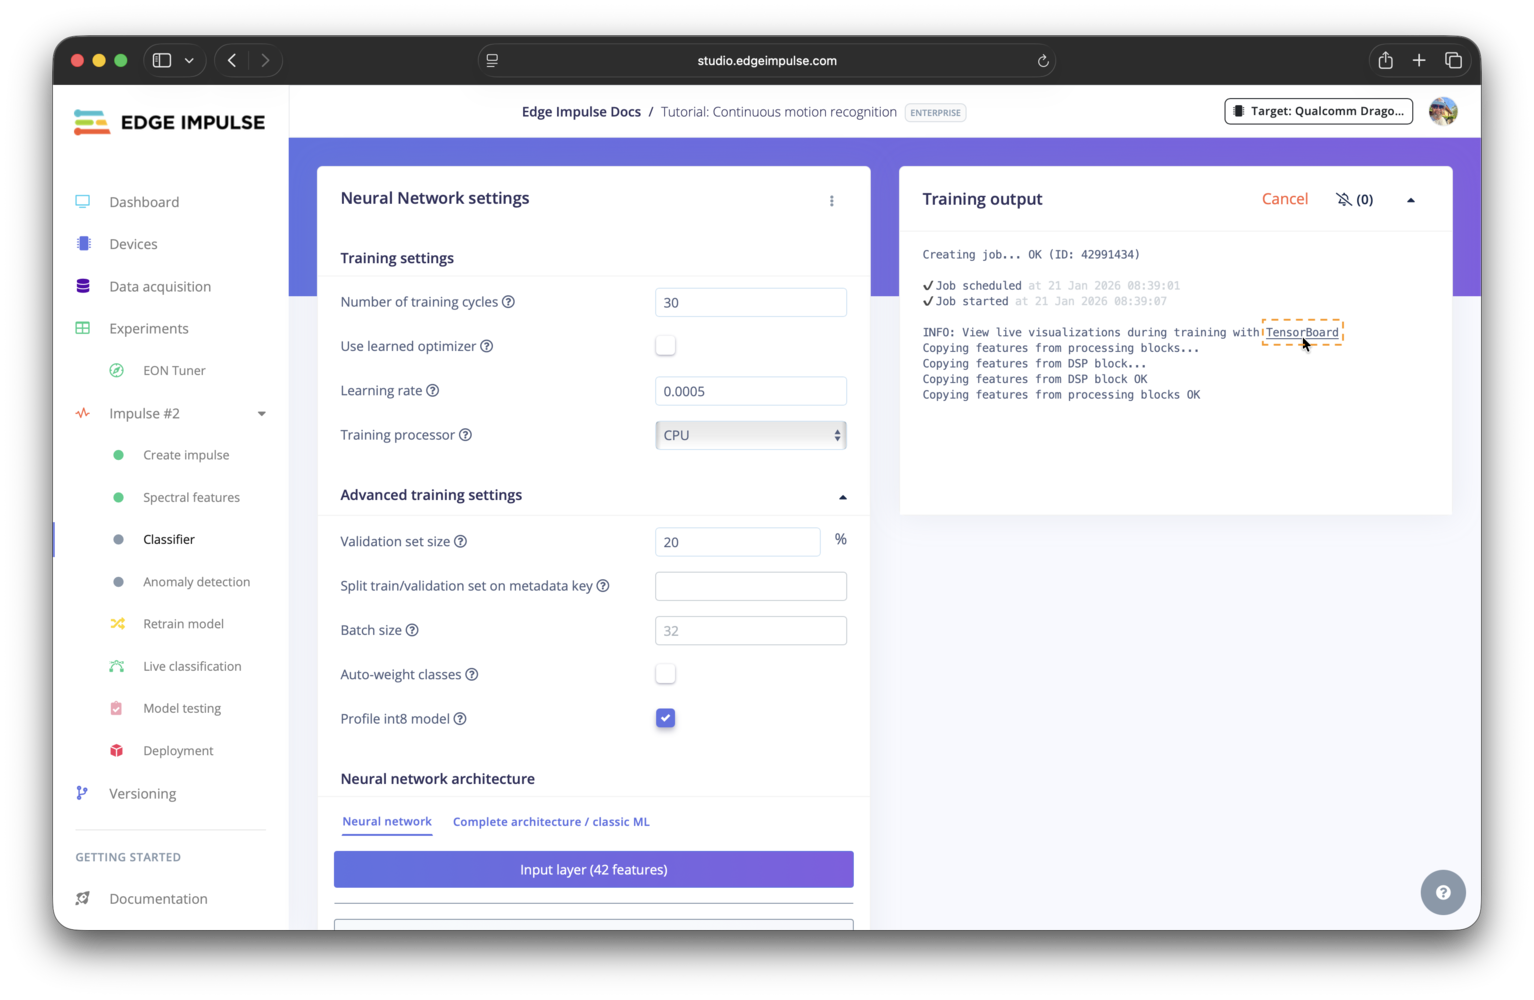
Rather than waiting until your model has been fully trained, you can view live visualizations of metrics by accessing TensorBoard during the training process. To do so, click the TensorBoard live visualizations link found at the top of the training log output.
### Viewing live visualizations
Rather than waiting until your model has been fully trained, you can view live visualizations of metrics by accessing TensorBoard during the training process. To do so, click the TensorBoard live visualizations link found at the top of the training log output.
 ### Exporting TensorBoard logs
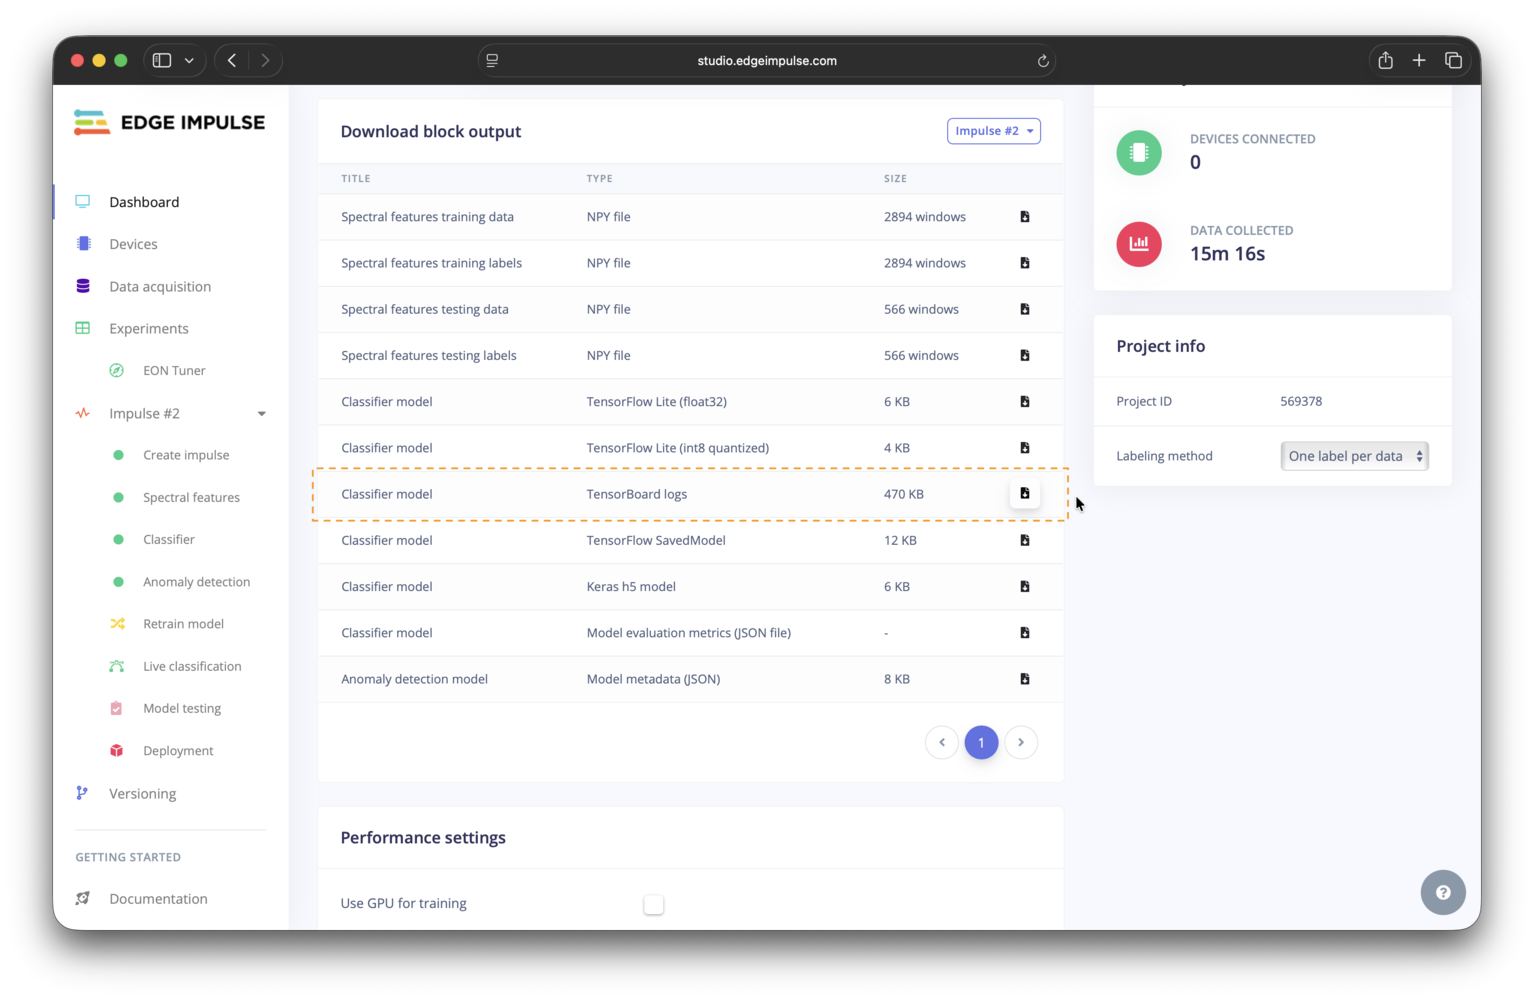
You can export the TensorBoard logs for your learning block to analyze them locally or share them with others. The logs can be downloaded from your project dashboard, under the download block output section.
### Exporting TensorBoard logs
You can export the TensorBoard logs for your learning block to analyze them locally or share them with others. The logs can be downloaded from your project dashboard, under the download block output section.
 ## Adding custom training graphs
**Only scalar graphs appear in training graphs modal**
Any graphs written to the TensorBoard log directory should appear within the TensorBoard instance. However, only the scalar graphs written to that directory are shown in the training graphs modal within Studio.
If you are developing a custom learning block and only want to generate basic graphs, such as the ones shown in the training graphs modal and TensorBoard instance for the built-in learning blocks, you can simply add the TensorBoard callback shown below to your custom learning block code.
```python theme={"system"}
callbacks = [
tf.keras.callbacks.TensorBoard(log_dir="/home/tensorboard_logs")
]
model.fit(train_dataset, epochs=EPOCHS, validation_data=validation_dataset, verbose=2, callbacks=callbacks)
```
You are also able to add custom training graphs to visualize additional metrics during the training process by writing graphs to the TensorBoard logs directory: `/home/tensorboard_logs`.
This can be done by modifying built-in learning blocks that support expert mode or within your custom learning blocks. In either case, you will need to add a code snippet to use the [TensorFlow summary file writer](https://www.tensorflow.org/api_docs/python/tf/summary/create_file_writer) API endpoint. An example is provided below.
```python theme={"system"}
tensorboard_log_dir = os.path.join("/", "home", 'tensorboard_logs', "training")
os.makedirs(tensorboard_log_dir, exist_ok=True)
train_summary_writer = tf.compat.v2.summary.create_file_writer(tensorboard_log_dir)
train_metrics = #... a dictionary of metrics and values
with train_summary_writer.as_default():
for metric in train_metrics:
metric_data = train_metrics[metric]
for ix in range(0, len(metric_data)):
tf.compat.v2.summary.scalar(metric, metric_data[ix], step=ix)
```
## Troubleshooting
No common issues have been identified thus far. If you encounter an issue, please reach out on the [forum](https://forum.edgeimpulse.com) or, if you are on the Enterprise plan, through your support channels.
## Additional resources
* [Learning blocks](/studio/projects/learning-blocks)
* [Expert mode](/studio/projects/learning-blocks/expert-mode)
* [Custom learning blocks](/studio/organizations/custom-blocks/custom-learning-blocks)
* [TensorBoard](https://www.tensorflow.org/tensorboard)
## Adding custom training graphs
**Only scalar graphs appear in training graphs modal**
Any graphs written to the TensorBoard log directory should appear within the TensorBoard instance. However, only the scalar graphs written to that directory are shown in the training graphs modal within Studio.
If you are developing a custom learning block and only want to generate basic graphs, such as the ones shown in the training graphs modal and TensorBoard instance for the built-in learning blocks, you can simply add the TensorBoard callback shown below to your custom learning block code.
```python theme={"system"}
callbacks = [
tf.keras.callbacks.TensorBoard(log_dir="/home/tensorboard_logs")
]
model.fit(train_dataset, epochs=EPOCHS, validation_data=validation_dataset, verbose=2, callbacks=callbacks)
```
You are also able to add custom training graphs to visualize additional metrics during the training process by writing graphs to the TensorBoard logs directory: `/home/tensorboard_logs`.
This can be done by modifying built-in learning blocks that support expert mode or within your custom learning blocks. In either case, you will need to add a code snippet to use the [TensorFlow summary file writer](https://www.tensorflow.org/api_docs/python/tf/summary/create_file_writer) API endpoint. An example is provided below.
```python theme={"system"}
tensorboard_log_dir = os.path.join("/", "home", 'tensorboard_logs', "training")
os.makedirs(tensorboard_log_dir, exist_ok=True)
train_summary_writer = tf.compat.v2.summary.create_file_writer(tensorboard_log_dir)
train_metrics = #... a dictionary of metrics and values
with train_summary_writer.as_default():
for metric in train_metrics:
metric_data = train_metrics[metric]
for ix in range(0, len(metric_data)):
tf.compat.v2.summary.scalar(metric, metric_data[ix], step=ix)
```
## Troubleshooting
No common issues have been identified thus far. If you encounter an issue, please reach out on the [forum](https://forum.edgeimpulse.com) or, if you are on the Enterprise plan, through your support channels.
## Additional resources
* [Learning blocks](/studio/projects/learning-blocks)
* [Expert mode](/studio/projects/learning-blocks/expert-mode)
* [Custom learning blocks](/studio/organizations/custom-blocks/custom-learning-blocks)
* [TensorBoard](https://www.tensorflow.org/tensorboard)