> ## Documentation Index
> Fetch the complete documentation index at: https://docs.edgeimpulse.com/llms.txt
> Use this file to discover all available pages before exploring further.
# Data campaigns
**Only available on the Enterprise plan**
This feature is only available on the Enterprise plan. Review our [plans and pricing](https://edgeimpulse.com/pricing) or sign up for our free [expert-led trial](https://edgeimpulse.com/expert-led-trial) today.
The "data campaigns" feature allows you to quickly track your experiments and your models' development progresses. It is an overview of your pipelines where you can easily extract useful information from your datasets and correlate those metrics with your model performances.
It has been primarily designed to follow clinical research data processes. In August 2023, we released this feature for every enterprise user as we see value in being able to track metrics between your datasets and your projects.
 ## Setting up your dashboard
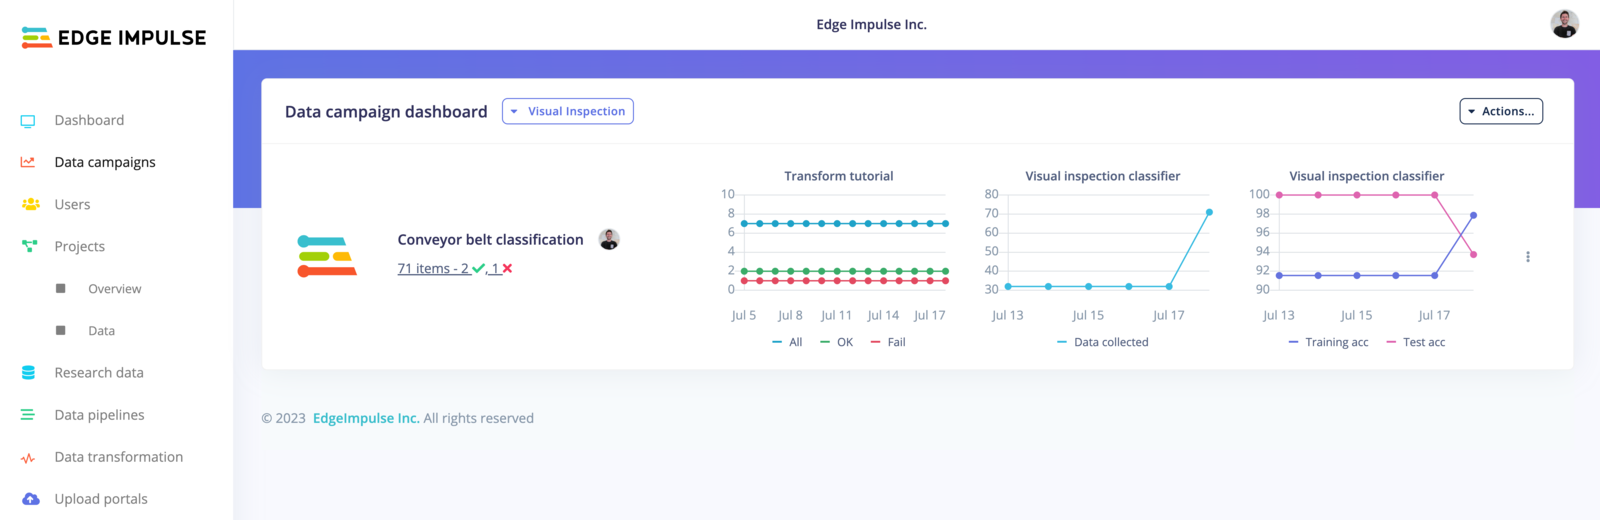
To get started, navigate to the **Data campaigns** tab in your organization:
## Setting up your dashboard
To get started, navigate to the **Data campaigns** tab in your organization:
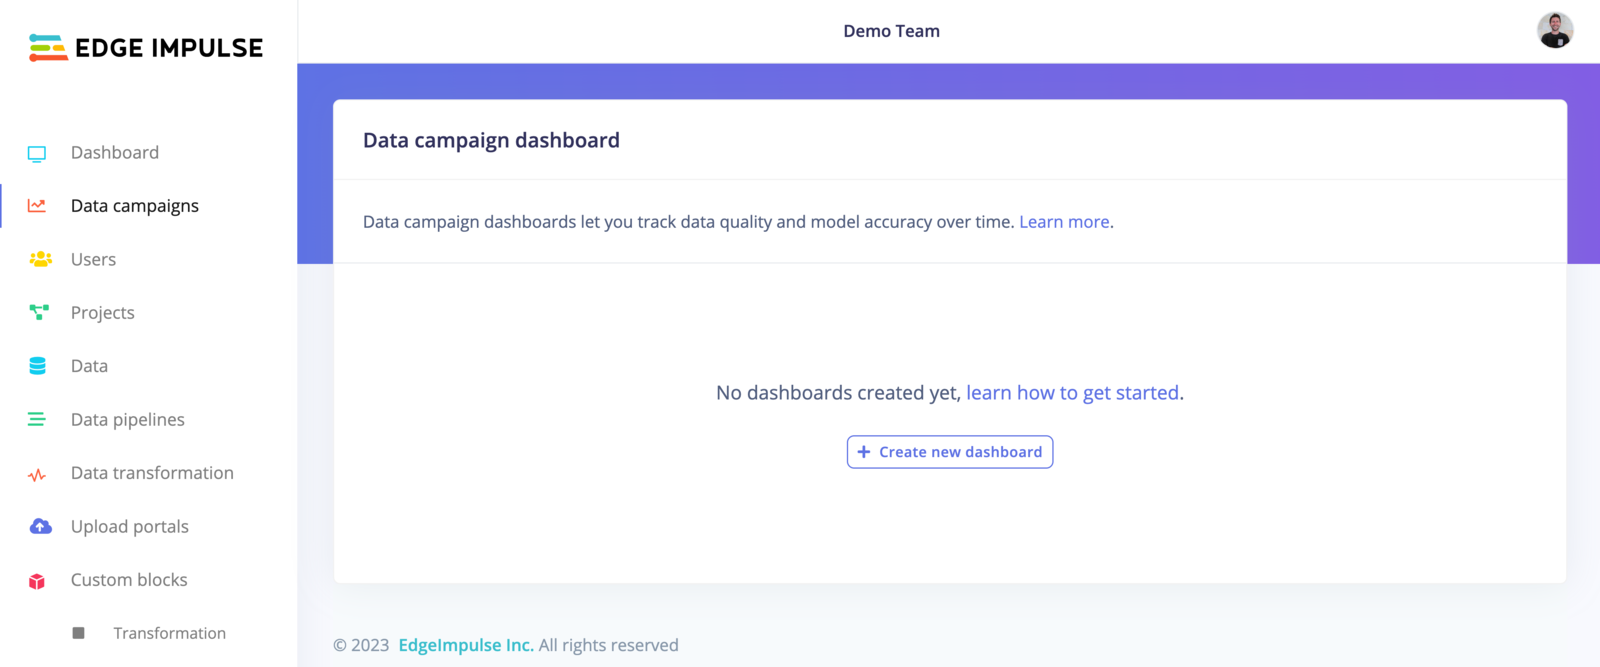 Click on **+ Create new dashboard**.
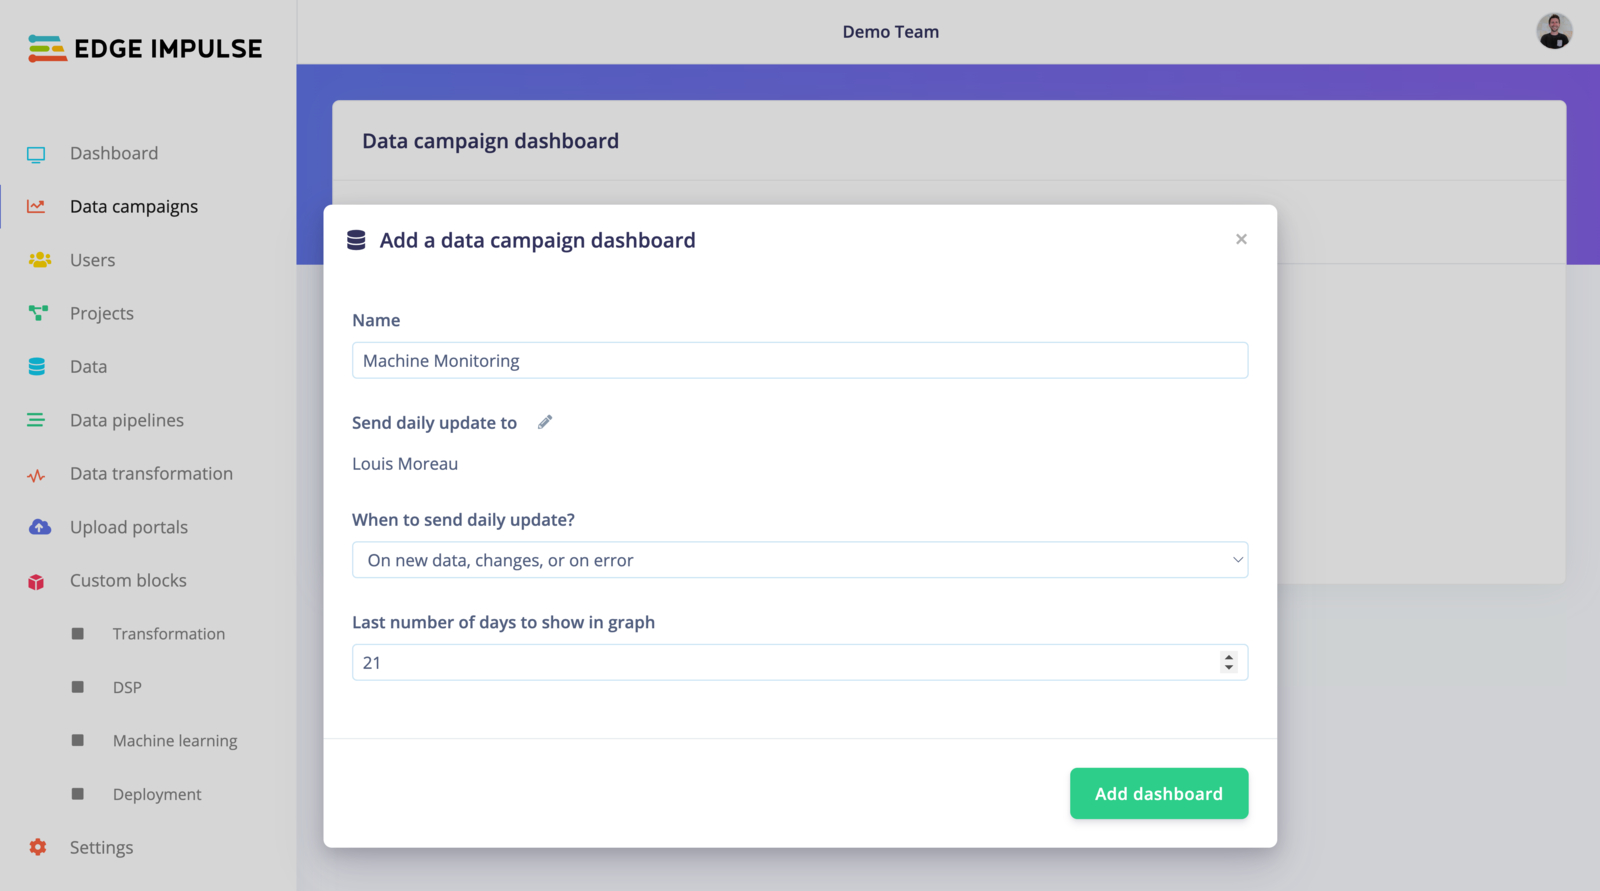
Give your dashboard a name, and select one or more collaborators to receive the daily updates by email. If you don't want to be spammed, you can select when you want to receive these updates, either *Always*, *On new data, changes or on error*, or *Never*. Finally, set the last number of days shown in the graphs:
Click on **+ Create new dashboard**.
Give your dashboard a name, and select one or more collaborators to receive the daily updates by email. If you don't want to be spammed, you can select when you want to receive these updates, either *Always*, *On new data, changes or on error*, or *Never*. Finally, set the last number of days shown in the graphs:
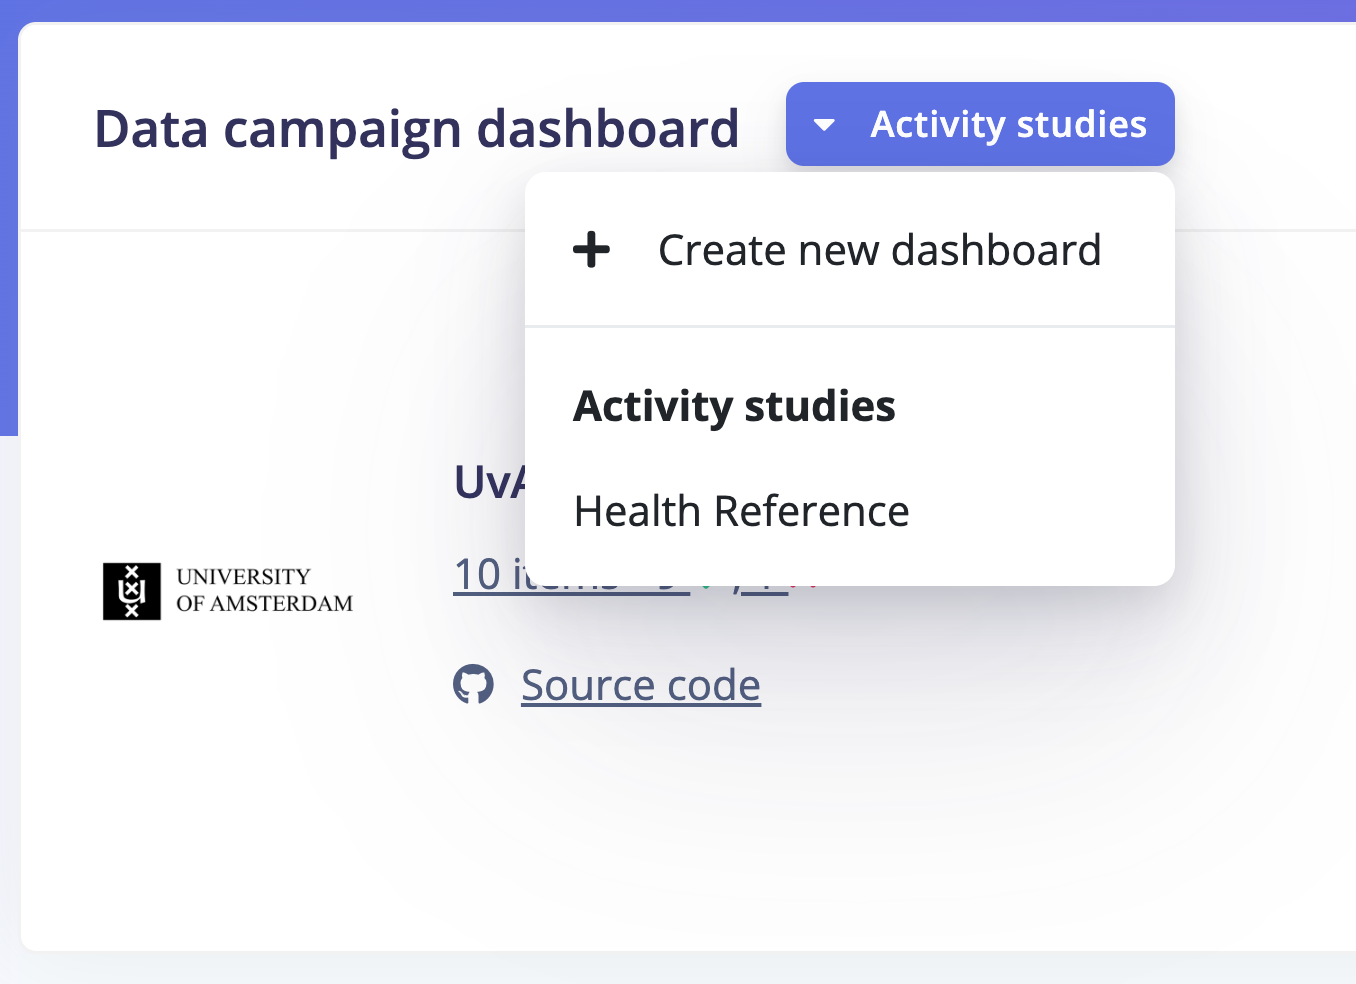
 You can create as many dashboards as needed, simply click on **+ Create a new dashboard** from the dropdown available under your current dashboard:
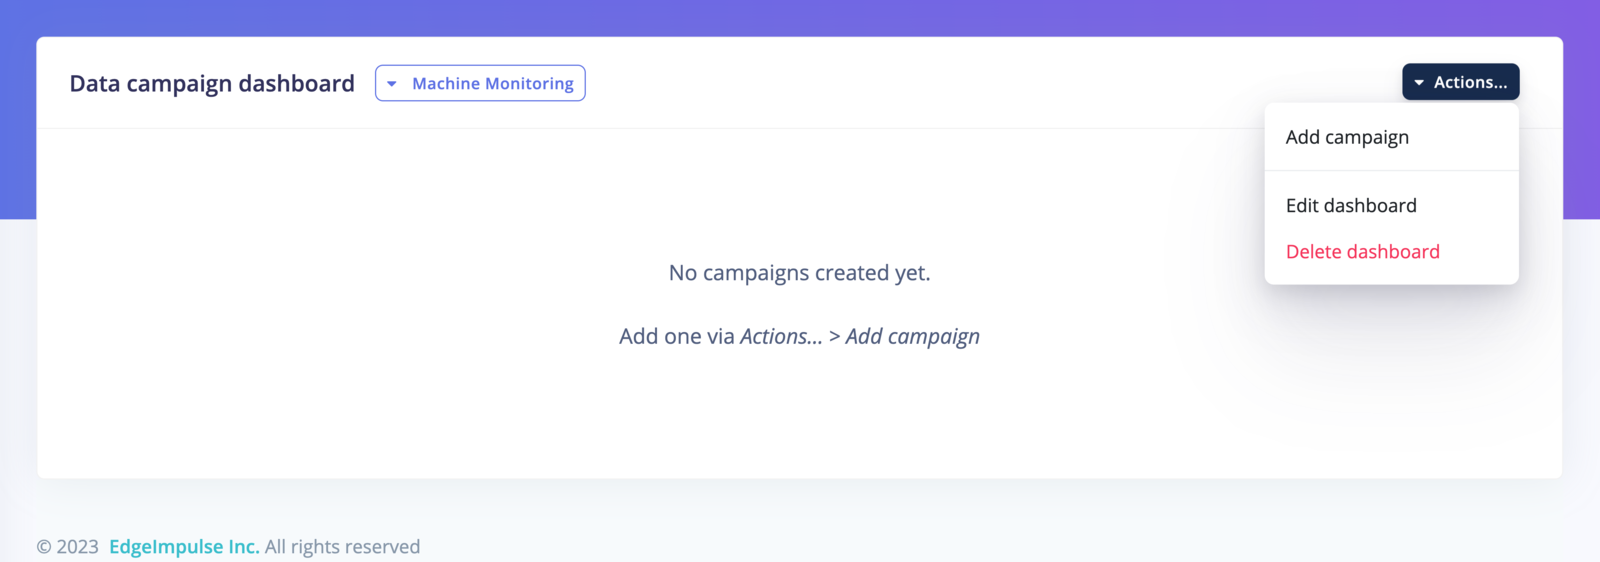
 If you want to delete a dashboard, Click on **Actions...** -> **Delete dashboard**
## Setting up your campaign
Once your dashboard is created, you can add your custom campaigns. It's where you will specify which metrics are important to you and your use case. Click on **Actions...** -> **Add campaign**
If you want to delete a dashboard, Click on **Actions...** -> **Delete dashboard**
## Setting up your campaign
Once your dashboard is created, you can add your custom campaigns. It's where you will specify which metrics are important to you and your use case. Click on **Actions...** -> **Add campaign**
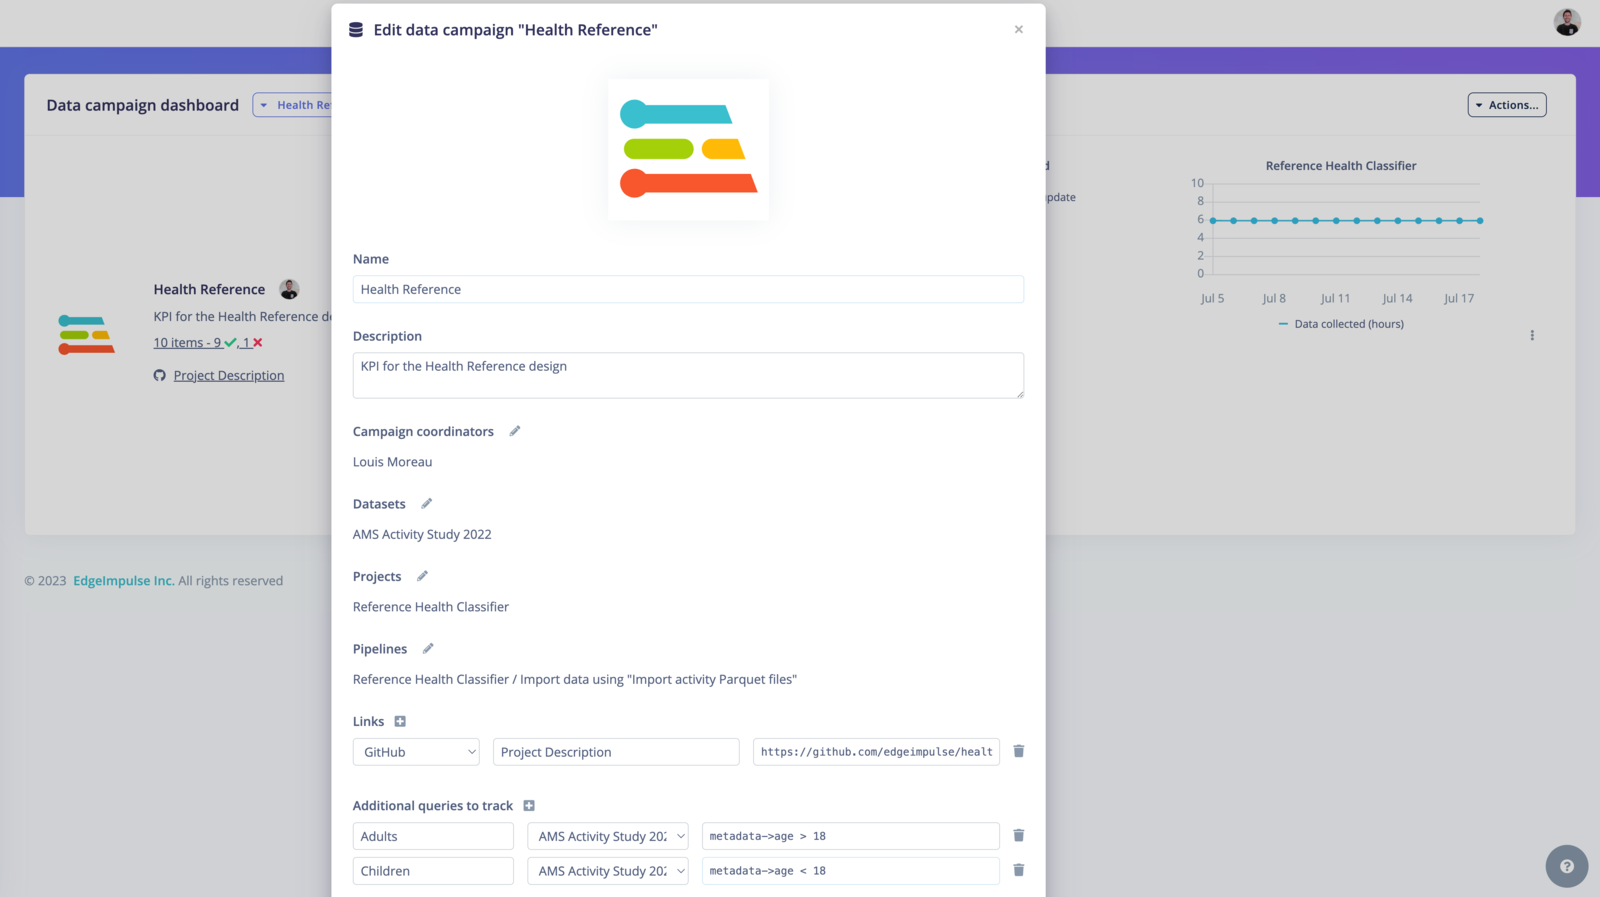
 Fill the form to create your campaign:
**Name**: Name of your data campaign.
**Description**: Description of your data campaign.
**Campaign coordinators**: Add the collaborators that are engaged with this campaign
**Datasets**: Select the datasets you want to visualize in your campaign. You can add several datasets.
**Projects**: Select the projects you want to visualize in your campaign.
You can add several projects.
**Pipelines**: Select the pipeline that is associated with your campaign.
*Note that this is for reference only, it is not displayed in your campaign*
**Links**: Select between the link type you need. Options are Github, Spreadsheet, Text Document, Code repository, List or Folder.
Add a name and the link. This place is useful for other collaborators to have all the needed information about your project, gathered in one place under your campaign.
**Addition queries to track**:
These queries are data filters that need to be written in the SQL WHERE format. See [Querying data](/knowledge/guides/reference-designs/health-reference-design/querying-clinical-data) for more information.
For example `metadata->`age >= 18\` will return the data samples from adult patients.
You can then save your data campaign and it will be added to your dashboard:
Fill the form to create your campaign:
**Name**: Name of your data campaign.
**Description**: Description of your data campaign.
**Campaign coordinators**: Add the collaborators that are engaged with this campaign
**Datasets**: Select the datasets you want to visualize in your campaign. You can add several datasets.
**Projects**: Select the projects you want to visualize in your campaign.
You can add several projects.
**Pipelines**: Select the pipeline that is associated with your campaign.
*Note that this is for reference only, it is not displayed in your campaign*
**Links**: Select between the link type you need. Options are Github, Spreadsheet, Text Document, Code repository, List or Folder.
Add a name and the link. This place is useful for other collaborators to have all the needed information about your project, gathered in one place under your campaign.
**Addition queries to track**:
These queries are data filters that need to be written in the SQL WHERE format. See [Querying data](/knowledge/guides/reference-designs/health-reference-design/querying-clinical-data) for more information.
For example `metadata->`age >= 18\` will return the data samples from adult patients.
You can then save your data campaign and it will be added to your dashboard:
 This dashboard shows the metrics' progress from the [Health reference design data](/knowledge/guides/reference-designs/health-reference-design)
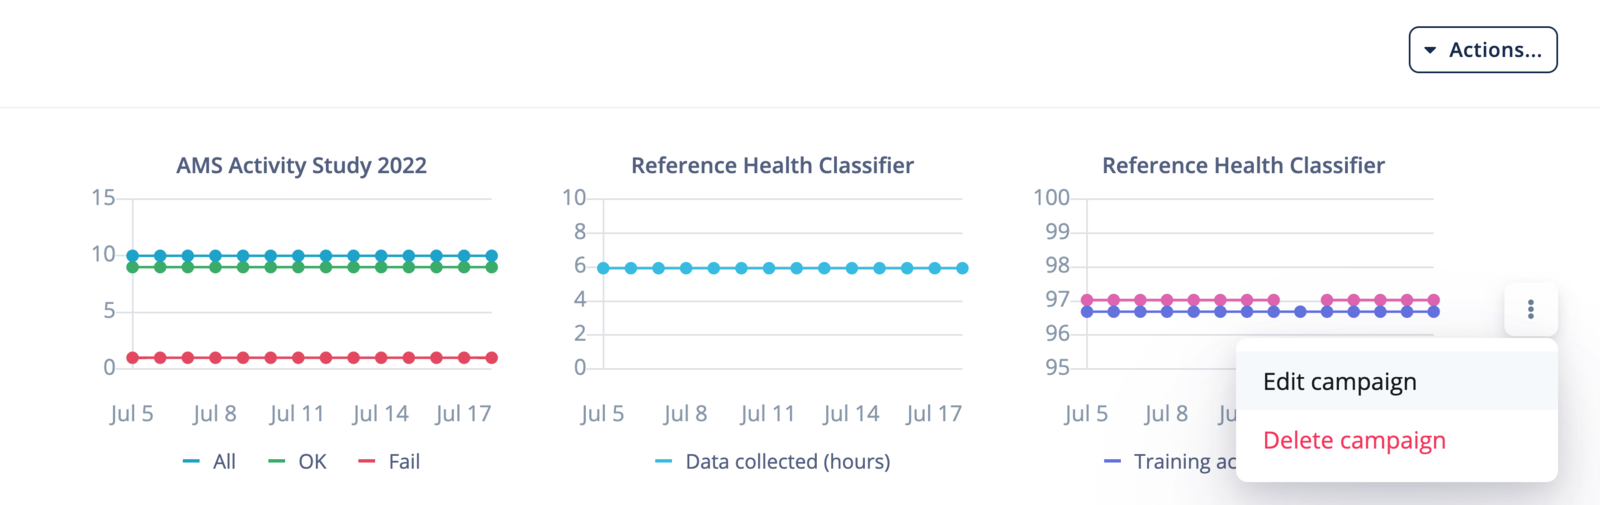
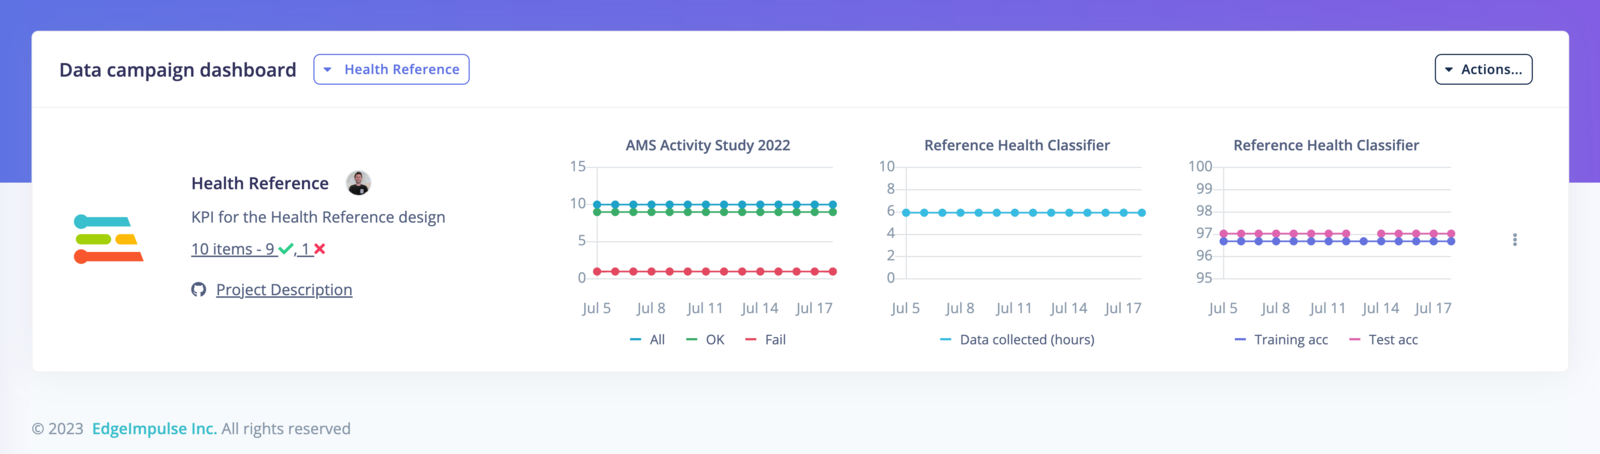 If you want to edit or delete your campaign, click on the "**⋮**" button on the right side of your campaign: