> ## Documentation Index
> Fetch the complete documentation index at: https://docs.edgeimpulse.com/llms.txt
> Use this file to discover all available pages before exploring further.
# AI-Assisted Air Quality Monitoring - DFRobot Firebeetle ESP32
Created By: Kutluhan Aktar
Public Project Link: [https://studio.edgeimpulse.com/public/159184/latest](https://studio.edgeimpulse.com/public/159184/latest)
 ## Description
Due to the ever-growing industrialization, forest degradation, and pollution, the delicate balance of ambient gases shifted. Thus, hazardous air pollutants impinge on the human respiratory system detrimentally, in addition to engendering climate change and poisoning wildlife. Even though governments realized that it was incumbent on them to act in order to prevent destructive air contaminants from pervading the ecosystem, we are too far away from obviating human-made air pollutants during the following decades. Therefore, it is still crucial to detect air pollutants to inform people with prescient warnings.
Since some air pollutants can react with each other and spread very rapidly, precedence must be given to detecting highly reactive gases (air contaminants), such as ozone (O3) and nitrogen compounds (NOx, NOy). Thus, in this project, I decided to focus on ozone (O3) and nitrogen dioxide (NO2) concentrations, which denote dangerous air pollution.
In ambient air, nitrogen oxides can occur from diverse combinations of oxygen and nitrogen. The higher combustion temperatures cause more nitric oxide reactions. In ambient conditions, nitric oxide is rapidly oxidized in air to form nitrogen dioxide by available oxidants, for instance, oxygen, ozone, and VOCs (volatile organic compounds). Hence, nitrogen dioxide (NO2) is widely known as a primary air pollutant (contaminant). Since road traffic is considered the principal outdoor source of nitrogen dioxide\[^1], densely populated areas are most susceptible to its detrimental effects. Nitrogen dioxide causes a range of harmful effects on the respiratory system, for example, increased inflammation of the airways, reduced lung function, increased asthma attacks, and cardiovascular harm\[^2].
Tropospheric, or ground-level ozone (O3), is formed by chemical reactions between oxides of nitrogen (NOx) and volatile organic compounds (VOCs). This chemical reaction is triggered by sunlight between the mentioned air pollutants emitted by cars, power plants, industrial boilers, refineries, and chemical plants\[^3]. Depending on the level of exposure, ground-level ozone (O3) can have various effects on the respiratory system, for instance, coughing, sore throat, airway inflammation, increased frequency of asthma attacks, and increased lung infection risk. Some of these detrimental effects have been found even in healthy people, but symptoms can be more severe in people with lung diseases such as asthma\[^4].
## Description
Due to the ever-growing industrialization, forest degradation, and pollution, the delicate balance of ambient gases shifted. Thus, hazardous air pollutants impinge on the human respiratory system detrimentally, in addition to engendering climate change and poisoning wildlife. Even though governments realized that it was incumbent on them to act in order to prevent destructive air contaminants from pervading the ecosystem, we are too far away from obviating human-made air pollutants during the following decades. Therefore, it is still crucial to detect air pollutants to inform people with prescient warnings.
Since some air pollutants can react with each other and spread very rapidly, precedence must be given to detecting highly reactive gases (air contaminants), such as ozone (O3) and nitrogen compounds (NOx, NOy). Thus, in this project, I decided to focus on ozone (O3) and nitrogen dioxide (NO2) concentrations, which denote dangerous air pollution.
In ambient air, nitrogen oxides can occur from diverse combinations of oxygen and nitrogen. The higher combustion temperatures cause more nitric oxide reactions. In ambient conditions, nitric oxide is rapidly oxidized in air to form nitrogen dioxide by available oxidants, for instance, oxygen, ozone, and VOCs (volatile organic compounds). Hence, nitrogen dioxide (NO2) is widely known as a primary air pollutant (contaminant). Since road traffic is considered the principal outdoor source of nitrogen dioxide\[^1], densely populated areas are most susceptible to its detrimental effects. Nitrogen dioxide causes a range of harmful effects on the respiratory system, for example, increased inflammation of the airways, reduced lung function, increased asthma attacks, and cardiovascular harm\[^2].
Tropospheric, or ground-level ozone (O3), is formed by chemical reactions between oxides of nitrogen (NOx) and volatile organic compounds (VOCs). This chemical reaction is triggered by sunlight between the mentioned air pollutants emitted by cars, power plants, industrial boilers, refineries, and chemical plants\[^3]. Depending on the level of exposure, ground-level ozone (O3) can have various effects on the respiratory system, for instance, coughing, sore throat, airway inflammation, increased frequency of asthma attacks, and increased lung infection risk. Some of these detrimental effects have been found even in healthy people, but symptoms can be more severe in people with lung diseases such as asthma\[^4].
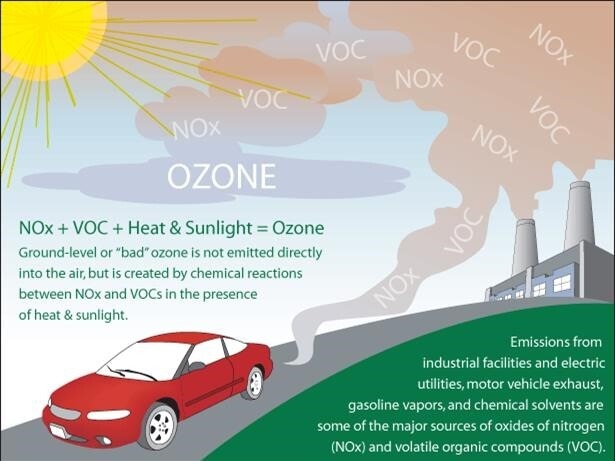 Since nitrogen dioxide (NO2), ozone (O3), and other photochemical oxidant reactions and transmission rates are inextricably related to air flow, heat, and ambient humidity, I decided to collect the following data parameters to create a meticulous data set:
* Nitrogen dioxide concentration (PPM)
* Ozone concentration (PPB)
* Temperature (°C)
* Humidity (%)
* Wind speed
After perusing recent research papers on ambient air pollution, I noticed there are very few appliances focusing on collecting air quality data, detecting air pollution levels with machine learning, and providing surveillance footage for further examination. Therefore, I decided to build a budget-friendly and easy-to-use air station to forecast air pollution levels with machine learning and inform the user of the model detection results with surveillance footage consecutively, in the hope of forfending the plight of hazardous gases.
To predict air pollution levels, I needed to collect precise ambient hazardous gas concentrations in order to train my neural network model with notable validity. Therefore, I decided to utilize DFRobot electrochemical gas sensors. To obtain the additional weather data, I employed an anemometer kit and a DHT22 sensor. Since FireBeetle ESP32 is a compact and powerful IoT-purposed development board providing numerous features with its budget-friendly media (camera) board, I decided to use FireBeetle ESP32 in combination with its media board so as to run my neural network model and inform the user of the model detection results with surveillance footage. Due to the memory allocation issues, I connected all sensors to Arduino Mega to collect and transmit air quality data to FireBeetle ESP32 via serial communication. Also, I connected three control buttons to Arduino Mega to send commands to FireBeetle ESP32 via serial communication.
Since the FireBeetle media board supports reading and writing information from/to files on an SD card, I stored the collected air quality data in separate CSV files on the SD card, named according to the selected air pollution class, to create a pre-formatted data set. In this regard, I was able to save and process data records via FireBeetle ESP32 without requiring any additional procedures.
After completing my data set, I built my artificial neural network model (ANN) with Edge Impulse to make predictions on air pollution levels (classes). Since Edge Impulse is nearly compatible with all microcontrollers and development boards, I had not encountered any issues while uploading and running my model on FireBeetle ESP32. As labels, I utilized the empirically assigned air pollution levels in accordance with the Air Quality Index (AQI) estimations provided by IQAir:
* Clean
* Risky
* Unhealthy
After training and testing my neural network model, I deployed and uploaded the model on FireBeetle ESP32 as an Arduino library. Therefore, the air station is capable of detecting air pollution levels by running the model independently without any additional procedures or latency.
Since I focused on building a full-fledged AIoT air station predicting air pollution and informing the user of the model detection results with surveillance footage, I decided to develop a web application from scratch to obtain the detection results with surveillance footage from FireBeetle ESP32 via HTTP POST requests, save the received information to a MySQL database table, and display the stored air quality data with model detection results in descending order simultaneously.
Due to the fact that the FireBeetle media board can only generate raw image data, this complementing web application executes a Python script to convert the obtained raw image data to a JPG file automatically before saving it to the server as surveillance footage. After saving the converted image successfully, the web application shows the most recently obtained surveillance footage consecutively and allows the user to inspect previous surveillance footage in descending order.
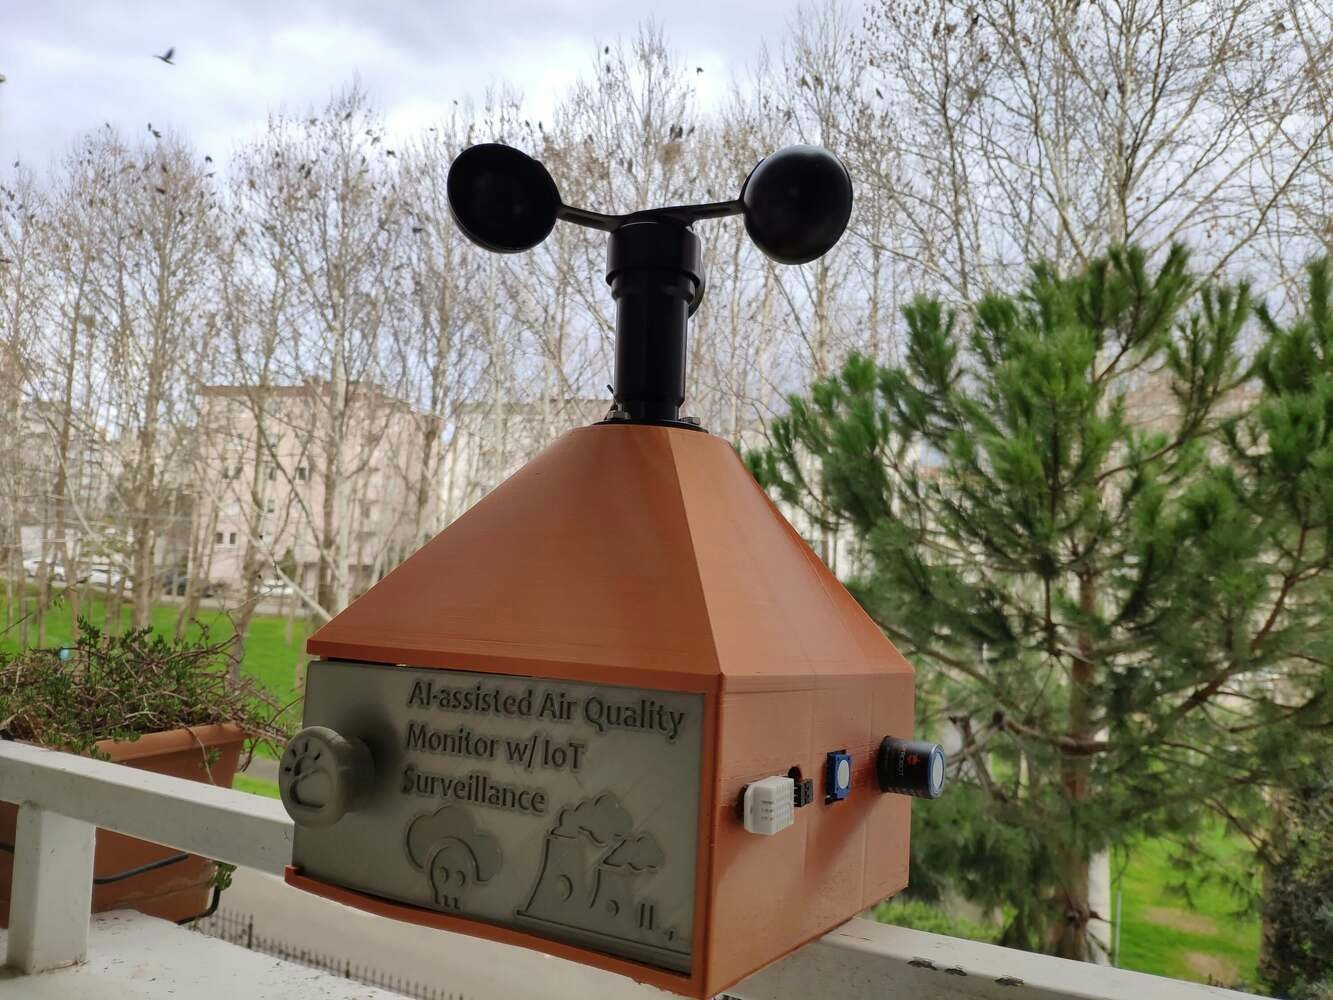
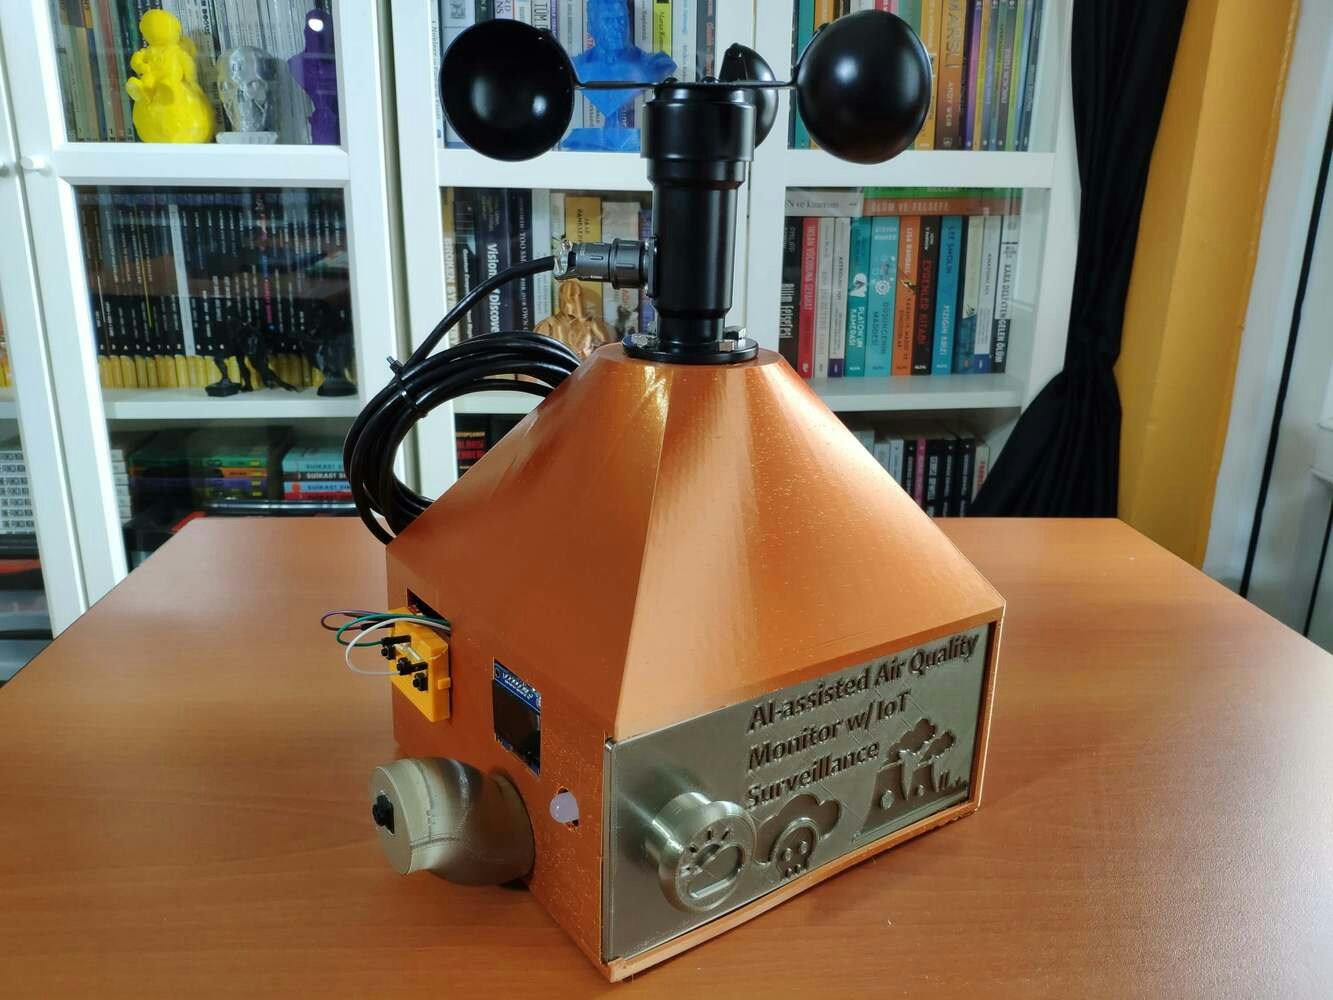
Lastly, to make the device as robust and compact as possible while operating outdoors, I designed a metallic air station case with a sliding front cover and a mountable camera holder (3D printable) for the OV7725 camera connected to the FireBeetle media board.
So, this is my project in a nutshell 😃
In the following steps, you can find more detailed information on coding, capturing surveillance footage, building a neural network model with Edge Impulse, running the model on FireBeetle ESP32, and developing a full-fledged web application to obtain the model detection results with surveillance footage from FireBeetle ESP32 via HTTP POST requests.
🎁🎨 Huge thanks to [DFRobot](https://www.dfrobot.com/?tracking=60f546f8002be) for sponsoring these products:
⭐ FireBeetle ESP32 | [Inspect](https://www.dfrobot.com/product-1590.html?tracking=60f546f8002be)
⭐ FireBeetle Covers - Camera\&Audio Media Board | [Inspect](https://www.dfrobot.com/product-1720.html?tracking=60f546f8002be)
⭐ Gravity: Electrochemical Nitrogen Dioxide Sensor | [Inspect](https://www.dfrobot.com/product-2515.html?tracking=60f546f8002be)
⭐ Gravity: Electrochemical Ozone Sensor | [Inspect](https://www.dfrobot.com/product-2005.html?tracking=60f546f8002be)
⭐ Anemometer Kit | [Inspect](https://www.dfrobot.com/product-1114.html?tracking=60f546f8002be)
⭐ LattePanda 3 Delta 864 | [Inspect](https://www.dfrobot.com/product-2594.html?tracking=60f546f8002be)
⭐ DFRobot 8.9" 1920x1200 IPS Touch Display | [Inspect](https://www.dfrobot.com/product-2007.html?tracking=60f546f8002be)
🎁🎨 Also, huge thanks to [Creality](https://store.creality.com/) for sending me a [Creality Sonic Pad](https://www.creality.com/products/creality-sonic-pad), a [Creality Sermoon V1 3D Printer](https://www.creality.com/products/creality-sermoon-v1-v1-pro-3d-printer), and a [Creality CR-200B 3D Printer](https://www.creality.com/products/cr-200b-3d-printer).
Since nitrogen dioxide (NO2), ozone (O3), and other photochemical oxidant reactions and transmission rates are inextricably related to air flow, heat, and ambient humidity, I decided to collect the following data parameters to create a meticulous data set:
* Nitrogen dioxide concentration (PPM)
* Ozone concentration (PPB)
* Temperature (°C)
* Humidity (%)
* Wind speed
After perusing recent research papers on ambient air pollution, I noticed there are very few appliances focusing on collecting air quality data, detecting air pollution levels with machine learning, and providing surveillance footage for further examination. Therefore, I decided to build a budget-friendly and easy-to-use air station to forecast air pollution levels with machine learning and inform the user of the model detection results with surveillance footage consecutively, in the hope of forfending the plight of hazardous gases.
To predict air pollution levels, I needed to collect precise ambient hazardous gas concentrations in order to train my neural network model with notable validity. Therefore, I decided to utilize DFRobot electrochemical gas sensors. To obtain the additional weather data, I employed an anemometer kit and a DHT22 sensor. Since FireBeetle ESP32 is a compact and powerful IoT-purposed development board providing numerous features with its budget-friendly media (camera) board, I decided to use FireBeetle ESP32 in combination with its media board so as to run my neural network model and inform the user of the model detection results with surveillance footage. Due to the memory allocation issues, I connected all sensors to Arduino Mega to collect and transmit air quality data to FireBeetle ESP32 via serial communication. Also, I connected three control buttons to Arduino Mega to send commands to FireBeetle ESP32 via serial communication.
Since the FireBeetle media board supports reading and writing information from/to files on an SD card, I stored the collected air quality data in separate CSV files on the SD card, named according to the selected air pollution class, to create a pre-formatted data set. In this regard, I was able to save and process data records via FireBeetle ESP32 without requiring any additional procedures.
After completing my data set, I built my artificial neural network model (ANN) with Edge Impulse to make predictions on air pollution levels (classes). Since Edge Impulse is nearly compatible with all microcontrollers and development boards, I had not encountered any issues while uploading and running my model on FireBeetle ESP32. As labels, I utilized the empirically assigned air pollution levels in accordance with the Air Quality Index (AQI) estimations provided by IQAir:
* Clean
* Risky
* Unhealthy
After training and testing my neural network model, I deployed and uploaded the model on FireBeetle ESP32 as an Arduino library. Therefore, the air station is capable of detecting air pollution levels by running the model independently without any additional procedures or latency.
Since I focused on building a full-fledged AIoT air station predicting air pollution and informing the user of the model detection results with surveillance footage, I decided to develop a web application from scratch to obtain the detection results with surveillance footage from FireBeetle ESP32 via HTTP POST requests, save the received information to a MySQL database table, and display the stored air quality data with model detection results in descending order simultaneously.
Due to the fact that the FireBeetle media board can only generate raw image data, this complementing web application executes a Python script to convert the obtained raw image data to a JPG file automatically before saving it to the server as surveillance footage. After saving the converted image successfully, the web application shows the most recently obtained surveillance footage consecutively and allows the user to inspect previous surveillance footage in descending order.
Lastly, to make the device as robust and compact as possible while operating outdoors, I designed a metallic air station case with a sliding front cover and a mountable camera holder (3D printable) for the OV7725 camera connected to the FireBeetle media board.
So, this is my project in a nutshell 😃
In the following steps, you can find more detailed information on coding, capturing surveillance footage, building a neural network model with Edge Impulse, running the model on FireBeetle ESP32, and developing a full-fledged web application to obtain the model detection results with surveillance footage from FireBeetle ESP32 via HTTP POST requests.
🎁🎨 Huge thanks to [DFRobot](https://www.dfrobot.com/?tracking=60f546f8002be) for sponsoring these products:
⭐ FireBeetle ESP32 | [Inspect](https://www.dfrobot.com/product-1590.html?tracking=60f546f8002be)
⭐ FireBeetle Covers - Camera\&Audio Media Board | [Inspect](https://www.dfrobot.com/product-1720.html?tracking=60f546f8002be)
⭐ Gravity: Electrochemical Nitrogen Dioxide Sensor | [Inspect](https://www.dfrobot.com/product-2515.html?tracking=60f546f8002be)
⭐ Gravity: Electrochemical Ozone Sensor | [Inspect](https://www.dfrobot.com/product-2005.html?tracking=60f546f8002be)
⭐ Anemometer Kit | [Inspect](https://www.dfrobot.com/product-1114.html?tracking=60f546f8002be)
⭐ LattePanda 3 Delta 864 | [Inspect](https://www.dfrobot.com/product-2594.html?tracking=60f546f8002be)
⭐ DFRobot 8.9" 1920x1200 IPS Touch Display | [Inspect](https://www.dfrobot.com/product-2007.html?tracking=60f546f8002be)
🎁🎨 Also, huge thanks to [Creality](https://store.creality.com/) for sending me a [Creality Sonic Pad](https://www.creality.com/products/creality-sonic-pad), a [Creality Sermoon V1 3D Printer](https://www.creality.com/products/creality-sermoon-v1-v1-pro-3d-printer), and a [Creality CR-200B 3D Printer](https://www.creality.com/products/cr-200b-3d-printer).


 ## Step 1: Designing and printing a metallic air station case
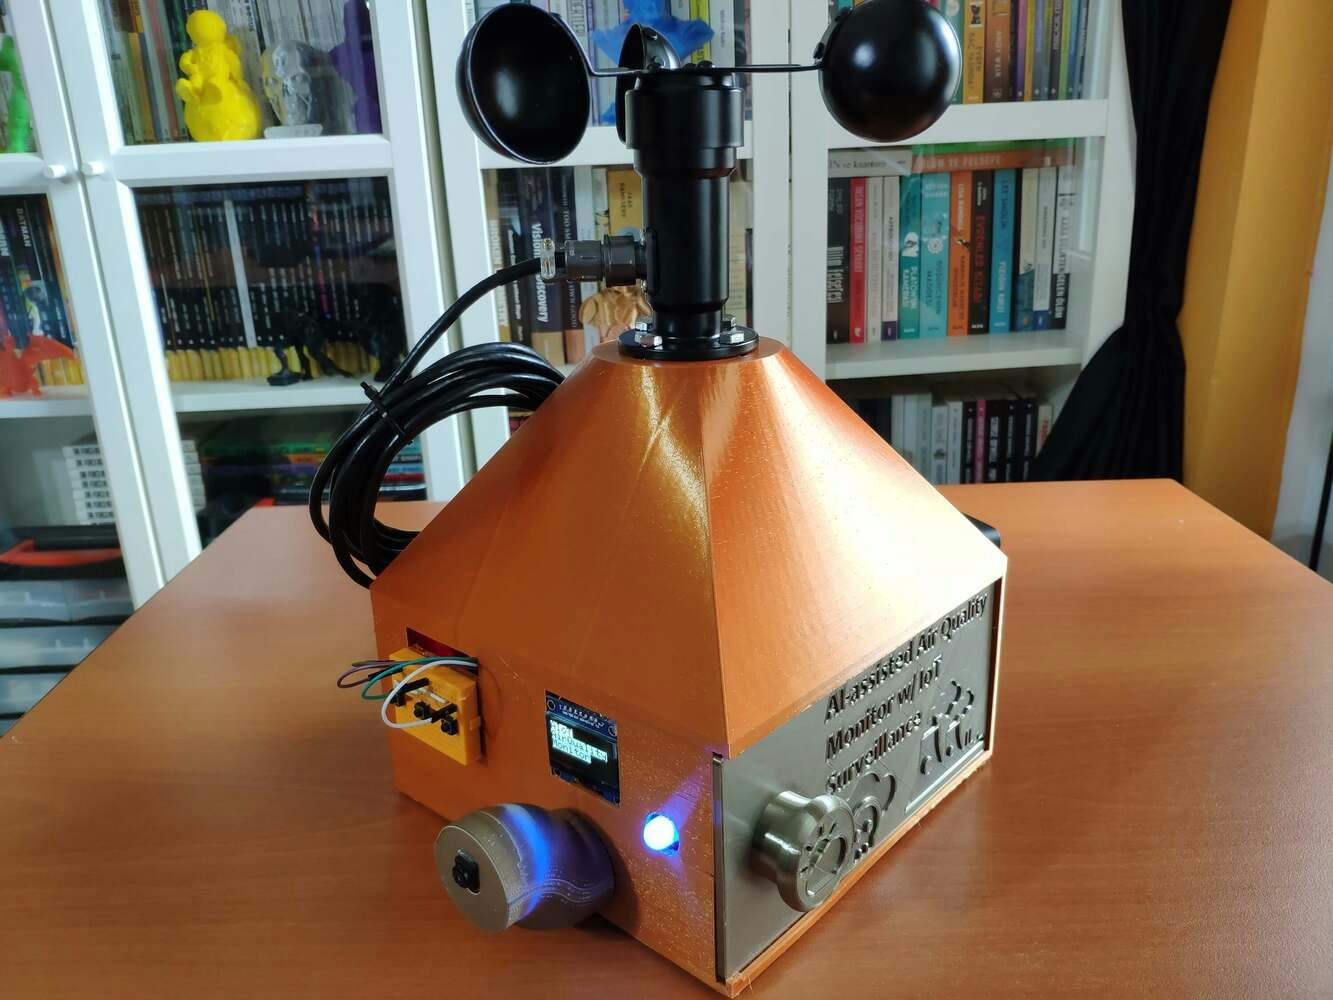
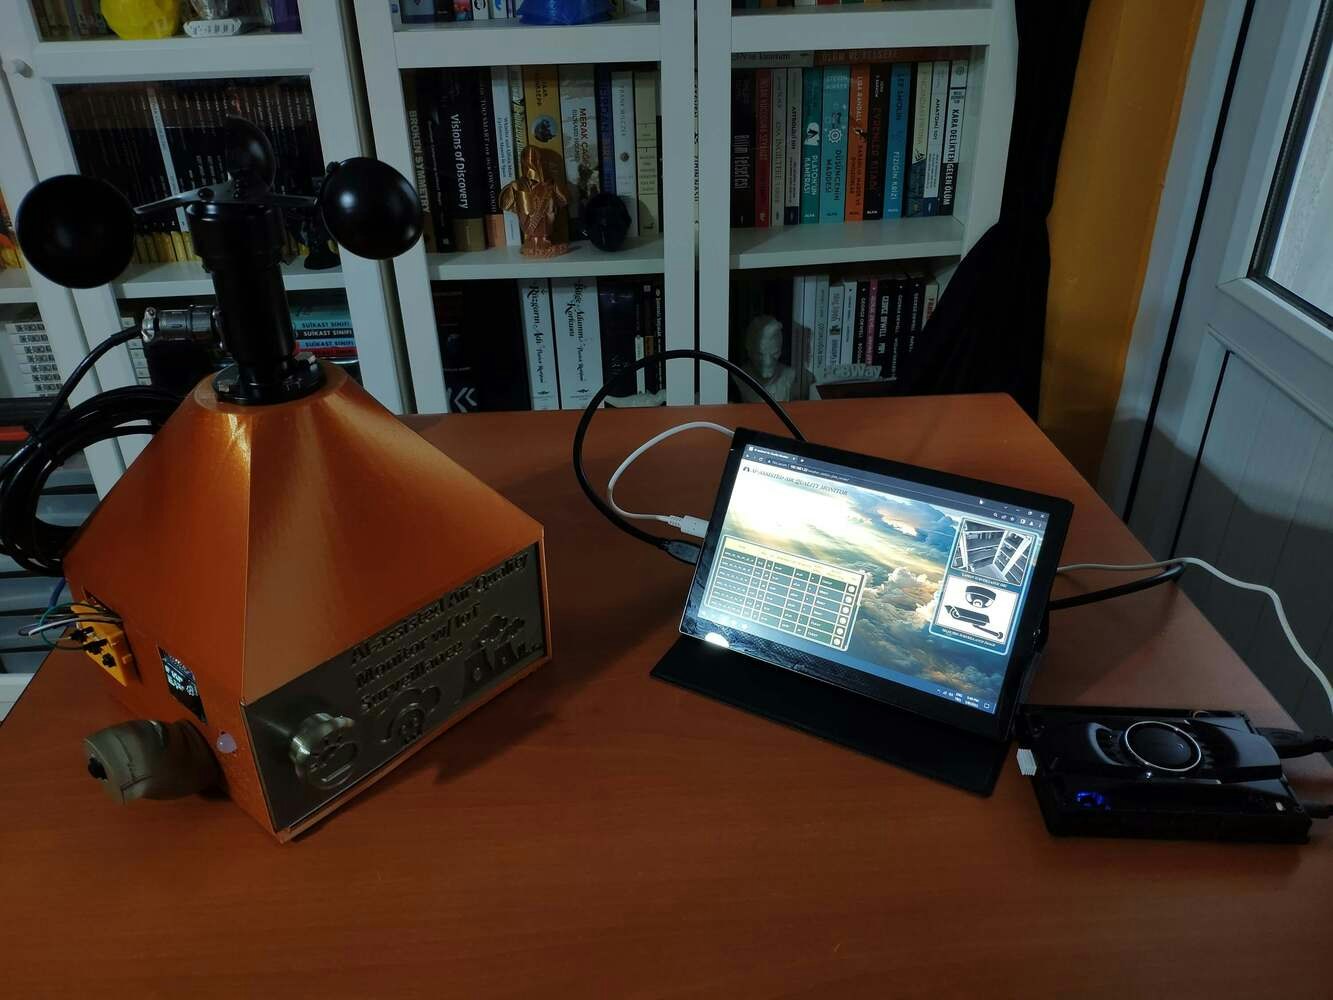
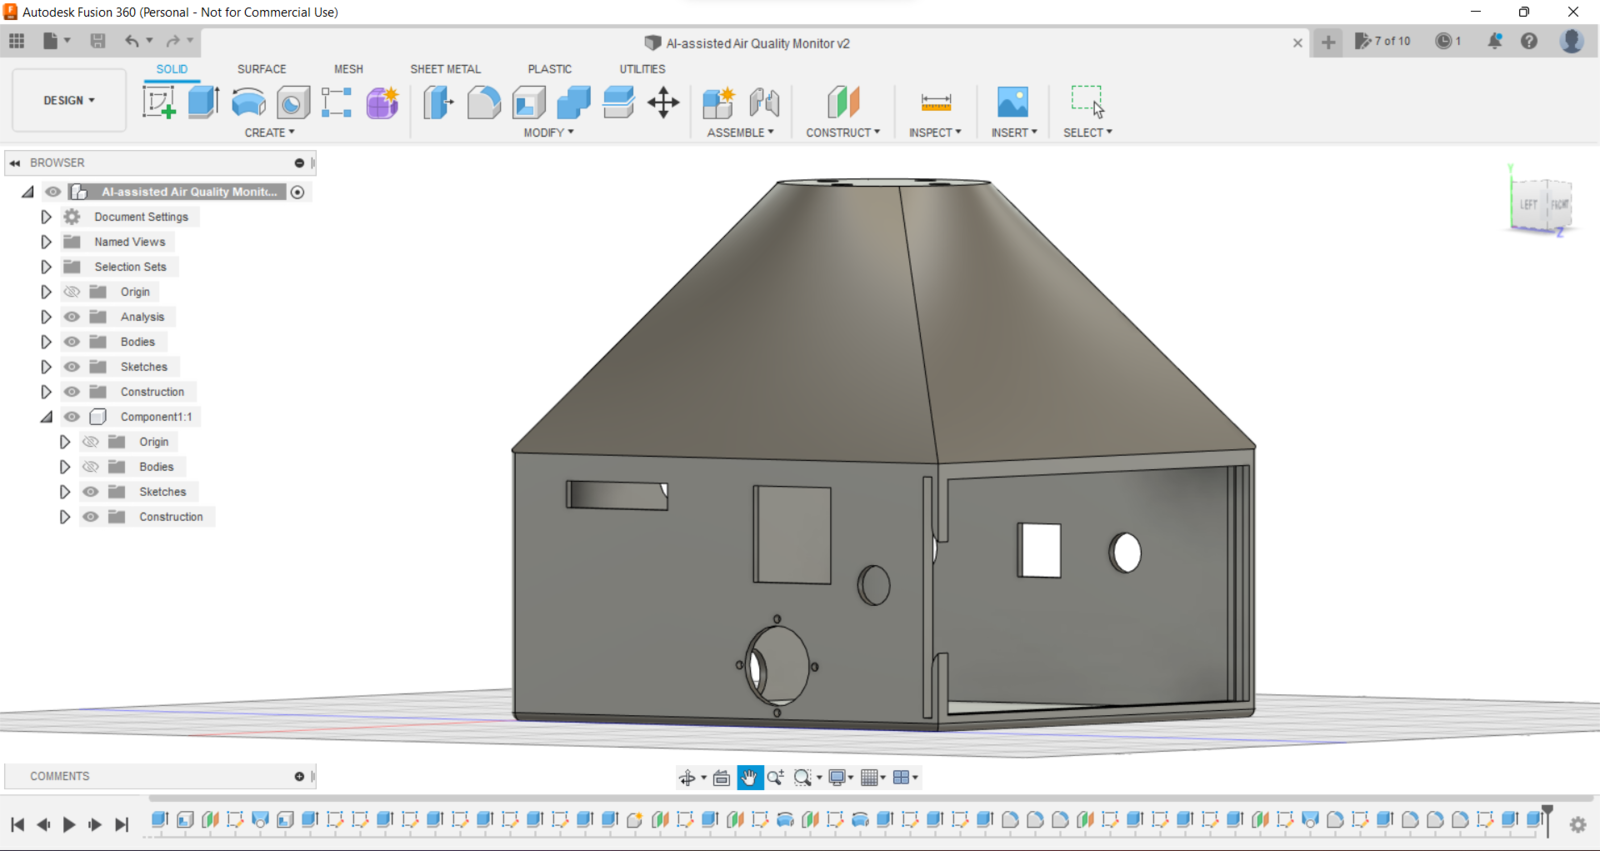
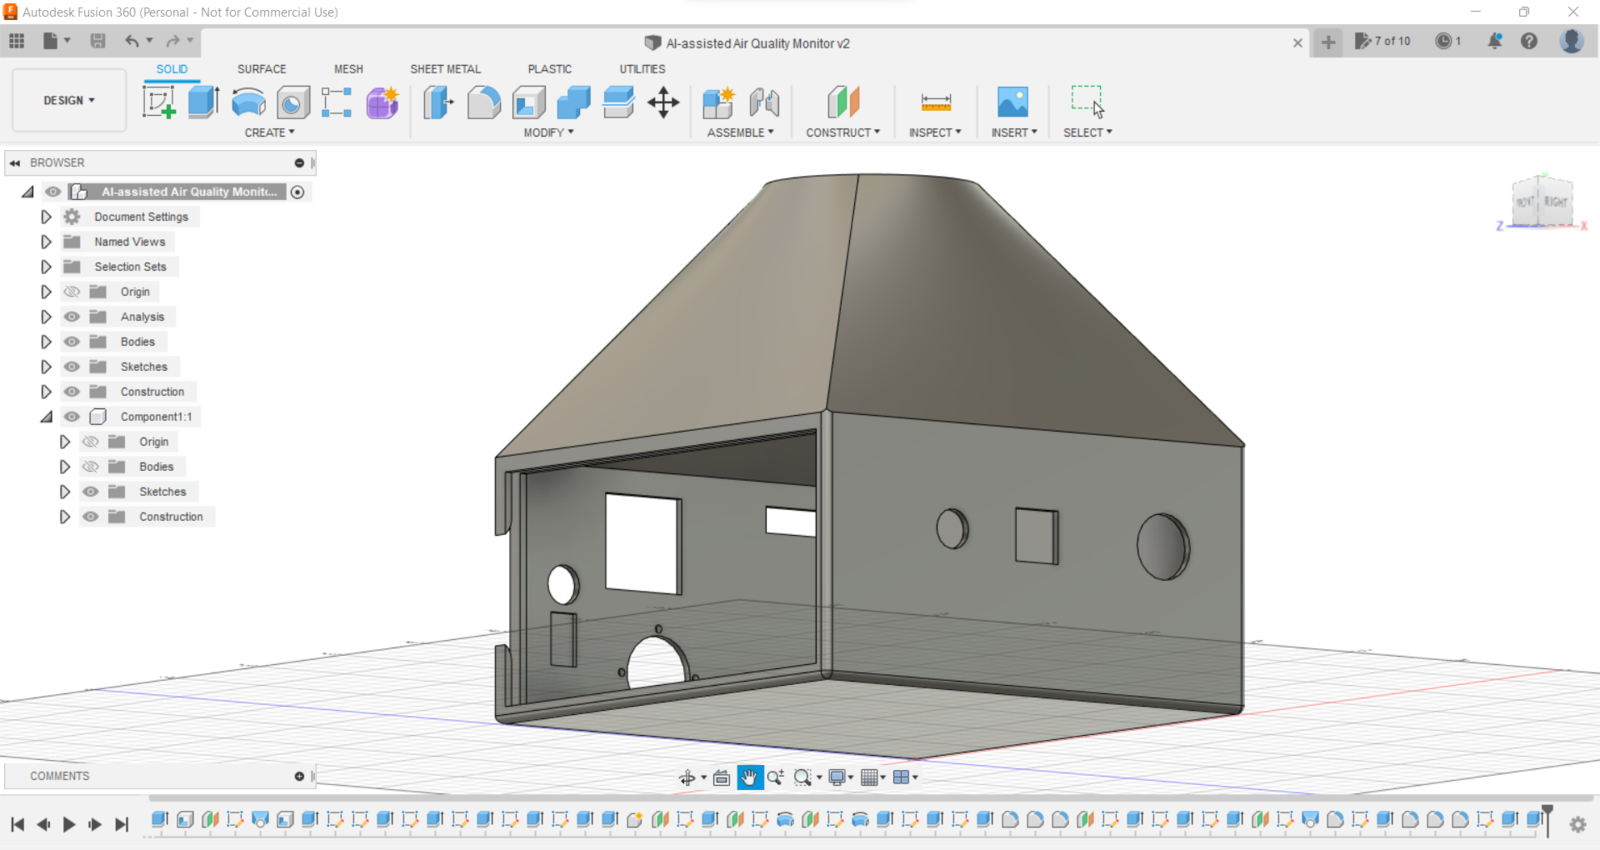
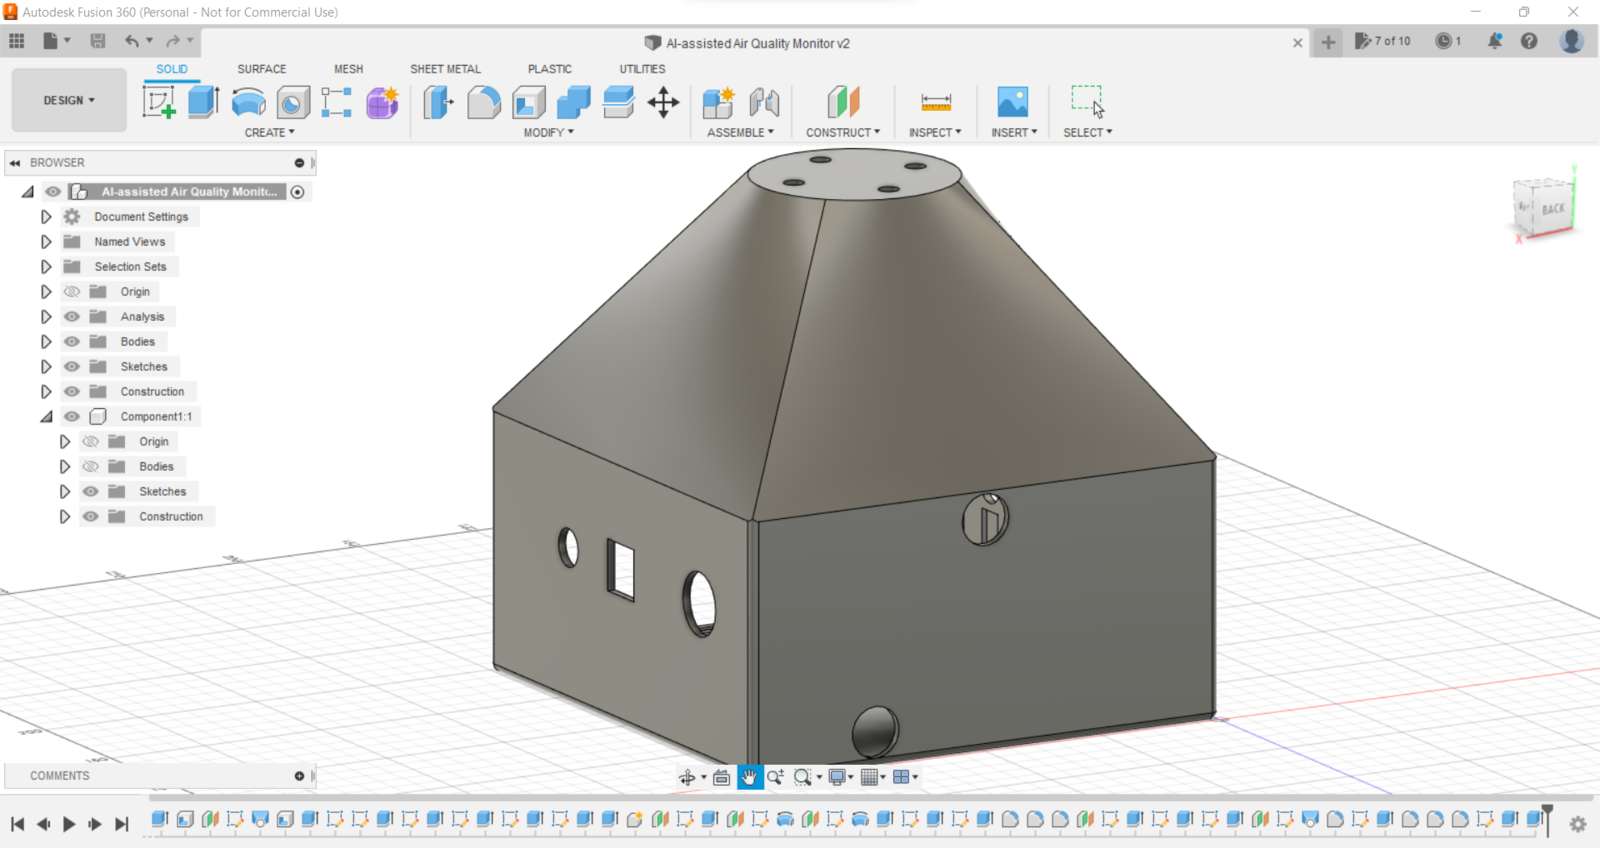
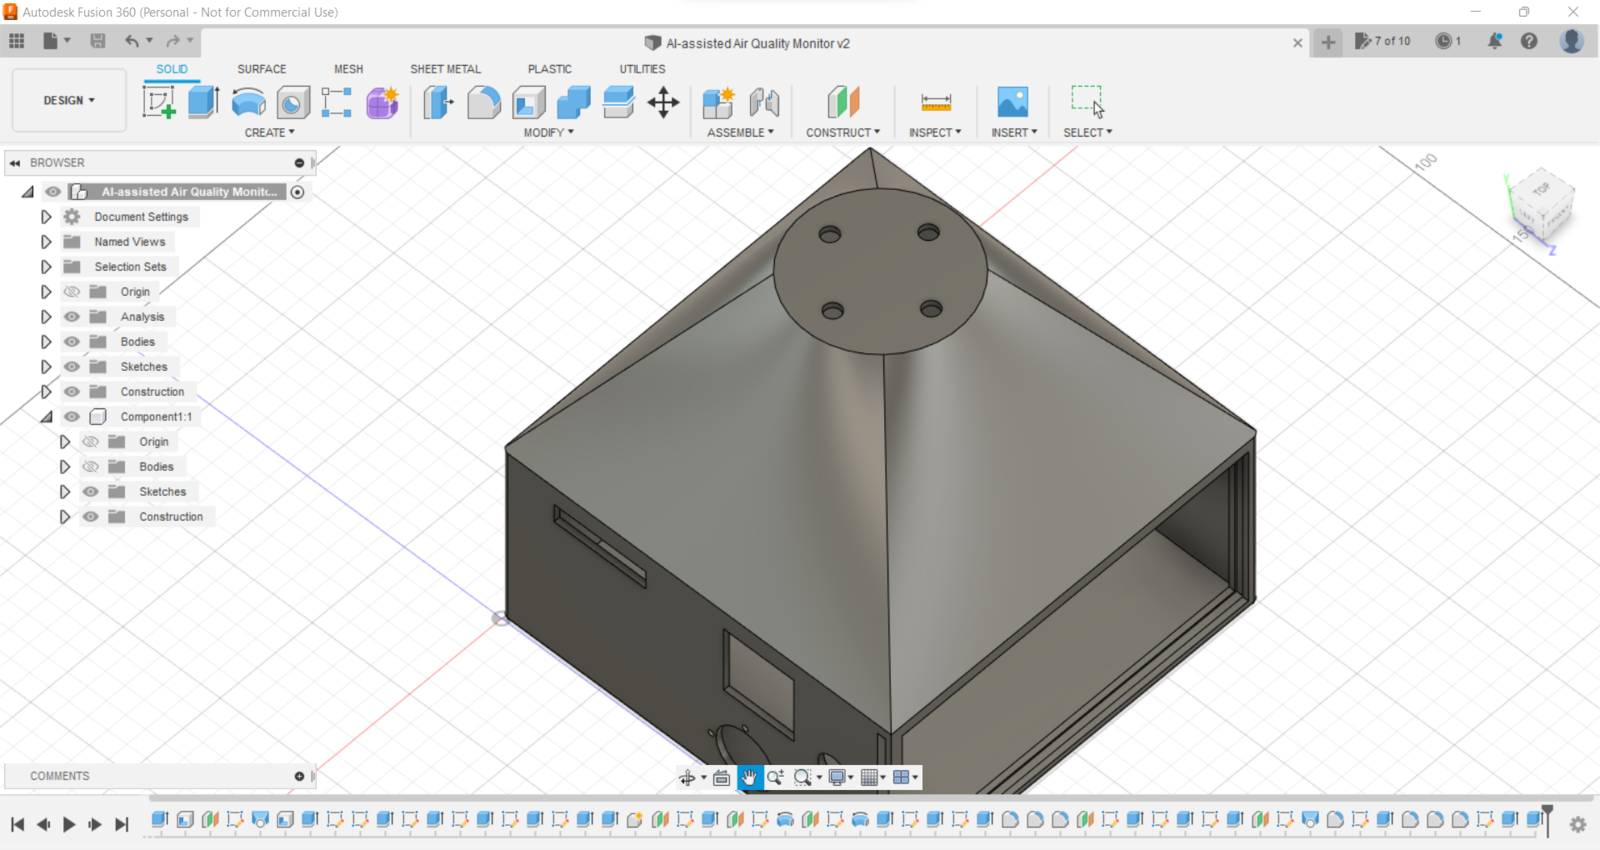
Since I focused on building a budget-friendly and accessible air station that collects air quality data and runs a neural network model to inform the user of air pollution via a PHP web application, I decided to design a sturdy and compact metallic case allowing the user to access the SD card after logging data, place the air quality sensors, and adjust the OV7725 camera effortlessly. To avoid overexposure to dust and prevent loose wire connections, I added a sliding front cover with a handle to the case. Then, I designed a separate camera holder mountable to the left side of the case at four different angles. Also, I decided to inscribe air pollution indicators on the sliding front cover to highlight the imminent pollution risk.
Since I needed to attach an anemometer to the case to collect wind speed data, I decided to design a semi-convex structure for the case. This unique shape also serves as a wind deflector that protects the air quality sensors from potential wind damage.
I designed the metallic air station case, its sliding front cover, and the mountable camera holder in Autodesk Fusion 360. You can download their STL files below.
## Step 1: Designing and printing a metallic air station case
Since I focused on building a budget-friendly and accessible air station that collects air quality data and runs a neural network model to inform the user of air pollution via a PHP web application, I decided to design a sturdy and compact metallic case allowing the user to access the SD card after logging data, place the air quality sensors, and adjust the OV7725 camera effortlessly. To avoid overexposure to dust and prevent loose wire connections, I added a sliding front cover with a handle to the case. Then, I designed a separate camera holder mountable to the left side of the case at four different angles. Also, I decided to inscribe air pollution indicators on the sliding front cover to highlight the imminent pollution risk.
Since I needed to attach an anemometer to the case to collect wind speed data, I decided to design a semi-convex structure for the case. This unique shape also serves as a wind deflector that protects the air quality sensors from potential wind damage.
I designed the metallic air station case, its sliding front cover, and the mountable camera holder in Autodesk Fusion 360. You can download their STL files below.
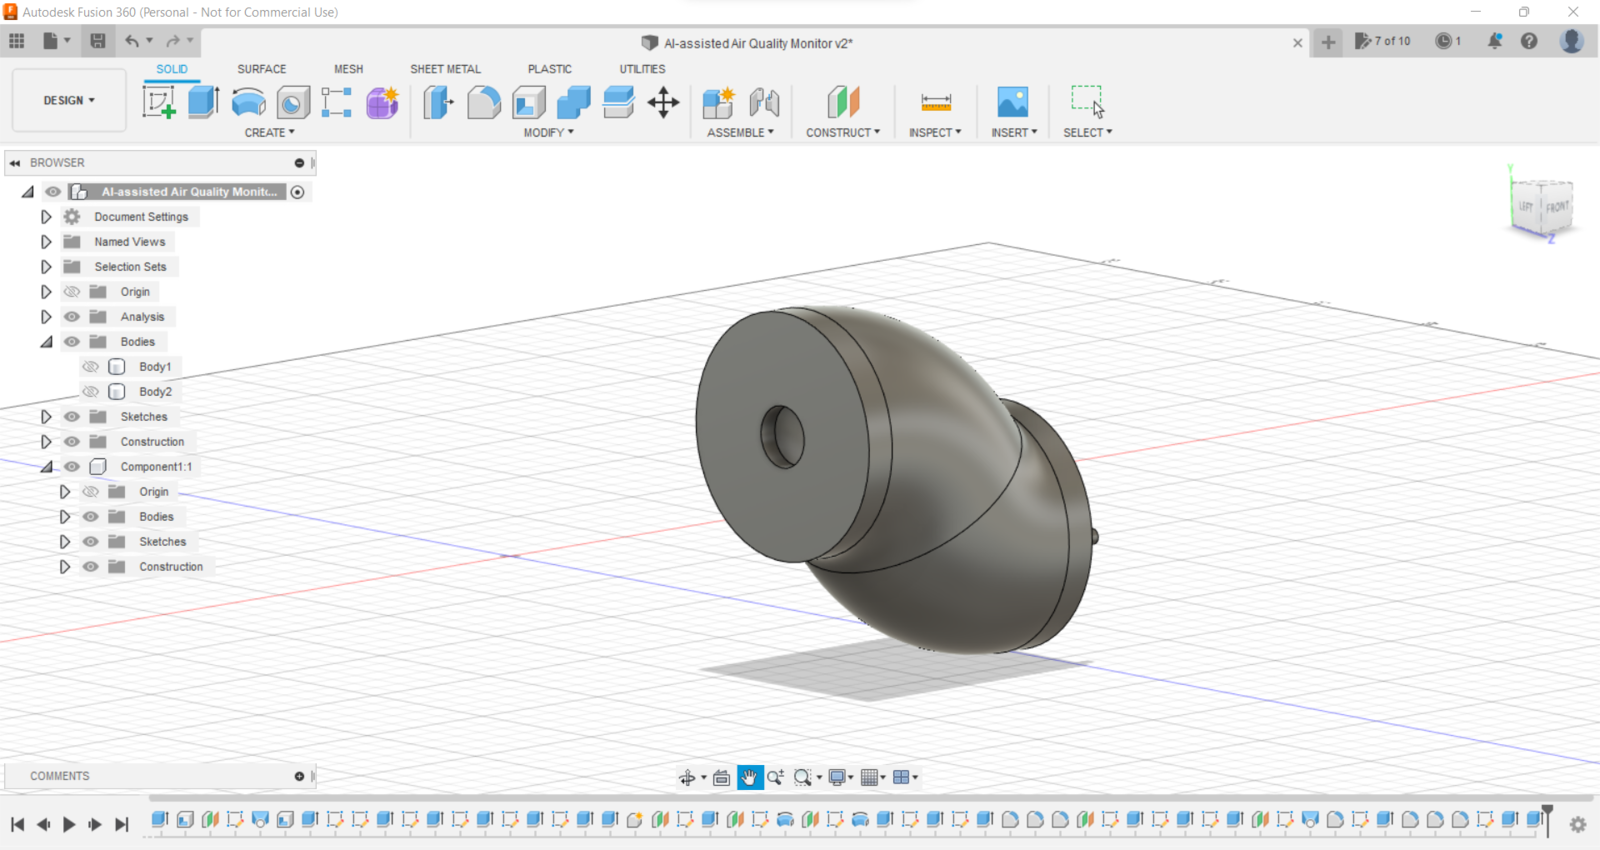
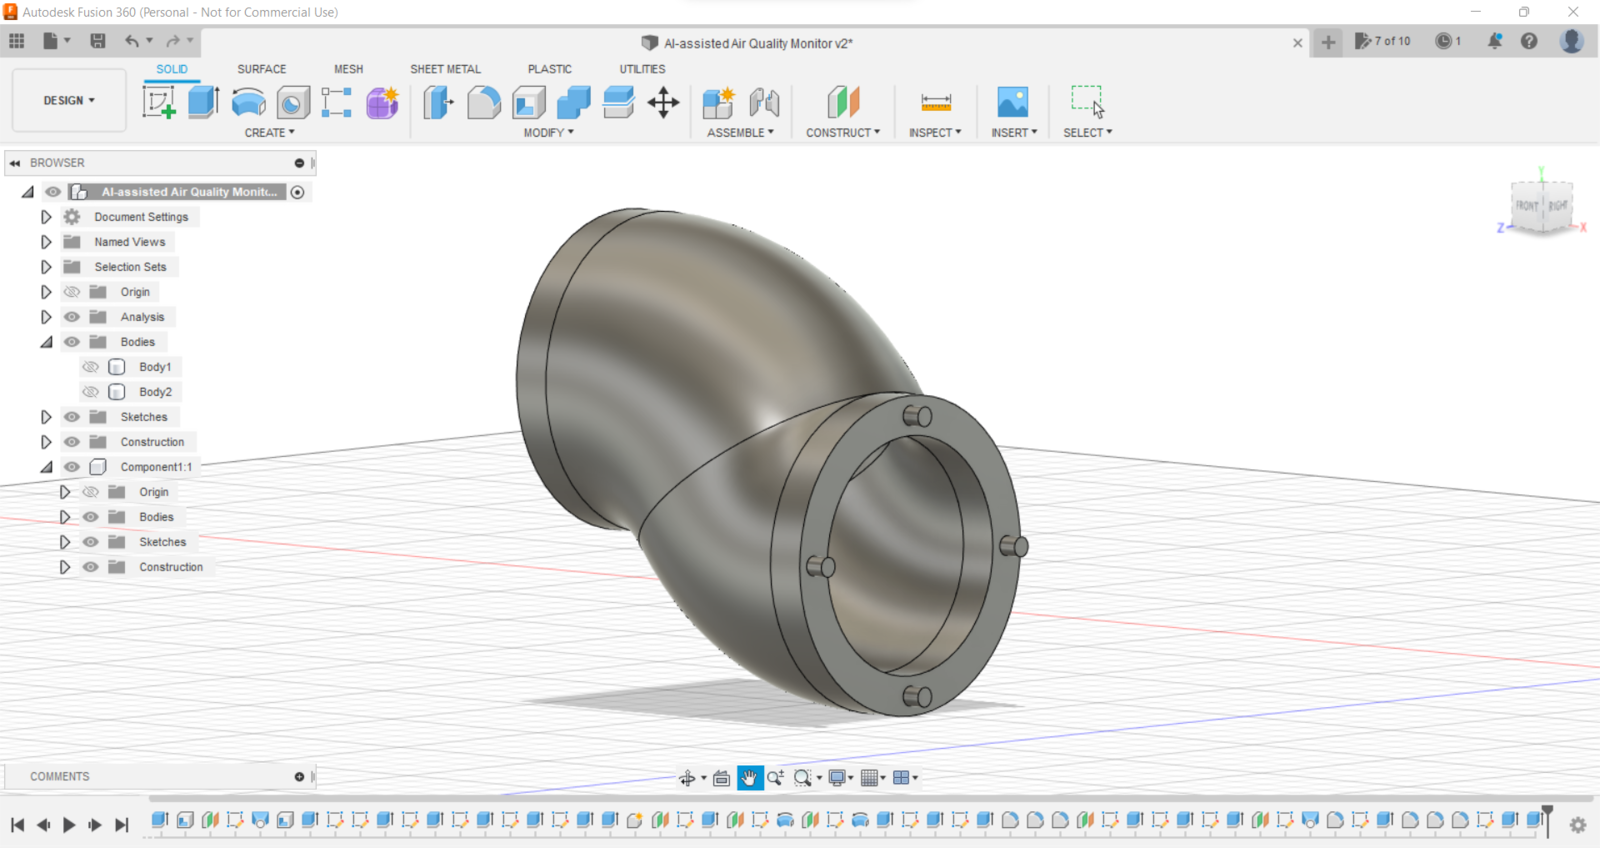
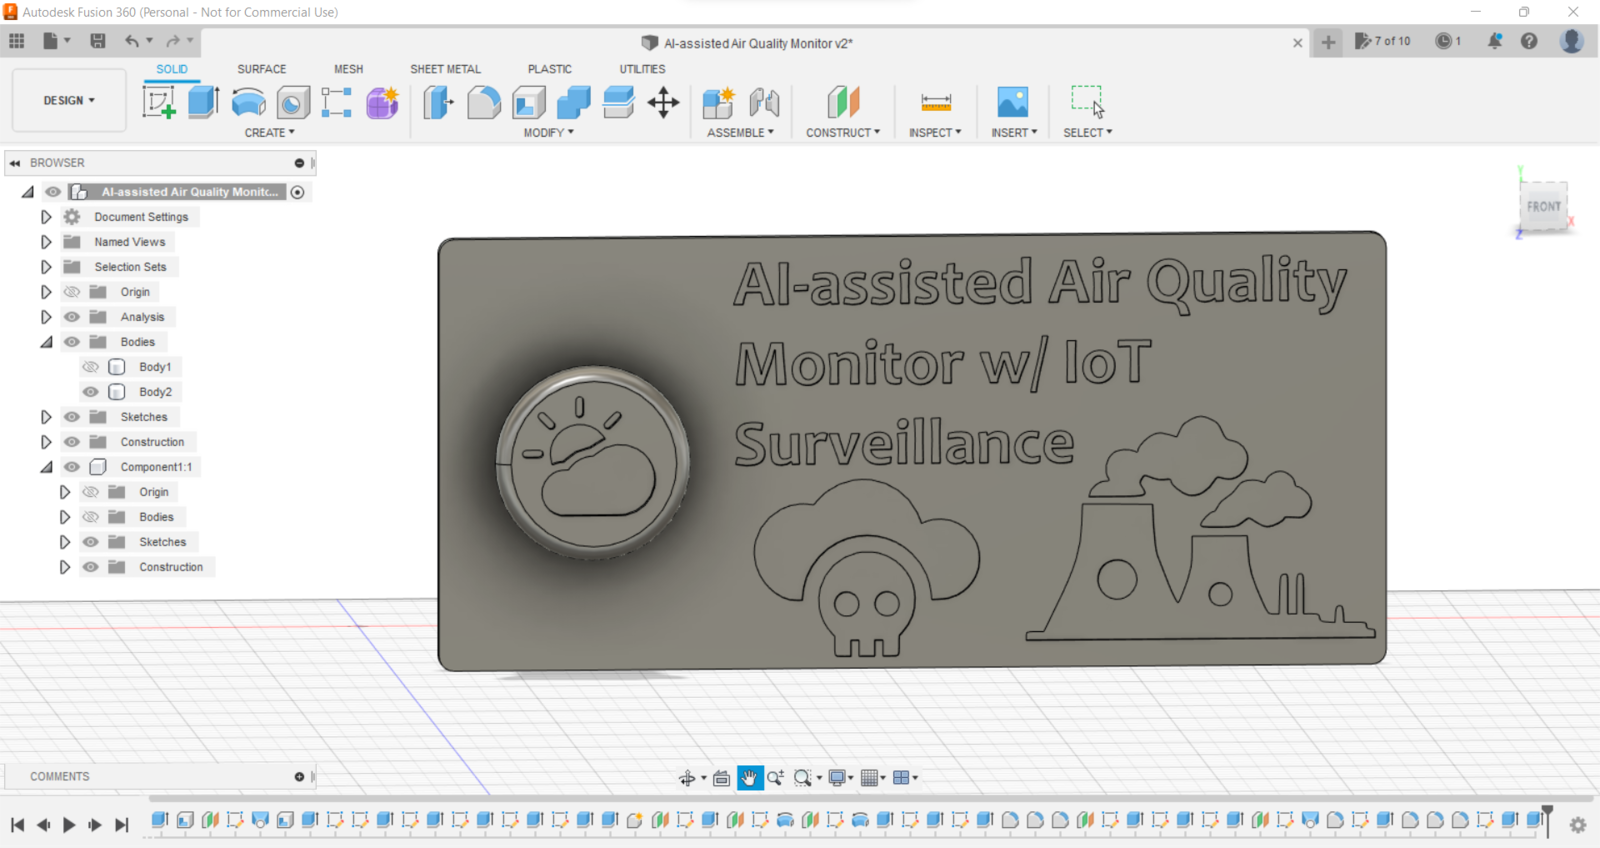
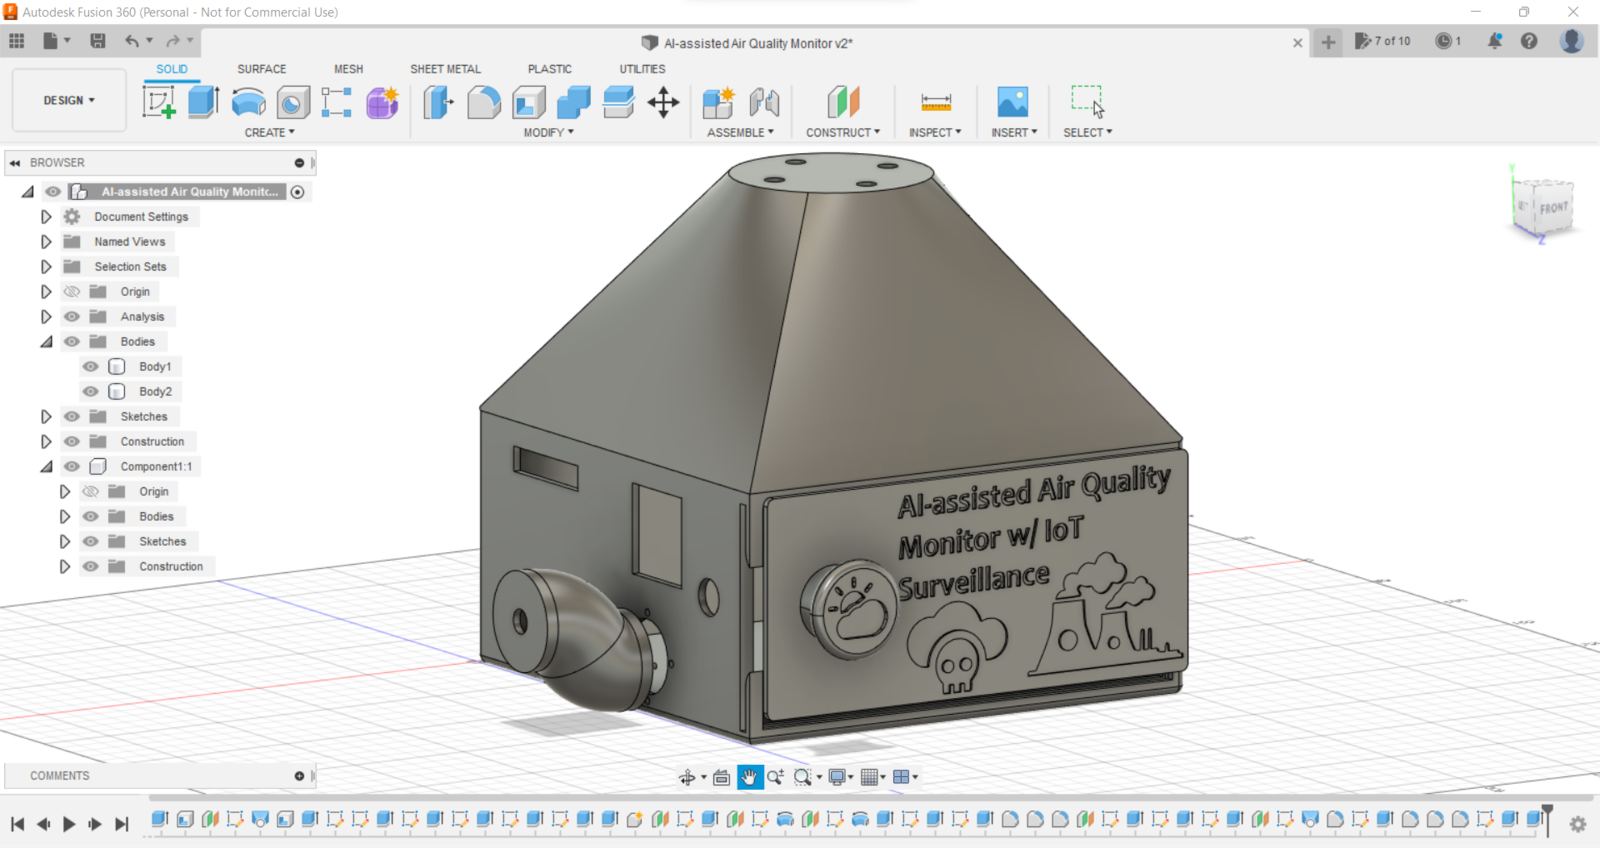 Then, I sliced all 3D models (STL files) in Ultimaker Cura.
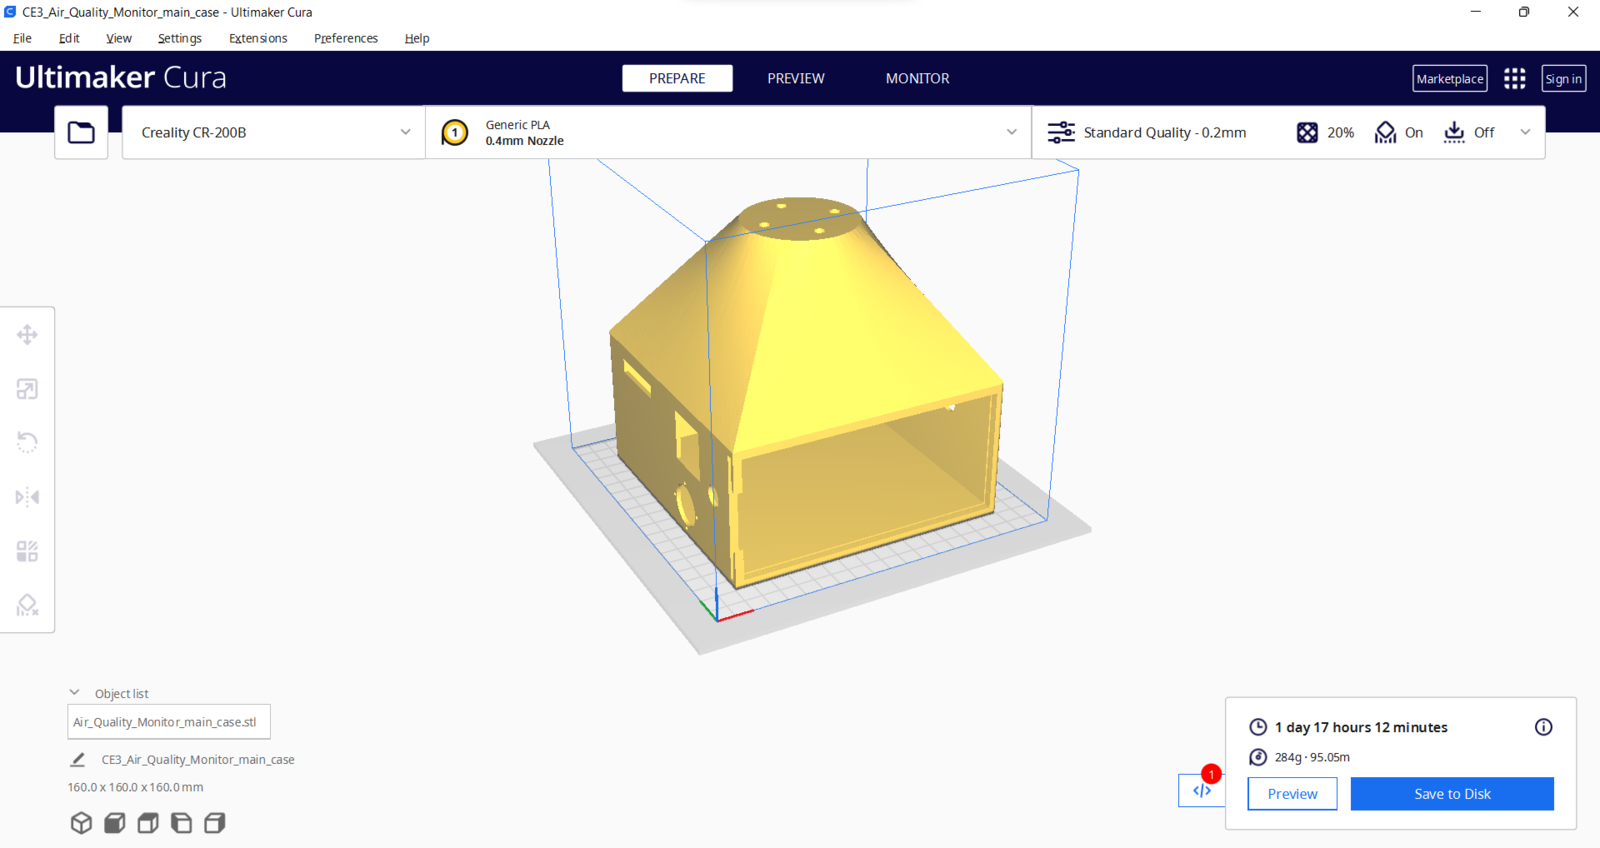
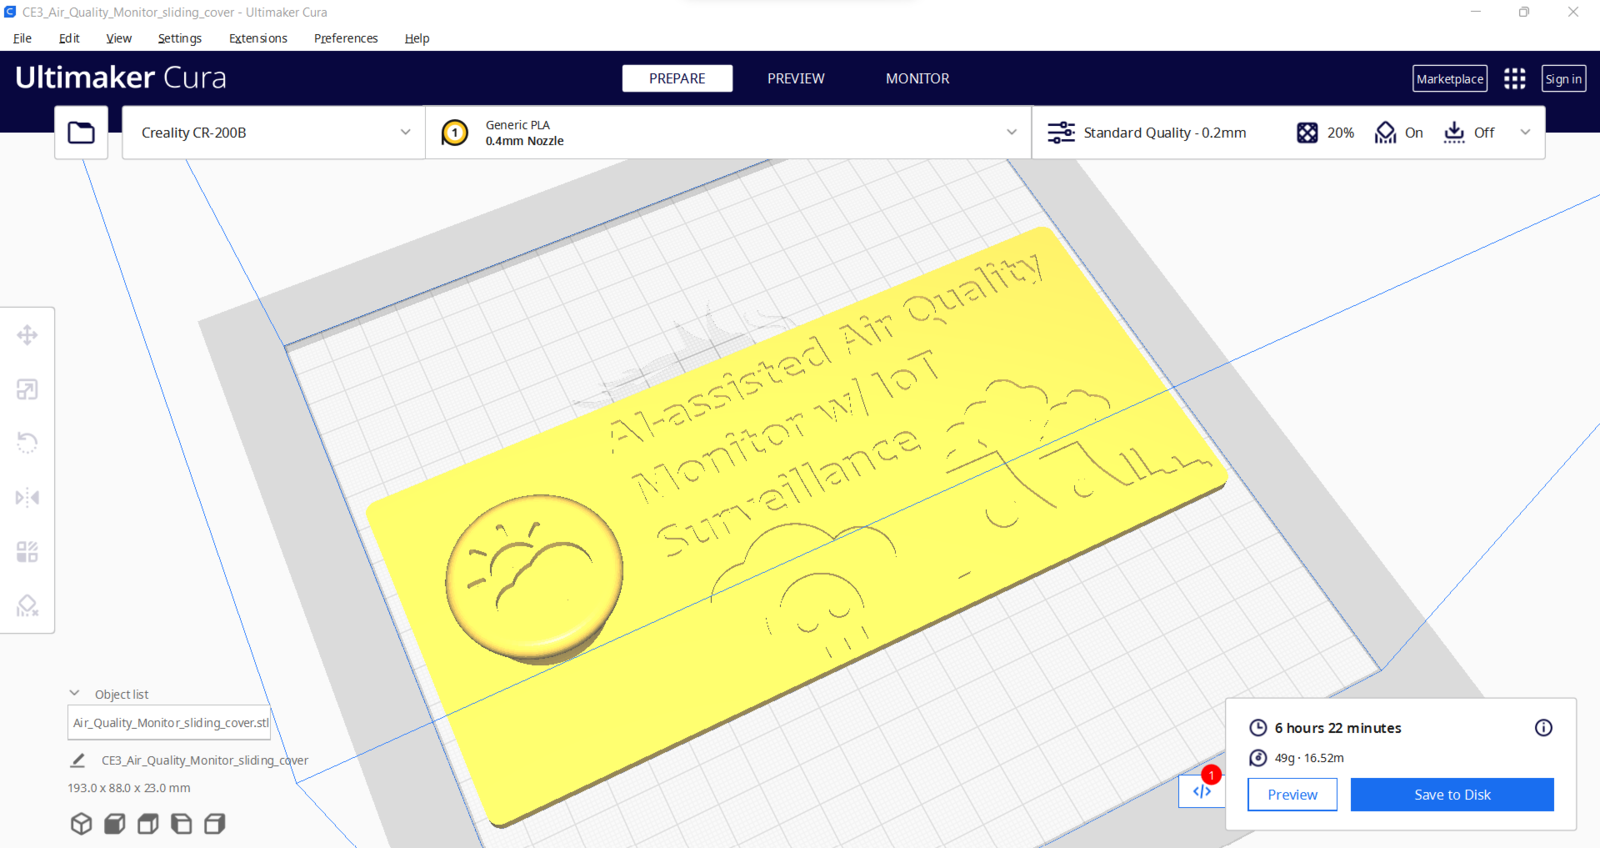
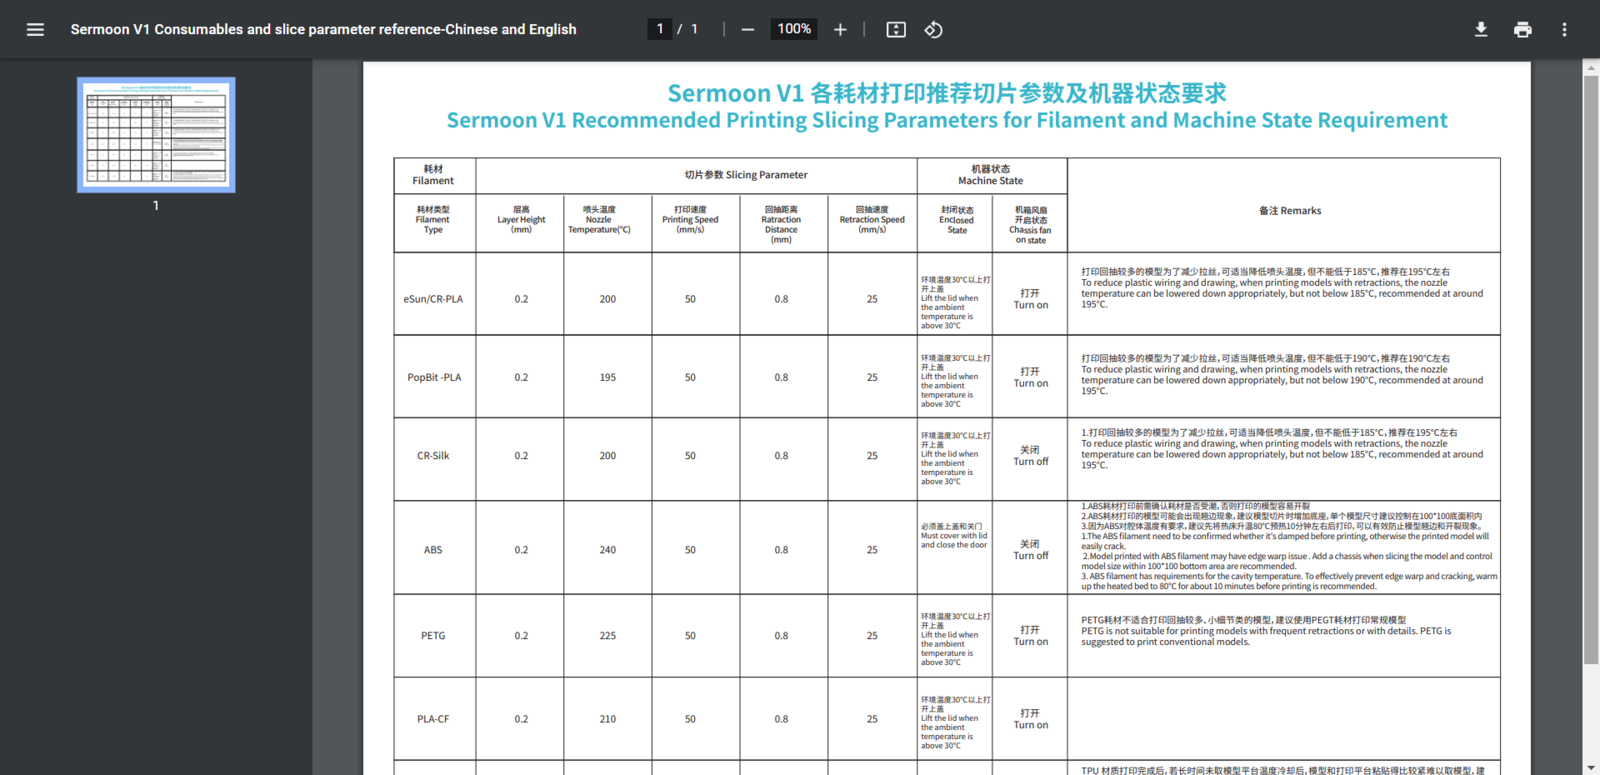
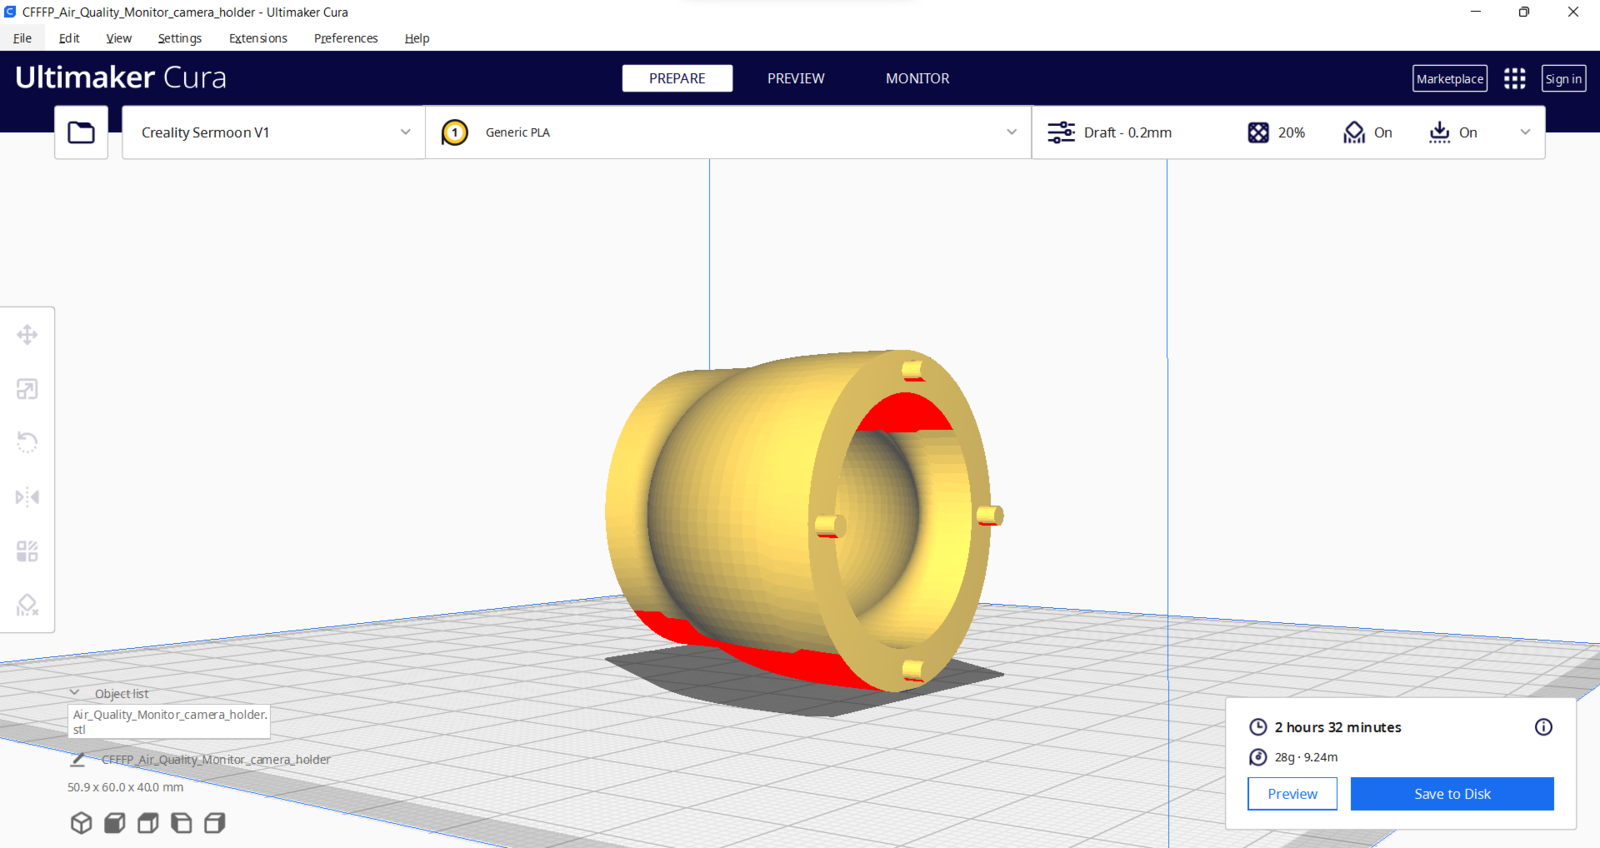 Since I wanted to create a solid metallic structure for the air station case with the sliding front cover and apply a unique alloy combination complementing the metallic theme, I utilized these PLA filaments:
* eSilk Copper
* eSilk Bronze
Finally, I printed all parts (models) with my Creality Sermoon V1 3D Printer and Creality CR-200B 3D Printer in combination with the Creality Sonic Pad. You can find more detailed information regarding the Sonic Pad in Step 1.1.
Since I wanted to create a solid metallic structure for the air station case with the sliding front cover and apply a unique alloy combination complementing the metallic theme, I utilized these PLA filaments:
* eSilk Copper
* eSilk Bronze
Finally, I printed all parts (models) with my Creality Sermoon V1 3D Printer and Creality CR-200B 3D Printer in combination with the Creality Sonic Pad. You can find more detailed information regarding the Sonic Pad in Step 1.1.
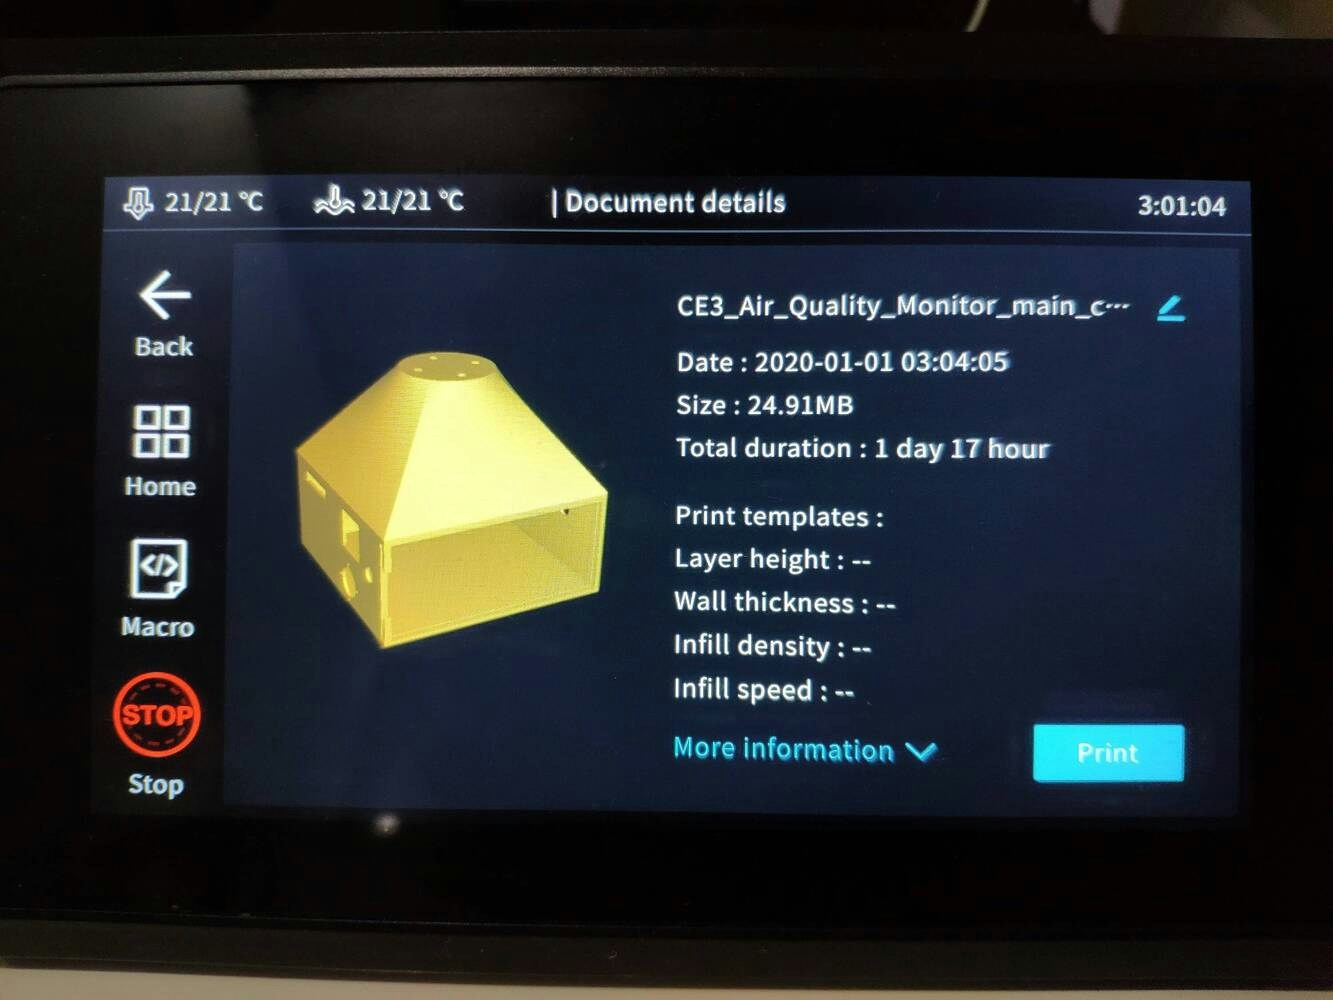
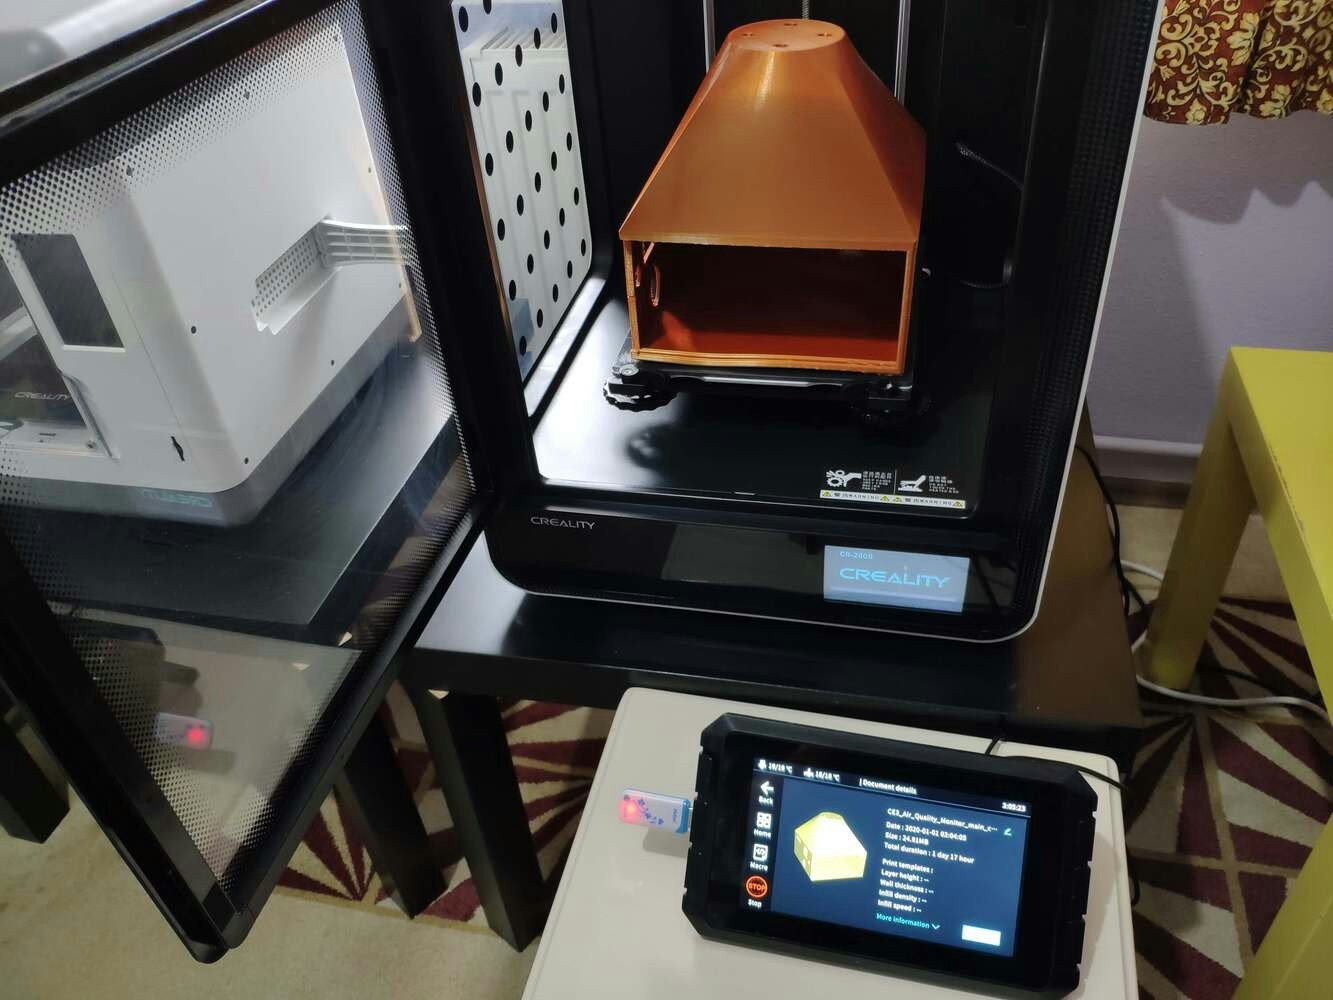 If you are a maker or hobbyist planning to print your 3D models to create more complex and detailed projects, I highly recommend the Sermoon V1. Since the Sermoon V1 is fully-enclosed, you can print high-resolution 3D models with PLA and ABS filaments. Also, it has a smart filament runout sensor and the resume printing option for power failures.
Furthermore, the Sermoon V1 provides a flexible metal magnetic suction platform on the heated bed. So, you can remove your prints without any struggle. Also, you can feed and remove filaments automatically (one-touch) due to its unique sprite extruder (hot end) design supporting dual-gear feeding. Most importantly, you can level the bed automatically due to its user-friendly and assisted bed leveling function.
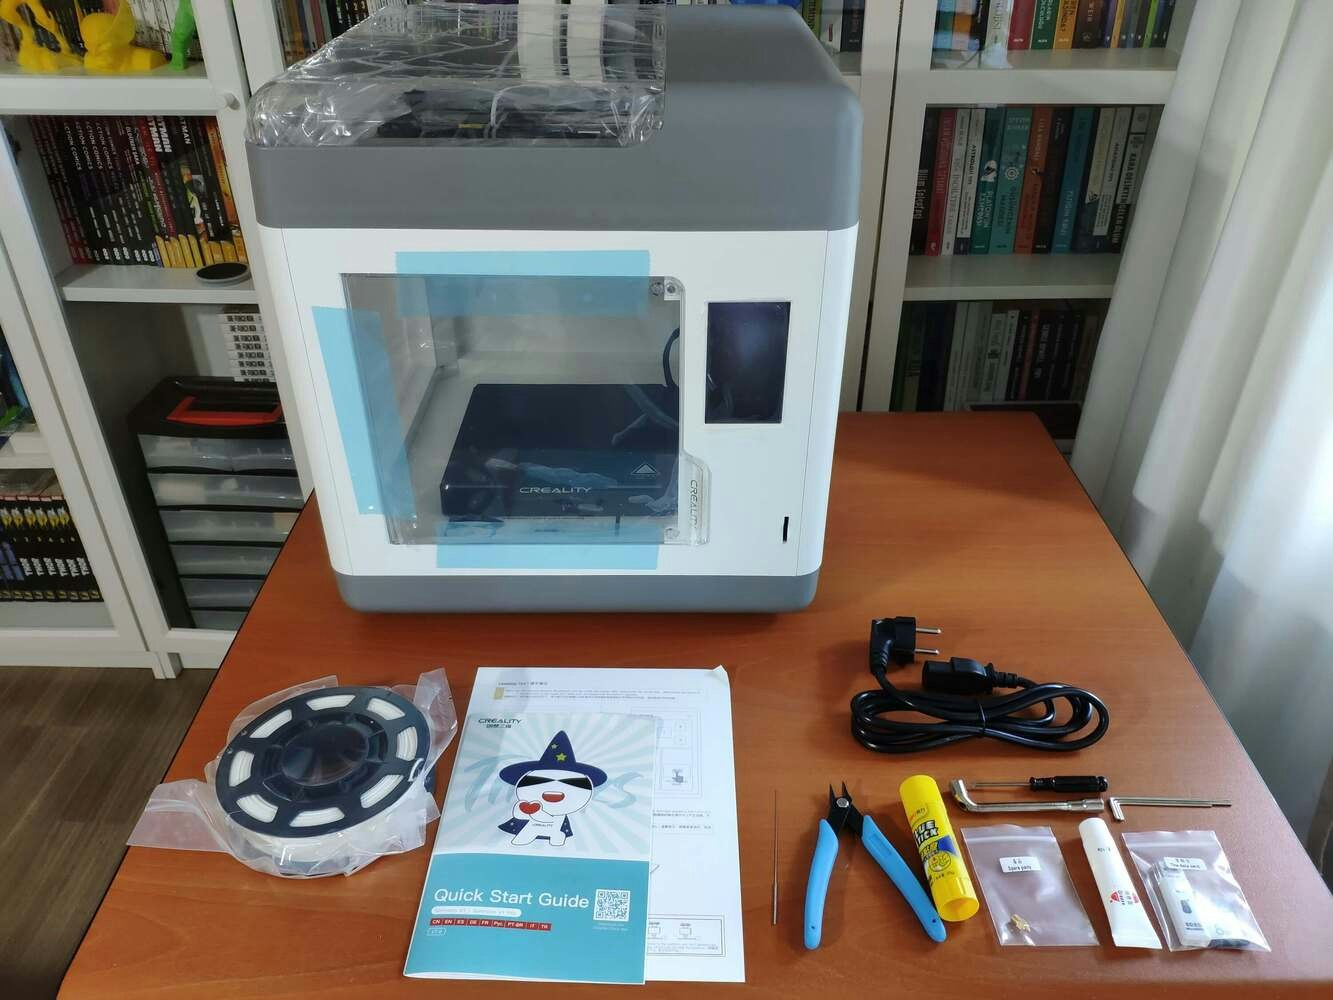
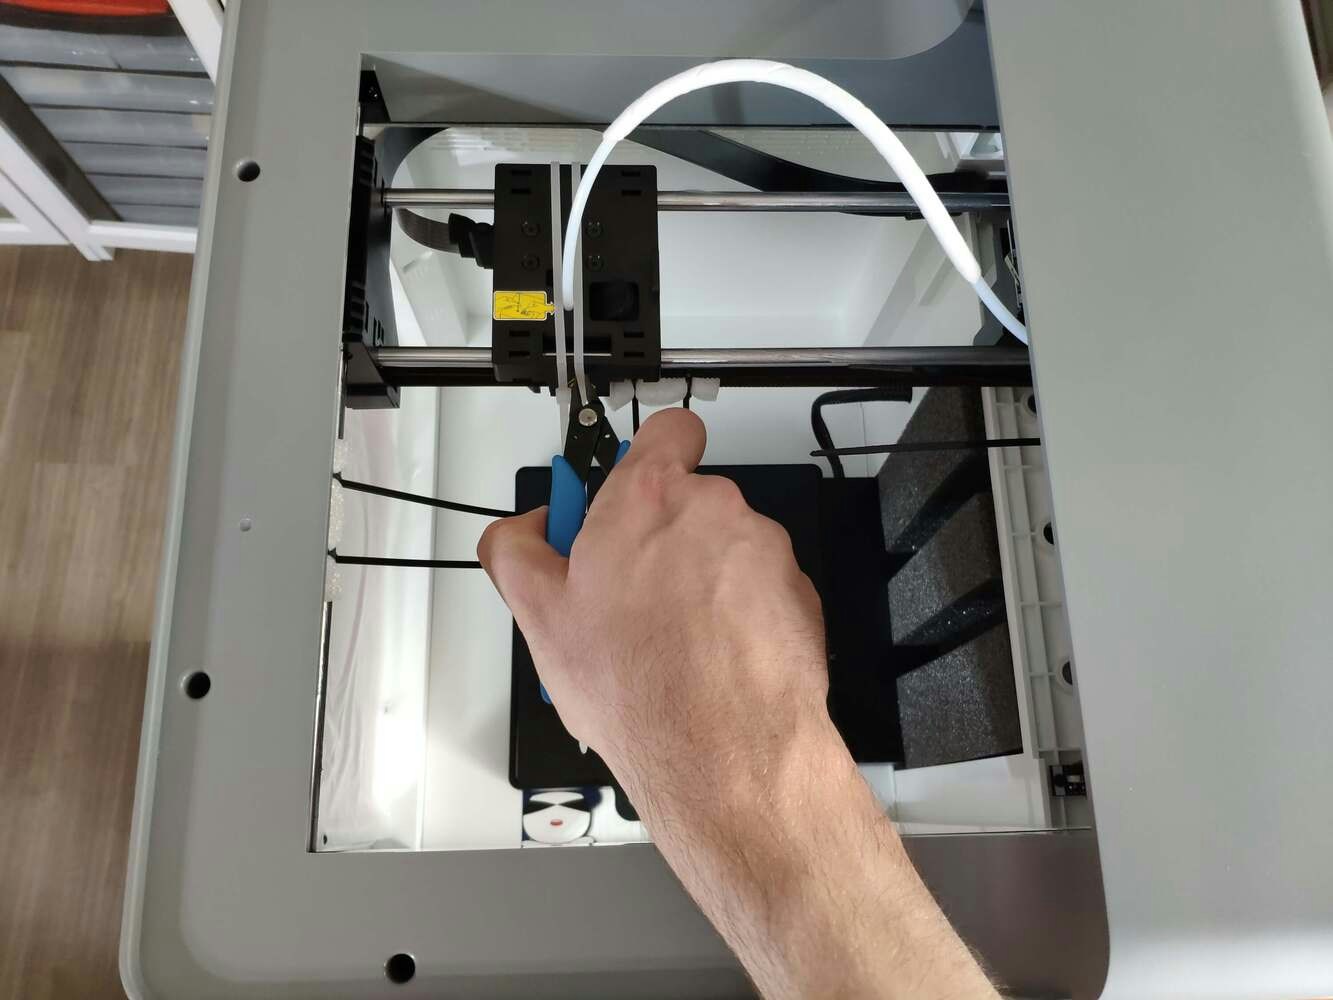
:hash: Before the first use, remove unnecessary cable ties and apply grease to the rails.
If you are a maker or hobbyist planning to print your 3D models to create more complex and detailed projects, I highly recommend the Sermoon V1. Since the Sermoon V1 is fully-enclosed, you can print high-resolution 3D models with PLA and ABS filaments. Also, it has a smart filament runout sensor and the resume printing option for power failures.
Furthermore, the Sermoon V1 provides a flexible metal magnetic suction platform on the heated bed. So, you can remove your prints without any struggle. Also, you can feed and remove filaments automatically (one-touch) due to its unique sprite extruder (hot end) design supporting dual-gear feeding. Most importantly, you can level the bed automatically due to its user-friendly and assisted bed leveling function.
:hash: Before the first use, remove unnecessary cable ties and apply grease to the rails.
.jpg?fit=max&auto=format&n=cTLnQohdrJO-nQ6f&q=85&s=01191962394682ffe276b6da510bff50) :hash: Test the nozzle and hot bed temperatures.
:hash: Test the nozzle and hot bed temperatures.
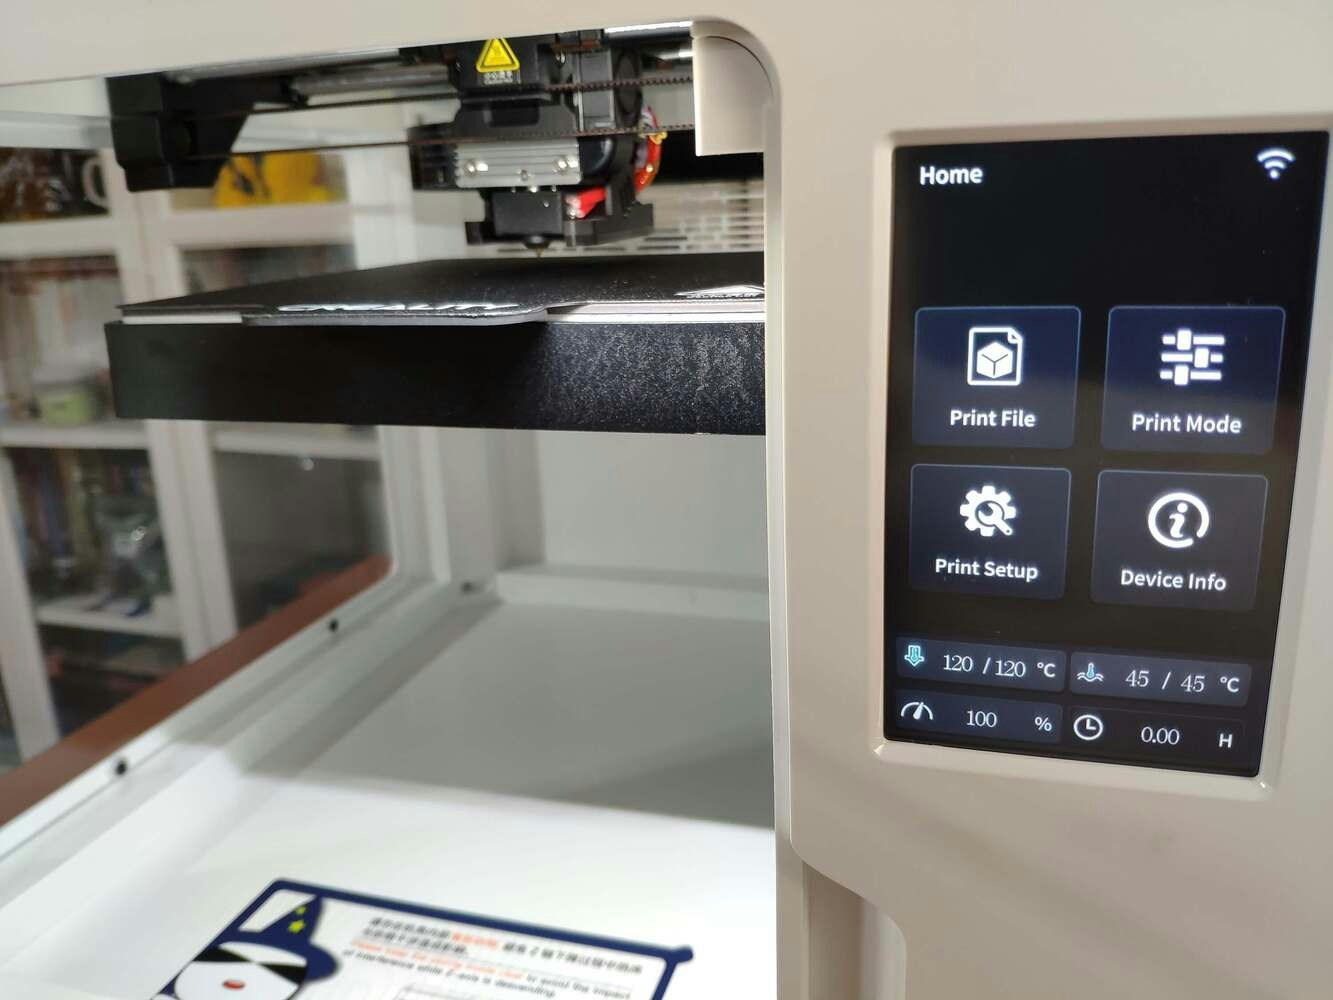 :hash: Go to *Print Setup ➡ Auto leveling* and adjust five predefined points automatically with the assisted leveling function.
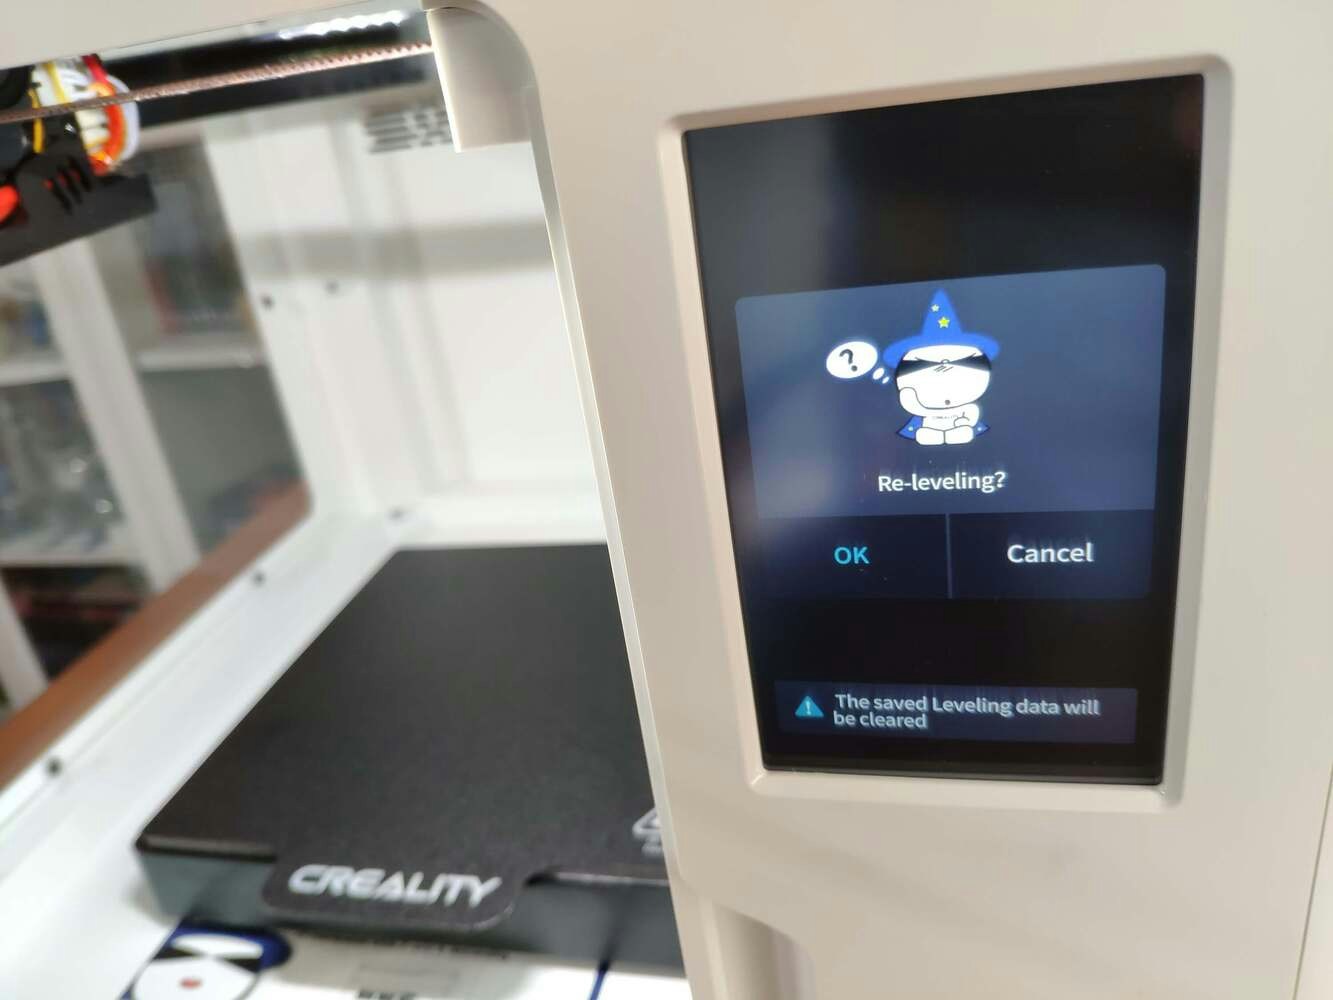
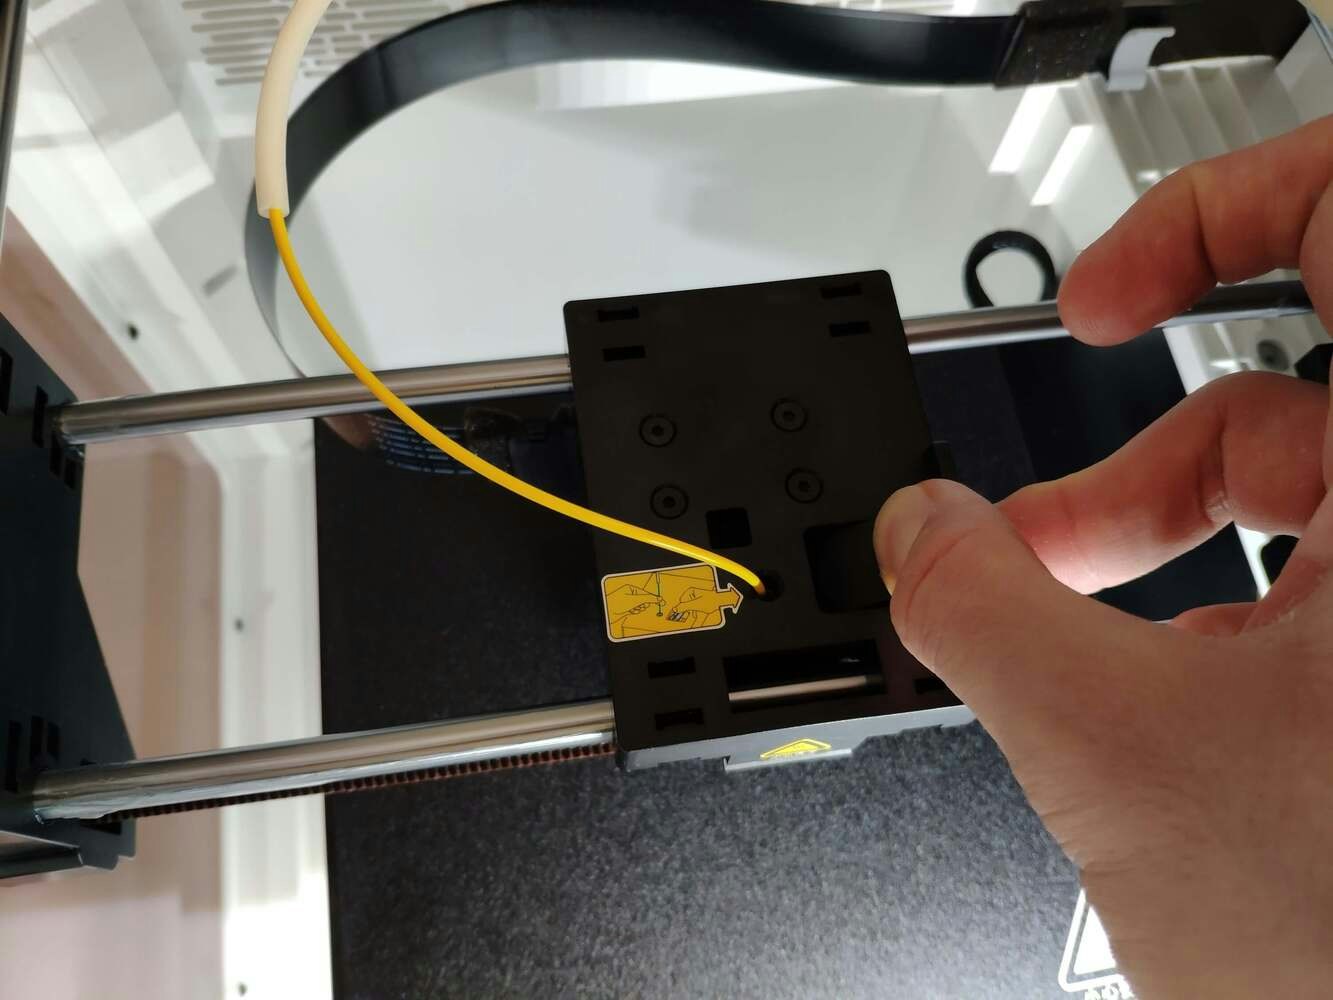
.jpg?fit=max&auto=format&n=cTLnQohdrJO-nQ6f&q=85&s=e71a3fad347e0aa548cef081f778a92a) :hash: Finally, place the filament into the integrated spool holder and feed the extruder with the filament.
:hash: Finally, place the filament into the integrated spool holder and feed the extruder with the filament.
.jpg?fit=max&auto=format&n=cTLnQohdrJO-nQ6f&q=85&s=66ac3e46eccc71a81854f15ca8173378)
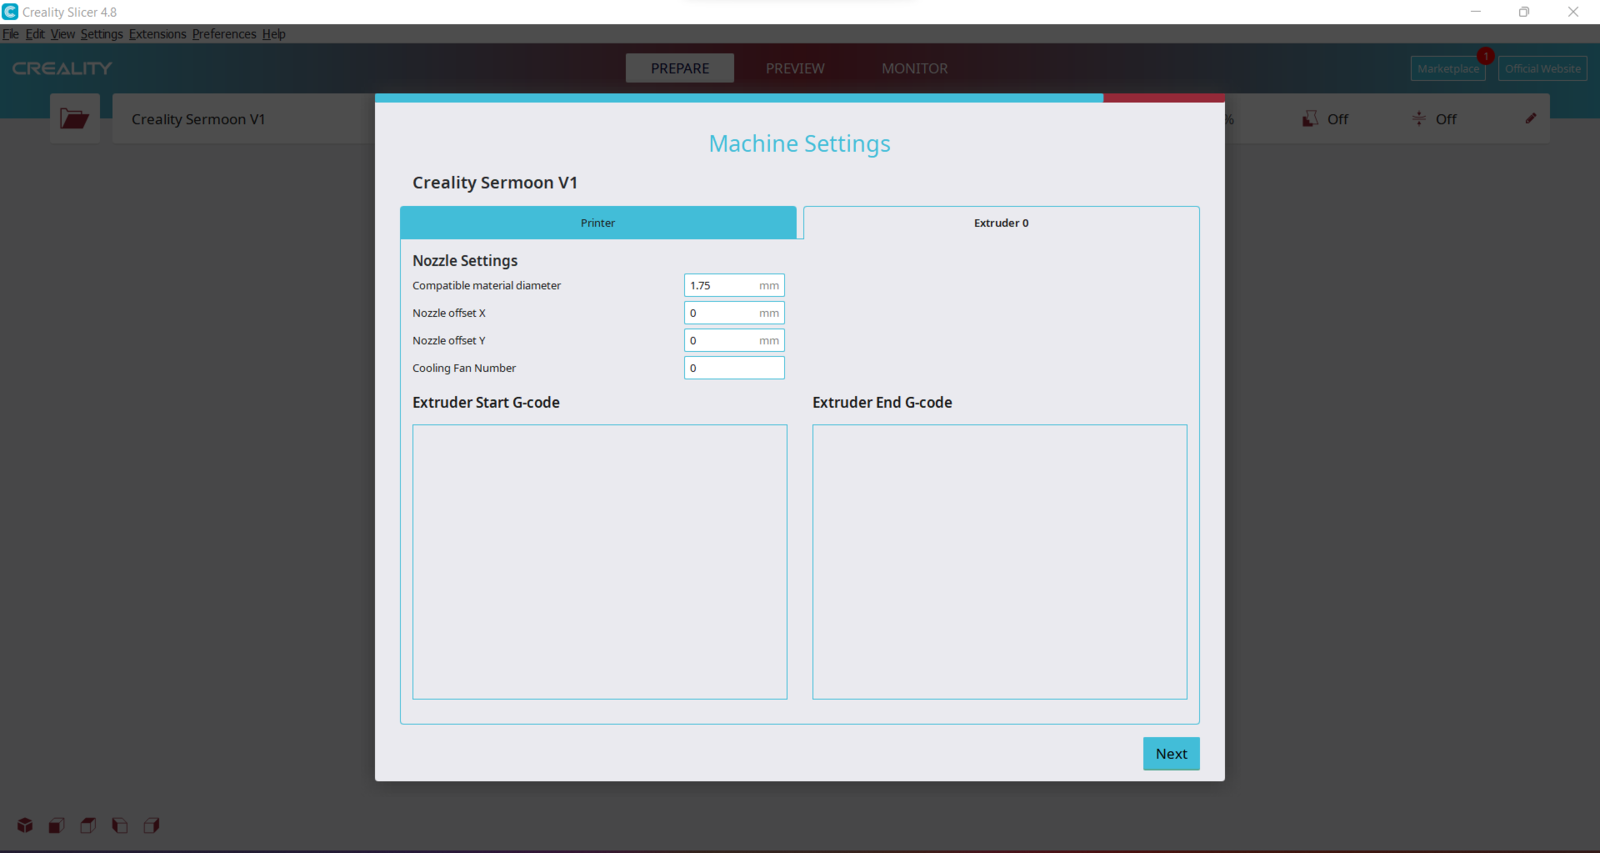
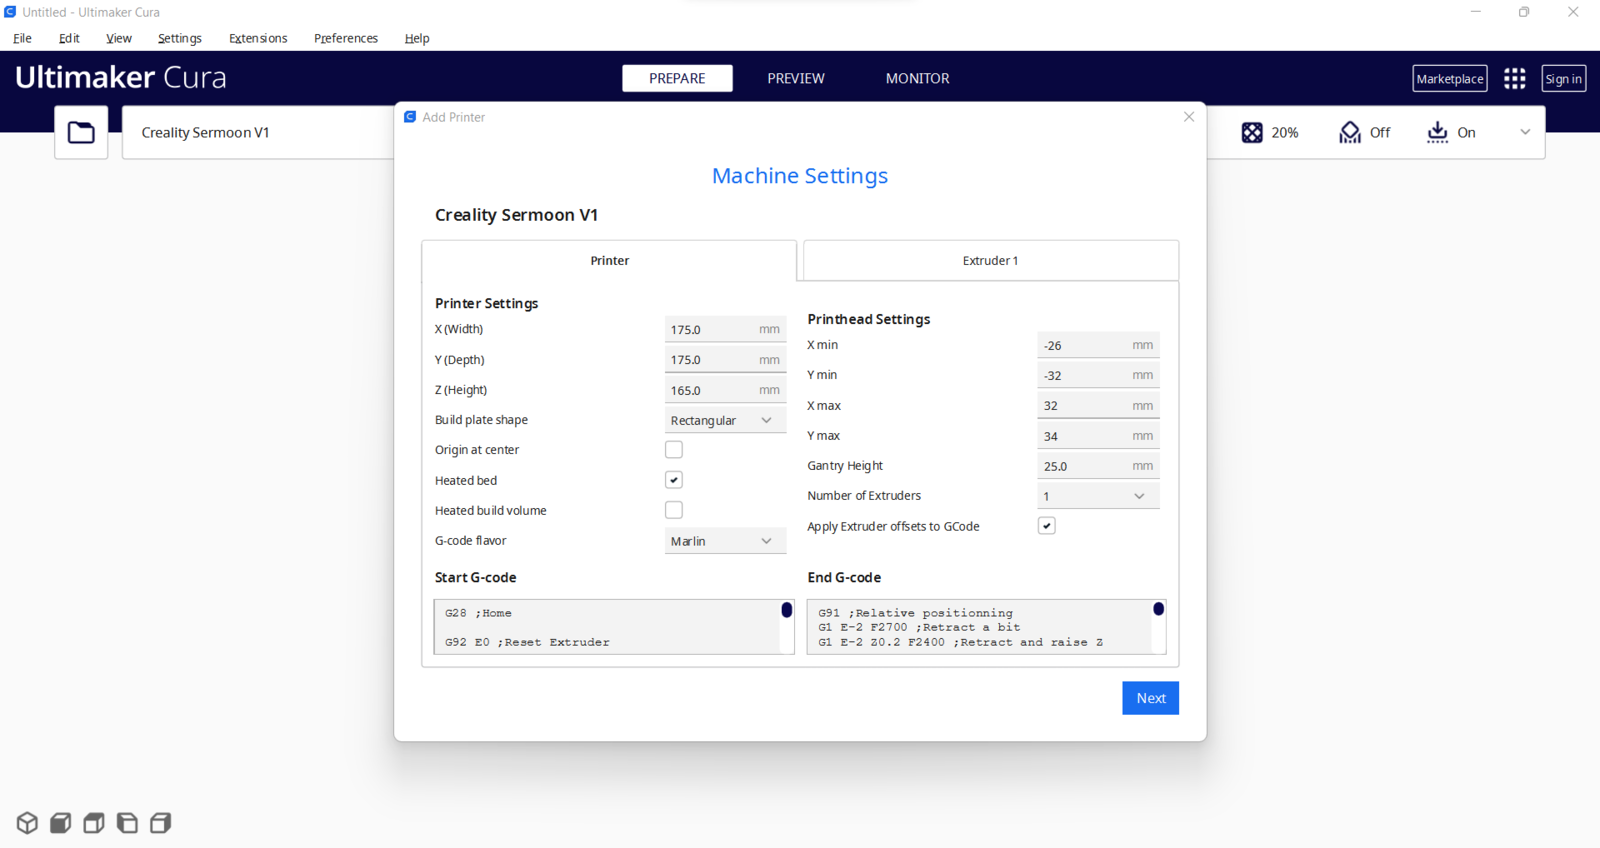
 :hash: Since the Sermoon V1 is not officially supported by Cura, download the latest [Creality Slicer](https://www.creality.com/pages/download-sermoon-v1v1-pro) version and copy the official printer settings provided by Creality, including *Start G-code* and *End G-code*, to a custom printer profile on Cura.
.png?fit=max&auto=format&n=cTLnQohdrJO-nQ6f&q=85&s=3d876d47e3e7c2c46f0a1496f5bd04e8)
.png?fit=max&auto=format&n=cTLnQohdrJO-nQ6f&q=85&s=f9b9c809f0fad401bda763991b06afdf) ## Step 1.1: Improving print quality and speed with the Creality Sonic Pad
Since I wanted to improve my print quality and speed with Klipper, I decided to upgrade my Creality CR-200B 3D Printer with the [Creality Sonic Pad](https://www.creality.com/products/creality-sonic-pad).
Creality Sonic Pad is a beginner-friendly device to control almost any FDM 3D printer on the market with the Klipper firmware. Since the Sonic Pad uses precision-oriented algorithms, it provides remarkable results with higher printing speeds. The built-in input shaper function mitigates oscillation during high-speed printing and smooths ringing to maintain high model quality. Also, it supports G-code model preview.
Although the Sonic Pad is pre-configured for some Creality printers, it does not support the CR-200B officially yet. Therefore, I needed to add the CR-200B as a user-defined printer to the Sonic Pad. Since the Sonic Pad needs unsupported printers to be flashed with the self-compiled Klipper firmware before connection, I flashed my CR-200B with the required Klipper firmware settings via *FluiddPI* by following [this YouTube tutorial](https://www.youtube.com/watch?v=gfZ9Lbyh8qU).
If you do not know how to write a printer configuration file for Klipper, you can download the stock CR-200B configuration file from [here](https://github.com/ChewyJetpack/CR-200B-Klipper-Config/).
:hash: After flashing the CR-200B with the Klipper firmware, copy the configuration file *(printer.cfg)* to a USB drive and connect the drive to the Sonic Pad.
:hash: After setting up the Sonic Pad, select *Other models*. Then, load the *printer.cfg* file.
## Step 1.1: Improving print quality and speed with the Creality Sonic Pad
Since I wanted to improve my print quality and speed with Klipper, I decided to upgrade my Creality CR-200B 3D Printer with the [Creality Sonic Pad](https://www.creality.com/products/creality-sonic-pad).
Creality Sonic Pad is a beginner-friendly device to control almost any FDM 3D printer on the market with the Klipper firmware. Since the Sonic Pad uses precision-oriented algorithms, it provides remarkable results with higher printing speeds. The built-in input shaper function mitigates oscillation during high-speed printing and smooths ringing to maintain high model quality. Also, it supports G-code model preview.
Although the Sonic Pad is pre-configured for some Creality printers, it does not support the CR-200B officially yet. Therefore, I needed to add the CR-200B as a user-defined printer to the Sonic Pad. Since the Sonic Pad needs unsupported printers to be flashed with the self-compiled Klipper firmware before connection, I flashed my CR-200B with the required Klipper firmware settings via *FluiddPI* by following [this YouTube tutorial](https://www.youtube.com/watch?v=gfZ9Lbyh8qU).
If you do not know how to write a printer configuration file for Klipper, you can download the stock CR-200B configuration file from [here](https://github.com/ChewyJetpack/CR-200B-Klipper-Config/).
:hash: After flashing the CR-200B with the Klipper firmware, copy the configuration file *(printer.cfg)* to a USB drive and connect the drive to the Sonic Pad.
:hash: After setting up the Sonic Pad, select *Other models*. Then, load the *printer.cfg* file.
.jpg?fit=max&auto=format&n=cTLnQohdrJO-nQ6f&q=85&s=720747134ef7b469f9a85eab19e3535a)
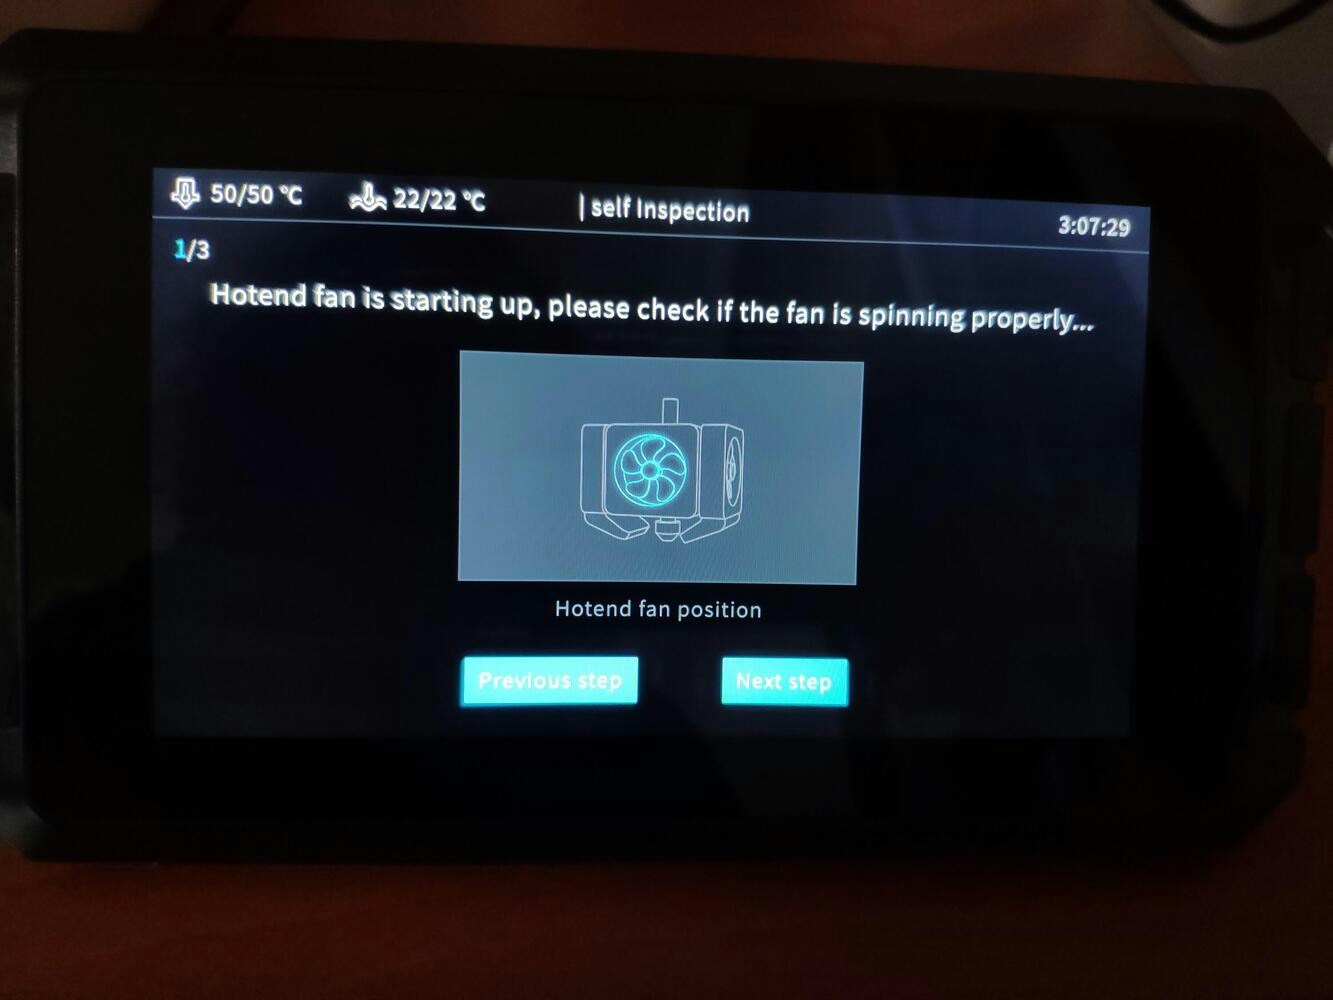
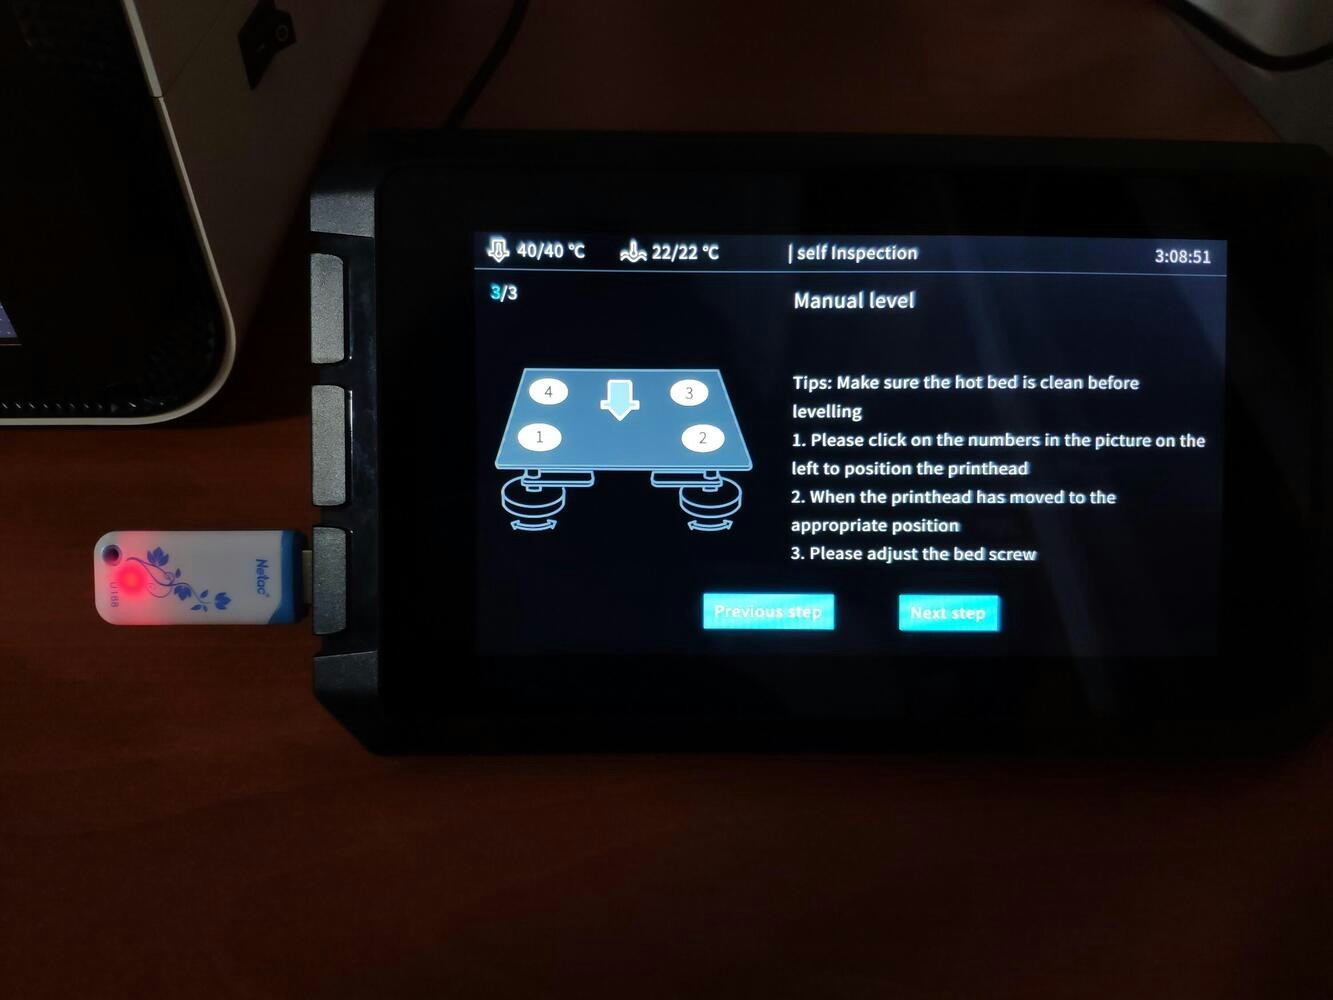
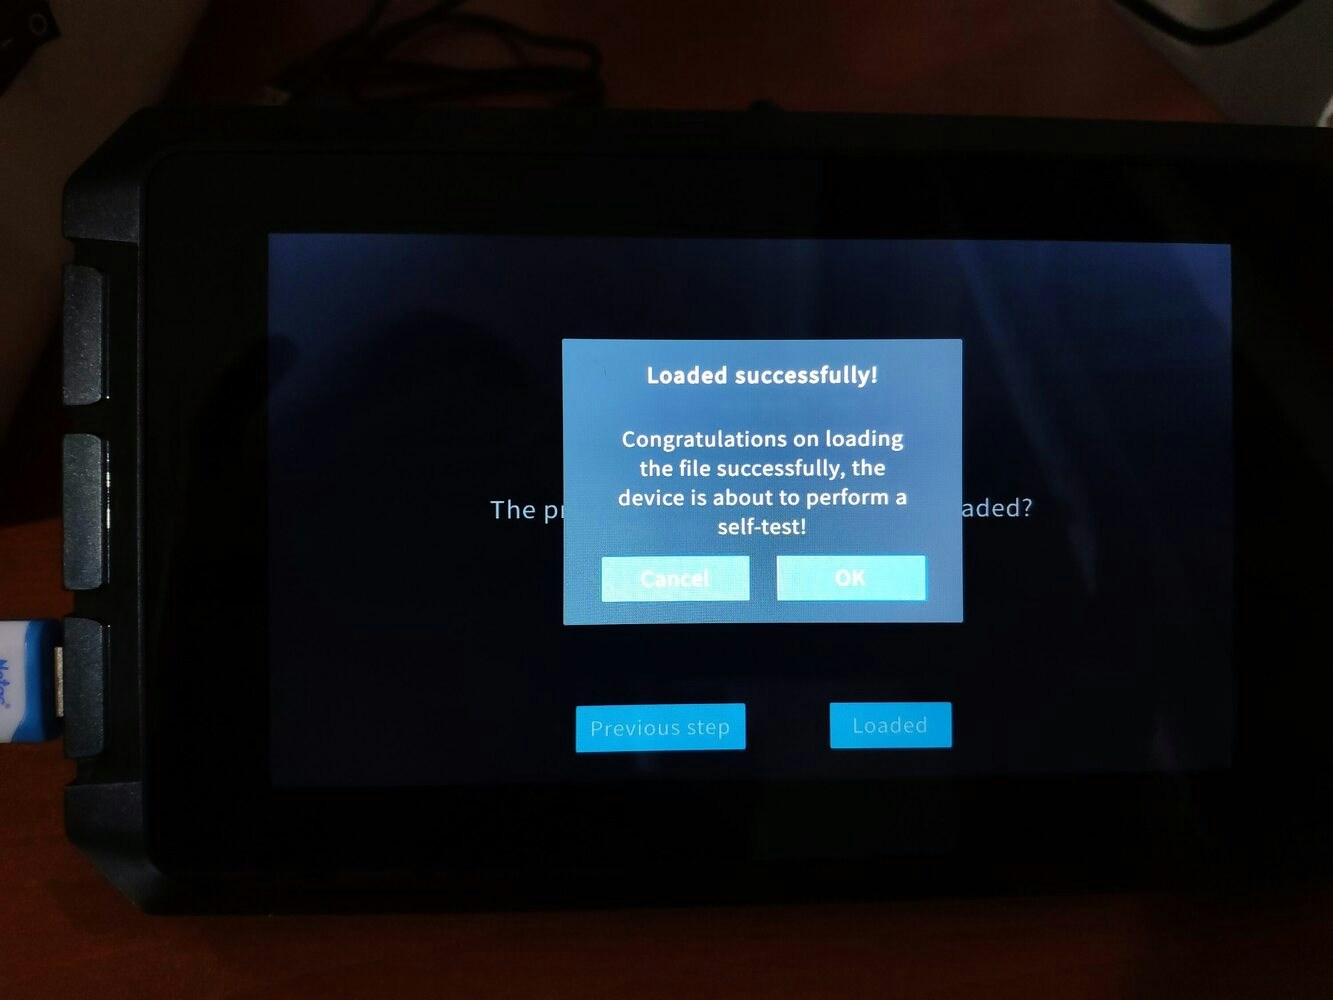 :hash: After connecting the Sonic Pad to the CR-200B successfully via a USB cable, the Sonic Pad starts the self-testing procedure, which allows the user to test printer functions and level the bed.
.jpg?fit=max&auto=format&n=cTLnQohdrJO-nQ6f&q=85&s=e7f3db3d79b926d2642d668e68cc55e6)
 :hash: After completing setting up the printer, the Sonic Pad lets the user control all functions provided by the Klipper firmware.
.jpg?fit=max&auto=format&n=cTLnQohdrJO-nQ6f&q=85&s=6f4cb8b6e3136303ede7bba8117507b5)
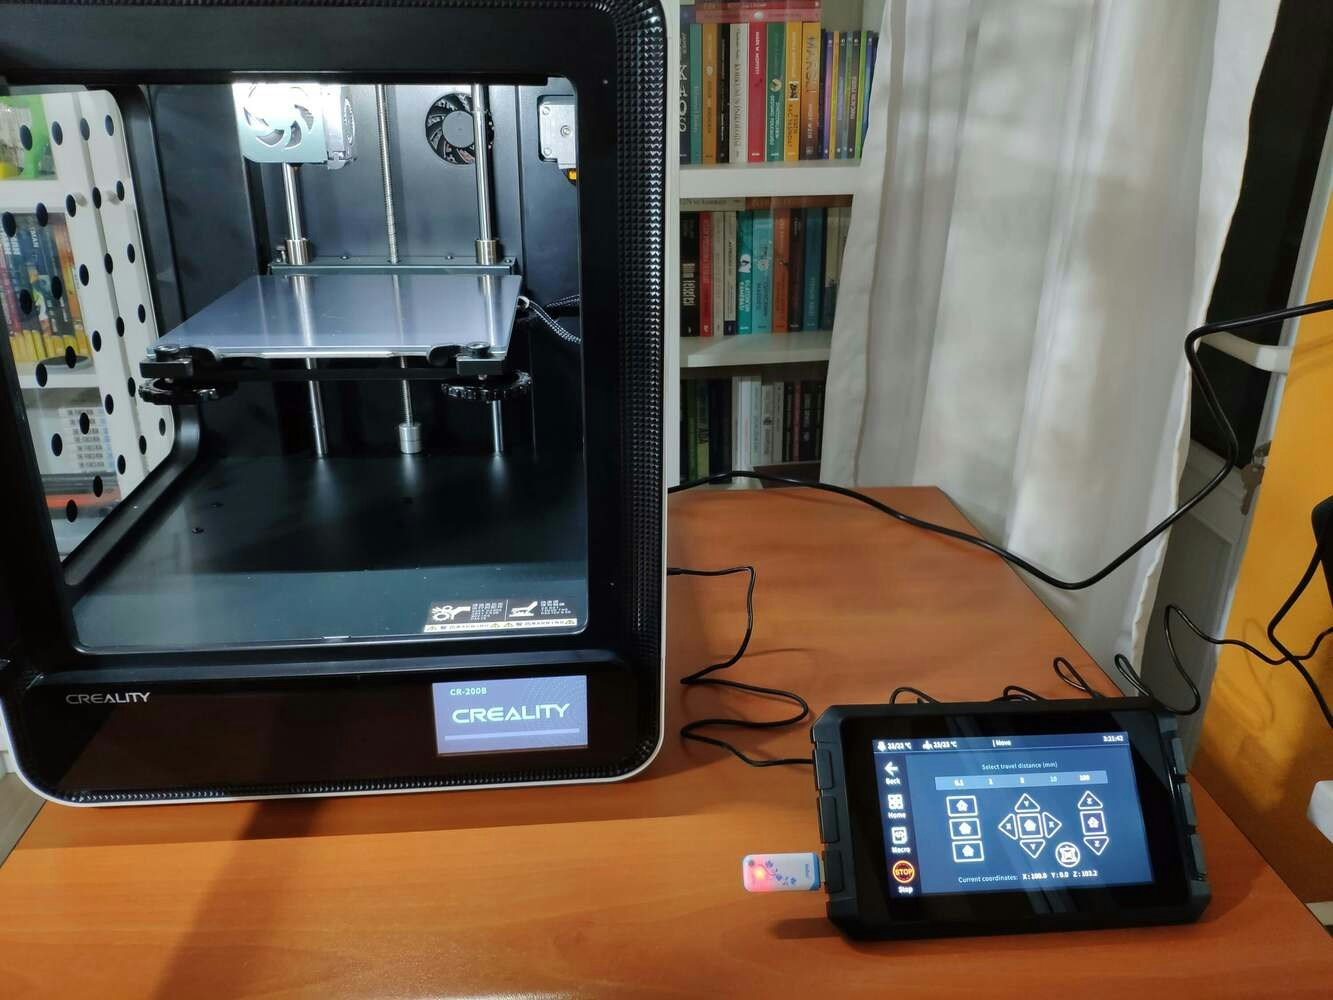 :hash: In Cura, export the sliced model in the *ufp* format. After uploading *.ufp* files to the Sonic Pad via the USB drive, it converts them to sliced G-code files automatically.
:hash: Also, the Sonic Pad can display model preview pictures generated by Cura with the *Create Thumbnail* script.
## Step 1.2: Assembling the case and making connections & adjustments
```
// Connections
// FireBeetle ESP32 :
// Arduino Mega
// D4 --------------------------- D18 (RX1)
// D2 --------------------------- D19 (TX1)
&
&
&
// Connections
// Arduino Mega :
// FireBeetle ESP32
// D18 --------------------------- D4
// D19 --------------------------- D2
// DFRobot Gravity: Electrochemical Ozone Sensor
// D20 --------------------------- SDA
// D21 --------------------------- SCL
// DFRobot Gravity: Electrochemical Nitrogen Dioxide Sensor
// D20 --------------------------- SDA
// D21 --------------------------- SCL
// SH1106 OLED Display (128x64)
// D23 --------------------------- SDA
// D22 --------------------------- SCK
// D24 --------------------------- RST
// D25 --------------------------- DC
// D26 --------------------------- CS
// DHT22 Temperature and Humidity Sensor
// D27 --------------------------- DATA
// DFRobot Anemometer Kit
// A0 --------------------------- S (Yellow)
// Keyes 10mm RGB LED Module (140C05)
// D2 --------------------------- R
// D3 --------------------------- G
// D4 --------------------------- B
// Control Button (A)
// D5 --------------------------- +
// Control Button (B)
// D6 --------------------------- +
// Control Button (C)
// D7 --------------------------- +
```
First of all, I soldered female pin headers to [FireBeetle ESP32](https://wiki.dfrobot.com/FireBeetle_ESP32_IOT_Microcontroller\(V3.0\)__Supports_Wi-Fi_&_Bluetooth__SKU__DFR0478) and male pin headers to [the FireBeetle (Covers) media board](https://wiki.dfrobot.com/FireBeetle_Covers-Camera%26Audio_Media_Board_SKU_DFR0498) before attaching the OV7725 camera.
:hash: In Cura, export the sliced model in the *ufp* format. After uploading *.ufp* files to the Sonic Pad via the USB drive, it converts them to sliced G-code files automatically.
:hash: Also, the Sonic Pad can display model preview pictures generated by Cura with the *Create Thumbnail* script.
## Step 1.2: Assembling the case and making connections & adjustments
```
// Connections
// FireBeetle ESP32 :
// Arduino Mega
// D4 --------------------------- D18 (RX1)
// D2 --------------------------- D19 (TX1)
&
&
&
// Connections
// Arduino Mega :
// FireBeetle ESP32
// D18 --------------------------- D4
// D19 --------------------------- D2
// DFRobot Gravity: Electrochemical Ozone Sensor
// D20 --------------------------- SDA
// D21 --------------------------- SCL
// DFRobot Gravity: Electrochemical Nitrogen Dioxide Sensor
// D20 --------------------------- SDA
// D21 --------------------------- SCL
// SH1106 OLED Display (128x64)
// D23 --------------------------- SDA
// D22 --------------------------- SCK
// D24 --------------------------- RST
// D25 --------------------------- DC
// D26 --------------------------- CS
// DHT22 Temperature and Humidity Sensor
// D27 --------------------------- DATA
// DFRobot Anemometer Kit
// A0 --------------------------- S (Yellow)
// Keyes 10mm RGB LED Module (140C05)
// D2 --------------------------- R
// D3 --------------------------- G
// D4 --------------------------- B
// Control Button (A)
// D5 --------------------------- +
// Control Button (B)
// D6 --------------------------- +
// Control Button (C)
// D7 --------------------------- +
```
First of all, I soldered female pin headers to [FireBeetle ESP32](https://wiki.dfrobot.com/FireBeetle_ESP32_IOT_Microcontroller\(V3.0\)__Supports_Wi-Fi_&_Bluetooth__SKU__DFR0478) and male pin headers to [the FireBeetle (Covers) media board](https://wiki.dfrobot.com/FireBeetle_Covers-Camera%26Audio_Media_Board_SKU_DFR0498) before attaching the OV7725 camera.
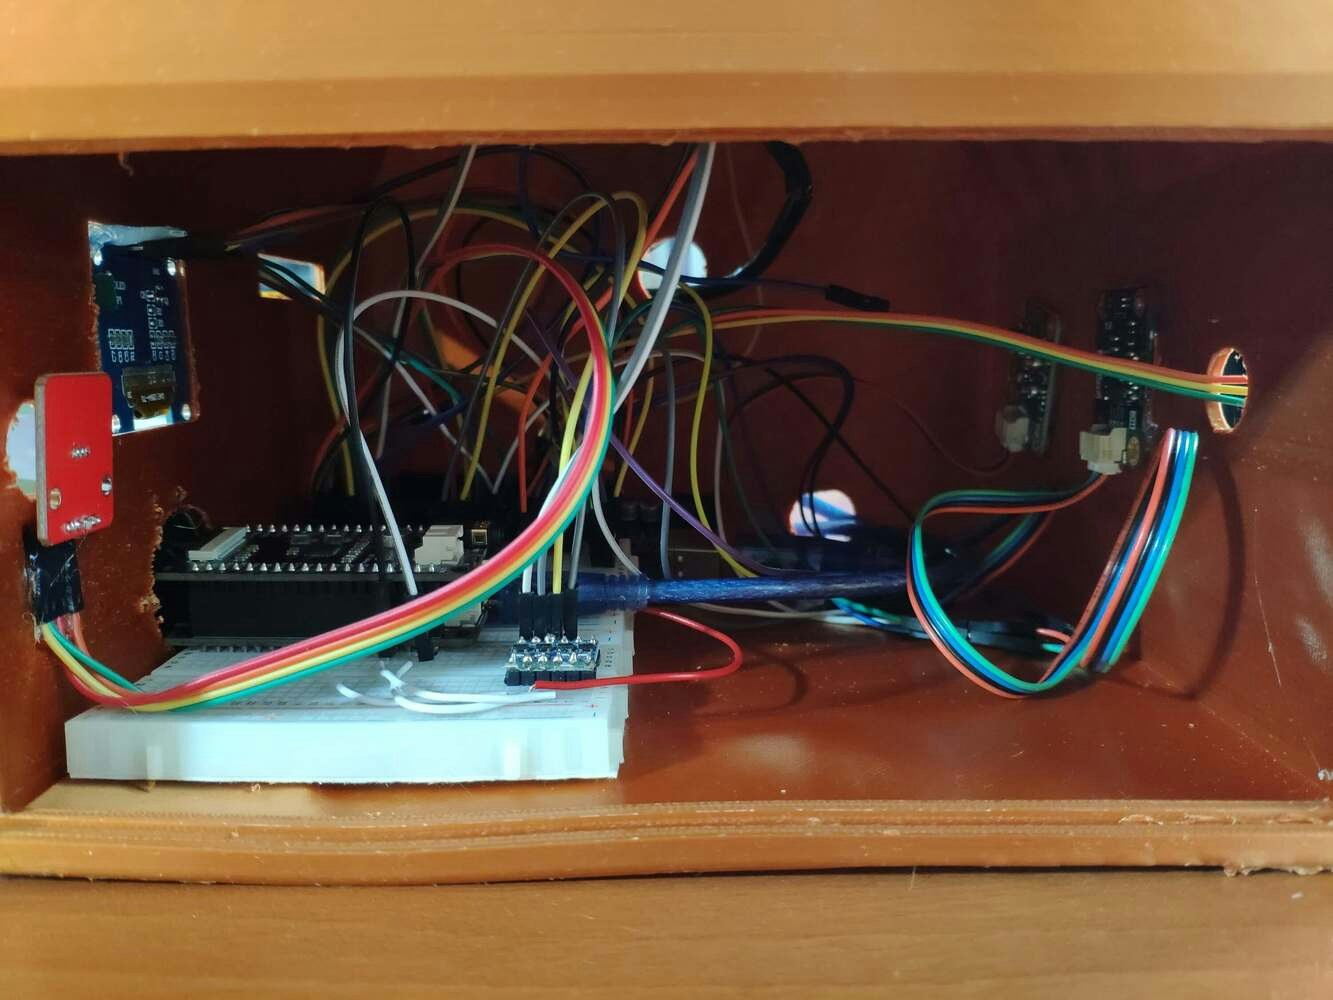
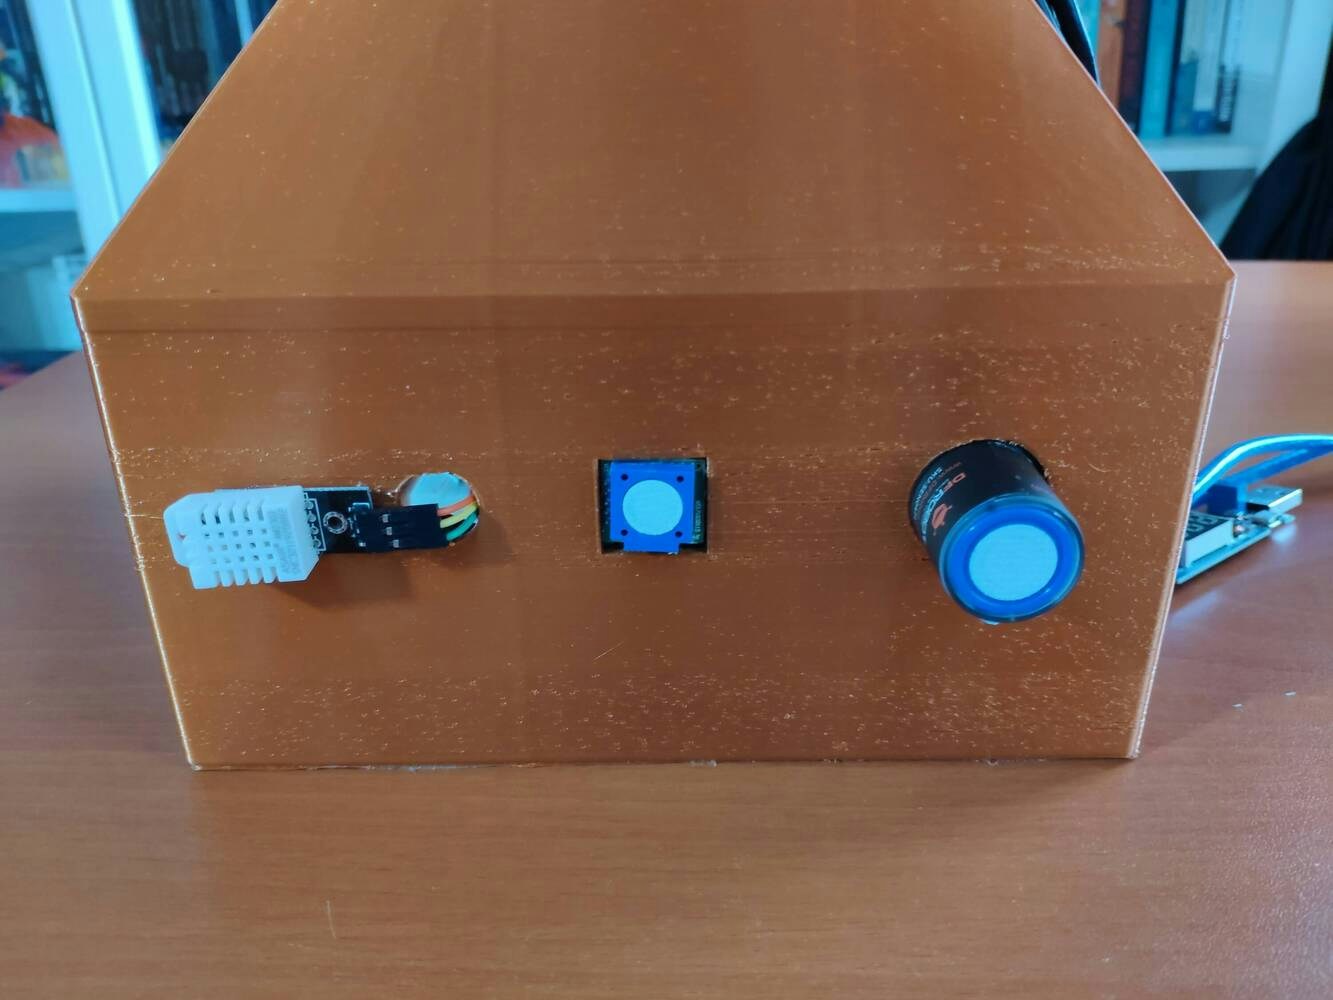
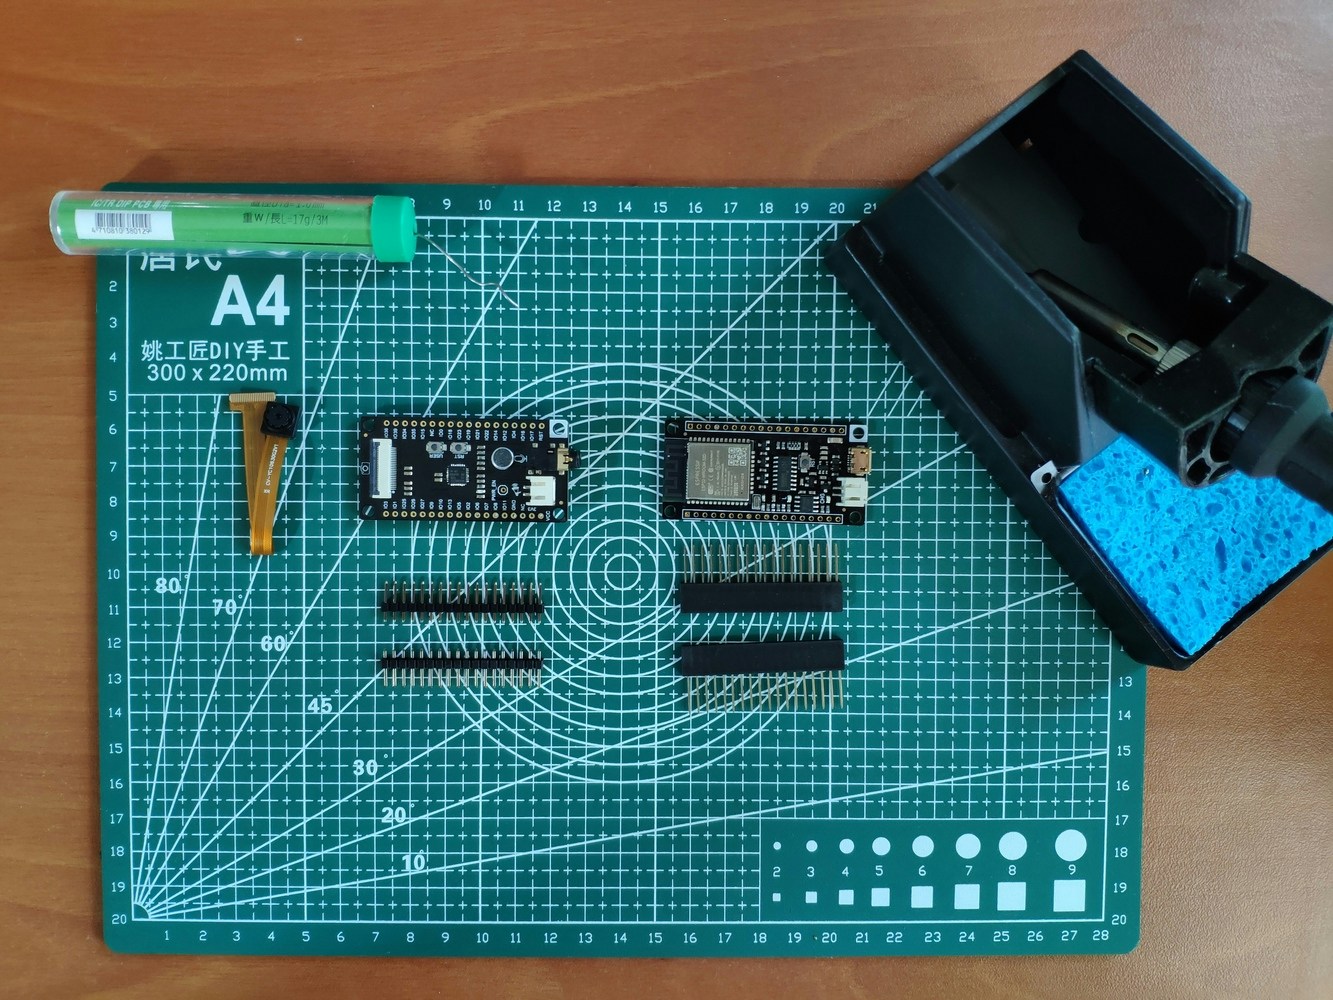 Due to the Arduino library incompatibilities and the memory allocation issues, I decided to connect the electrochemical NO2 sensor, the electrochemical ozone sensor, the anemometer kit, and the DHT22 sensor to Arduino Mega so as to collect the required air quality data. Then, I utilized Arduino Mega to transmit the collected air quality data to FireBeetle ESP32 via serial communication.
:hash: When [the electrochemical NO2 sensor](https://wiki.dfrobot.com/SKU_SEN0465toSEN0476_Gravity_Gas_Sensor_Calibrated_I2C_UART) and [the electrochemical ozone sensor](https://wiki.dfrobot.com/Gravity_IIC_Ozone_Sensor_\(0-10ppm\)%20SKU_SEN0321) are powered up for the first time, both sensors require operating for about 24-48 hours to generate calibrated and stable gas concentrations. In my case, I was able to obtain stable results after 30 hours of warming up. Although the electrochemical sensors need to be calibrated once, they have a preheat (warm-up) time of about 5 minutes to evaluate gas concentrations accurately after being interrupted.
Due to the Arduino library incompatibilities and the memory allocation issues, I decided to connect the electrochemical NO2 sensor, the electrochemical ozone sensor, the anemometer kit, and the DHT22 sensor to Arduino Mega so as to collect the required air quality data. Then, I utilized Arduino Mega to transmit the collected air quality data to FireBeetle ESP32 via serial communication.
:hash: When [the electrochemical NO2 sensor](https://wiki.dfrobot.com/SKU_SEN0465toSEN0476_Gravity_Gas_Sensor_Calibrated_I2C_UART) and [the electrochemical ozone sensor](https://wiki.dfrobot.com/Gravity_IIC_Ozone_Sensor_\(0-10ppm\)%20SKU_SEN0321) are powered up for the first time, both sensors require operating for about 24-48 hours to generate calibrated and stable gas concentrations. In my case, I was able to obtain stable results after 30 hours of warming up. Although the electrochemical sensors need to be calibrated once, they have a preheat (warm-up) time of about 5 minutes to evaluate gas concentrations accurately after being interrupted.
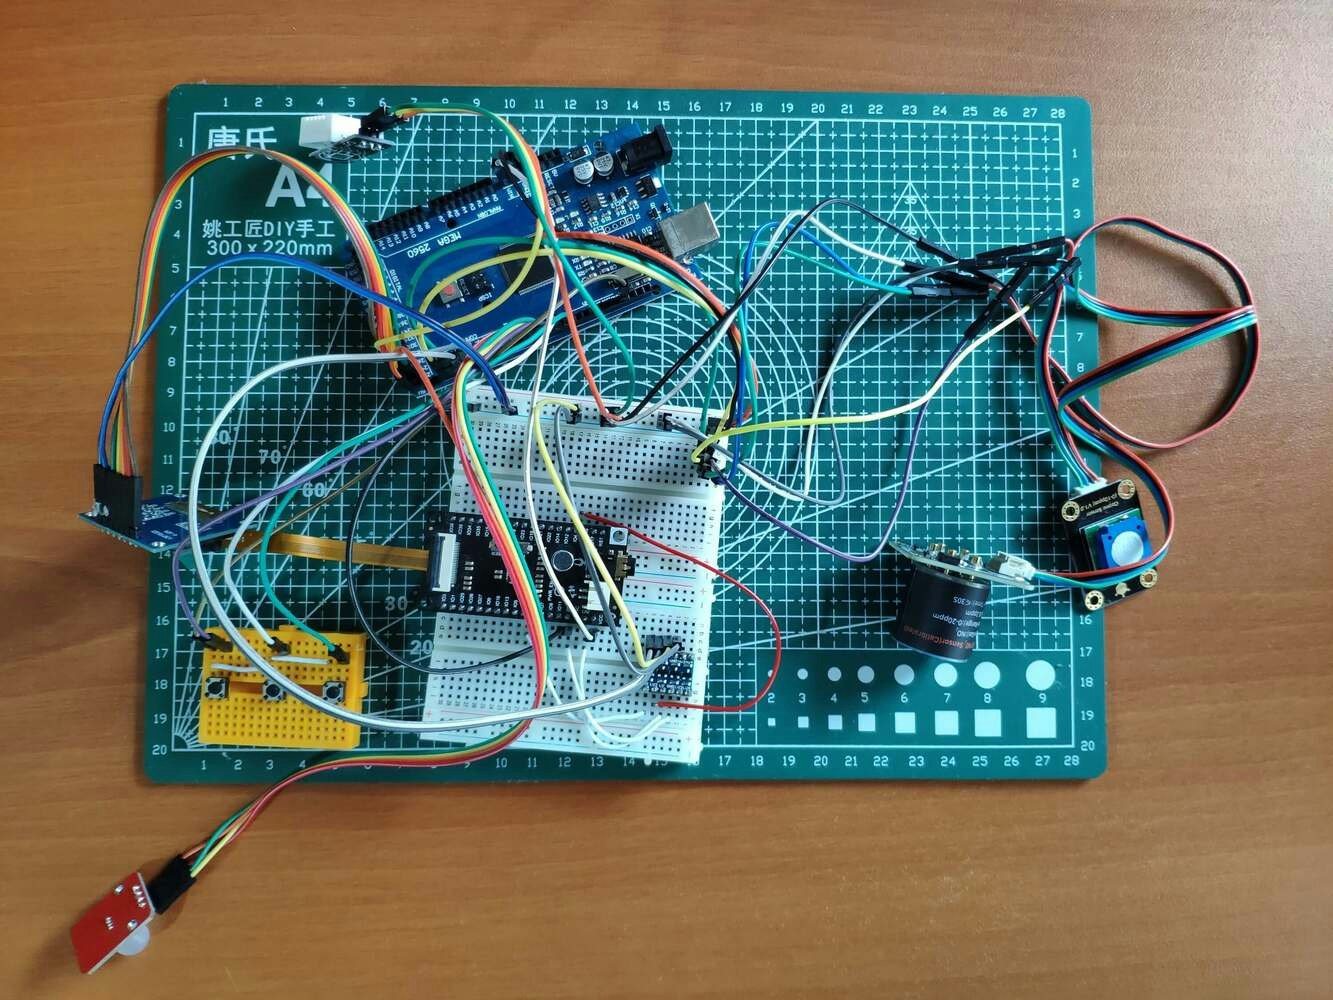 :hash: Since [the anemometer kit](https://wiki.dfrobot.com/Wind_Speed_Sensor_Voltage_Type_0-5V__SKU_SEN0170) requires a 9-24V supply voltage and generates a 0-5V output voltage (signal), I connected a USB buck-boost converter board to my Xiaomi power bank to elicit a stable 20V supply voltage to power the anemometer.
Since Arduino Mega operates at 5V and FireBeetle ESP32 requires 3.3V logic level voltage, they cannot be connected with each other directly. Therefore, I utilized a bi-directional logic level converter to shift the voltage for the connections between FireBeetle ESP32 and Arduino Mega.
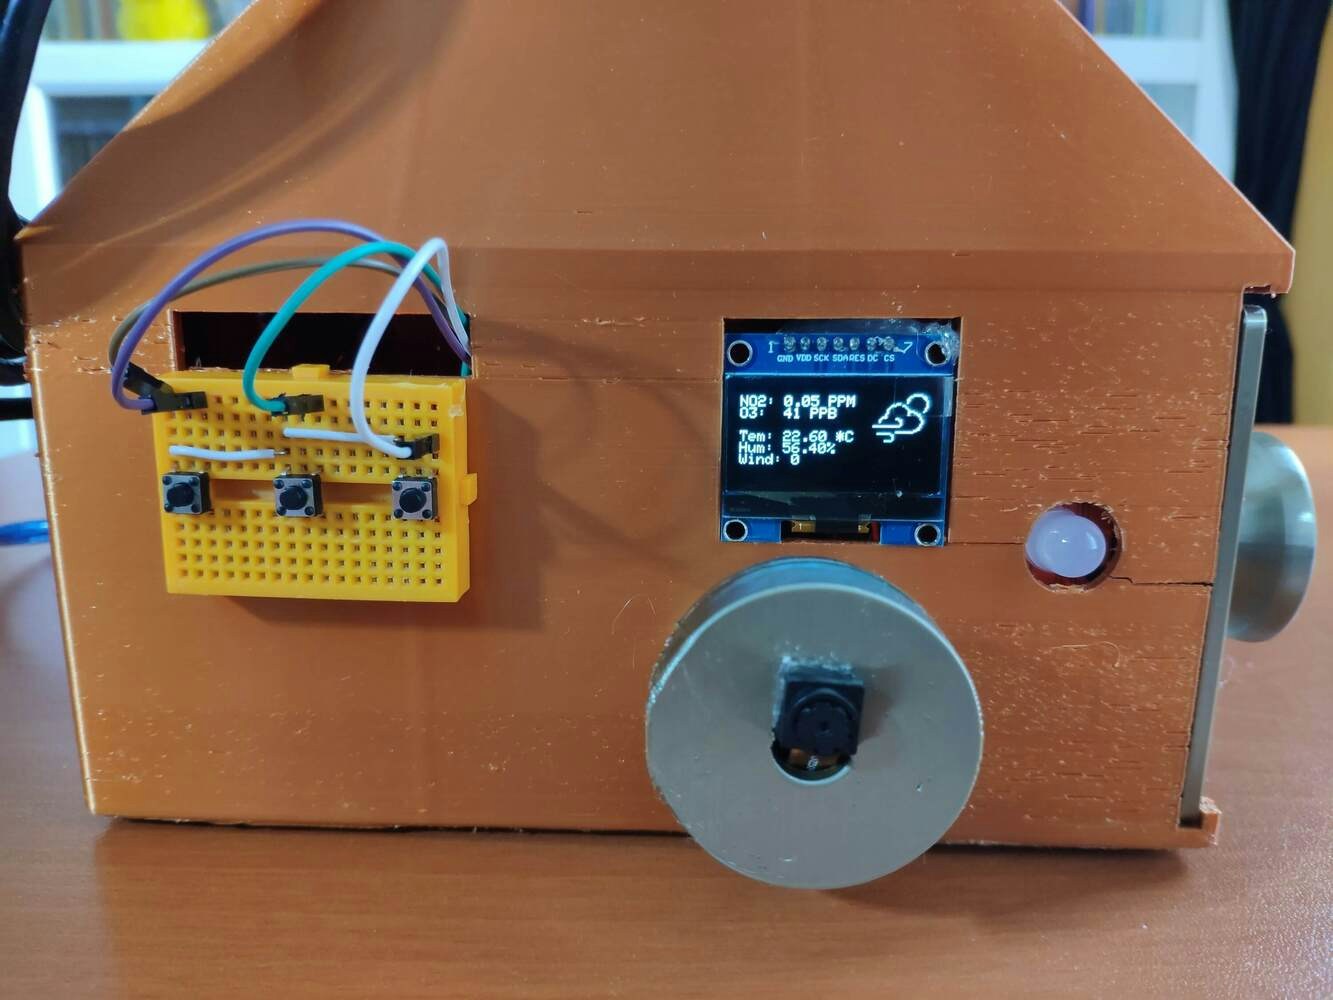
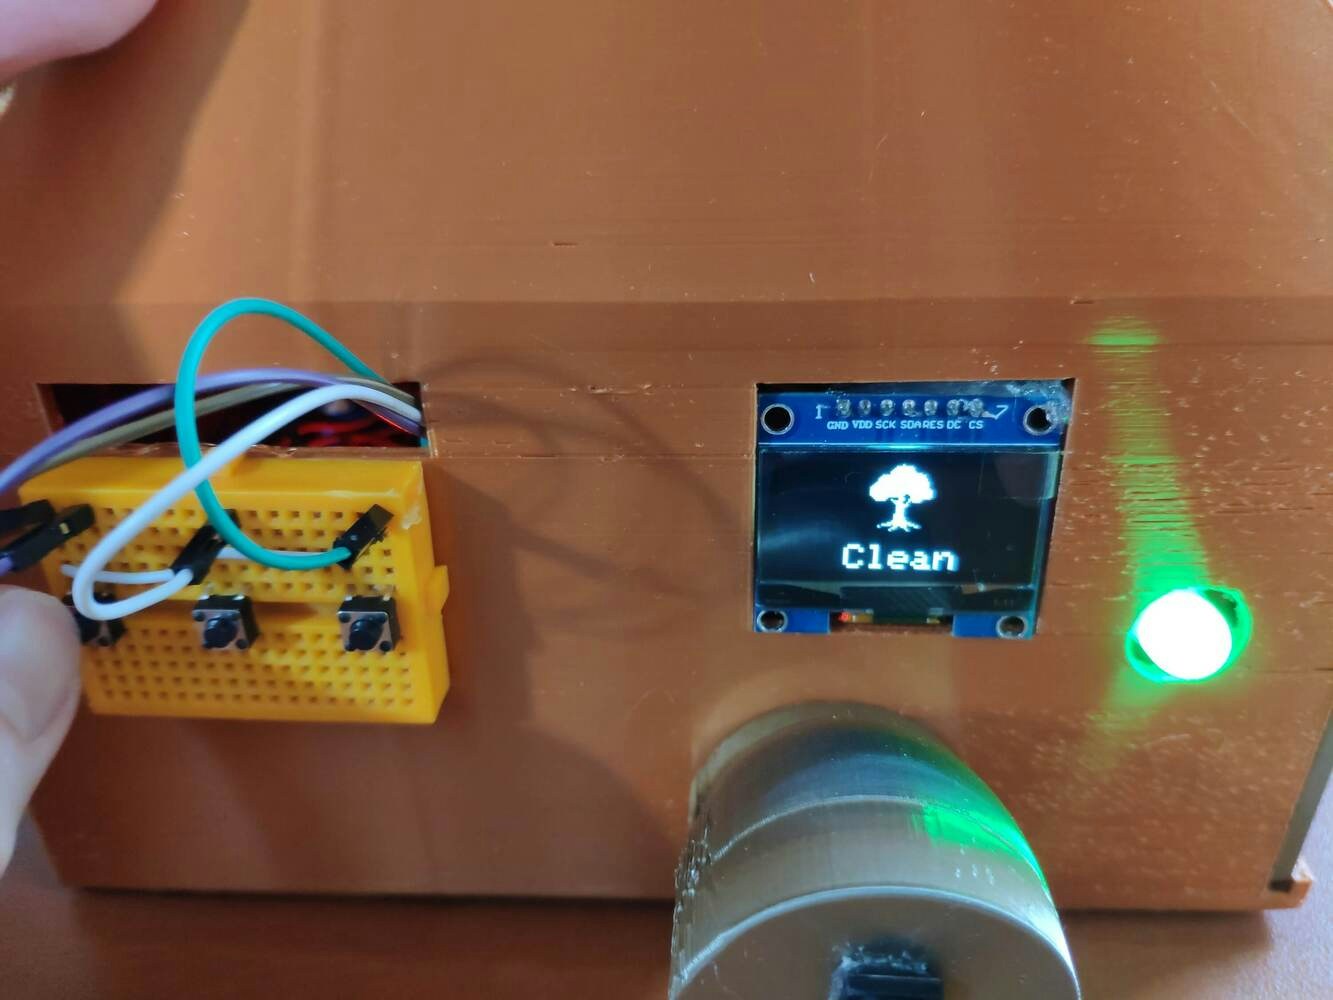
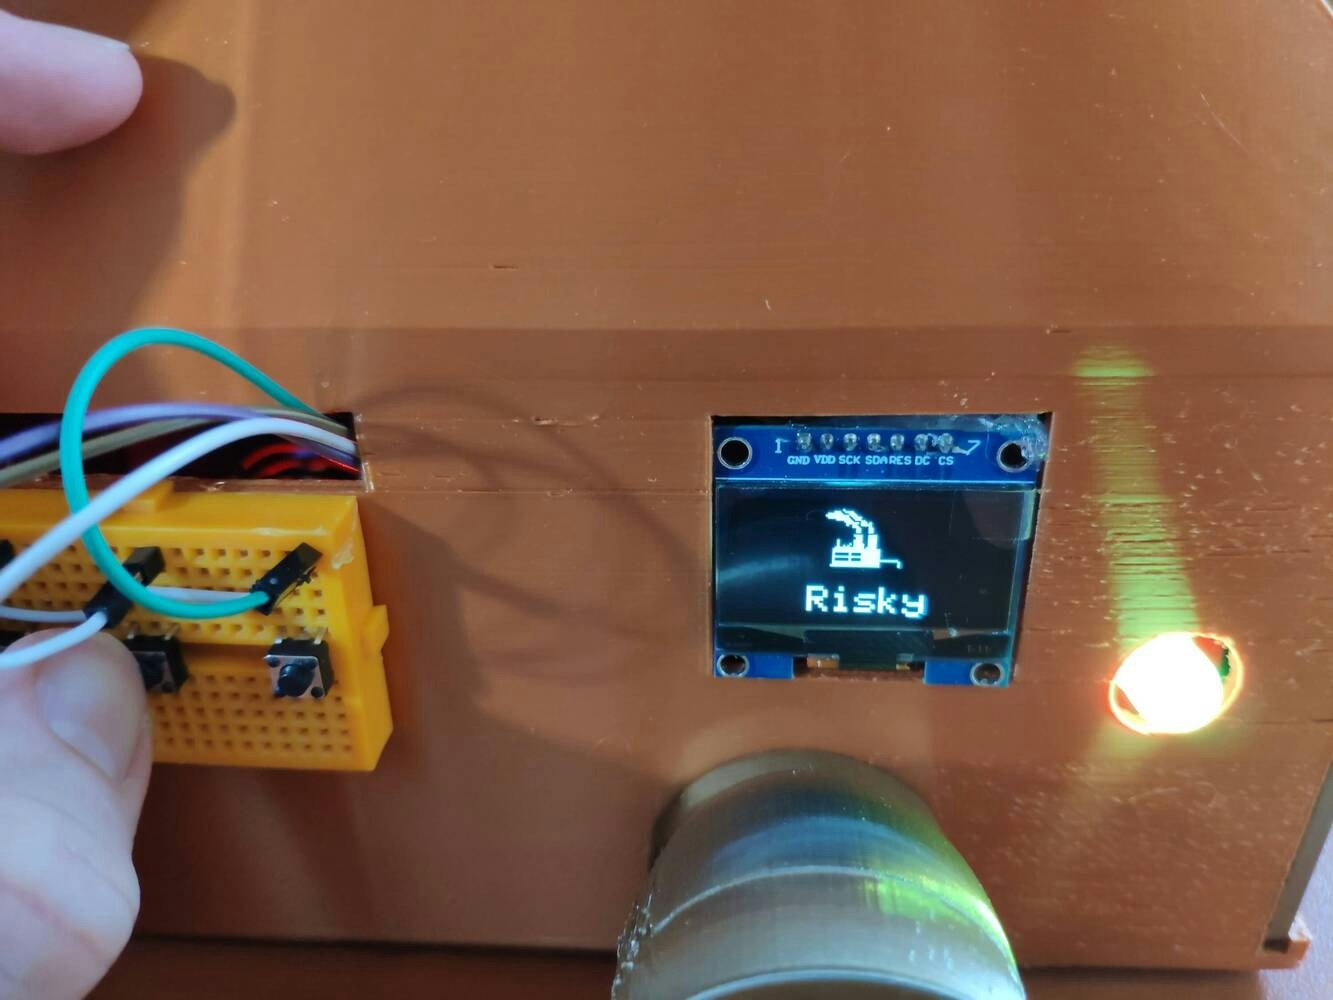
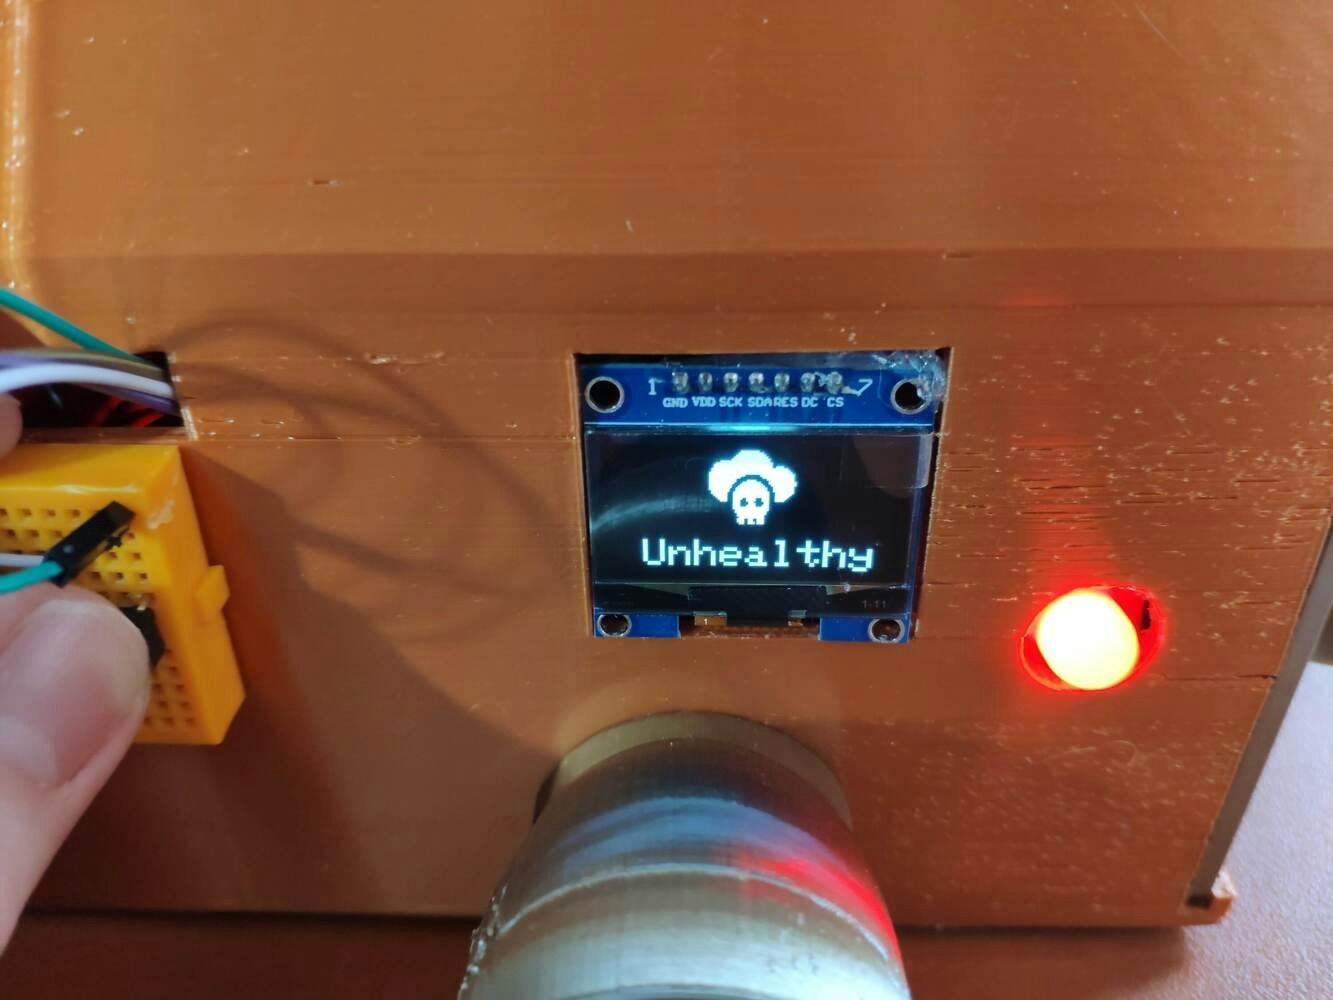
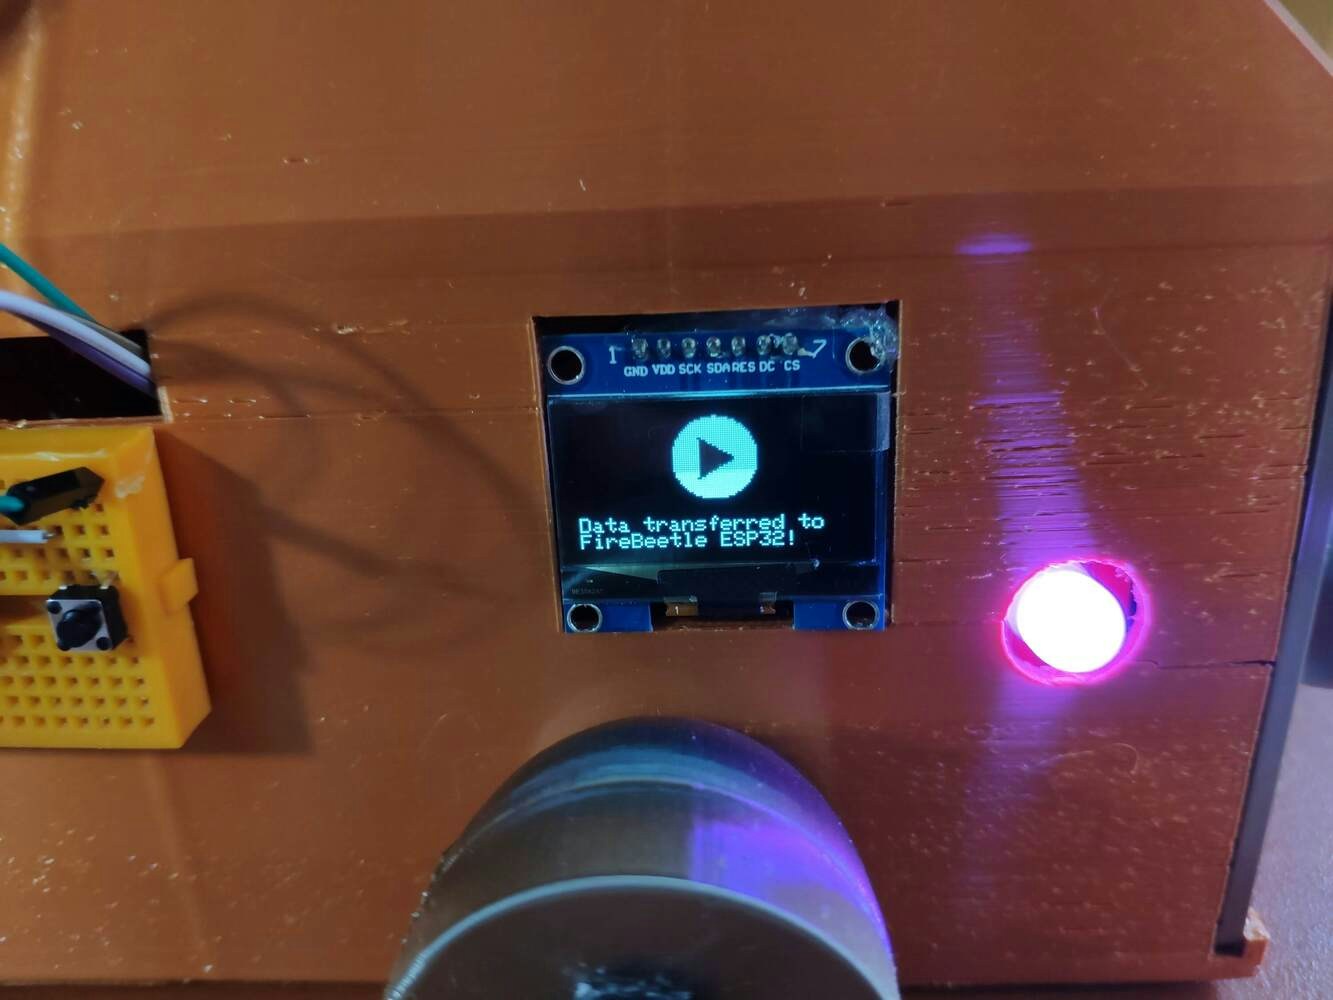
To display the collected information and notifications, I utilized an SH1106 OLED screen. To assign air pollution levels empirically while saving the collected data to individual CSV files on the SD card, I used the built-in MicroSD card module on the media board and added three control buttons.
:hash: Since [the anemometer kit](https://wiki.dfrobot.com/Wind_Speed_Sensor_Voltage_Type_0-5V__SKU_SEN0170) requires a 9-24V supply voltage and generates a 0-5V output voltage (signal), I connected a USB buck-boost converter board to my Xiaomi power bank to elicit a stable 20V supply voltage to power the anemometer.
Since Arduino Mega operates at 5V and FireBeetle ESP32 requires 3.3V logic level voltage, they cannot be connected with each other directly. Therefore, I utilized a bi-directional logic level converter to shift the voltage for the connections between FireBeetle ESP32 and Arduino Mega.
To display the collected information and notifications, I utilized an SH1106 OLED screen. To assign air pollution levels empirically while saving the collected data to individual CSV files on the SD card, I used the built-in MicroSD card module on the media board and added three control buttons.
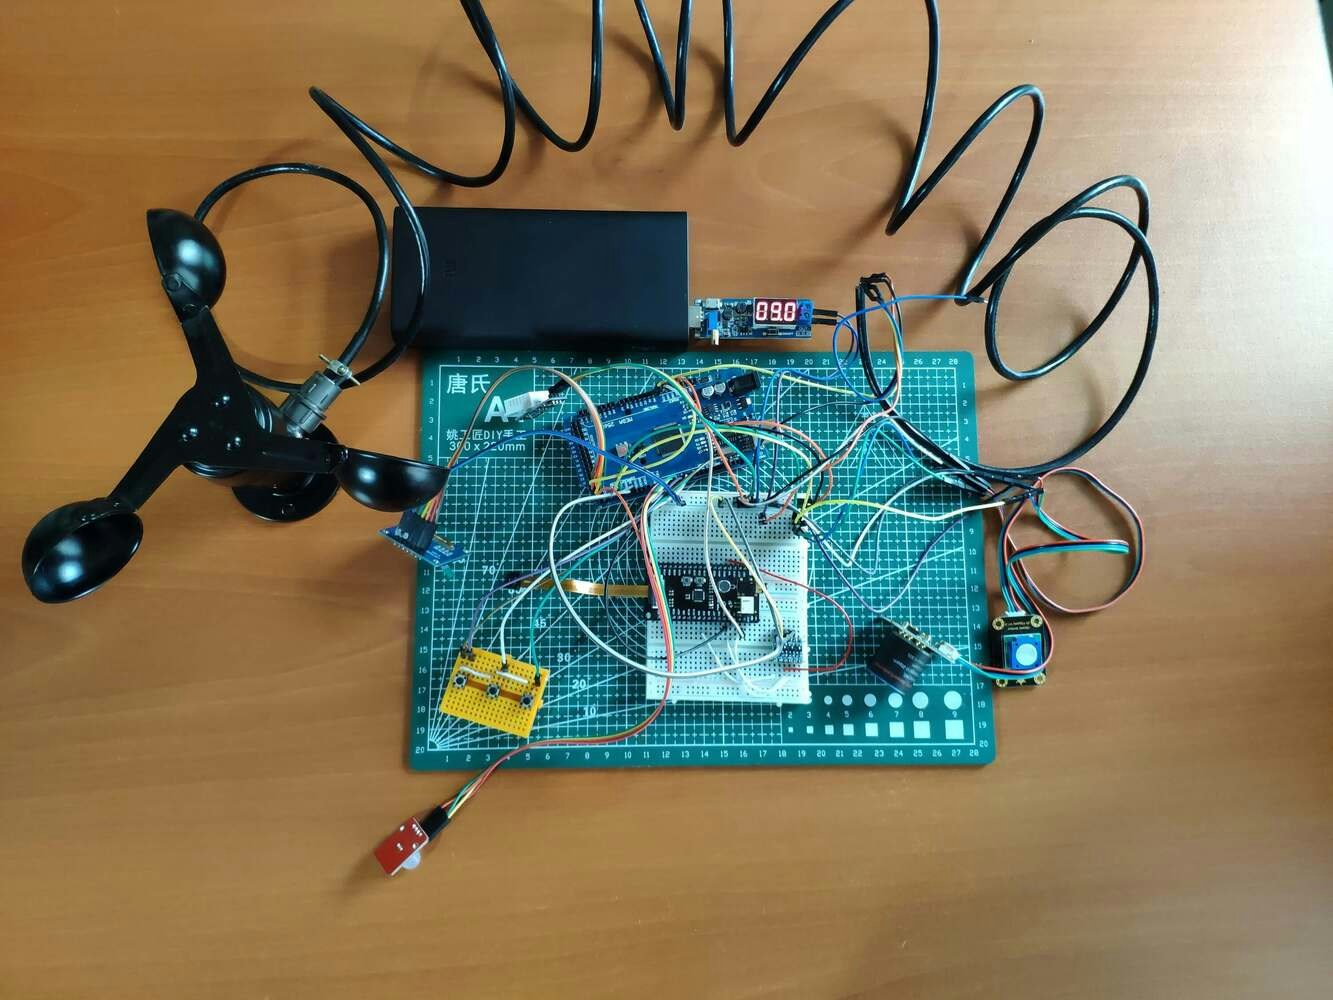 After printing all parts (models), I fastened all components except the OV7725 camera to their corresponding slots on the metallic air station case via a hot glue gun. I also utilized the anemometer's screw kit to attach it more tightly to its connection points on the top of the metallic case.
I placed the OV7725 camera in the mountable camera holder and attached the camera holder to the metallic case via its snap-fit joints.
Then, I placed the sliding front cover via the dents on the metallic case.
After printing all parts (models), I fastened all components except the OV7725 camera to their corresponding slots on the metallic air station case via a hot glue gun. I also utilized the anemometer's screw kit to attach it more tightly to its connection points on the top of the metallic case.
I placed the OV7725 camera in the mountable camera holder and attached the camera holder to the metallic case via its snap-fit joints.
Then, I placed the sliding front cover via the dents on the metallic case.
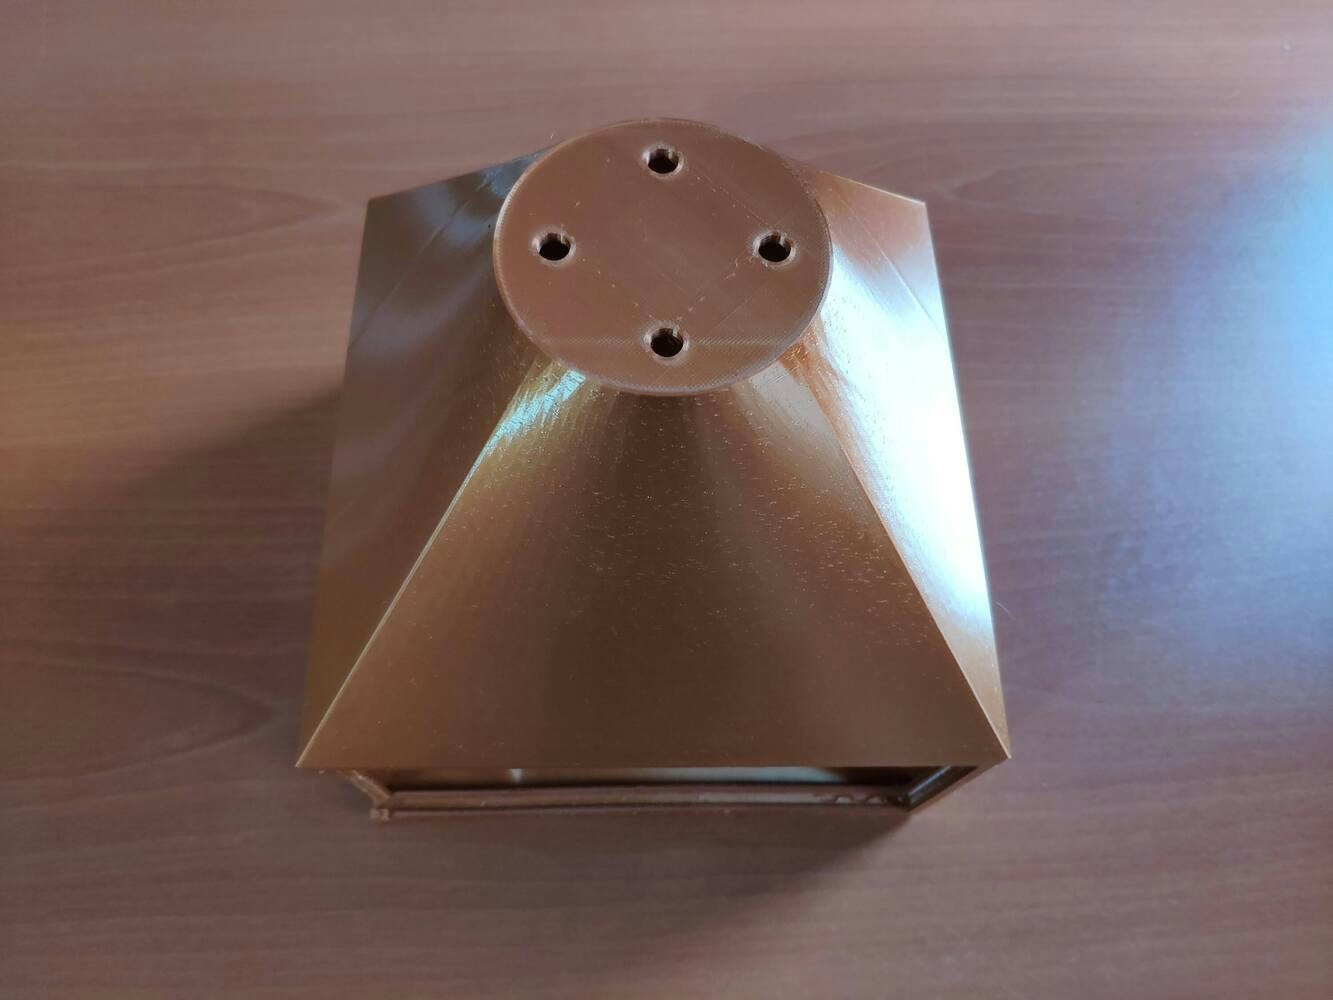
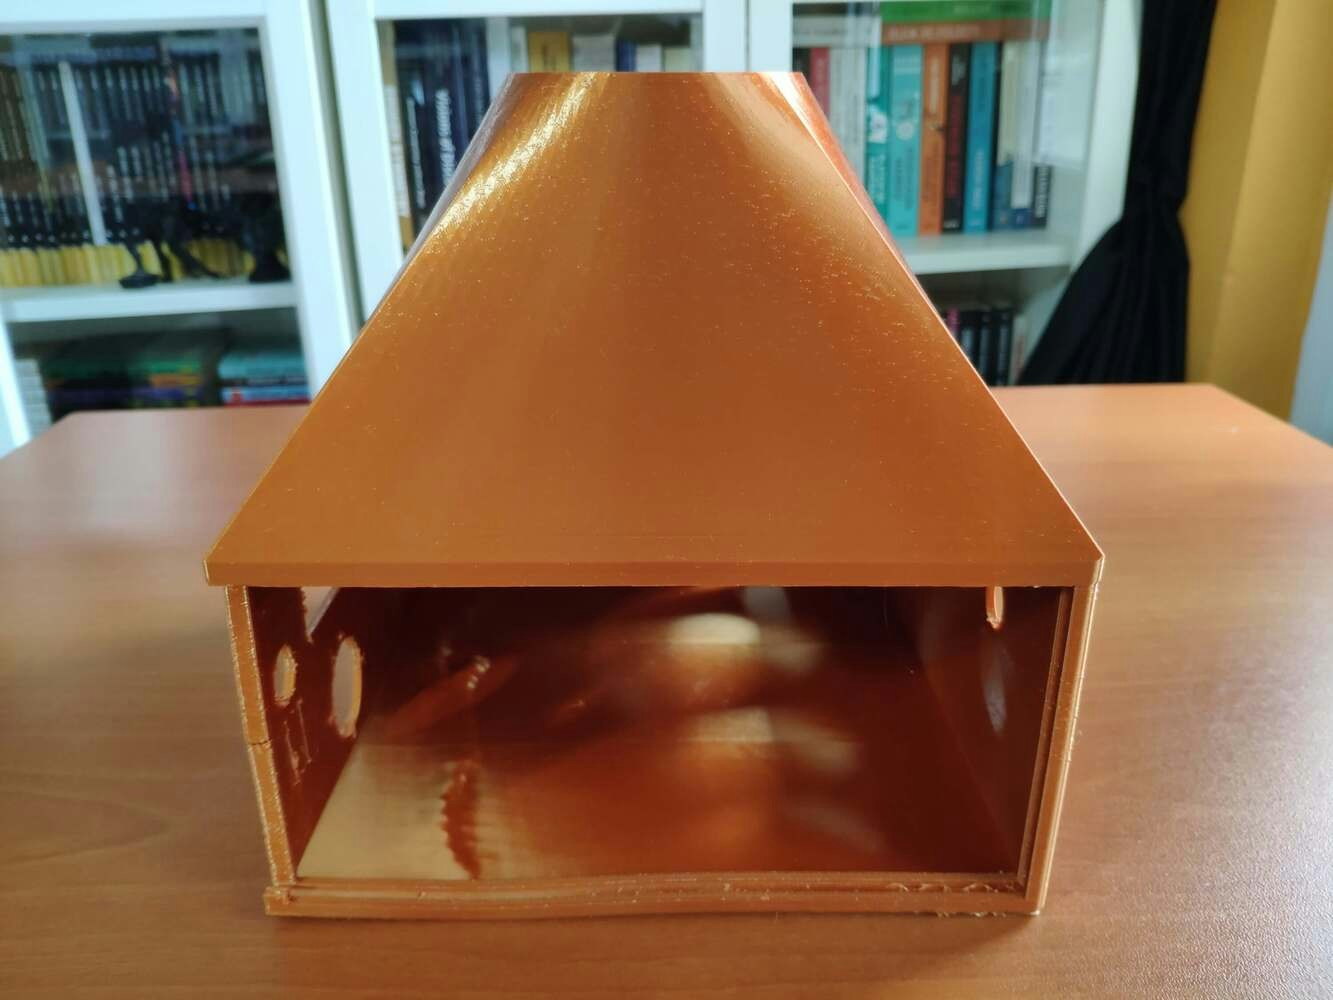
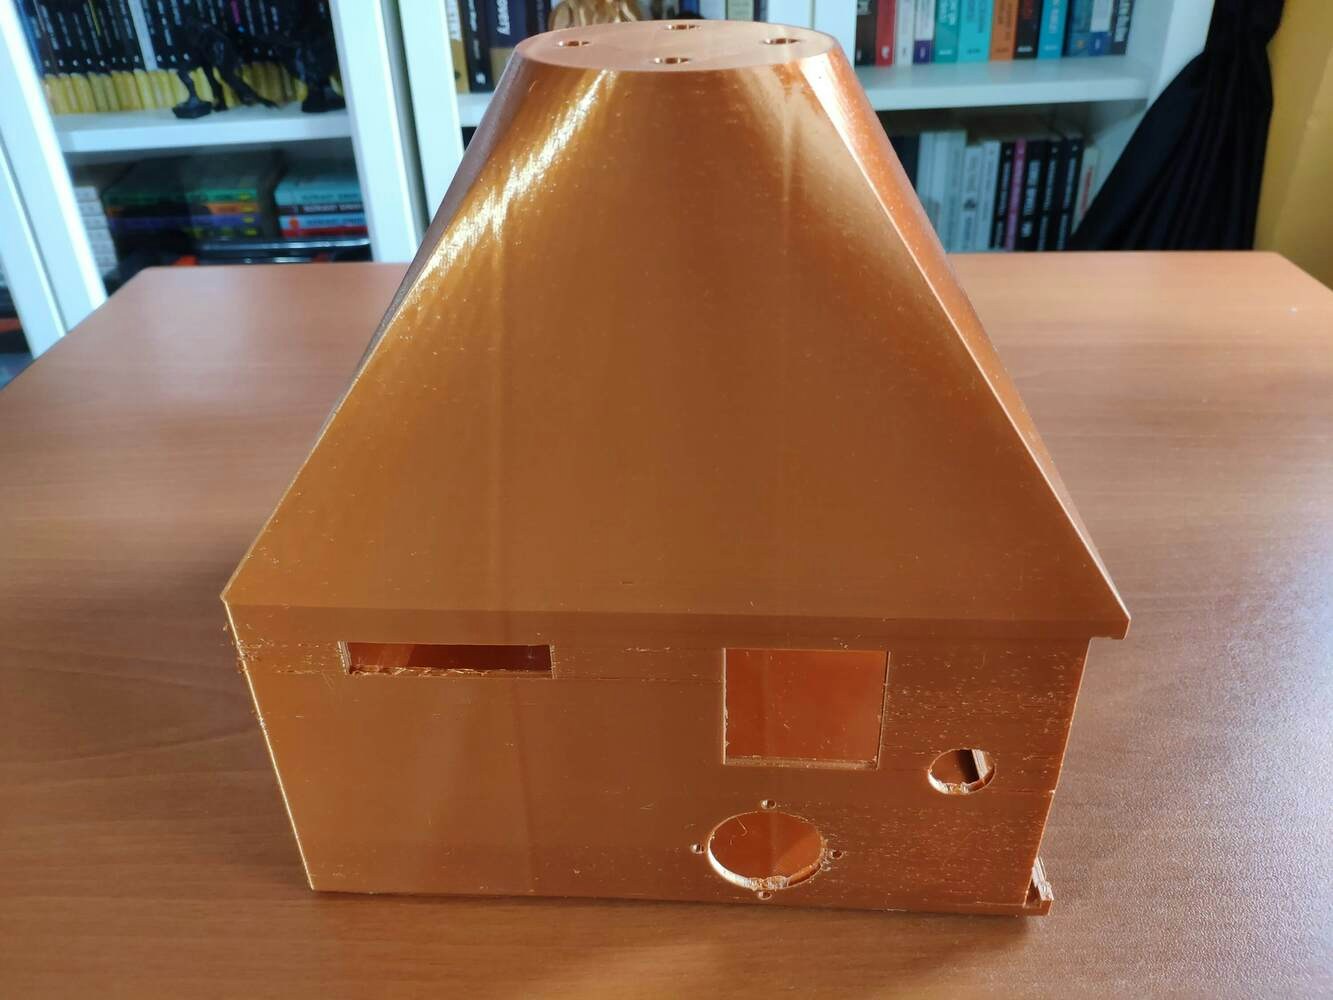
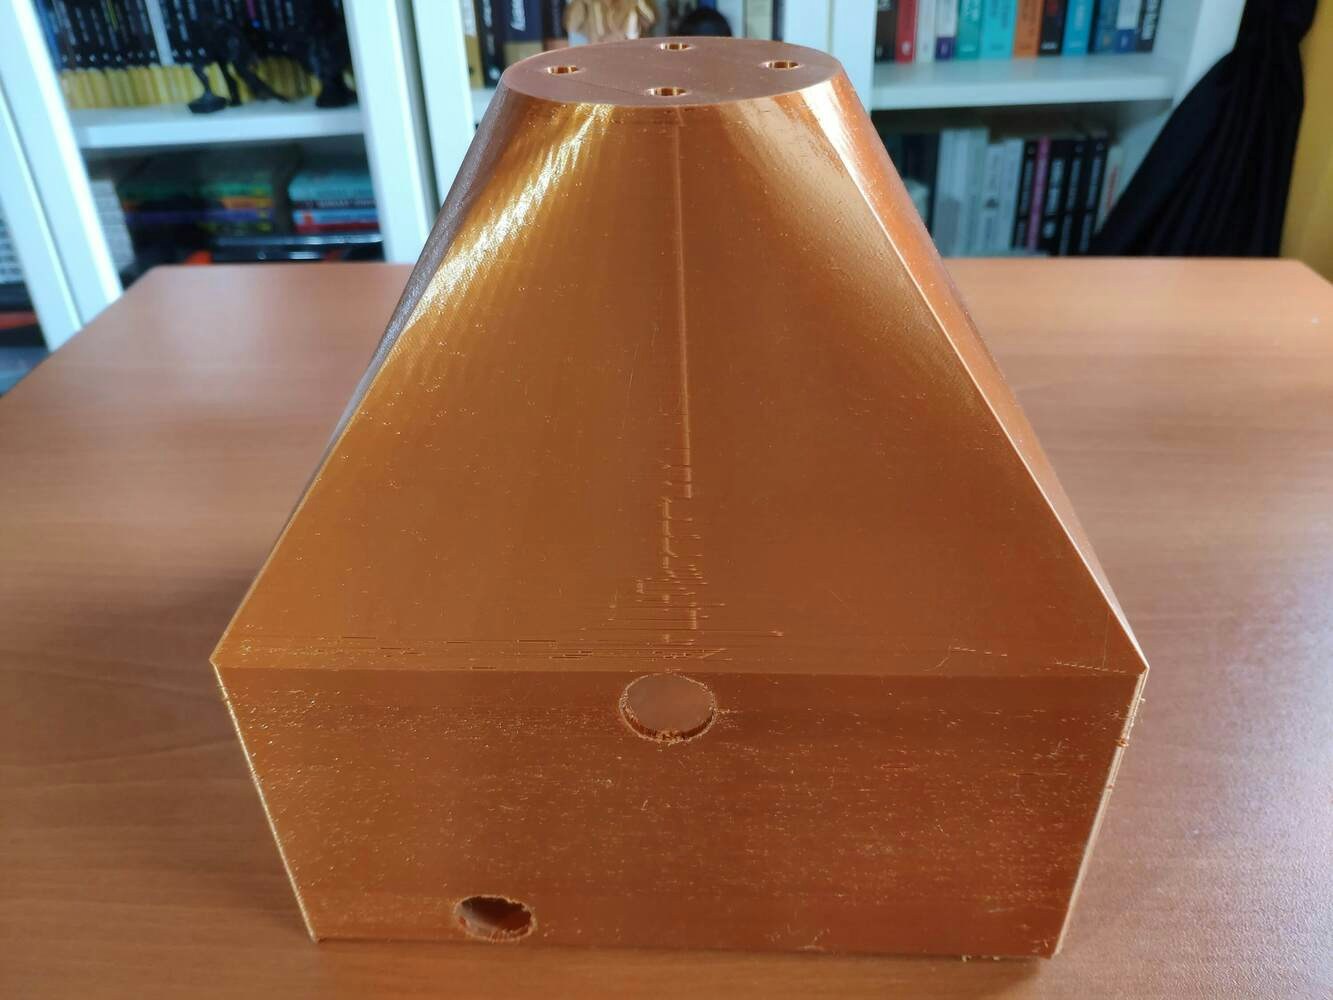
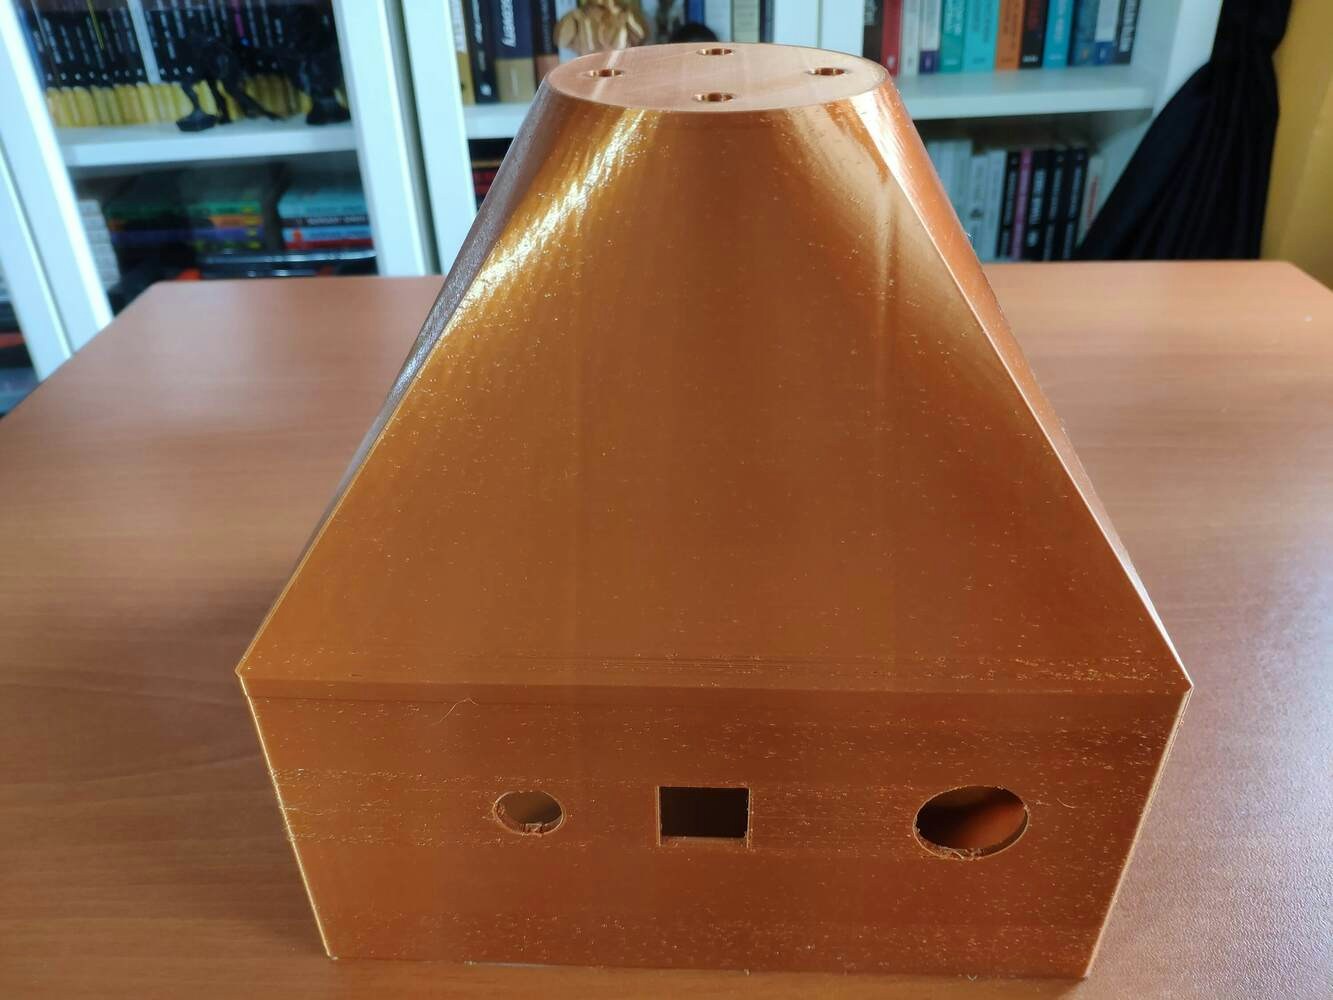
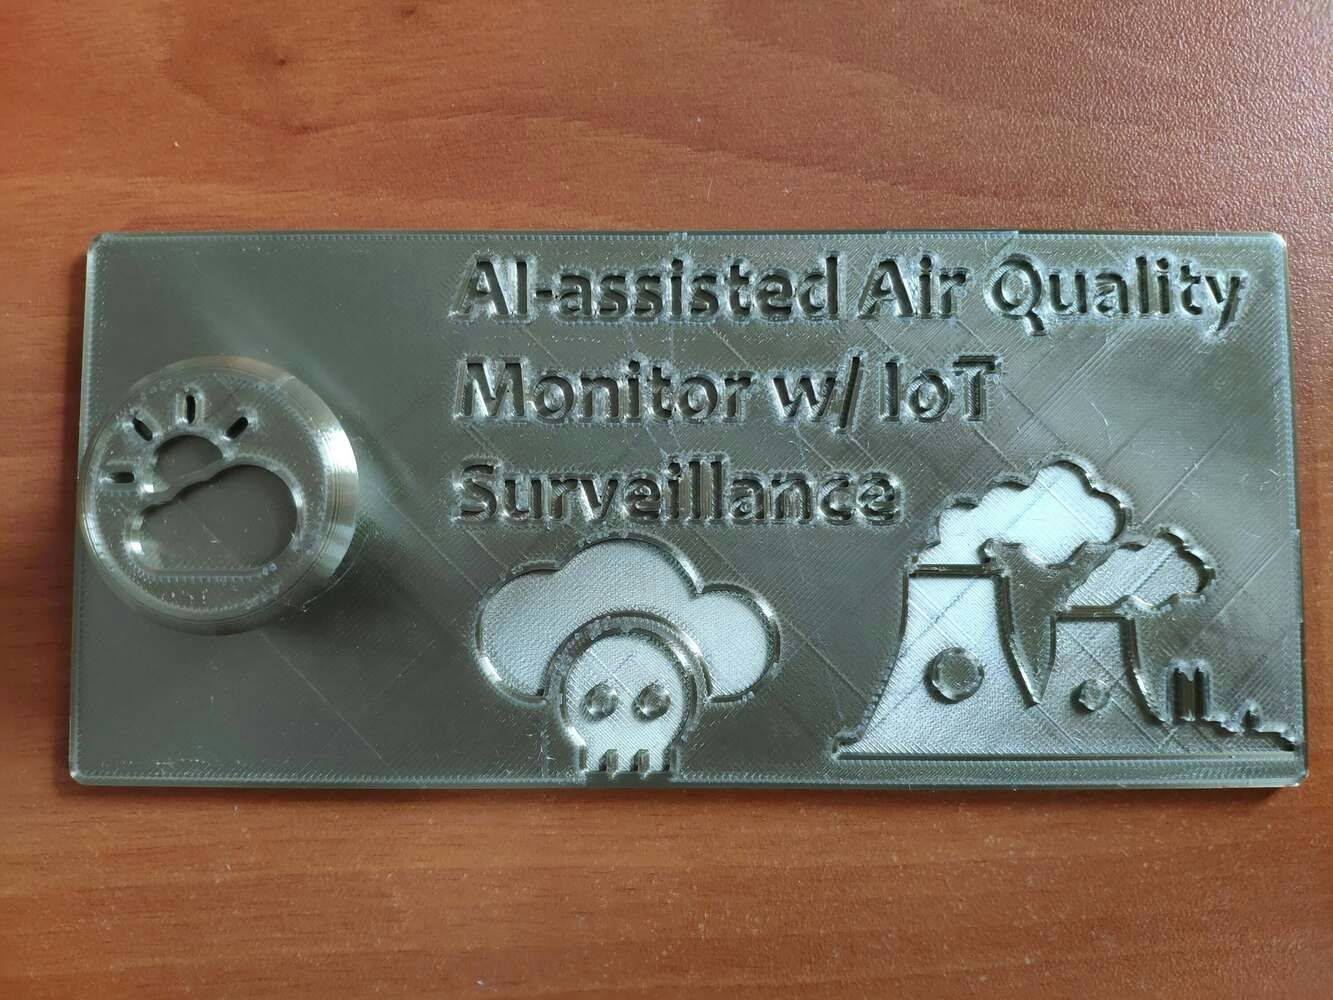
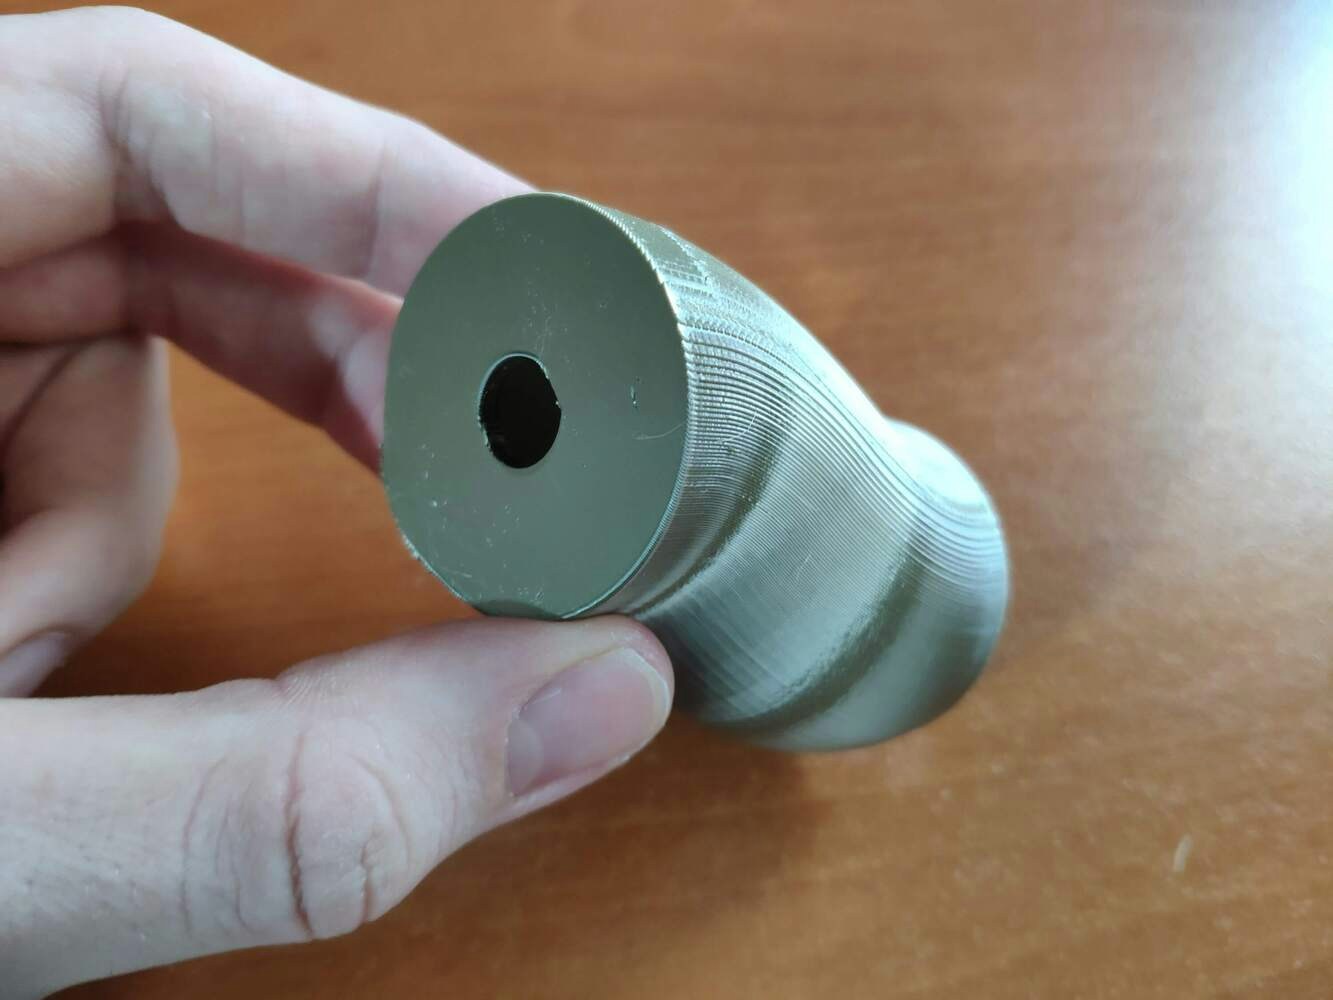
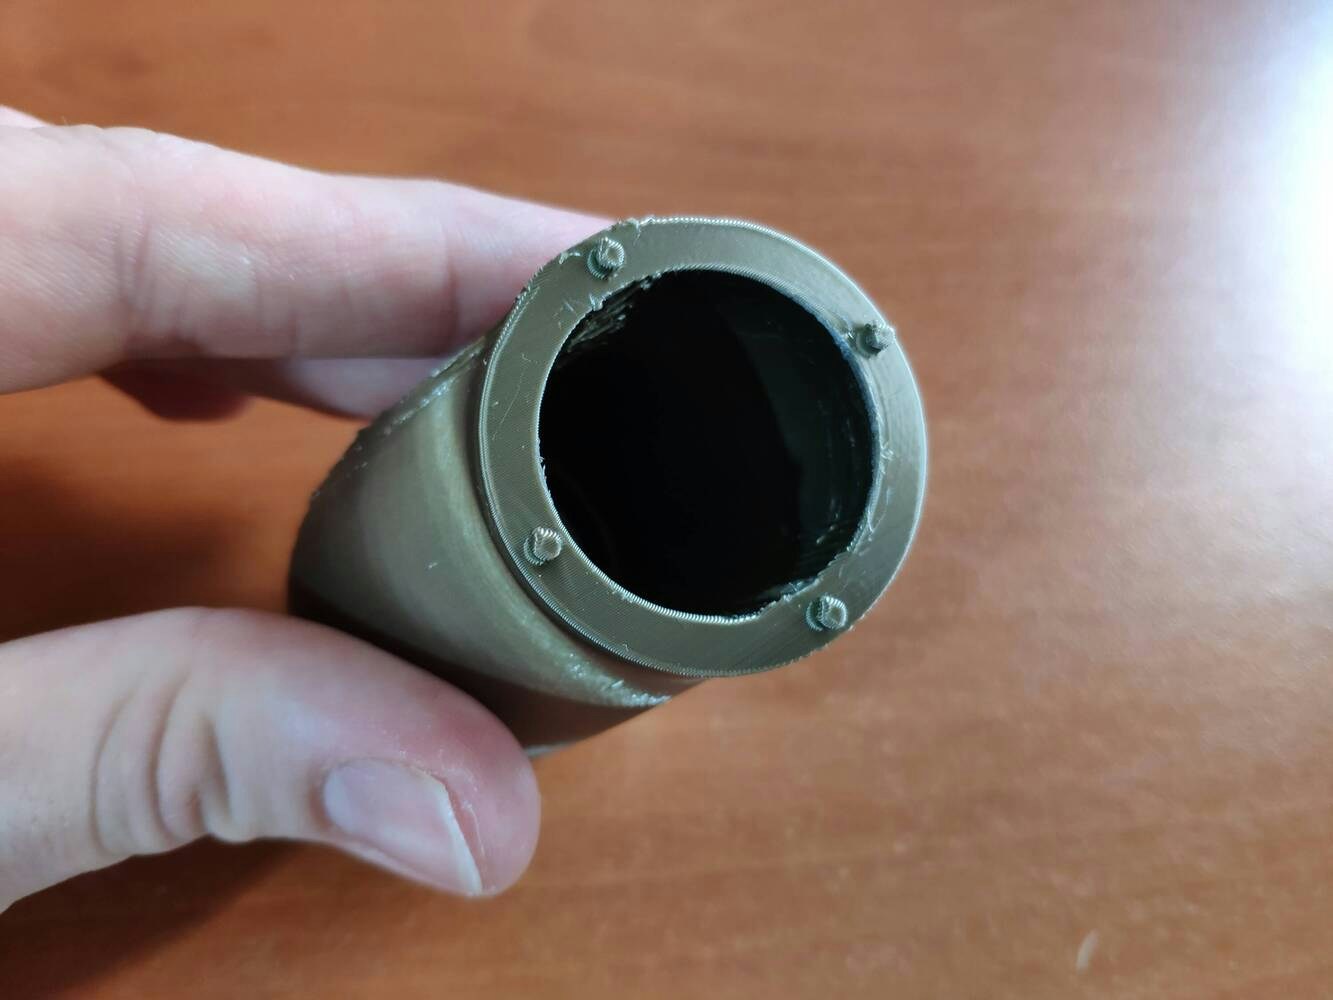
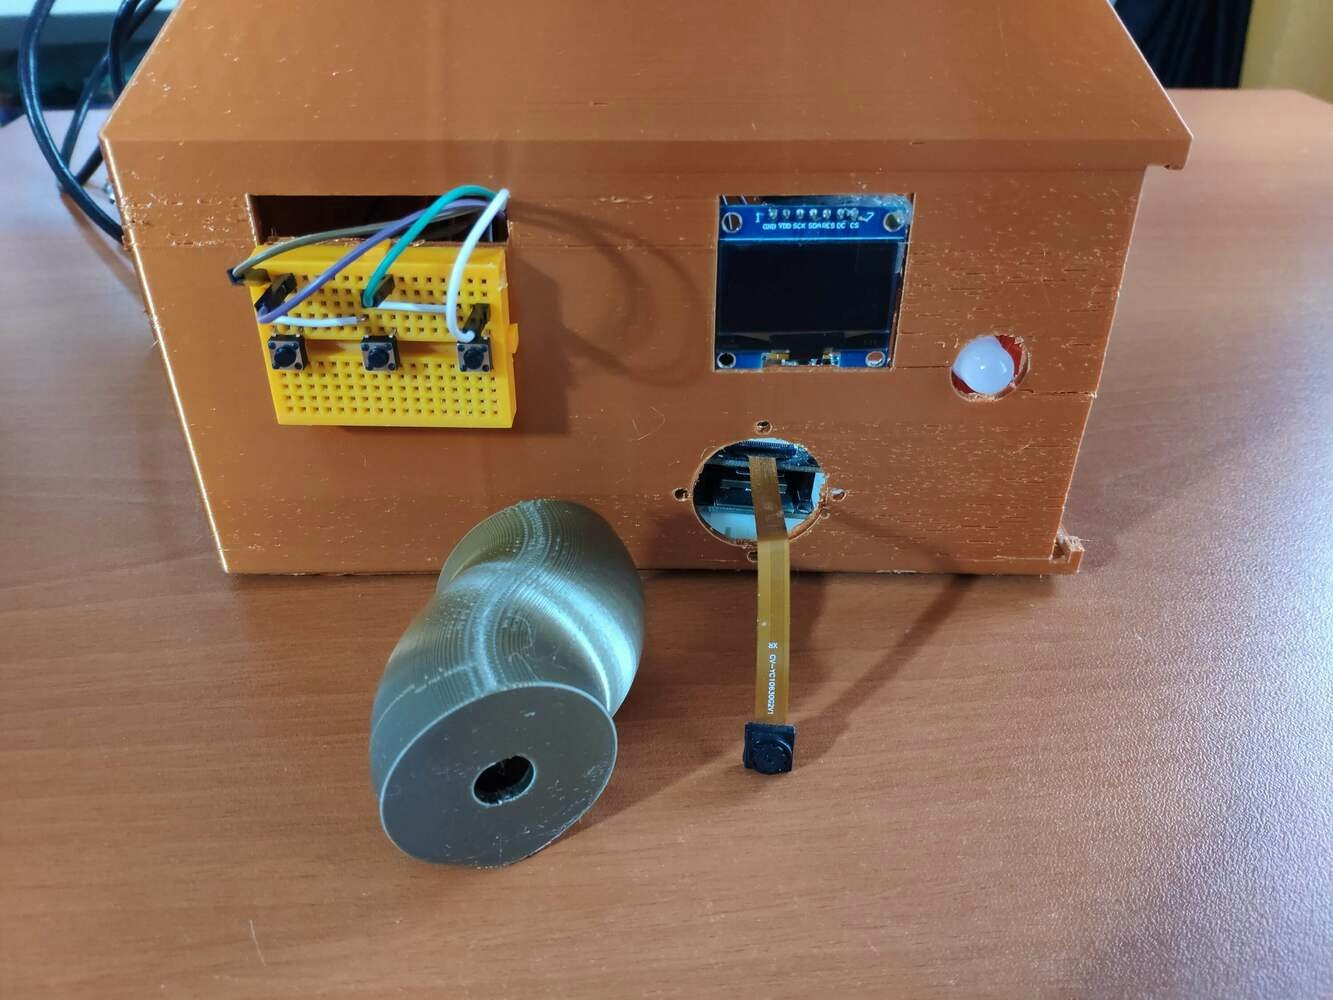
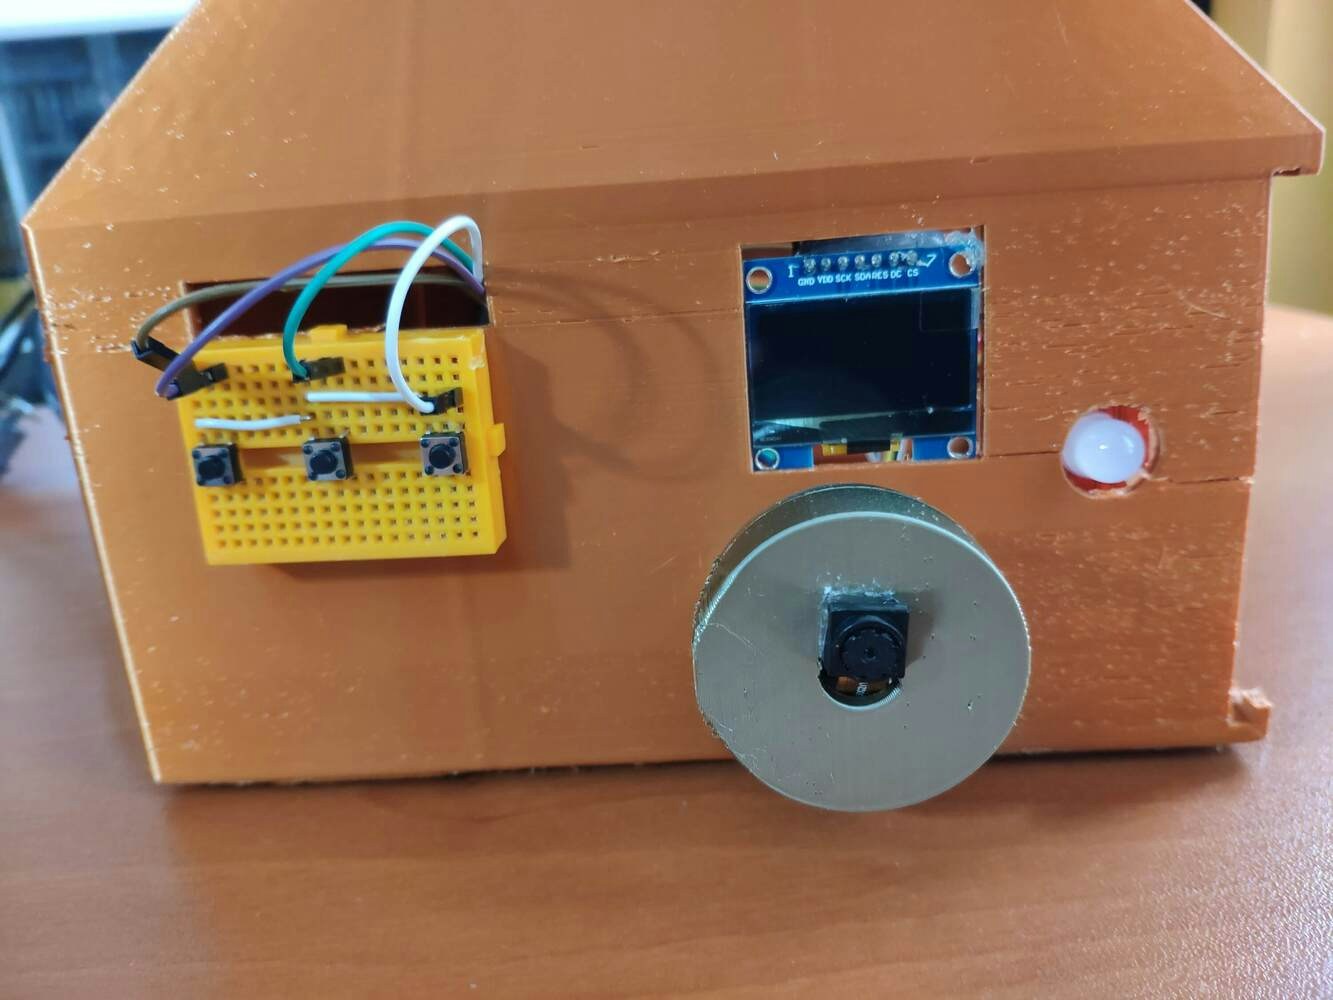
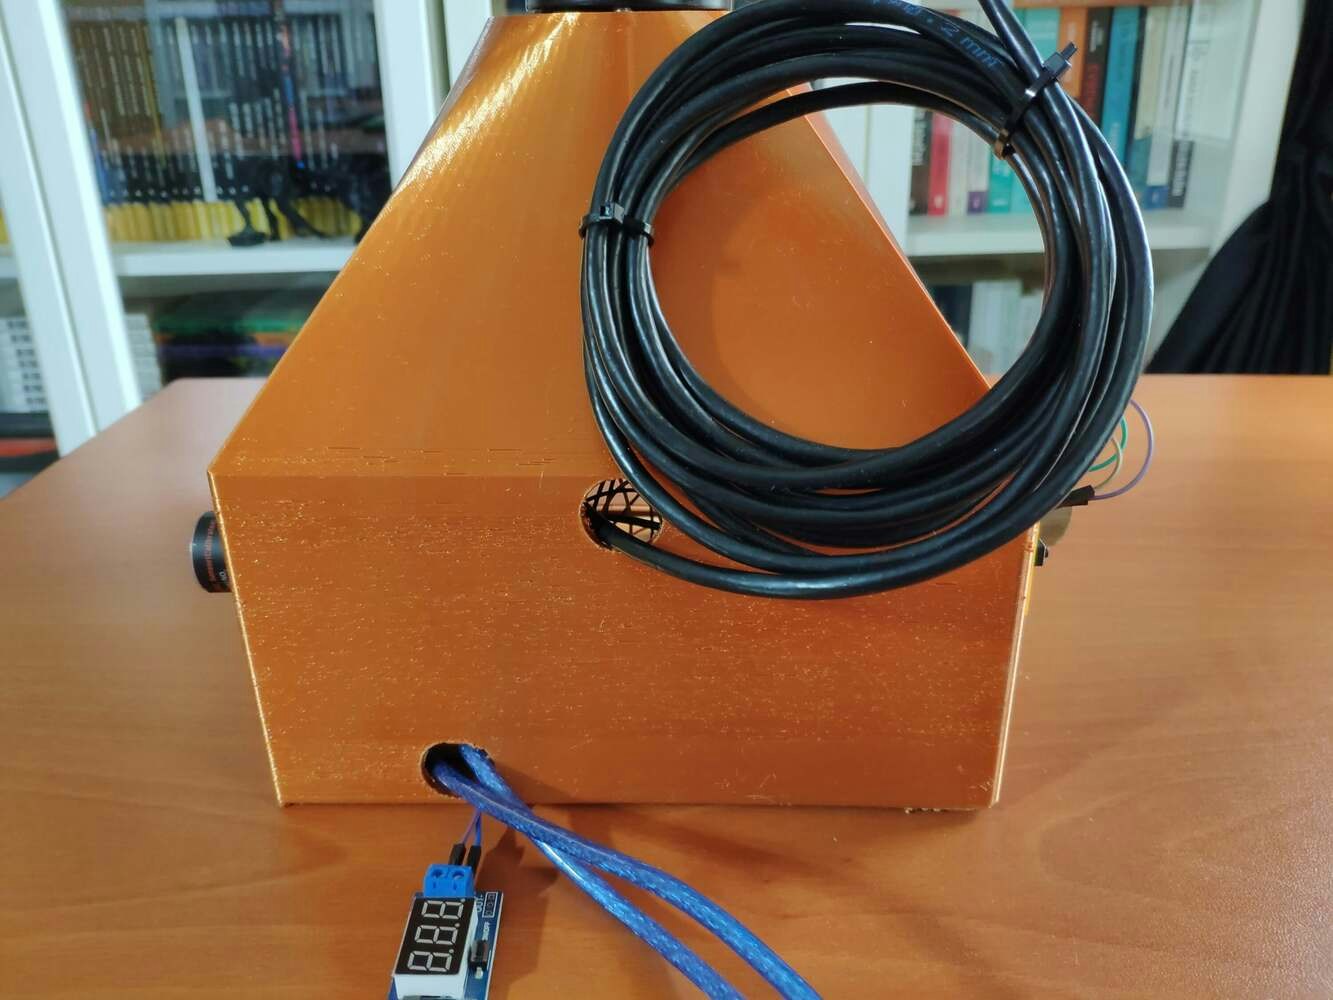
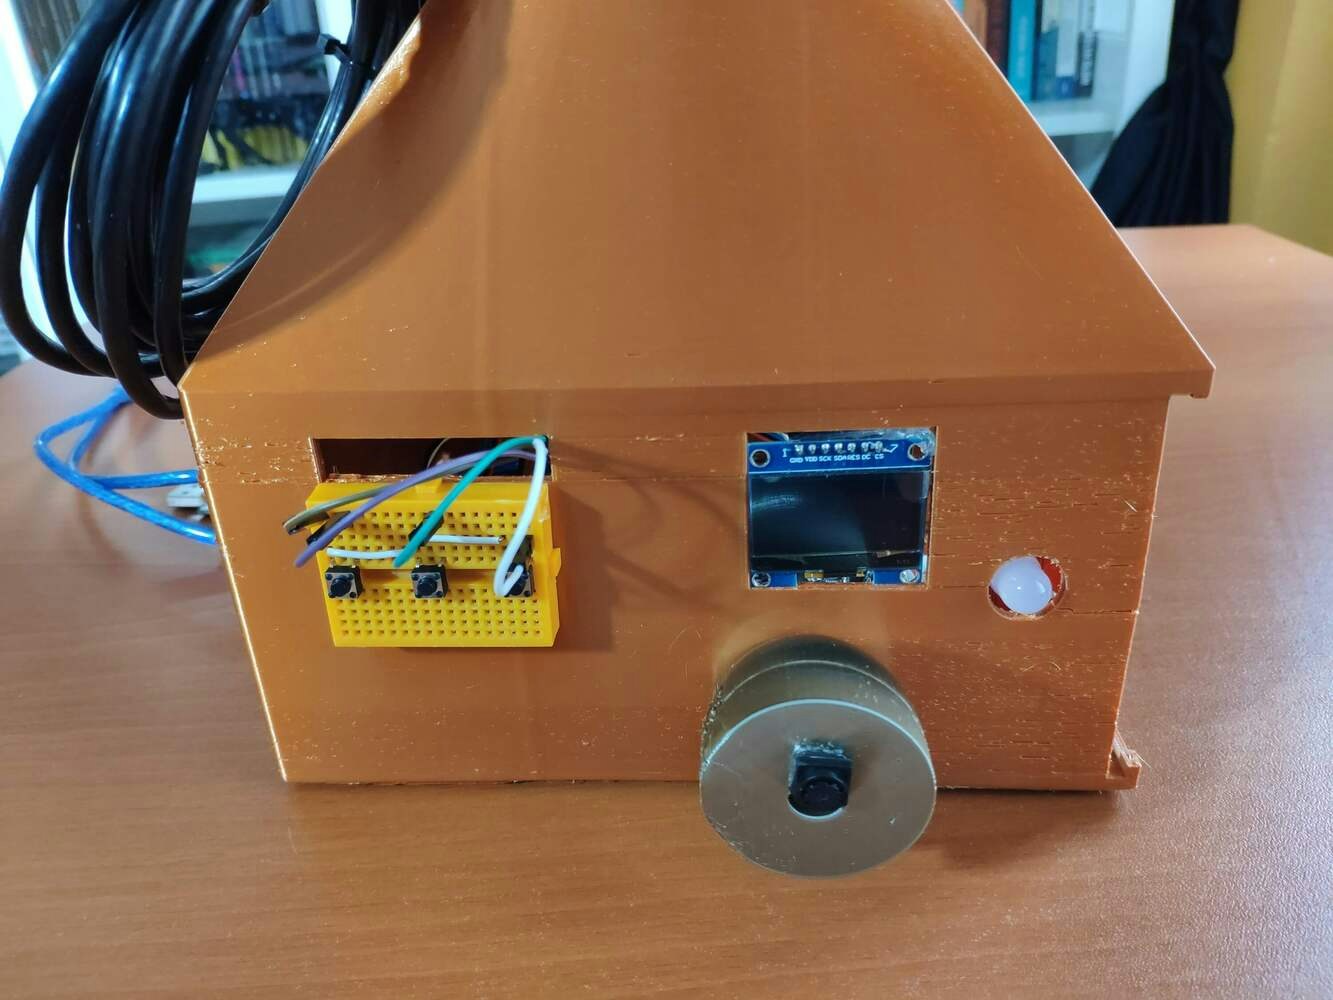
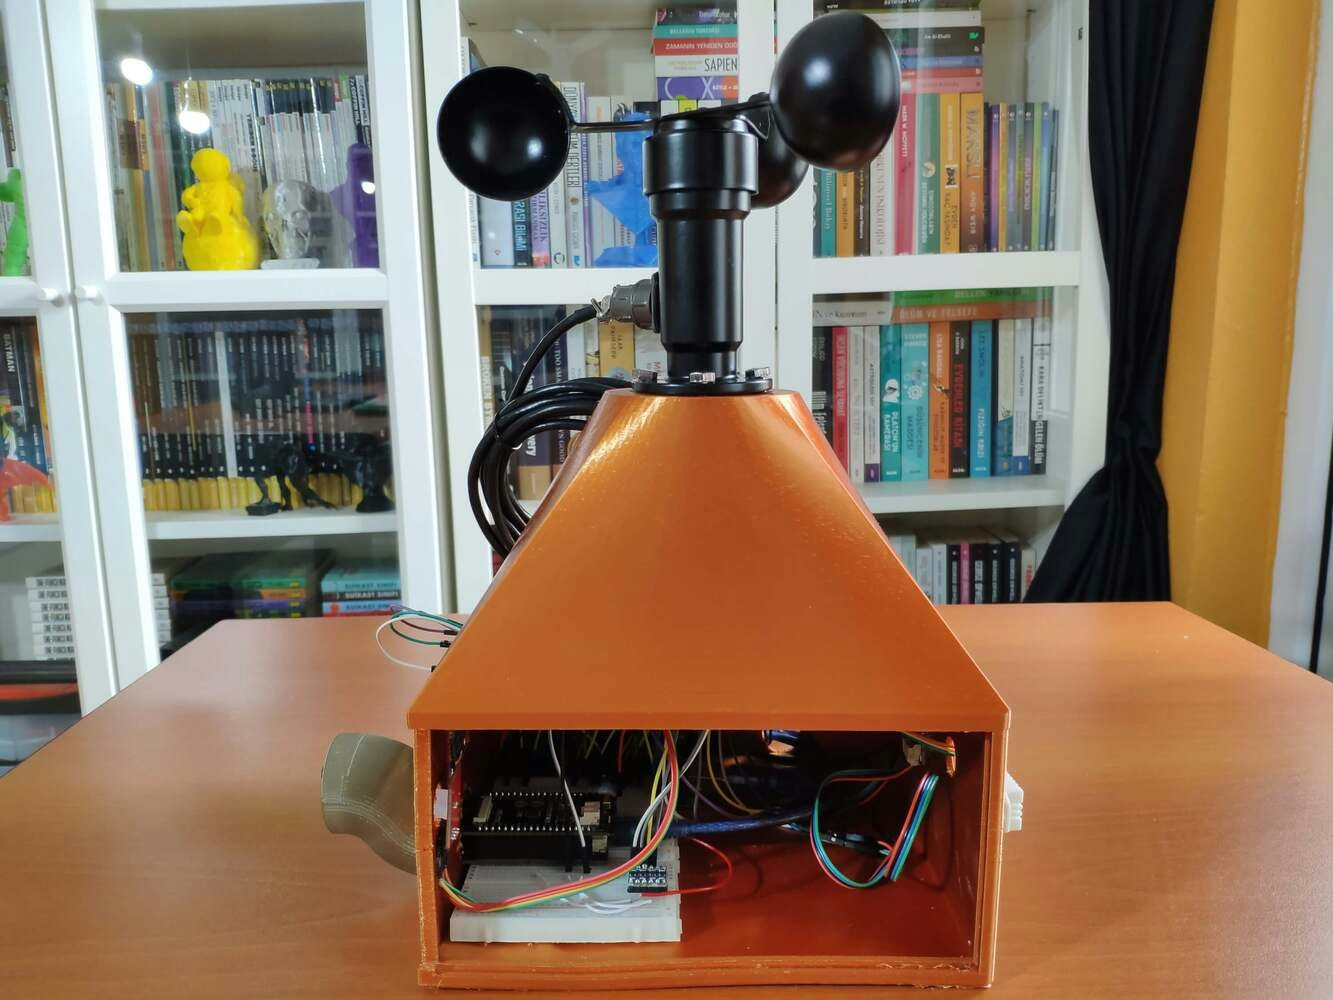
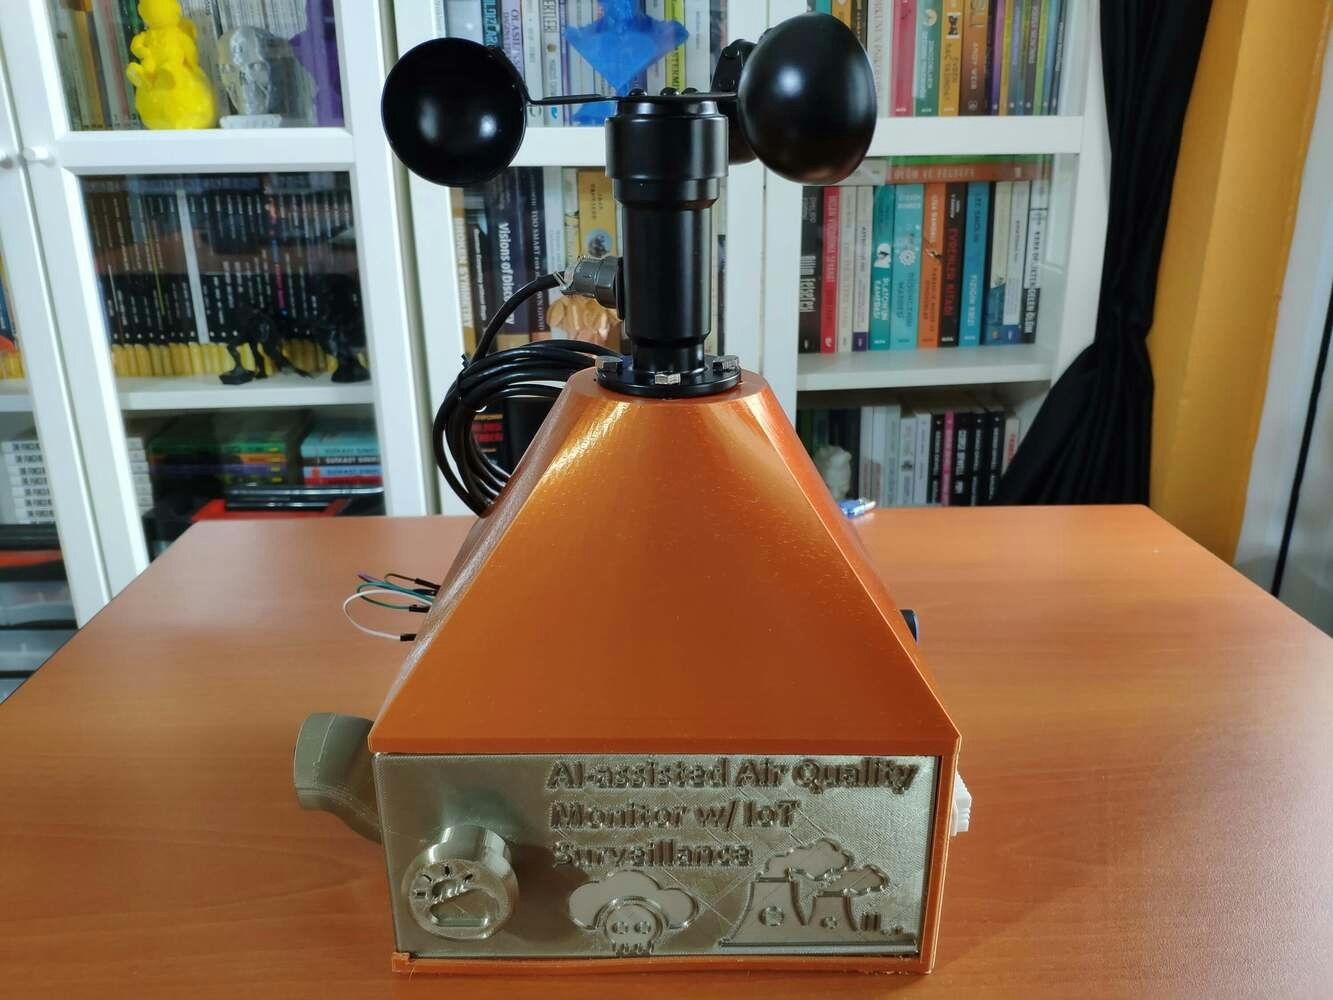 As mentioned earlier, the mountable camera holder can be utilized to adjust the OV7725 camera at four different angles via the snap-fit joints.
 ## Step 2: Developing a web application displaying real-time database updates in PHP, JavaScript, CSS, and MySQL
To provide an exceptional user experience for this AIoT air station, I developed a full-fledged web application from scratch in PHP, HTML, JavaScript, CSS, and MySQL. This web application obtains the collected air quality data, the detected air pollution level (class) by the neural network model, and the captured surveillance footage from FireBeetle ESP32 via an HTTP POST request. After saving the received information to the MySQL database table for further inspection, the web application converts the received raw image data to a JPG file via a Python script. Then, the web application updates itself automatically to show the latest received information and surveillance footage. Also, the application displays all stored air quality data with model detection results in descending order and allows the user to inspect previous surveillance footage.
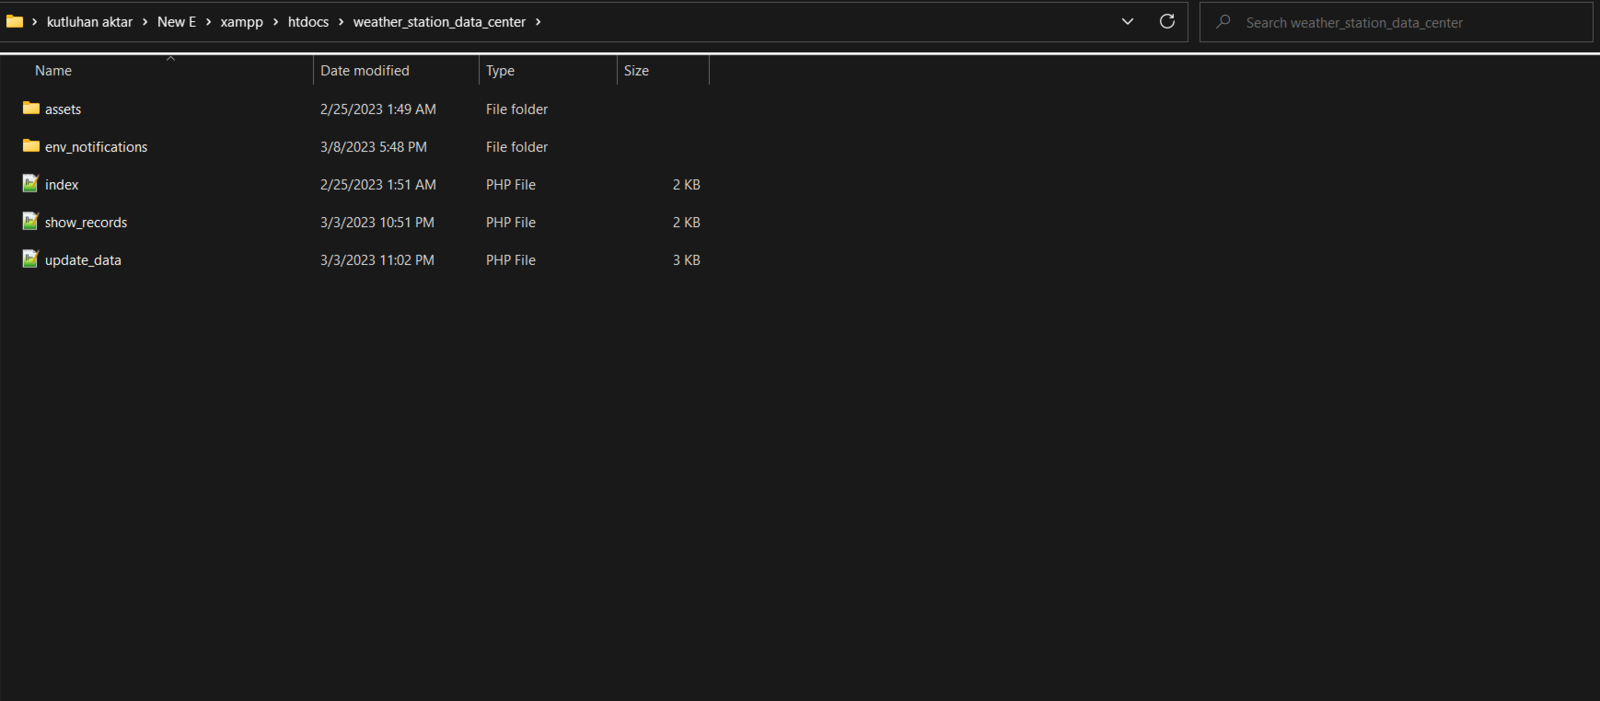
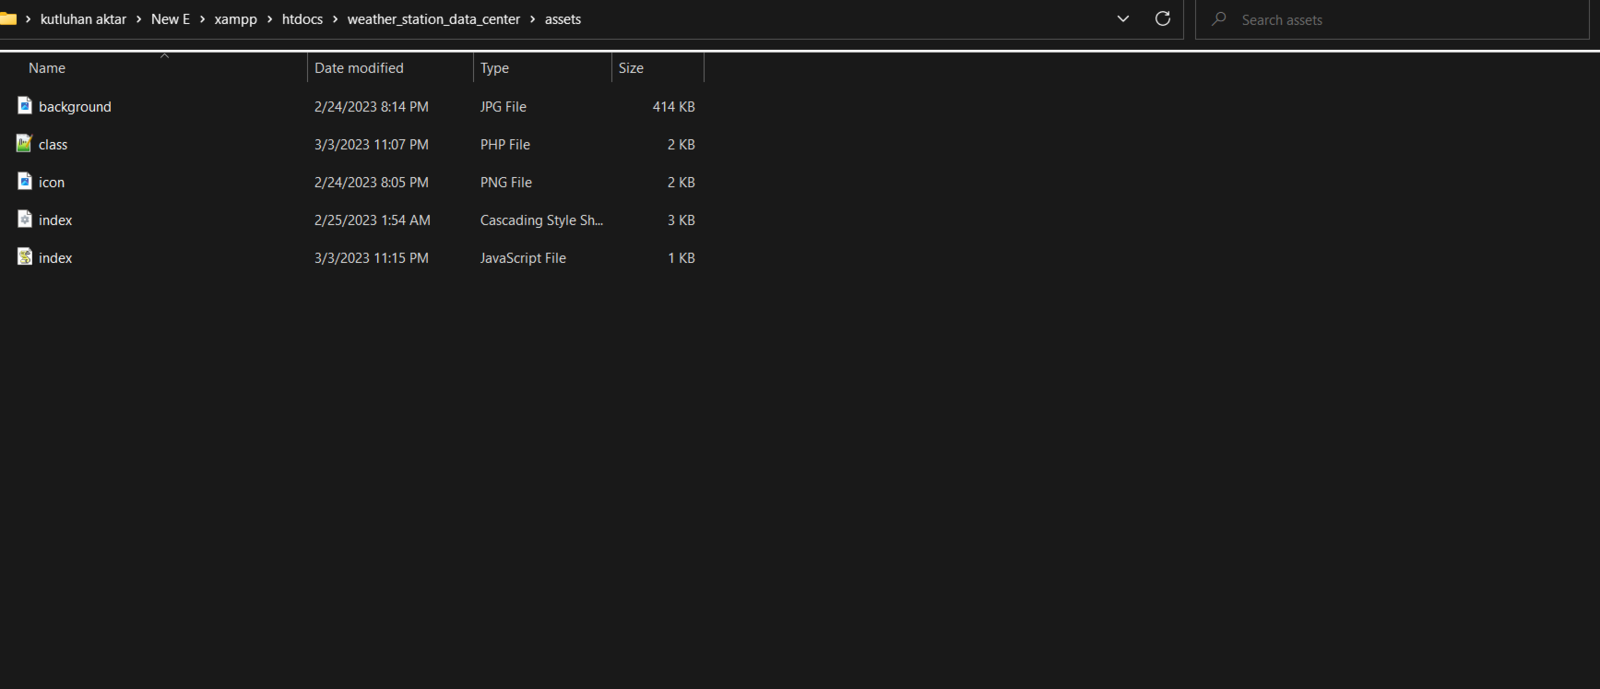
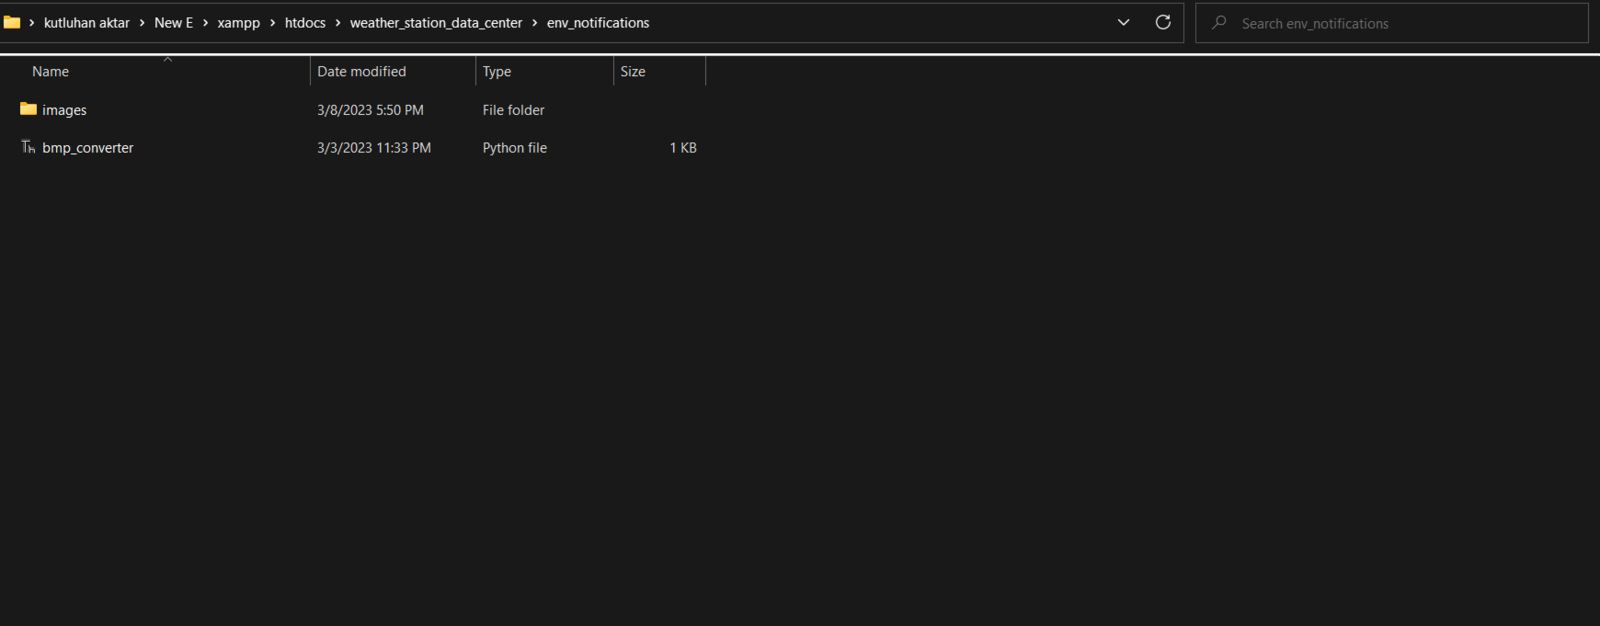
As shown below, the web application consists of three folders and seven code files:
* /assets
* \-- background.jpg
* \-- class.php
* \-- icon.png
* \-- index.css
* \-- index.js
* /env\_notifications
* \-- /images
* \-- bmp\_converter.py
* index.php
* show\_records.php
* update\_data.php
## Step 2: Developing a web application displaying real-time database updates in PHP, JavaScript, CSS, and MySQL
To provide an exceptional user experience for this AIoT air station, I developed a full-fledged web application from scratch in PHP, HTML, JavaScript, CSS, and MySQL. This web application obtains the collected air quality data, the detected air pollution level (class) by the neural network model, and the captured surveillance footage from FireBeetle ESP32 via an HTTP POST request. After saving the received information to the MySQL database table for further inspection, the web application converts the received raw image data to a JPG file via a Python script. Then, the web application updates itself automatically to show the latest received information and surveillance footage. Also, the application displays all stored air quality data with model detection results in descending order and allows the user to inspect previous surveillance footage.
As shown below, the web application consists of three folders and seven code files:
* /assets
* \-- background.jpg
* \-- class.php
* \-- icon.png
* \-- index.css
* \-- index.js
* /env\_notifications
* \-- /images
* \-- bmp\_converter.py
* index.php
* show\_records.php
* update\_data.php
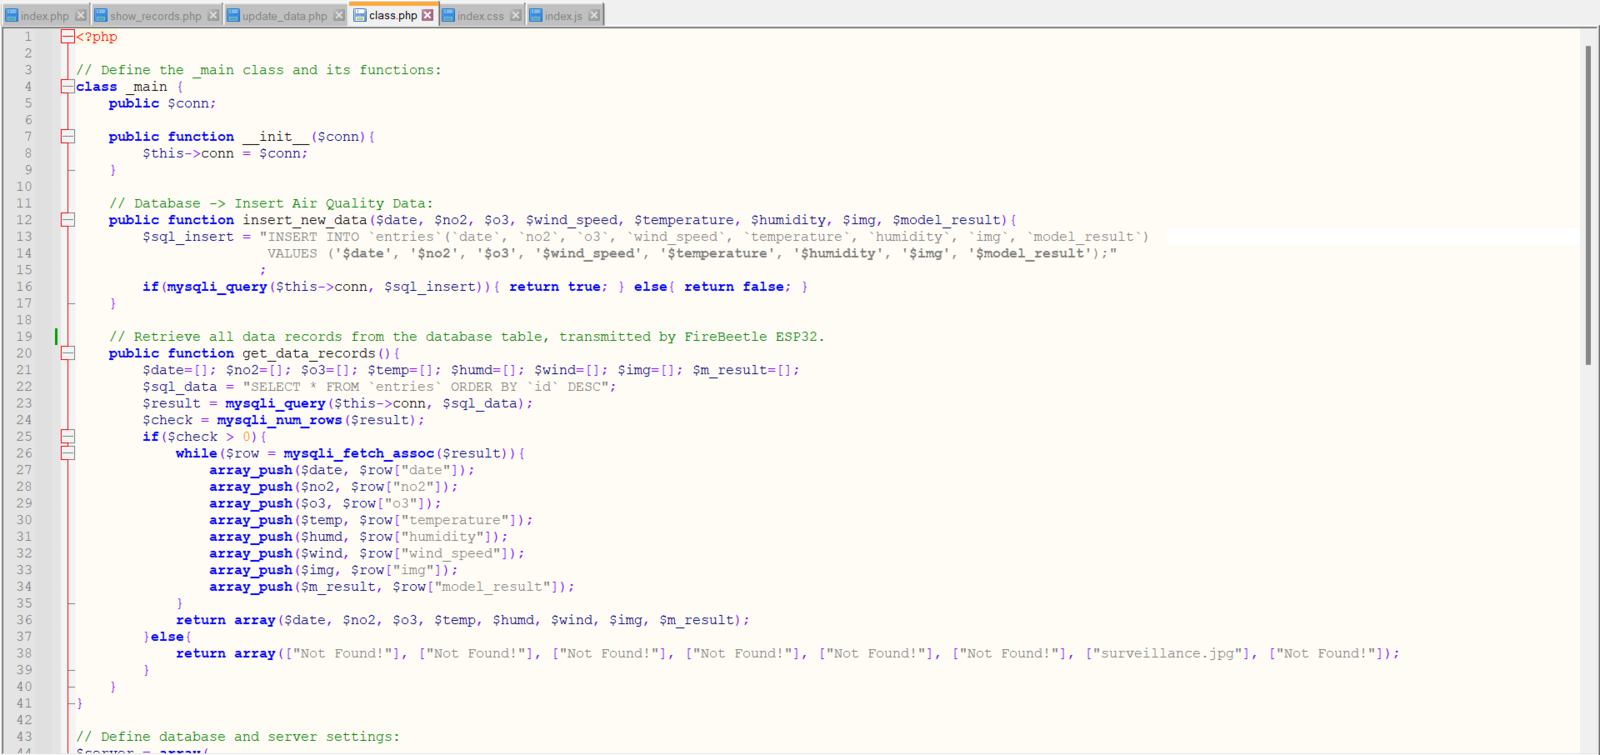
 📁 *class.php*
In the *class.php* file, I created a class named *\_main* to bundle the following functions under a specific structure.
⭐ Define the *\_main* class and its functions.
```
public $conn;
public function __init__($conn){
$this->conn = $conn;
}
```
⭐ In the *insert\_new\_data* function, insert the given air quality data to the MySQL database table.
```
public function insert_new_data($date, $no2, $o3, $wind_speed, $temperature, $humidity, $img, $model_result){
$sql_insert = "INSERT INTO `entries`(`date`, `no2`, `o3`, `wind_speed`, `temperature`, `humidity`, `img`, `model_result`)
VALUES ('$date', '$no2', '$o3', '$wind_speed', '$temperature', '$humidity', '$img', '$model_result');"
;
if(mysqli_query($this->conn, $sql_insert)){ return true; } else{ return false; }
}
```
⭐ In the *get\_data\_records* function, retrieve all stored air quality data from the database table in descending order and return all data parameters as separate lists.
```
public function get_data_records(){
$date=[]; $no2=[]; $o3=[]; $temp=[]; $humd=[]; $wind=[]; $img=[]; $m_result=[];
$sql_data = "SELECT * FROM `entries` ORDER BY `id` DESC";
$result = mysqli_query($this->conn, $sql_data);
$check = mysqli_num_rows($result);
if($check > 0){
while($row = mysqli_fetch_assoc($result)){
array_push($date, $row["date"]);
array_push($no2, $row["no2"]);
array_push($o3, $row["o3"]);
array_push($temp, $row["temperature"]);
array_push($humd, $row["humidity"]);
array_push($wind, $row["wind_speed"]);
array_push($img, $row["img"]);
array_push($m_result, $row["model_result"]);
}
return array($date, $no2, $o3, $temp, $humd, $wind, $img, $m_result);
}else{
return array(["Not Found!"], ["Not Found!"], ["Not Found!"], ["Not Found!"], ["Not Found!"], ["Not Found!"], ["surveillance.jpg"], ["Not Found!"]);
}
}
```
⭐ Define the required MariaDB database connection settings for LattePanda 3 Delta 864.
```
$server = array(
"name" => "localhost",
"username" => "root",
"password" => "",
"database" => "air_quality_aiot"
);
$conn = mysqli_connect($server["name"], $server["username"], $server["password"], $server["database"]);
```
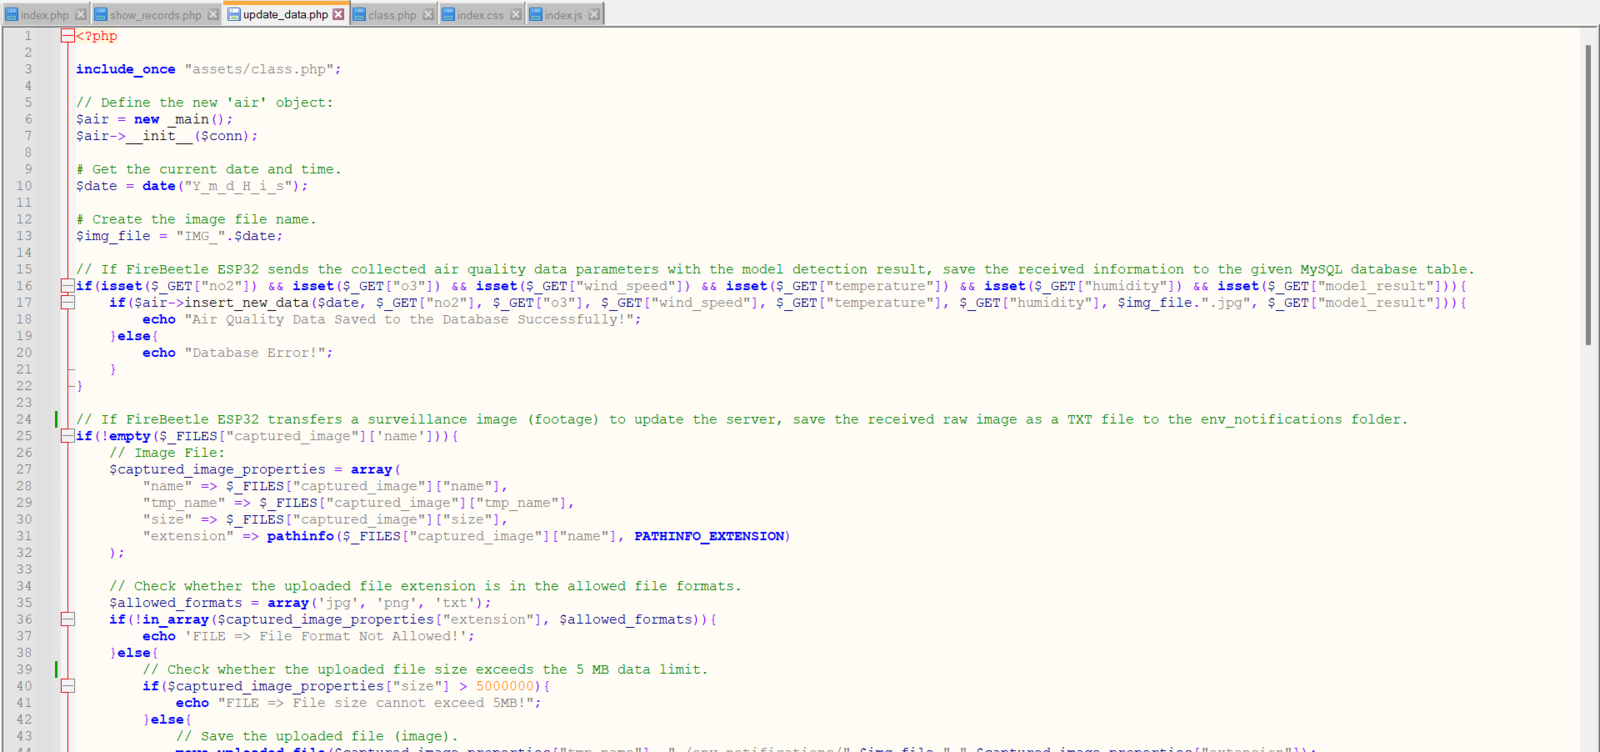
📁 *update\_data.php*
⭐ Include the *class.php* file.
⭐ Define the *air* object of the *\_main* class with its required parameters.
```
include_once "assets/class.php";
// Define the new 'air' object:
$air = new _main();
$air->__init__($conn);
```
⭐ Get the current date & time and create the surveillance footage file name.
```
$date = date("Y_m_d_H_i_s");
# Create the image file name.
$img_file = "IMG_".$date;
```
⭐ If FireBeetle ESP32 sends the collected air quality data parameters with the model detection result, save the received information to the given MySQL database table.
```
if(isset($_GET["no2"]) && isset($_GET["o3"]) && isset($_GET["wind_speed"]) && isset($_GET["temperature"]) && isset($_GET["humidity"]) && isset($_GET["model_result"])){
if($air->insert_new_data($date, $_GET["no2"], $_GET["o3"], $_GET["wind_speed"], $_GET["temperature"], $_GET["humidity"], $img_file.".jpg", $_GET["model_result"])){
echo "Air Quality Data Saved to the Database Successfully!";
}else{
echo "Database Error!";
}
}
```
⭐ If FireBeetle ESP32 transfers raw image data as surveillance footage via an HTTP POST request to update the server, save the received raw image data as a TXT file to the *env\_notifications* folder.
```
if(!empty($_FILES["captured_image"]['name'])){
// Image File:
$captured_image_properties = array(
"name" => $_FILES["captured_image"]["name"],
"tmp_name" => $_FILES["captured_image"]["tmp_name"],
"size" => $_FILES["captured_image"]["size"],
"extension" => pathinfo($_FILES["captured_image"]["name"], PATHINFO_EXTENSION)
);
// Check whether the uploaded file extension is in the allowed file formats.
$allowed_formats = array('jpg', 'png', 'txt');
if(!in_array($captured_image_properties["extension"], $allowed_formats)){
echo 'FILE => File Format Not Allowed!';
}else{
// Check whether the uploaded file size exceeds the 5 MB data limit.
if($captured_image_properties["size"] > 5000000){
echo "FILE => File size cannot exceed 5MB!";
}else{
// Save the uploaded file (image).
move_uploaded_file($captured_image_properties["tmp_name"], "./env_notifications/".$img_file.".".$captured_image_properties["extension"]);
echo "FILE => Saved Successfully!";
}
}
}
```
⭐ Convert the recently saved raw image data (TXT file) to a JPG file by executing a Python script via the terminal through the web application — *bmp\_converter.py*.
You can get more information regarding converting raw image data in the following step.
⭐ After generating the JPG file from the raw image data, remove the converted TXT file from the server.
```
$convert = shell_exec('python "C:\Users\kutlu\New E\xampp\htdocs\weather_station_data_center\env_notifications\bmp_converter.py"');
print($convert);
// After generating the JPG file, remove the recently saved TXT file from the server.
unlink("./env_notifications/".$img_file.".txt");
```
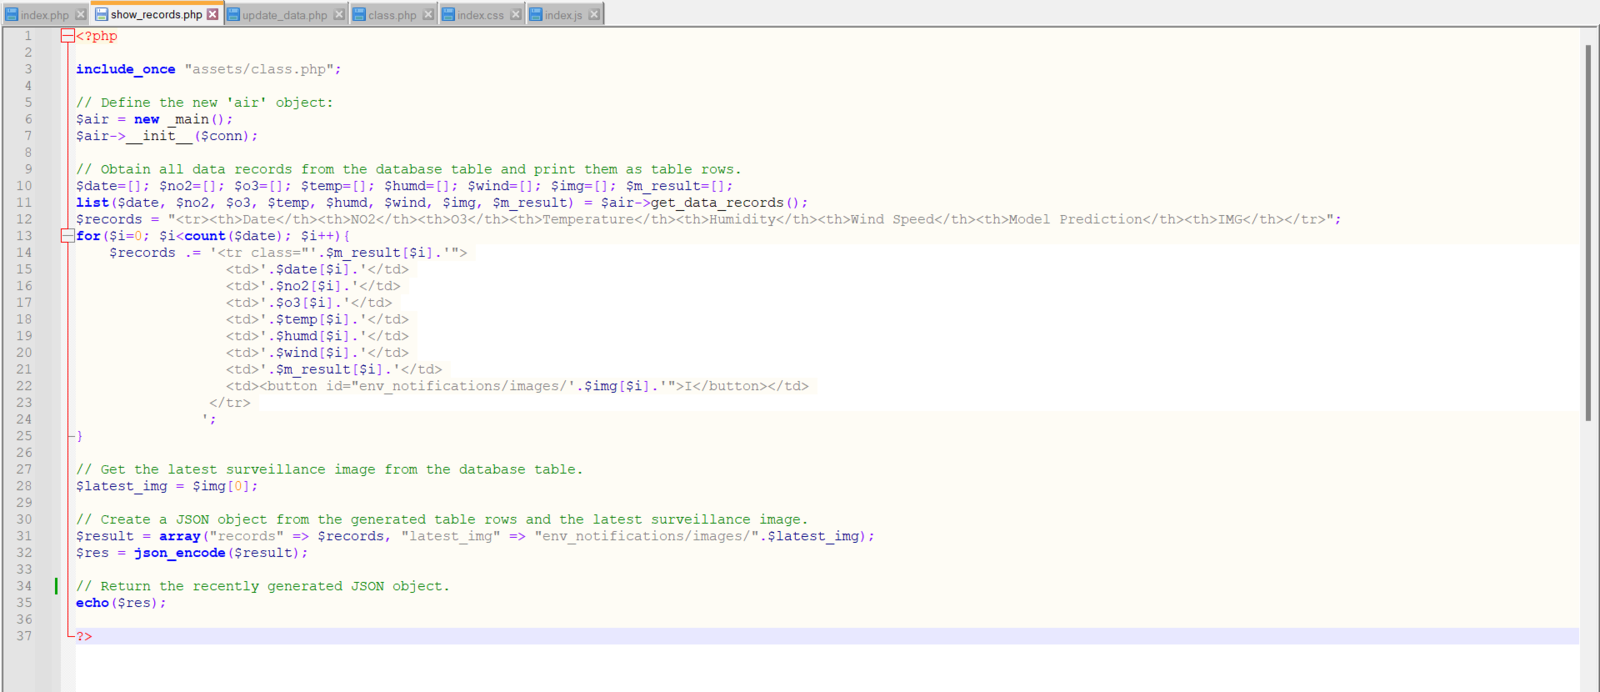
📁 *show\_records.php*
⭐ Include the *class.php* file.
⭐ Define the *air* object of the *\_main* class with its required parameters.
```
include_once "assets/class.php";
// Define the new 'air' object:
$air = new _main();
$air->__init__($conn);
```
⭐ Obtain all saved air quality information in the database table as different lists for each data parameter and create HTML table rows by utilizing these arrays.
```
$date=[]; $no2=[]; $o3=[]; $temp=[]; $humd=[]; $wind=[]; $img=[]; $m_result=[];
list($date, $no2, $o3, $temp, $humd, $wind, $img, $m_result) = $air->get_data_records();
$records = "<tr><th>Date</th><th>NO2</th><th>O3</th><th>Temperature</th><th>Humidity</th><th>Wind Speed</th><th>Model Prediction</th><th>IMG</th></tr>";
for($i=0; $i<count($date); $i++){
$records .= '<tr class="'.$m_result[$i].'">
<td>'.$date[$i].'</td>
<td>'.$no2[$i].'</td>
<td>'.$o3[$i].'</td>
<td>'.$temp[$i].'</td>
<td>'.$humd[$i].'</td>
<td>'.$wind[$i].'</td>
<td>'.$m_result[$i].'</td>
<td><button id="env_notifications/images/'.$img[$i].'">I</button></td>
</tr>
';
}
```
⭐ Get the name of the latest surveillance footage from the database table.
⭐ Then, create a JSON object from the recently generated HTML table rows and the elicited surveillance footage file name.
⭐ Finally, return the recently created JSON object.
```
$latest_img = $img[0];
// Create a JSON object from the generated table rows and the latest surveillance image.
$result = array("records" => $records, "latest_img" => "env_notifications/images/".$latest_img);
$res = json_encode($result);
// Return the recently generated JSON object.
echo($res);
```
📁 *index.php*
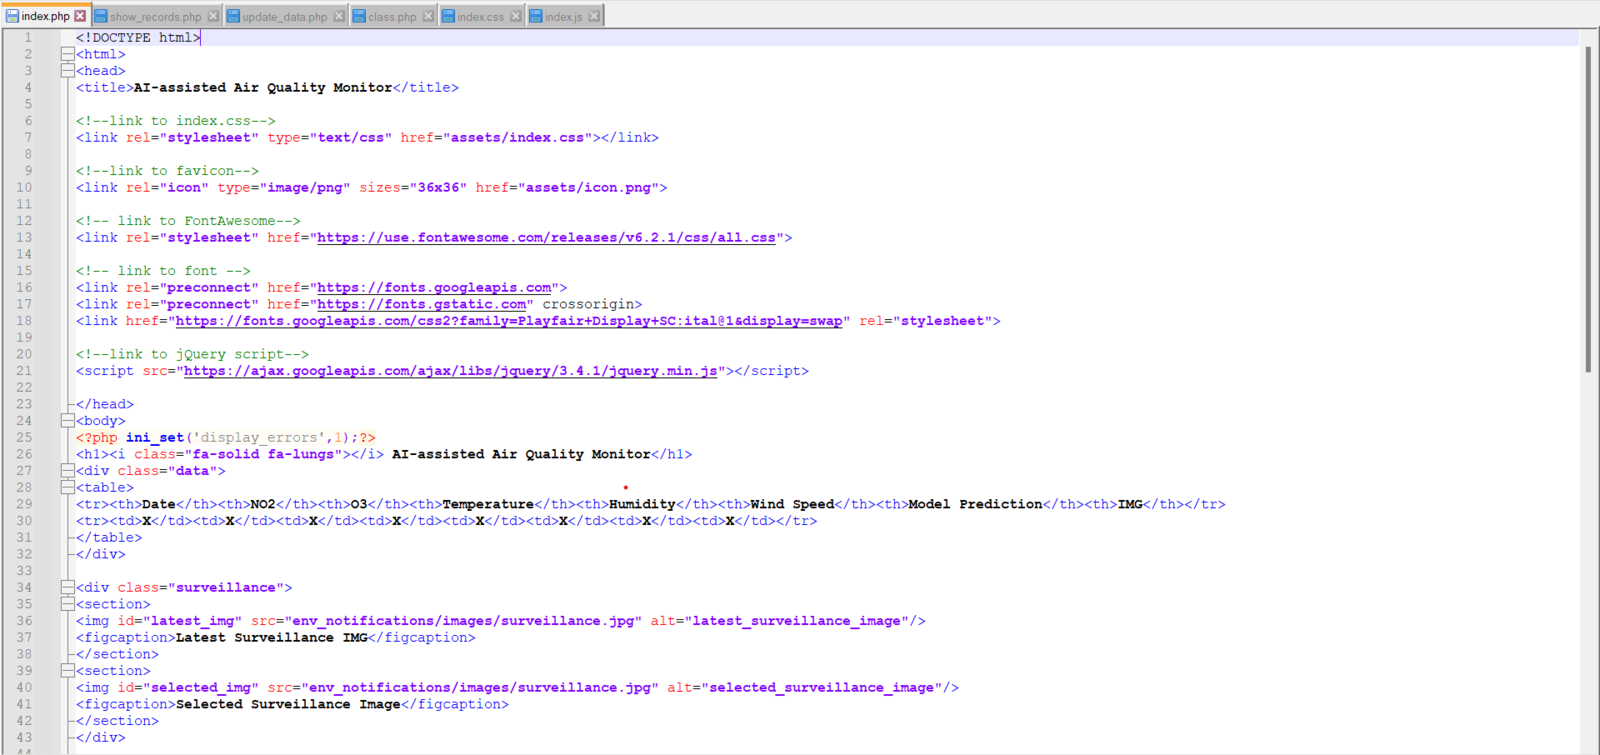
⭐ Create the web application interface, including the HTML table for displaying the stored air quality information with the model detection results in the MySQL database table and image frames for the latest and selected surveillance footage.
You can inspect and download the *index.php* file below.
📁 *index.js (jQuery and AJAX)*
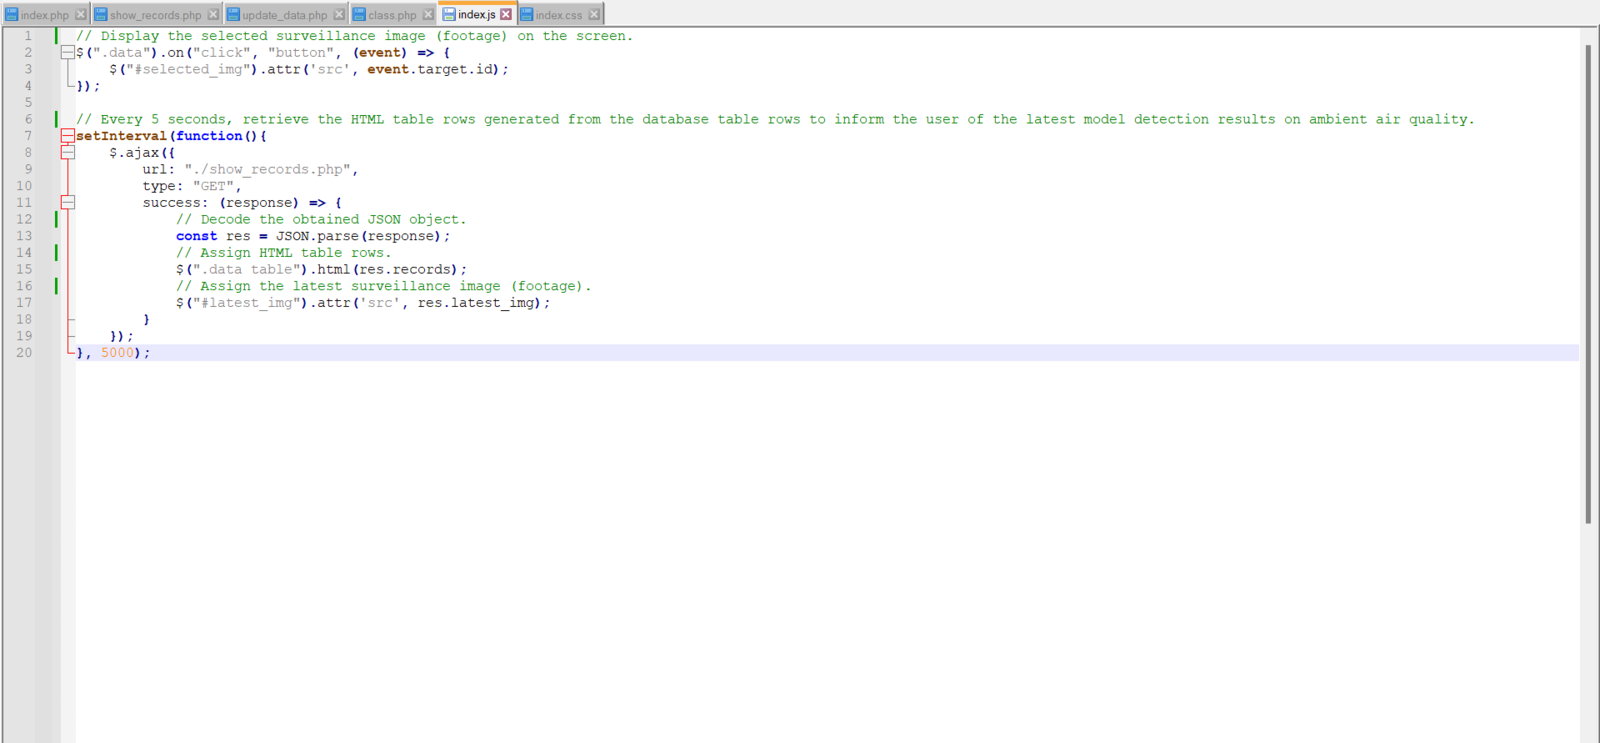
⭐ Display the selected surveillance footage (image) on the web application interface via the HTML buttons added to each data record retrieved from the MySQL database table.
```
$(".data").on("click", "button", (event) => {
$("#selected_img").attr('src', event.target.id);
});
```
⭐ Every 5 seconds, make an HTTP GET request to the *show\_records.php* file.
⭐ Then, decode the retrieved JSON object to obtain the HTML table rows generated from the database table rows and the latest surveillance footage file name.
⭐ Assign the elicited information to the corresponding HTML elements on the web application interface to inform the user automatically.
```
setInterval(function(){
$.ajax({
url: "./show_records.php",
type: "GET",
success: (response) => {
// Decode the obtained JSON object.
const res = JSON.parse(response);
// Assign HTML table rows.
$(".data table").html(res.records);
// Assign the latest surveillance image (footage).
$("#latest_img").attr('src', res.latest_img);
}
});
}, 5000);
```
📁 *class.php*
In the *class.php* file, I created a class named *\_main* to bundle the following functions under a specific structure.
⭐ Define the *\_main* class and its functions.
```
public $conn;
public function __init__($conn){
$this->conn = $conn;
}
```
⭐ In the *insert\_new\_data* function, insert the given air quality data to the MySQL database table.
```
public function insert_new_data($date, $no2, $o3, $wind_speed, $temperature, $humidity, $img, $model_result){
$sql_insert = "INSERT INTO `entries`(`date`, `no2`, `o3`, `wind_speed`, `temperature`, `humidity`, `img`, `model_result`)
VALUES ('$date', '$no2', '$o3', '$wind_speed', '$temperature', '$humidity', '$img', '$model_result');"
;
if(mysqli_query($this->conn, $sql_insert)){ return true; } else{ return false; }
}
```
⭐ In the *get\_data\_records* function, retrieve all stored air quality data from the database table in descending order and return all data parameters as separate lists.
```
public function get_data_records(){
$date=[]; $no2=[]; $o3=[]; $temp=[]; $humd=[]; $wind=[]; $img=[]; $m_result=[];
$sql_data = "SELECT * FROM `entries` ORDER BY `id` DESC";
$result = mysqli_query($this->conn, $sql_data);
$check = mysqli_num_rows($result);
if($check > 0){
while($row = mysqli_fetch_assoc($result)){
array_push($date, $row["date"]);
array_push($no2, $row["no2"]);
array_push($o3, $row["o3"]);
array_push($temp, $row["temperature"]);
array_push($humd, $row["humidity"]);
array_push($wind, $row["wind_speed"]);
array_push($img, $row["img"]);
array_push($m_result, $row["model_result"]);
}
return array($date, $no2, $o3, $temp, $humd, $wind, $img, $m_result);
}else{
return array(["Not Found!"], ["Not Found!"], ["Not Found!"], ["Not Found!"], ["Not Found!"], ["Not Found!"], ["surveillance.jpg"], ["Not Found!"]);
}
}
```
⭐ Define the required MariaDB database connection settings for LattePanda 3 Delta 864.
```
$server = array(
"name" => "localhost",
"username" => "root",
"password" => "",
"database" => "air_quality_aiot"
);
$conn = mysqli_connect($server["name"], $server["username"], $server["password"], $server["database"]);
```
📁 *update\_data.php*
⭐ Include the *class.php* file.
⭐ Define the *air* object of the *\_main* class with its required parameters.
```
include_once "assets/class.php";
// Define the new 'air' object:
$air = new _main();
$air->__init__($conn);
```
⭐ Get the current date & time and create the surveillance footage file name.
```
$date = date("Y_m_d_H_i_s");
# Create the image file name.
$img_file = "IMG_".$date;
```
⭐ If FireBeetle ESP32 sends the collected air quality data parameters with the model detection result, save the received information to the given MySQL database table.
```
if(isset($_GET["no2"]) && isset($_GET["o3"]) && isset($_GET["wind_speed"]) && isset($_GET["temperature"]) && isset($_GET["humidity"]) && isset($_GET["model_result"])){
if($air->insert_new_data($date, $_GET["no2"], $_GET["o3"], $_GET["wind_speed"], $_GET["temperature"], $_GET["humidity"], $img_file.".jpg", $_GET["model_result"])){
echo "Air Quality Data Saved to the Database Successfully!";
}else{
echo "Database Error!";
}
}
```
⭐ If FireBeetle ESP32 transfers raw image data as surveillance footage via an HTTP POST request to update the server, save the received raw image data as a TXT file to the *env\_notifications* folder.
```
if(!empty($_FILES["captured_image"]['name'])){
// Image File:
$captured_image_properties = array(
"name" => $_FILES["captured_image"]["name"],
"tmp_name" => $_FILES["captured_image"]["tmp_name"],
"size" => $_FILES["captured_image"]["size"],
"extension" => pathinfo($_FILES["captured_image"]["name"], PATHINFO_EXTENSION)
);
// Check whether the uploaded file extension is in the allowed file formats.
$allowed_formats = array('jpg', 'png', 'txt');
if(!in_array($captured_image_properties["extension"], $allowed_formats)){
echo 'FILE => File Format Not Allowed!';
}else{
// Check whether the uploaded file size exceeds the 5 MB data limit.
if($captured_image_properties["size"] > 5000000){
echo "FILE => File size cannot exceed 5MB!";
}else{
// Save the uploaded file (image).
move_uploaded_file($captured_image_properties["tmp_name"], "./env_notifications/".$img_file.".".$captured_image_properties["extension"]);
echo "FILE => Saved Successfully!";
}
}
}
```
⭐ Convert the recently saved raw image data (TXT file) to a JPG file by executing a Python script via the terminal through the web application — *bmp\_converter.py*.
You can get more information regarding converting raw image data in the following step.
⭐ After generating the JPG file from the raw image data, remove the converted TXT file from the server.
```
$convert = shell_exec('python "C:\Users\kutlu\New E\xampp\htdocs\weather_station_data_center\env_notifications\bmp_converter.py"');
print($convert);
// After generating the JPG file, remove the recently saved TXT file from the server.
unlink("./env_notifications/".$img_file.".txt");
```
📁 *show\_records.php*
⭐ Include the *class.php* file.
⭐ Define the *air* object of the *\_main* class with its required parameters.
```
include_once "assets/class.php";
// Define the new 'air' object:
$air = new _main();
$air->__init__($conn);
```
⭐ Obtain all saved air quality information in the database table as different lists for each data parameter and create HTML table rows by utilizing these arrays.
```
$date=[]; $no2=[]; $o3=[]; $temp=[]; $humd=[]; $wind=[]; $img=[]; $m_result=[];
list($date, $no2, $o3, $temp, $humd, $wind, $img, $m_result) = $air->get_data_records();
$records = "<tr><th>Date</th><th>NO2</th><th>O3</th><th>Temperature</th><th>Humidity</th><th>Wind Speed</th><th>Model Prediction</th><th>IMG</th></tr>";
for($i=0; $i<count($date); $i++){
$records .= '<tr class="'.$m_result[$i].'">
<td>'.$date[$i].'</td>
<td>'.$no2[$i].'</td>
<td>'.$o3[$i].'</td>
<td>'.$temp[$i].'</td>
<td>'.$humd[$i].'</td>
<td>'.$wind[$i].'</td>
<td>'.$m_result[$i].'</td>
<td><button id="env_notifications/images/'.$img[$i].'">I</button></td>
</tr>
';
}
```
⭐ Get the name of the latest surveillance footage from the database table.
⭐ Then, create a JSON object from the recently generated HTML table rows and the elicited surveillance footage file name.
⭐ Finally, return the recently created JSON object.
```
$latest_img = $img[0];
// Create a JSON object from the generated table rows and the latest surveillance image.
$result = array("records" => $records, "latest_img" => "env_notifications/images/".$latest_img);
$res = json_encode($result);
// Return the recently generated JSON object.
echo($res);
```
📁 *index.php*
⭐ Create the web application interface, including the HTML table for displaying the stored air quality information with the model detection results in the MySQL database table and image frames for the latest and selected surveillance footage.
You can inspect and download the *index.php* file below.
📁 *index.js (jQuery and AJAX)*
⭐ Display the selected surveillance footage (image) on the web application interface via the HTML buttons added to each data record retrieved from the MySQL database table.
```
$(".data").on("click", "button", (event) => {
$("#selected_img").attr('src', event.target.id);
});
```
⭐ Every 5 seconds, make an HTTP GET request to the *show\_records.php* file.
⭐ Then, decode the retrieved JSON object to obtain the HTML table rows generated from the database table rows and the latest surveillance footage file name.
⭐ Assign the elicited information to the corresponding HTML elements on the web application interface to inform the user automatically.
```
setInterval(function(){
$.ajax({
url: "./show_records.php",
type: "GET",
success: (response) => {
// Decode the obtained JSON object.
const res = JSON.parse(response);
// Assign HTML table rows.
$(".data table").html(res.records);
// Assign the latest surveillance image (footage).
$("#latest_img").attr('src', res.latest_img);
}
});
}, 5000);
```
 ## Step 2.1: Converting the raw images transferred by FireBeetle ESP32 via POST requests to JPG files
Since the FireBeetle media board can only generate raw image data due to its built-in OV7725 camera, I needed to convert the generated raw image data to readable image files so as to display them on the web application interface as surveillance footage. Since FireBeetle ESP32 cannot convert the generated raw image data due to memory allocation issues, I decided to convert the captured raw image data to a JPG file via the web application.
Even though PHP can handle converting raw image data to different image file formats, converting images in PHP causes bad request issues since the web application receives raw image data from FireBeetle ESP32 via HTTP POST requests. Hence, I decided to utilize Python to create JPG files from raw image data since Python provides built-in modules for image conversion in seconds.
By employing the terminal on LattePanda 3 Delta, the web application executes the *bmp\_converter.py* file directly to convert images.
📁 *bmp\_converter.py*
⭐ Include the required modules.
```
from PIL import Image
from glob import glob
```
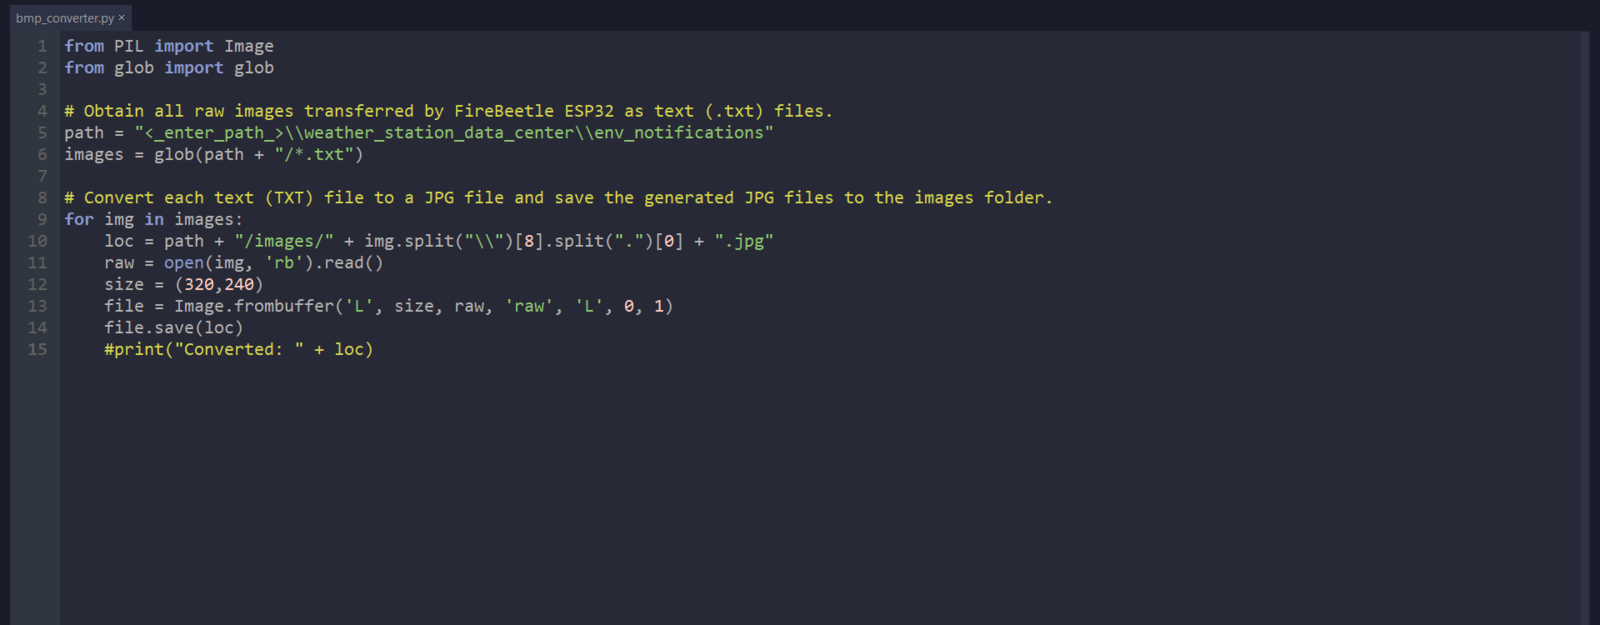
⭐ Obtain all raw images transferred by FireBeetle ESP32 and saved as TXT files under the *env\_notifications* folder.
Since the web application requires to access the absolute paths via the terminal to execute the Python script in order to convert images, provide the *env\_notifications* folder's exact location.
```
path = "C:\\Users\\kutlu\\New E\\xampp\\htdocs\\weather_station_data_center\\env_notifications"
images = glob(path + "/*.txt")
```
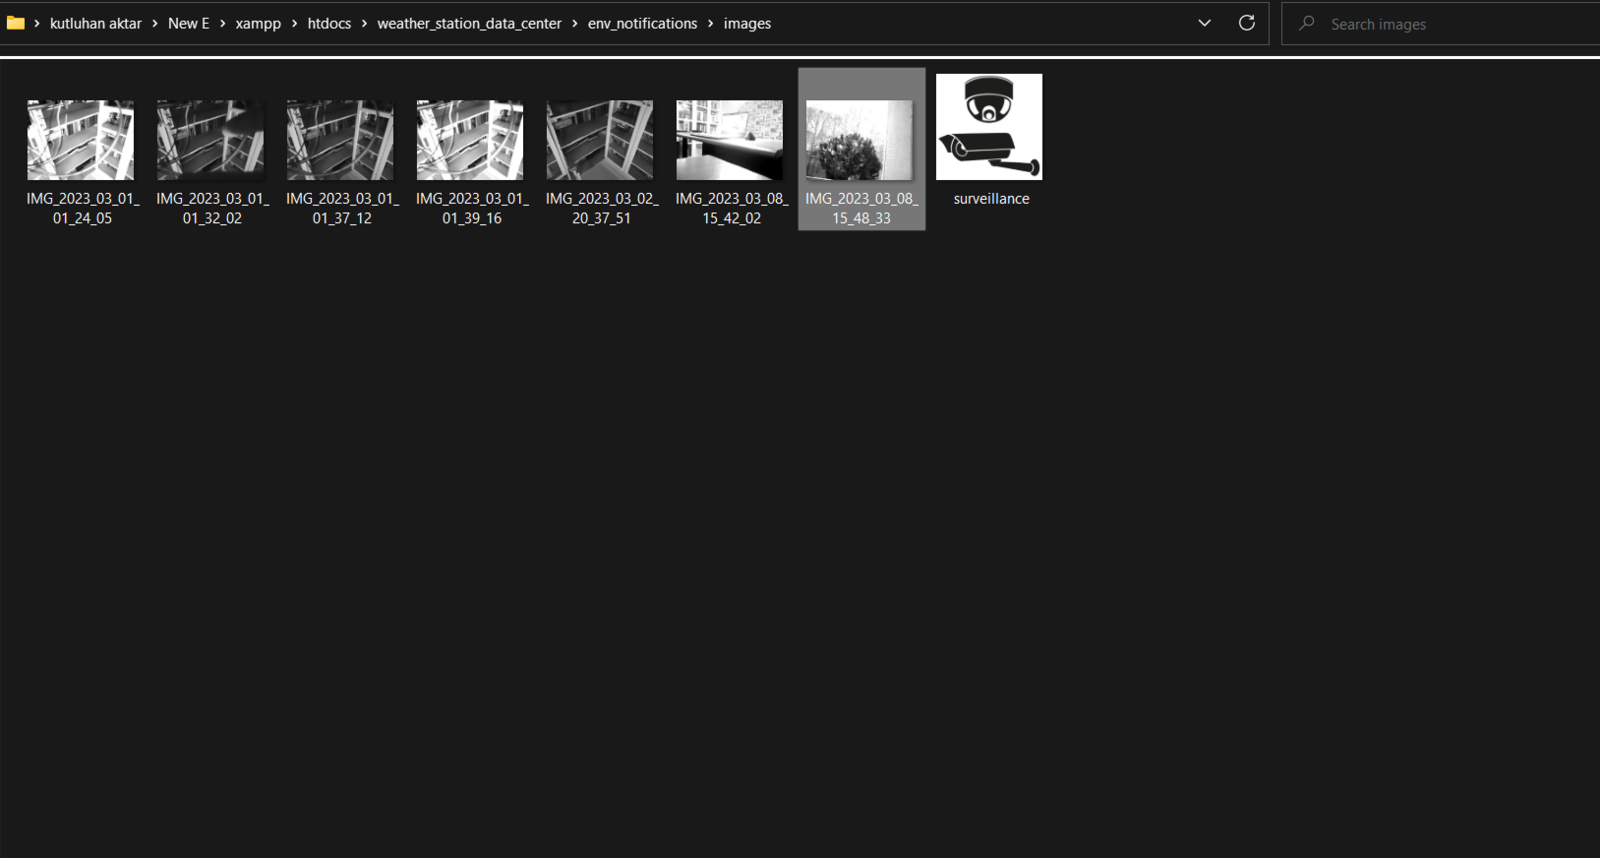
⭐ Then, convert each retrieved TXT file (raw image) to a JPG file via the *frombuffer* function.
⭐ Finally, save the generated JPG files to the *images* folder.
```
for img in images:
loc = path + "/images/" + img.split("\\")[8].split(".")[0] + ".jpg"
raw = open(img, 'rb').read()
size = (320,240)
file = Image.frombuffer('L', size, raw, 'raw', 'L', 0, 1)
file.save(loc)
#print("Converted: " + loc)
```
## Step 2.1: Converting the raw images transferred by FireBeetle ESP32 via POST requests to JPG files
Since the FireBeetle media board can only generate raw image data due to its built-in OV7725 camera, I needed to convert the generated raw image data to readable image files so as to display them on the web application interface as surveillance footage. Since FireBeetle ESP32 cannot convert the generated raw image data due to memory allocation issues, I decided to convert the captured raw image data to a JPG file via the web application.
Even though PHP can handle converting raw image data to different image file formats, converting images in PHP causes bad request issues since the web application receives raw image data from FireBeetle ESP32 via HTTP POST requests. Hence, I decided to utilize Python to create JPG files from raw image data since Python provides built-in modules for image conversion in seconds.
By employing the terminal on LattePanda 3 Delta, the web application executes the *bmp\_converter.py* file directly to convert images.
📁 *bmp\_converter.py*
⭐ Include the required modules.
```
from PIL import Image
from glob import glob
```
⭐ Obtain all raw images transferred by FireBeetle ESP32 and saved as TXT files under the *env\_notifications* folder.
Since the web application requires to access the absolute paths via the terminal to execute the Python script in order to convert images, provide the *env\_notifications* folder's exact location.
```
path = "C:\\Users\\kutlu\\New E\\xampp\\htdocs\\weather_station_data_center\\env_notifications"
images = glob(path + "/*.txt")
```
⭐ Then, convert each retrieved TXT file (raw image) to a JPG file via the *frombuffer* function.
⭐ Finally, save the generated JPG files to the *images* folder.
```
for img in images:
loc = path + "/images/" + img.split("\\")[8].split(".")[0] + ".jpg"
raw = open(img, 'rb').read()
size = (320,240)
file = Image.frombuffer('L', size, raw, 'raw', 'L', 0, 1)
file.save(loc)
#print("Converted: " + loc)
```
 ## Step 2.2: Setting and running the web application on LattePanda 3 Delta 864
Since I have got a test sample of the brand-new [LattePanda 3 Delta 864](https://www.dfrobot.com/product-2594.html?tracking=60f546f8002be), I decided to host my web application on LattePanda 3 Delta. Therefore, I needed to set up a LAMP web server.
LattePanda 3 Delta is a pocket-sized hackable computer that provides ultra performance with the Intel 11th-generation Celeron N5105 processor.
Plausibly, LattePanda 3 Delta can run the XAMPP application. So, it is effortless to create a server with a MariaDB database on LattePanda 3 Delta.
## Step 2.2: Setting and running the web application on LattePanda 3 Delta 864
Since I have got a test sample of the brand-new [LattePanda 3 Delta 864](https://www.dfrobot.com/product-2594.html?tracking=60f546f8002be), I decided to host my web application on LattePanda 3 Delta. Therefore, I needed to set up a LAMP web server.
LattePanda 3 Delta is a pocket-sized hackable computer that provides ultra performance with the Intel 11th-generation Celeron N5105 processor.
Plausibly, LattePanda 3 Delta can run the XAMPP application. So, it is effortless to create a server with a MariaDB database on LattePanda 3 Delta.
 :hash: First of all, install and set up [the XAMPP application](https://www.apachefriends.org/).
:hash: Then, go to the *XAMPP Control Panel* and click the *MySQL Admin* button.
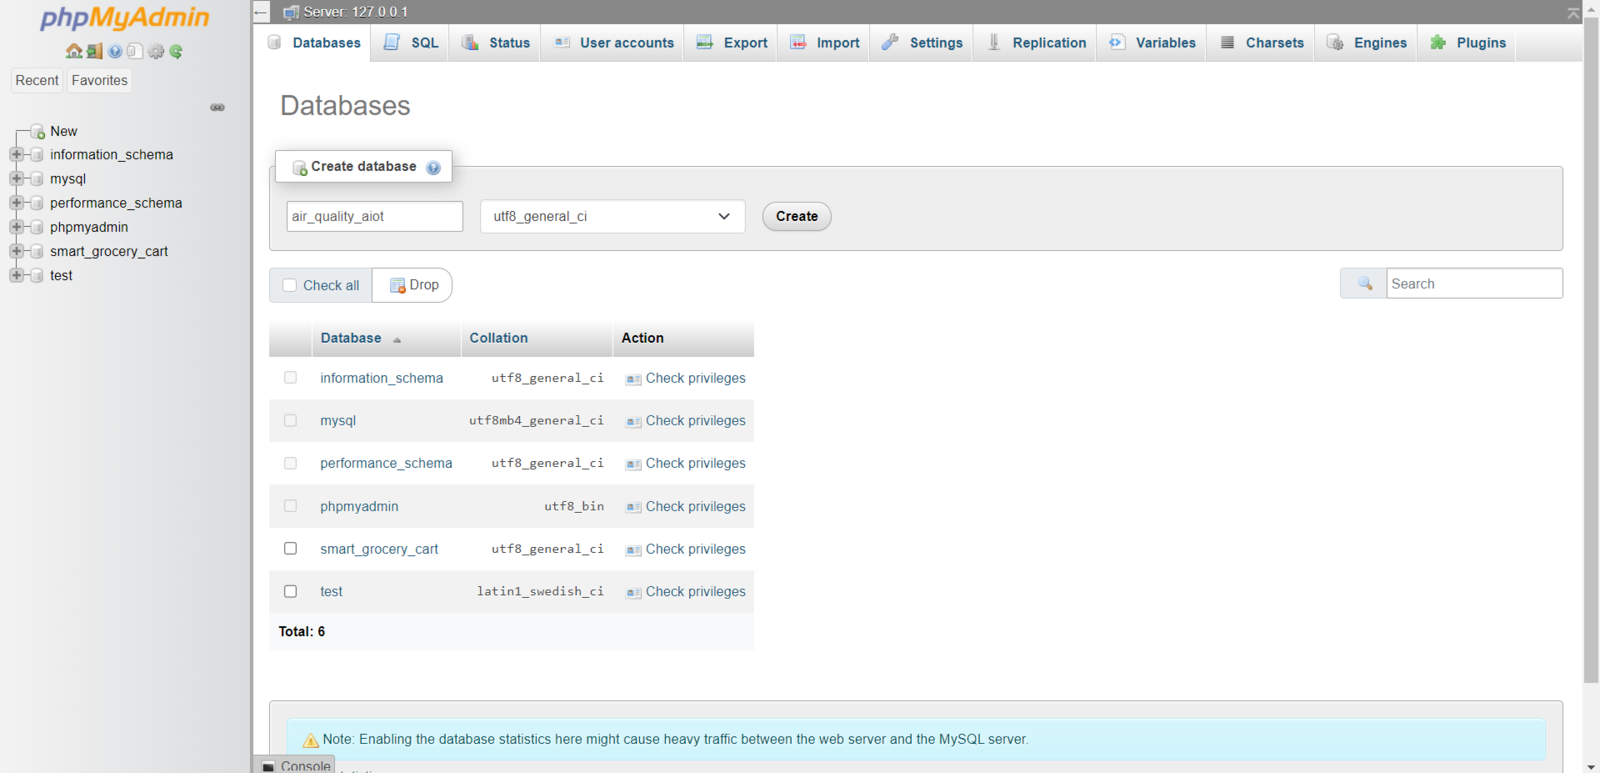
:hash: Once the *phpMyAdmin* tool pops up, create a new database named *air\_quality\_aiot*.
:hash: First of all, install and set up [the XAMPP application](https://www.apachefriends.org/).
:hash: Then, go to the *XAMPP Control Panel* and click the *MySQL Admin* button.
:hash: Once the *phpMyAdmin* tool pops up, create a new database named *air\_quality\_aiot*.
.png?fit=max&auto=format&n=A2Bwlb7Fn9Ob3CFt&q=85&s=d68a8ea5e2e92e570a91f2a804704229)
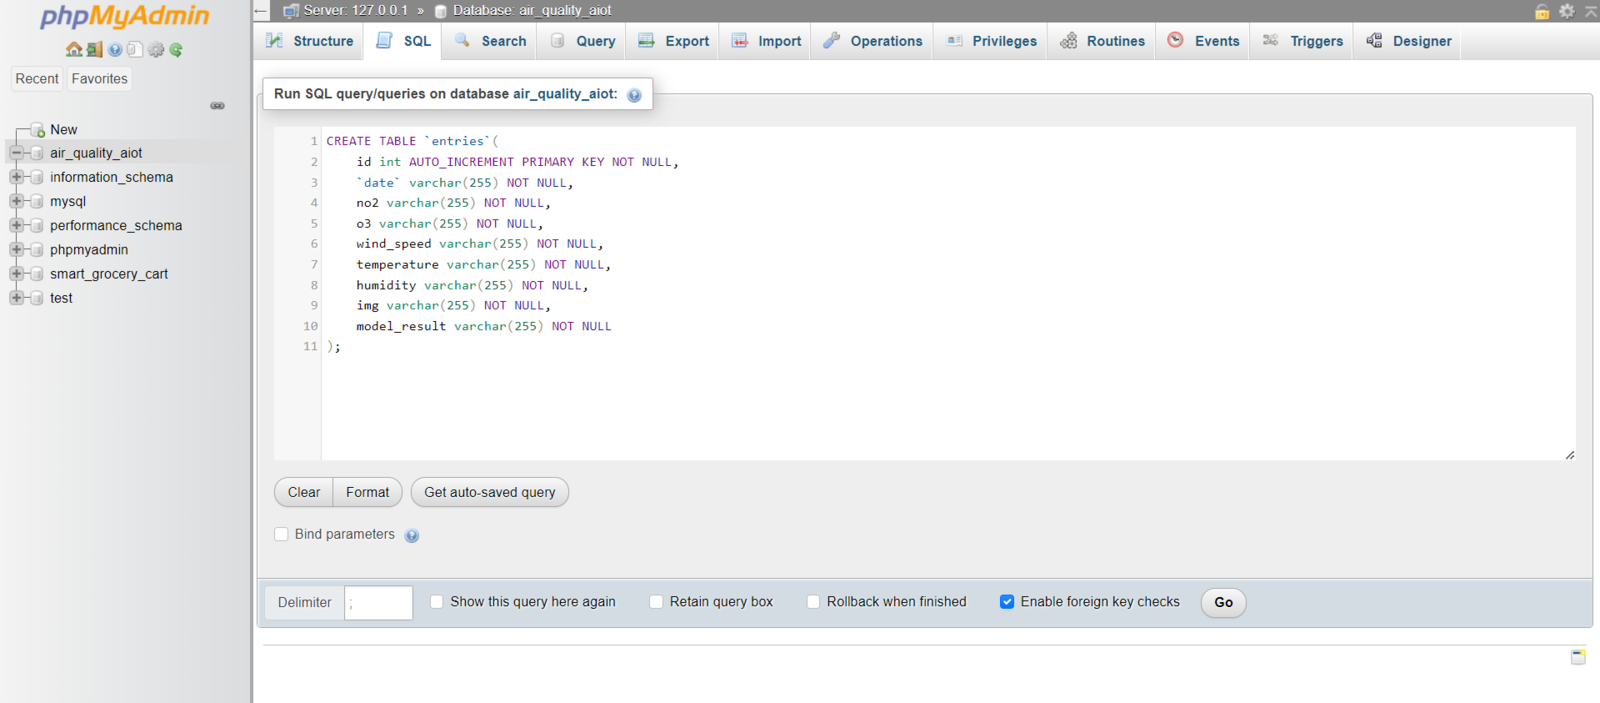
 :hash: After adding the database successfully, go to the *SQL* section to create a MySQL database table named *entries* with the required data fields.
```
CREATE TABLE `entries`(
id int AUTO_INCREMENT PRIMARY KEY NOT NULL,
`date` varchar(255) NOT NULL,
no2 varchar(255) NOT NULL,
o3 varchar(255) NOT NULL,
wind_speed varchar(255) NOT NULL,
temperature varchar(255) NOT NULL,
humidity varchar(255) NOT NULL,
img varchar(255) NOT NULL,
model_result varchar(255) NOT NULL
);
```
:hash: After adding the database successfully, go to the *SQL* section to create a MySQL database table named *entries* with the required data fields.
```
CREATE TABLE `entries`(
id int AUTO_INCREMENT PRIMARY KEY NOT NULL,
`date` varchar(255) NOT NULL,
no2 varchar(255) NOT NULL,
o3 varchar(255) NOT NULL,
wind_speed varchar(255) NOT NULL,
temperature varchar(255) NOT NULL,
humidity varchar(255) NOT NULL,
img varchar(255) NOT NULL,
model_result varchar(255) NOT NULL
);
```
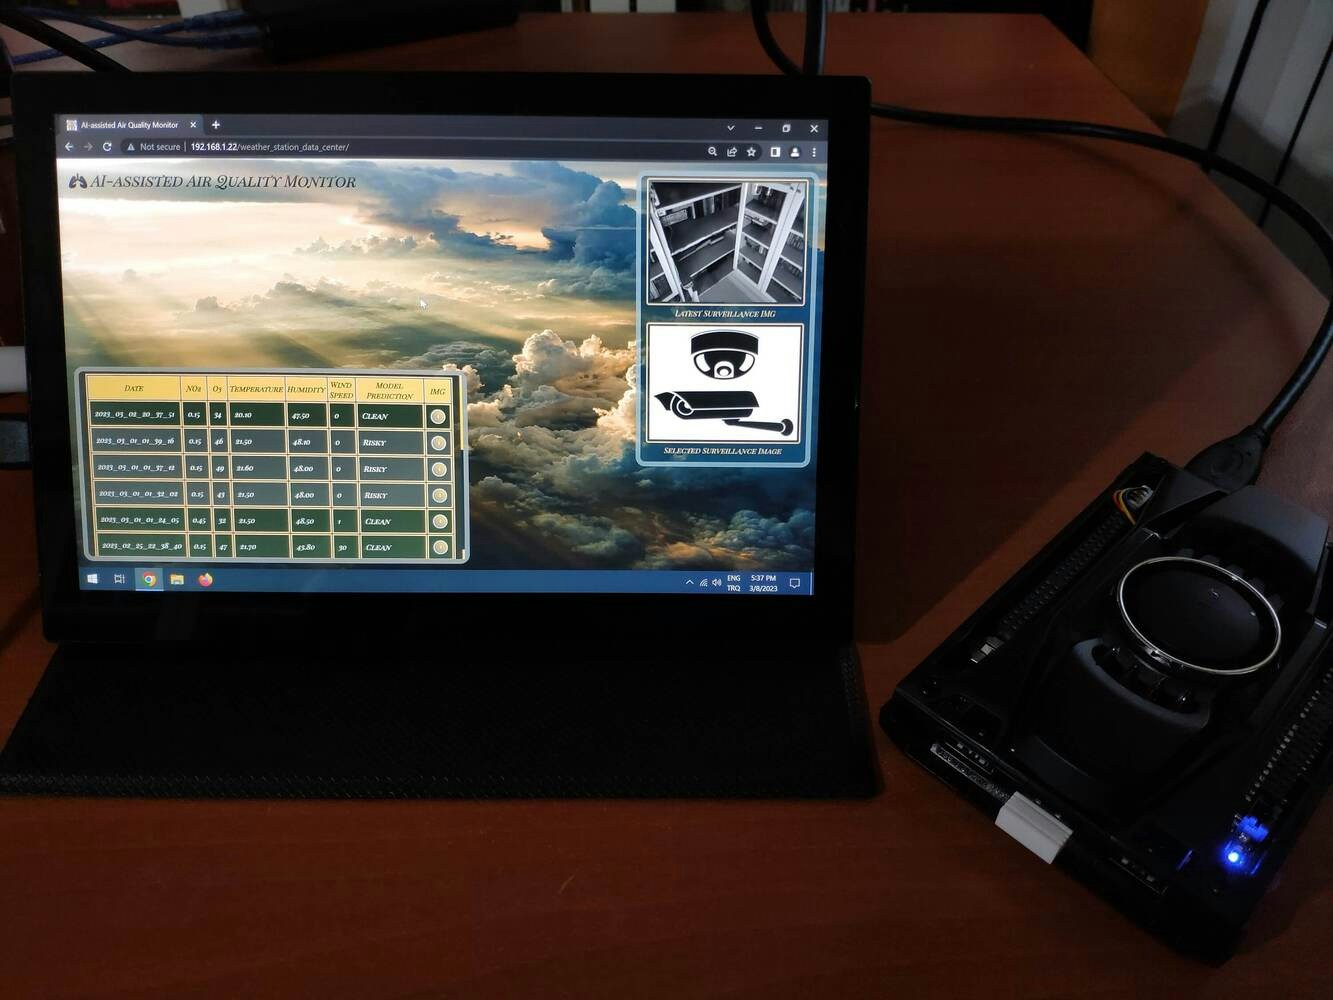
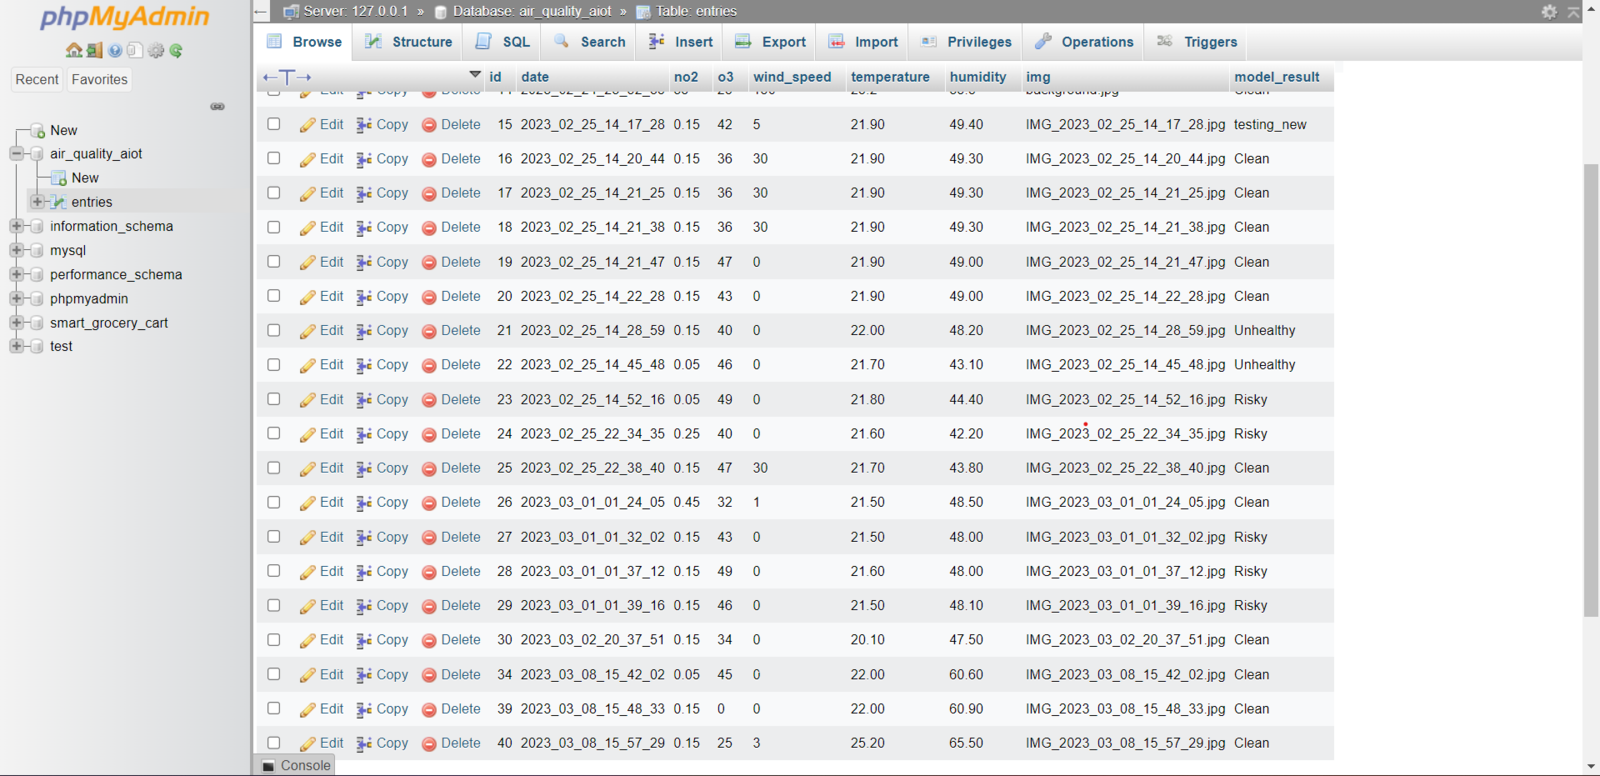
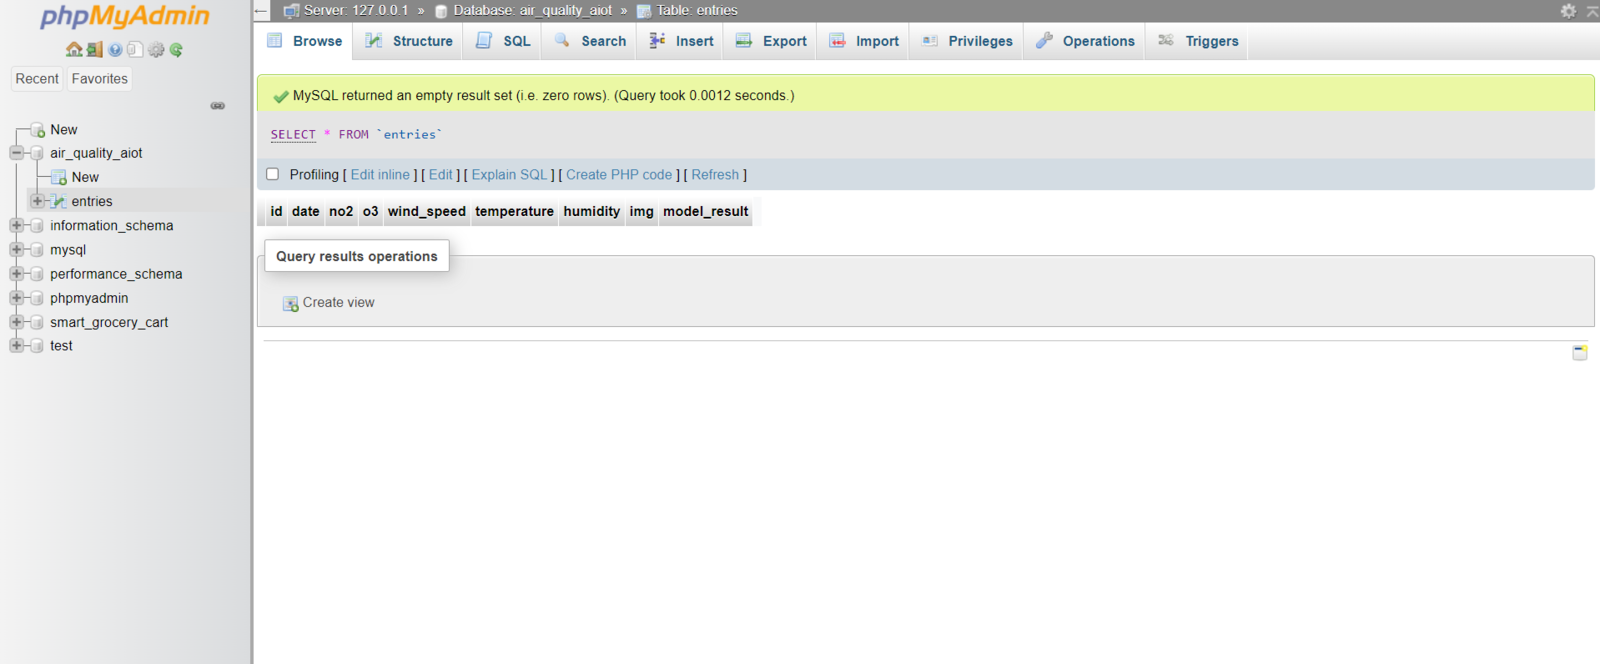 :hash: When FireBeetle ESP32 transmits the collected air quality data with the model detection result, the web application saves the received information to the MySQL database table — *entries*.
 ## Step 2.3: Tracking real-time model detection results and displaying surveillance footage captured by FireBeetle ESP32
After setting the web application on LattePanda 3 Delta 864:
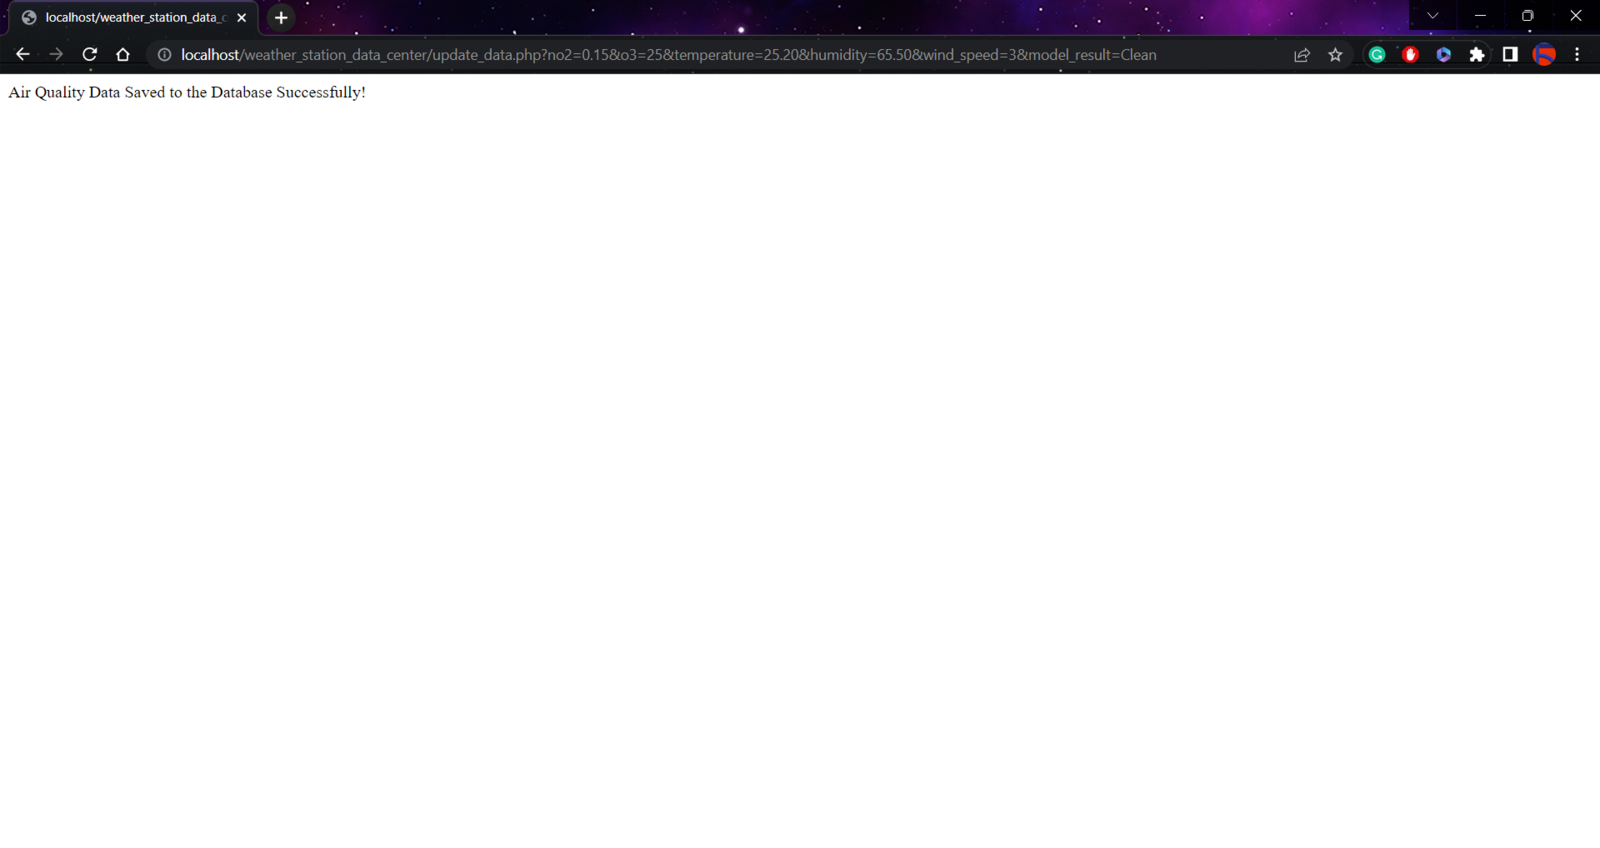
🎈⚠️📲 The web application *(update\_data.php)* saves the information transferred by FireBeetle ESP32 via an HTTP POST request with URL query parameters to the given MySQL database table.
*/update\_data.php?no2=0.15\&o3=25\&temperature=25.20\&humidity=65.50\&wind\_speed=3\&model\_result=Clean*
## Step 2.3: Tracking real-time model detection results and displaying surveillance footage captured by FireBeetle ESP32
After setting the web application on LattePanda 3 Delta 864:
🎈⚠️📲 The web application *(update\_data.php)* saves the information transferred by FireBeetle ESP32 via an HTTP POST request with URL query parameters to the given MySQL database table.
*/update\_data.php?no2=0.15\&o3=25\&temperature=25.20\&humidity=65.50\&wind\_speed=3\&model\_result=Clean*
 🎈⚠️📲 When FireBeetle ESP32 transmits raw image data via the HTTP POST request, the web application converts the received raw image data to a JPG file by executing the *bmp\_converter.py* file via the terminal.
*python "C:\Users\kutlu\New E\xampp\htdocs\weather\_station\_data\_center\env\_notifications\bmp\_converter.py"*
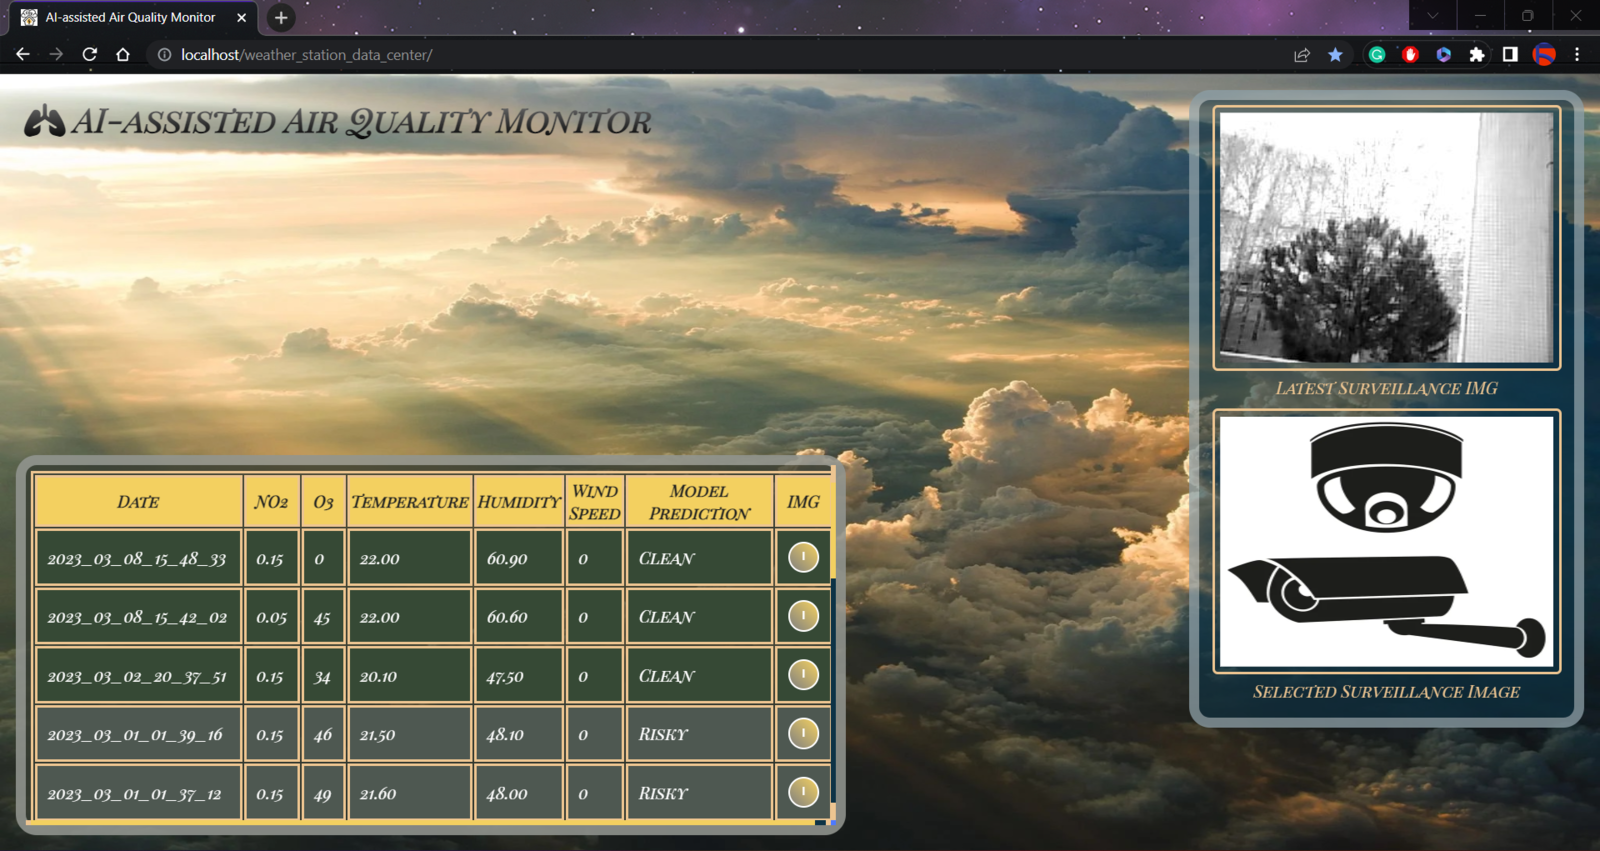
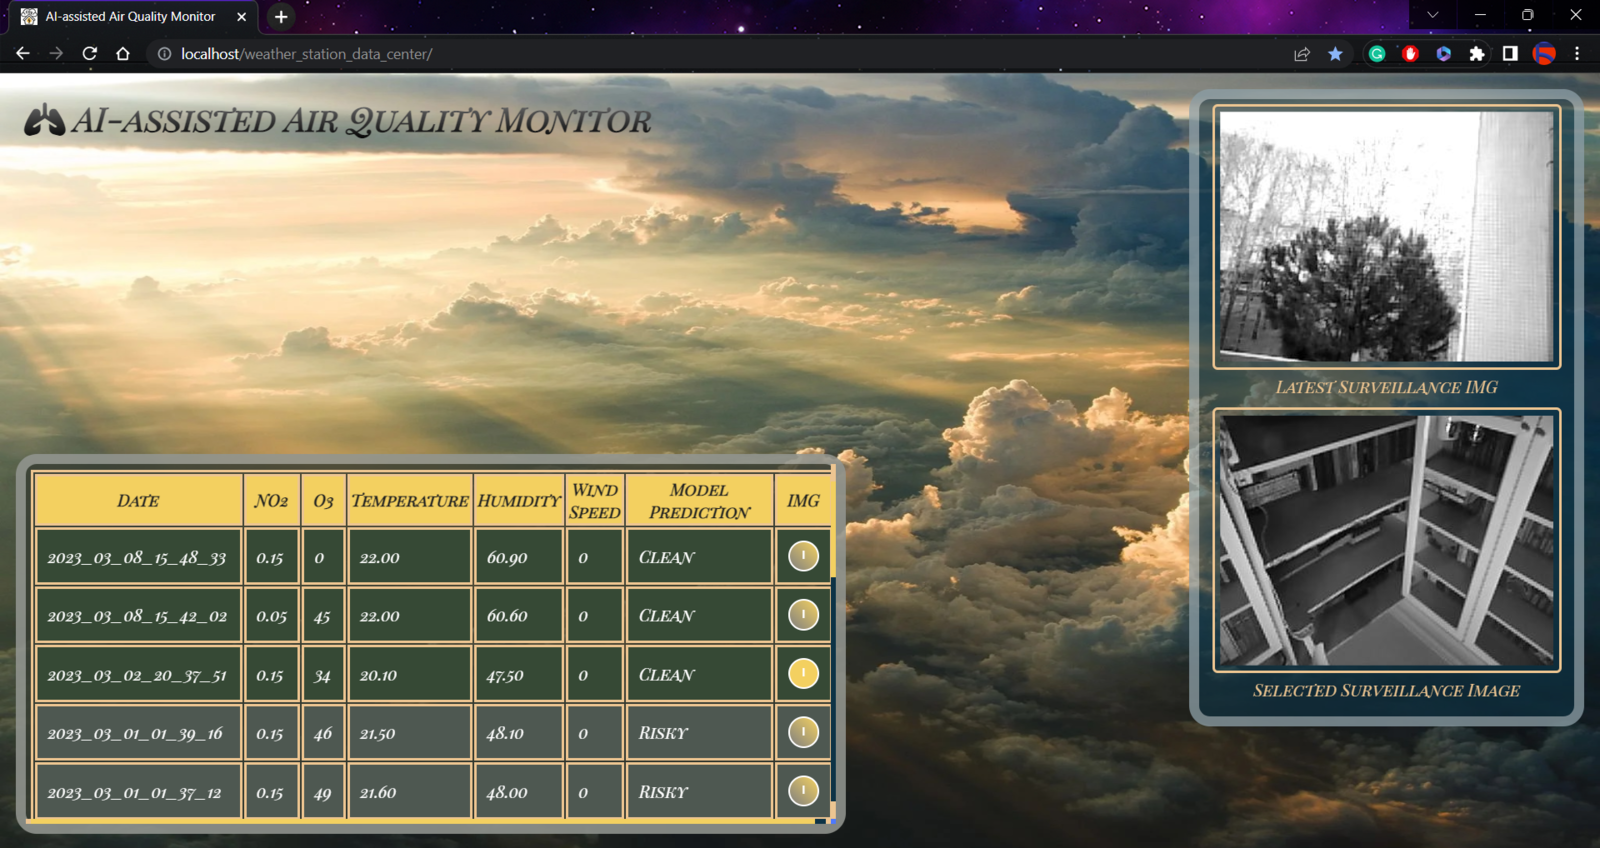
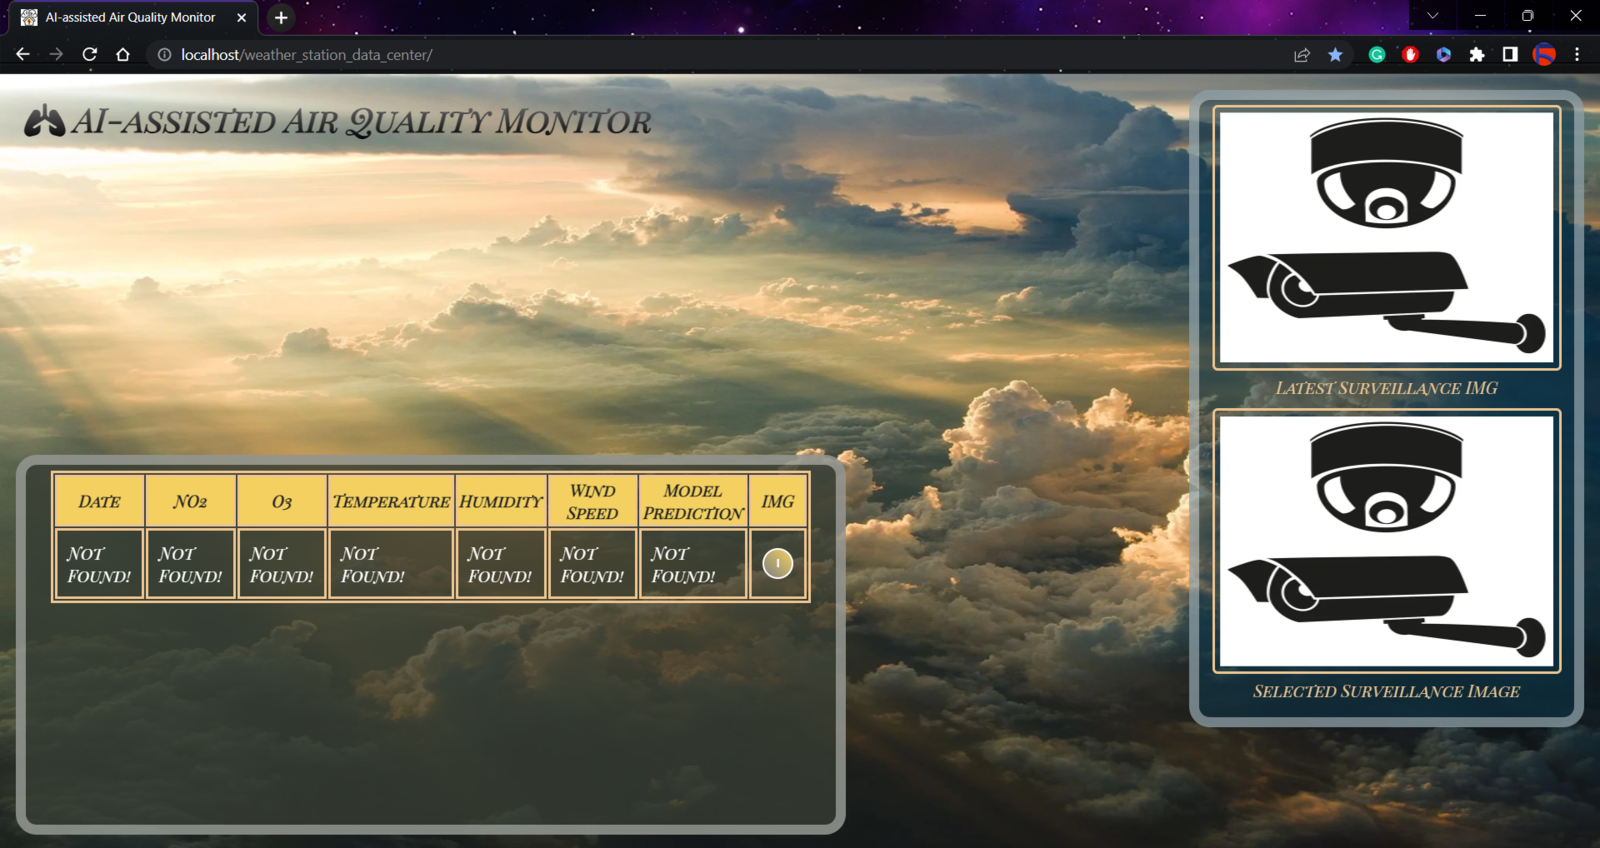
🎈⚠️📲 On the web application interface *(index.php)*, the application displays the concurrent list of data records saved in the database table as an HTML table, including HTML buttons for each data record to select the pertaining surveillance footage.
🎈⚠️📲 The web application updates its interface every 5 seconds automatically via the jQuery script to display the latest received air quality data with the model detection result and surveillance footage.
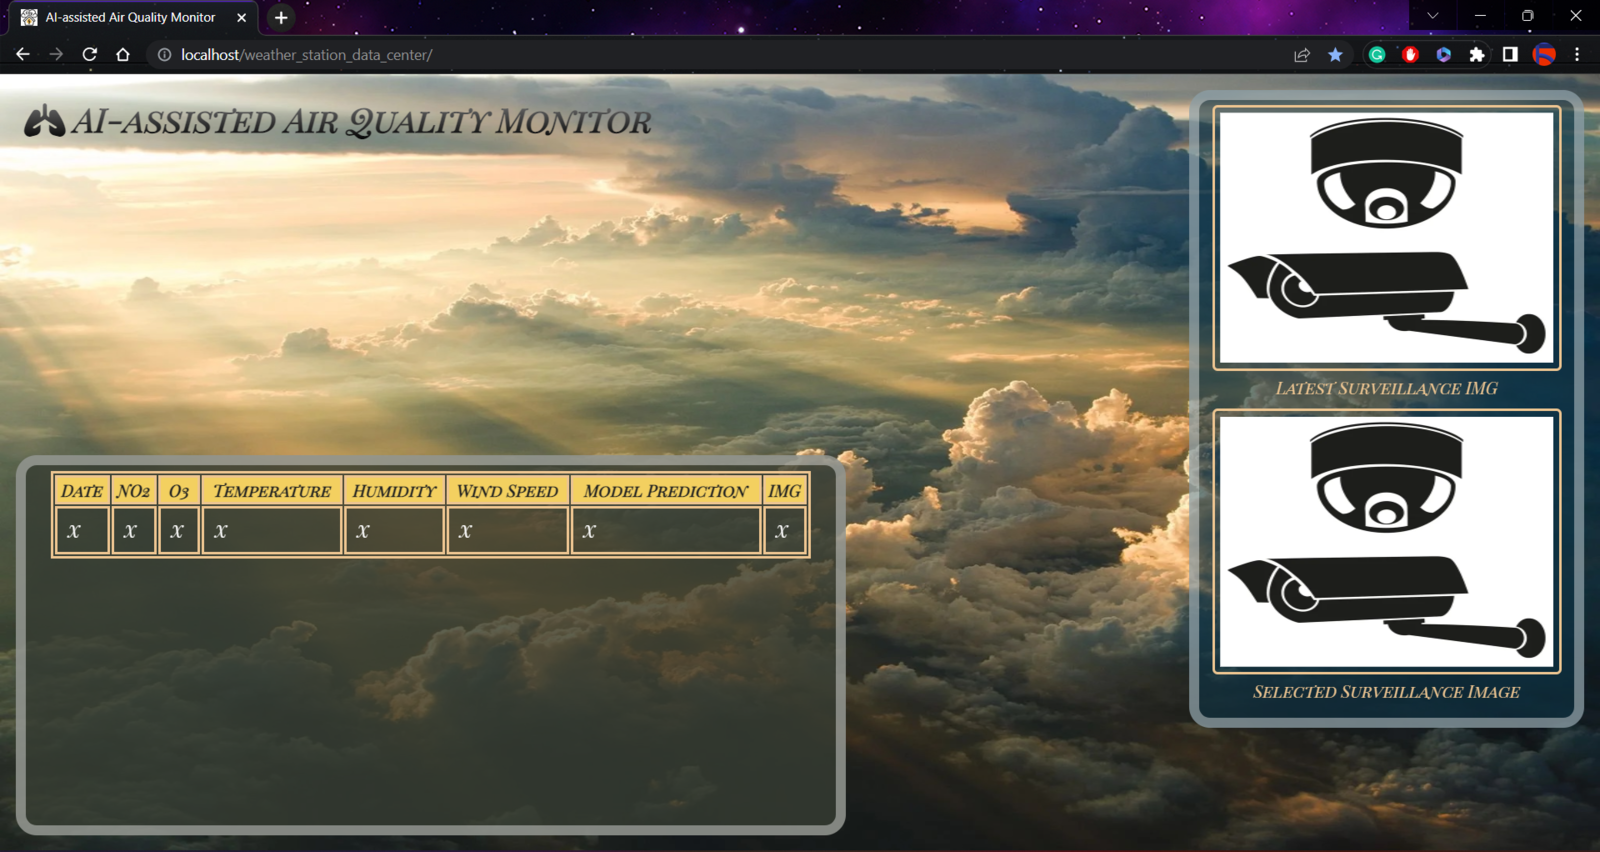
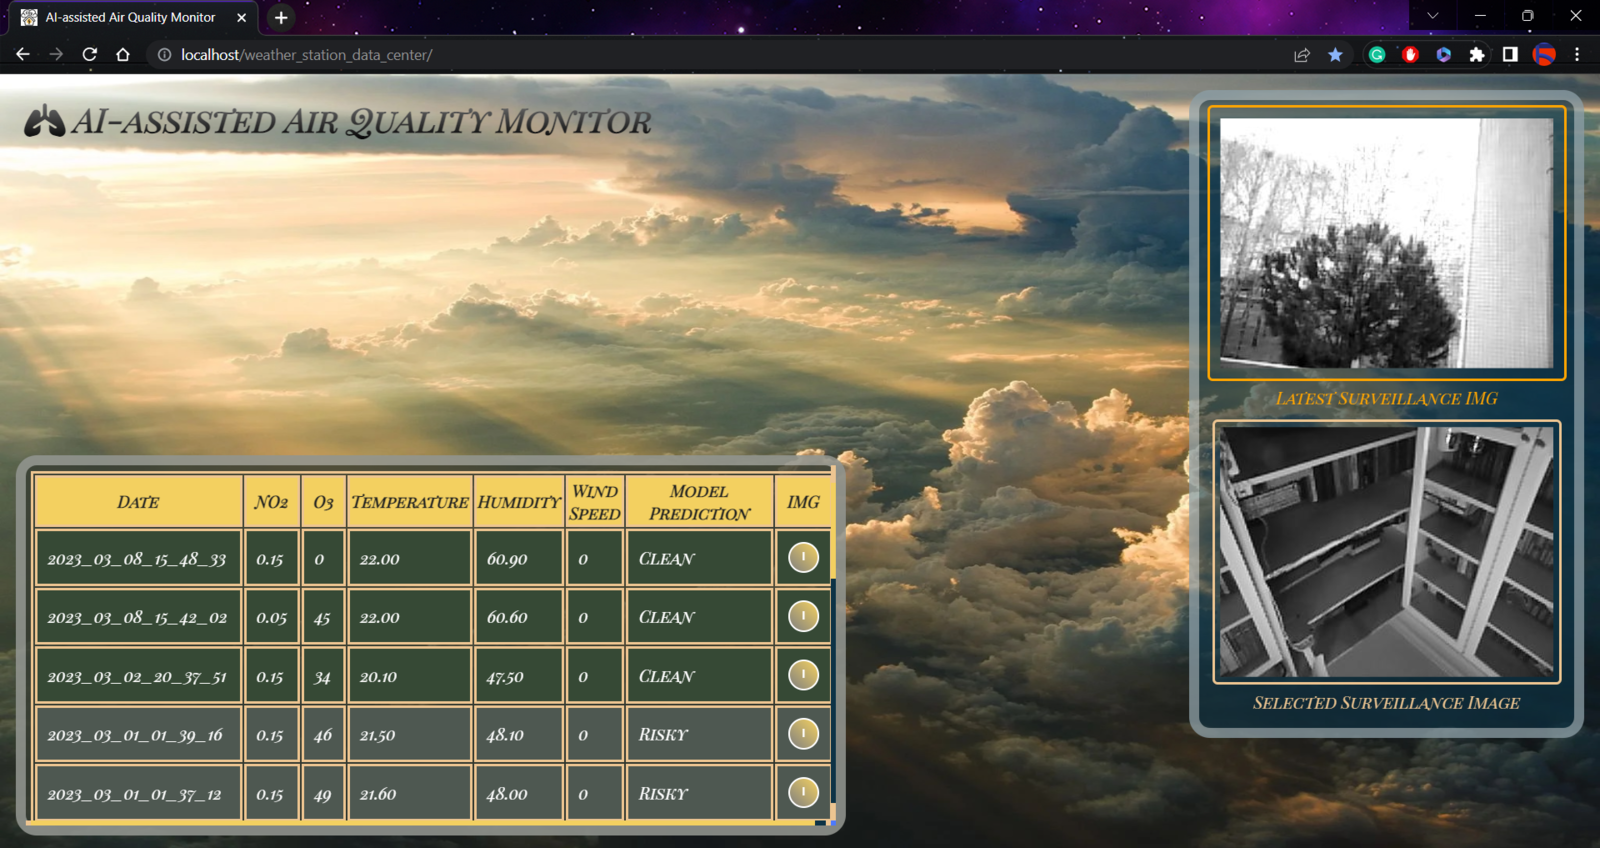
🎈⚠️📲 Until the user selects a surveillance image (footage), the web application shows the default surveillance icon in the latter image frame.
🎈⚠️📲 When FireBeetle ESP32 transmits raw image data via the HTTP POST request, the web application converts the received raw image data to a JPG file by executing the *bmp\_converter.py* file via the terminal.
*python "C:\Users\kutlu\New E\xampp\htdocs\weather\_station\_data\_center\env\_notifications\bmp\_converter.py"*
🎈⚠️📲 On the web application interface *(index.php)*, the application displays the concurrent list of data records saved in the database table as an HTML table, including HTML buttons for each data record to select the pertaining surveillance footage.
🎈⚠️📲 The web application updates its interface every 5 seconds automatically via the jQuery script to display the latest received air quality data with the model detection result and surveillance footage.
🎈⚠️📲 Until the user selects a surveillance image (footage), the web application shows the default surveillance icon in the latter image frame.
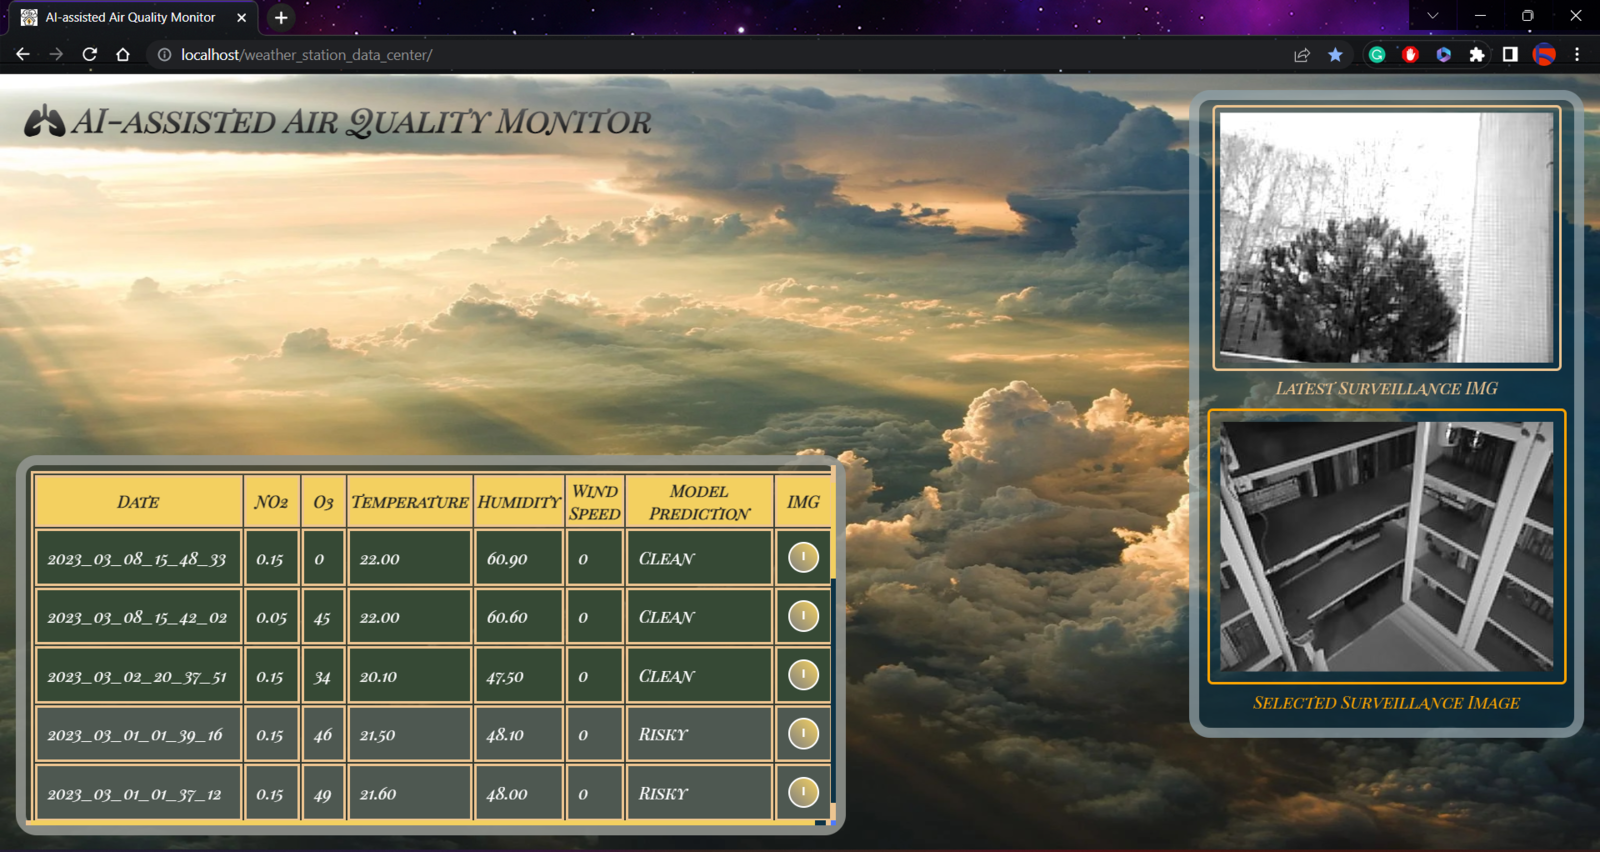
🎈⚠️📲 When the user selects a surveillance image via the assigned HTML buttons, the web application shows the selected image on the screen for further inspection.
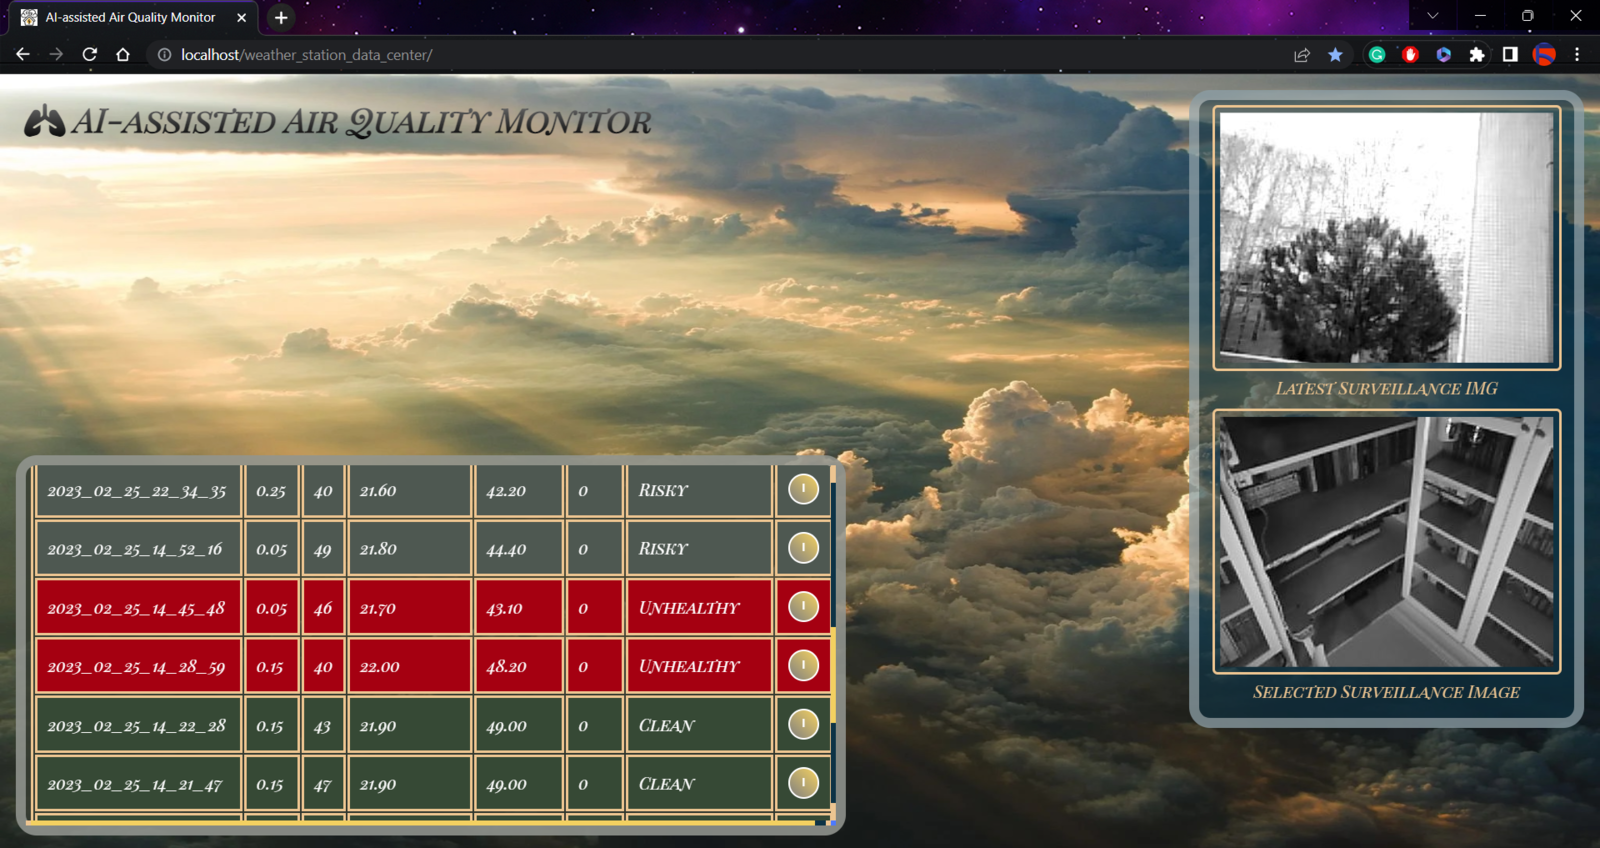
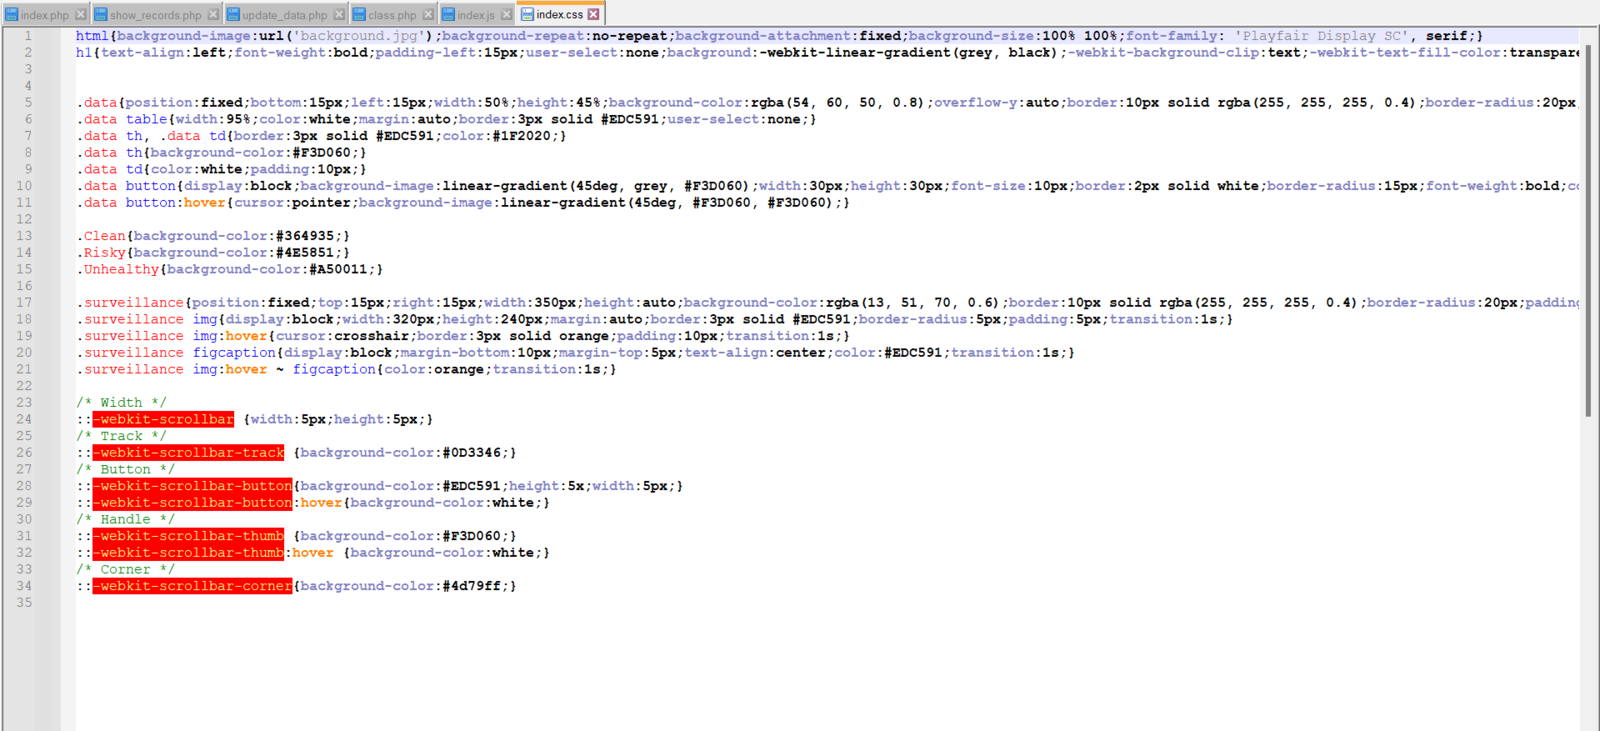
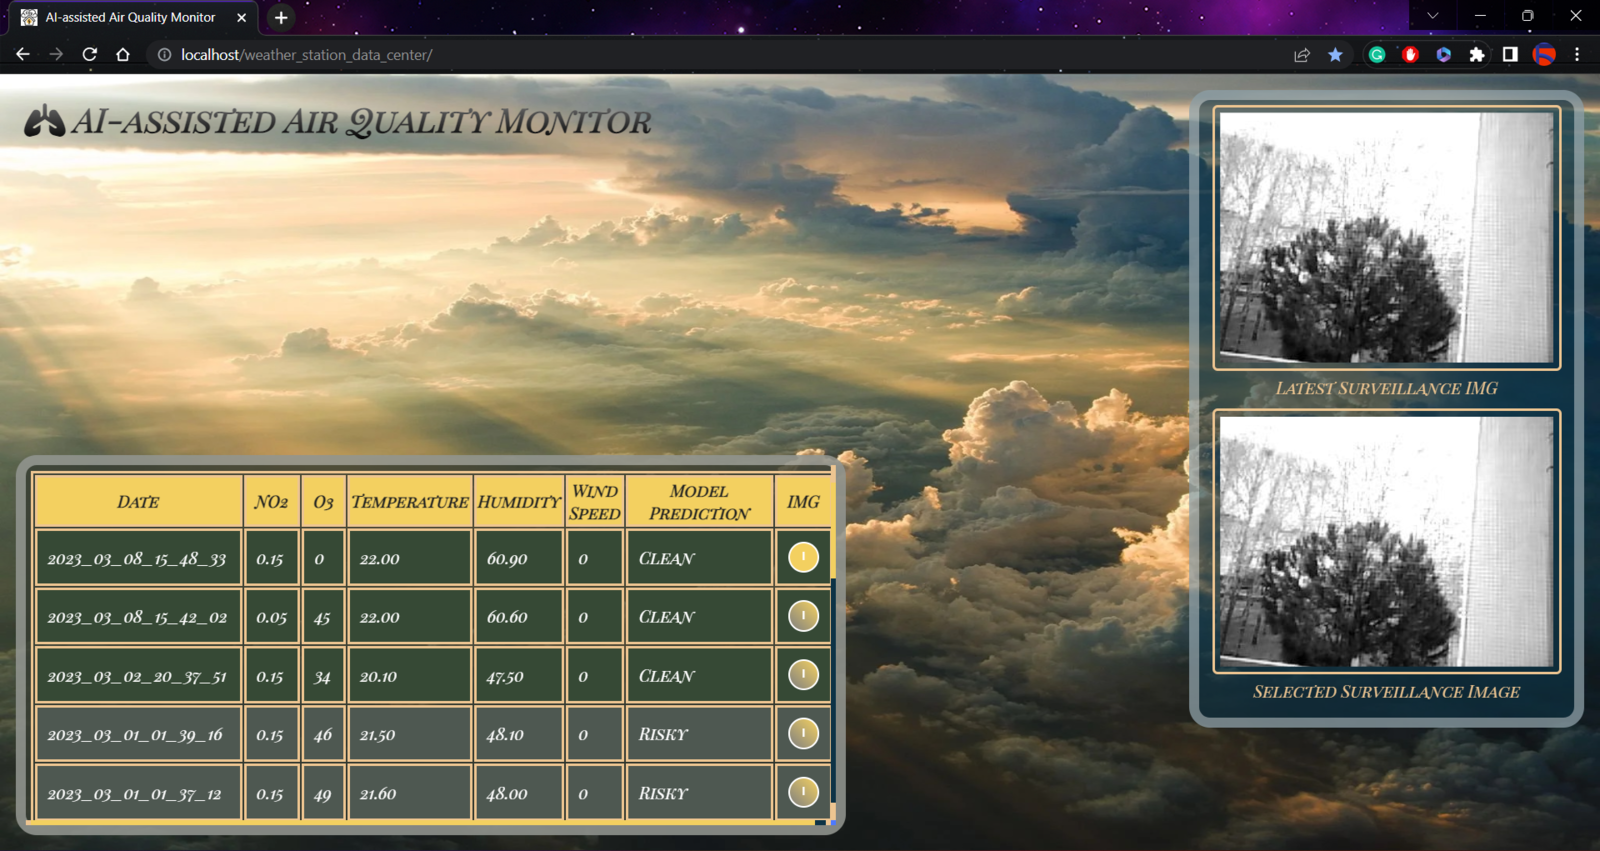 🎈⚠️📲 For each air pollution level (class), the web application changes the row color in the HTML table to clarify and emphasize the model detection results:
* Clean ➜ Green
* Risky ➜ Midnight Green
* Unhealthy ➜ Red
🎈⚠️📲 When the user hovers the cursor over the image frames, the web application highlights the selected frame.
🎈⚠️📲 For each air pollution level (class), the web application changes the row color in the HTML table to clarify and emphasize the model detection results:
* Clean ➜ Green
* Risky ➜ Midnight Green
* Unhealthy ➜ Red
🎈⚠️📲 When the user hovers the cursor over the image frames, the web application highlights the selected frame.
 ## Step 3: Setting up FireBeetle ESP32 on Arduino IDE
Before proceeding with the following steps, I needed to set up FireBeetle ESP32 on the Arduino IDE and install the required libraries for this project.
Although DFRobot provides a specific driver package and library for FireBeetle ESP32 and its media board, I encountered some issues while running different sensor libraries in combination with the provided media board library. Therefore, I decided to utilize [the latest release of the official Arduino-ESP32 package](https://docs.espressif.com/projects/arduino-esp32/en/latest/installing.html) and modify its *esp\_camera* library settings to make it compatible with the FireBeetle media board.
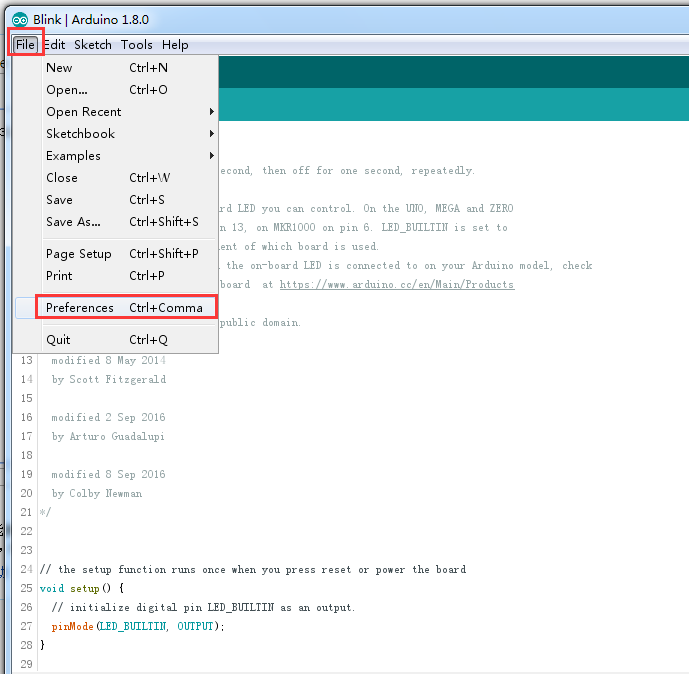
:hash: To add the Arduino-ESP32 board package to the Arduino IDE, navigate to *File ➡ Preferences* and paste the URL below under *Additional Boards Manager URLs*.
*[https://raw.githubusercontent.com/espressif/arduino-esp32/gh-pages/package\\\_esp32\\\_index.json](https://raw.githubusercontent.com/espressif/arduino-esp32/gh-pages/package\\_esp32\\_index.json)*
## Step 3: Setting up FireBeetle ESP32 on Arduino IDE
Before proceeding with the following steps, I needed to set up FireBeetle ESP32 on the Arduino IDE and install the required libraries for this project.
Although DFRobot provides a specific driver package and library for FireBeetle ESP32 and its media board, I encountered some issues while running different sensor libraries in combination with the provided media board library. Therefore, I decided to utilize [the latest release of the official Arduino-ESP32 package](https://docs.espressif.com/projects/arduino-esp32/en/latest/installing.html) and modify its *esp\_camera* library settings to make it compatible with the FireBeetle media board.
:hash: To add the Arduino-ESP32 board package to the Arduino IDE, navigate to *File ➡ Preferences* and paste the URL below under *Additional Boards Manager URLs*.
*[https://raw.githubusercontent.com/espressif/arduino-esp32/gh-pages/package\\\_esp32\\\_index.json](https://raw.githubusercontent.com/espressif/arduino-esp32/gh-pages/package\\_esp32\\_index.json)*
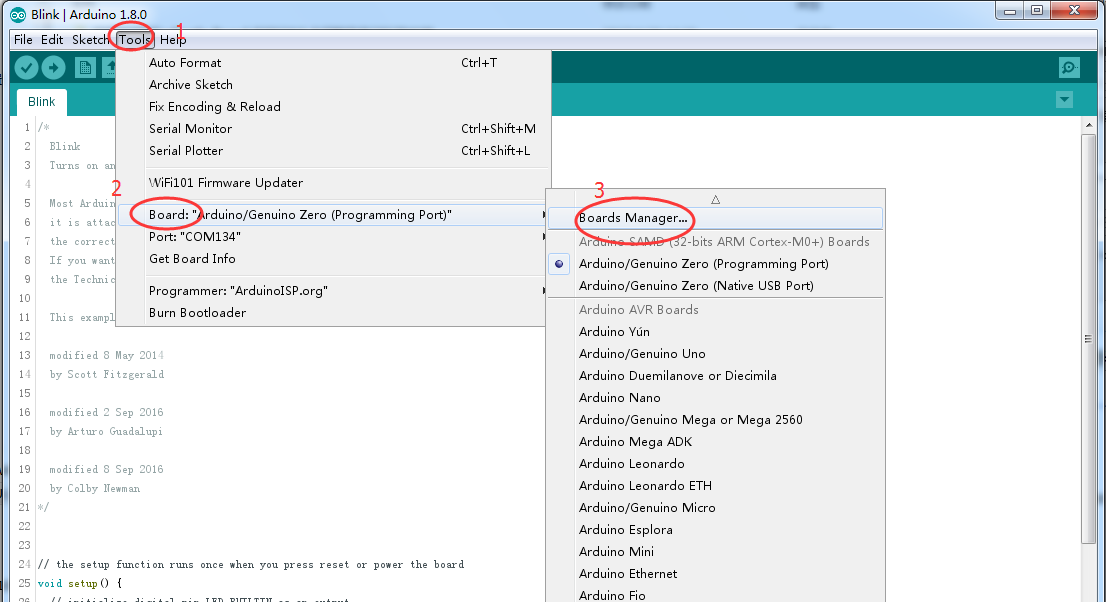
.png?fit=max&auto=format&n=cTLnQohdrJO-nQ6f&q=85&s=1ace948b94f01c65cde8625c51a64fc8) :hash: Then, to install the required core, navigate to *Tools ➡ Board ➡ Boards Manager* and search for *esp32*.
:hash: Then, to install the required core, navigate to *Tools ➡ Board ➡ Boards Manager* and search for *esp32*.
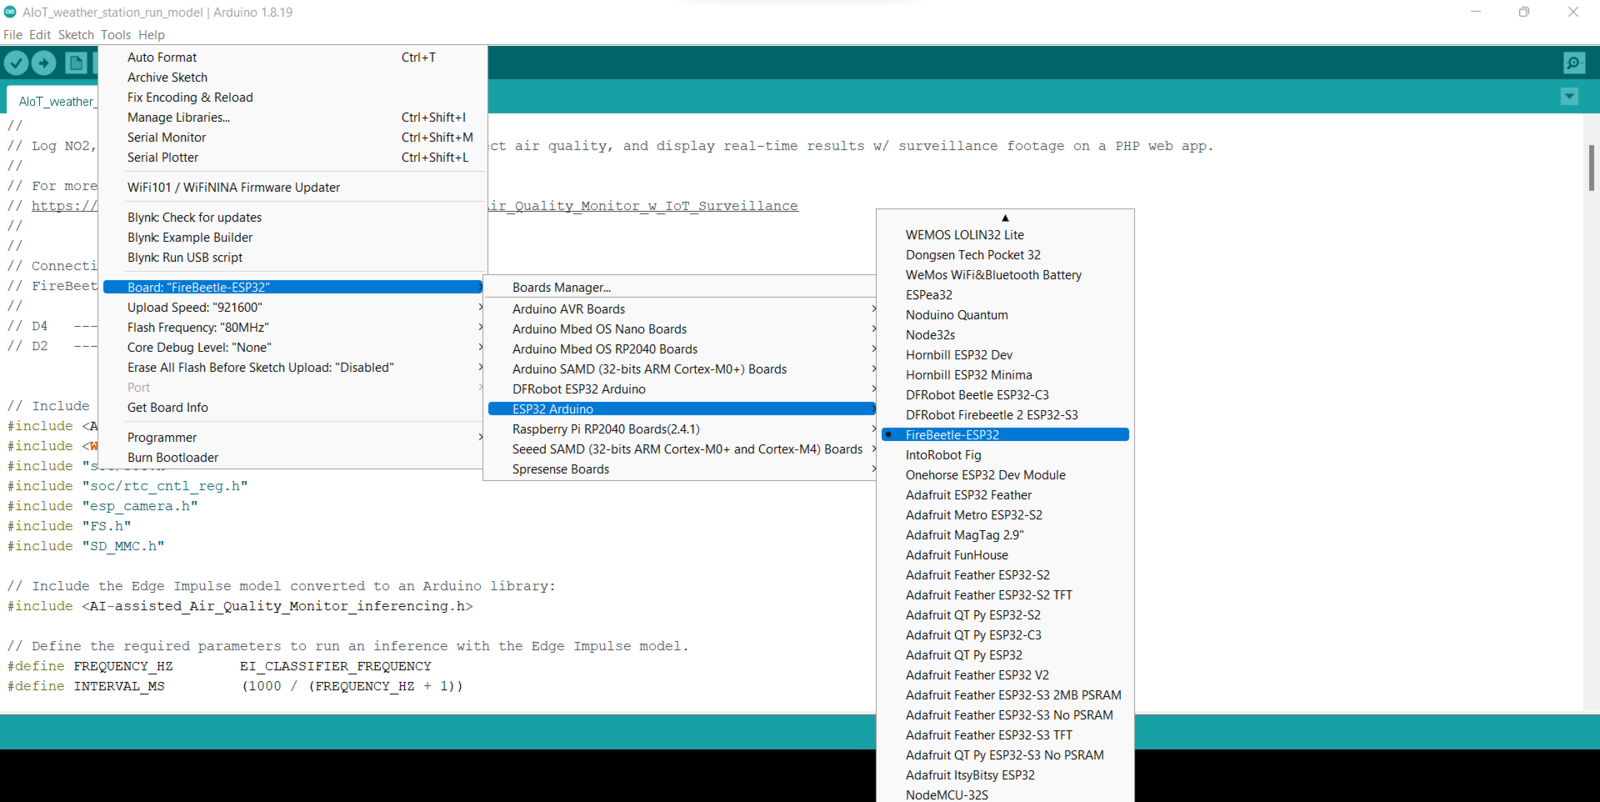
.png?fit=max&auto=format&n=577XzA-QE9Zpi0WI&q=85&s=b5699109dd5c343fe14c347dd0ee5a75) :hash: After installing the core, navigate to *Tools ➡ Board ➡ ESP32 Arduino* and select *FireBeetle-ESP32*.
:hash: After installing the core, navigate to *Tools ➡ Board ➡ ESP32 Arduino* and select *FireBeetle-ESP32*.
 :hash: Finally, download the required libraries to utilize the sensors and the SH1106 OLED screen with Arduino Mega:
DFRobot\_MultiGasSensor | [Download](https://github.com/DFRobot/DFRobot_MultiGasSensor)
DFRobot\_OzoneSensor | [Download](https://github.com/DFRobot/DFRobot_OzoneSensor/)
DHT-sensor-library | [Download](https://github.com/adafruit/DHT-sensor-library)
Adafruit\_SH1106 | [Download](https://github.com/wonho-maker/Adafruit_SH1106)
Adafruit-GFX-Library | [Download](https://github.com/adafruit/Adafruit-GFX-Library)
## Step 3.1: Displaying images on the SH1106 OLED screen
To display images (black and white) on the SH1106 OLED screen successfully, I needed to create monochromatic bitmaps from PNG or JPG files and convert those bitmaps to data arrays.
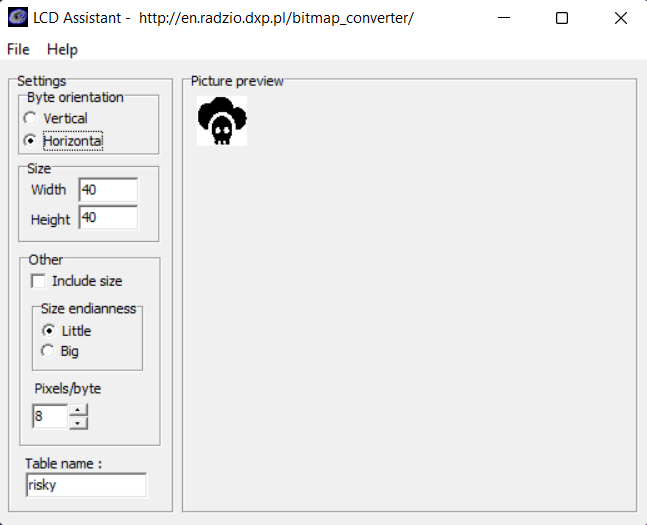
:hash: First of all, download the [LCD Assistant](http://en.radzio.dxp.pl/bitmap_converter/).
:hash: Then, upload a monochromatic bitmap and select *Vertical* or *Horizontal* depending on the screen type.
:hash: Convert the image (bitmap) and save the output (data array).
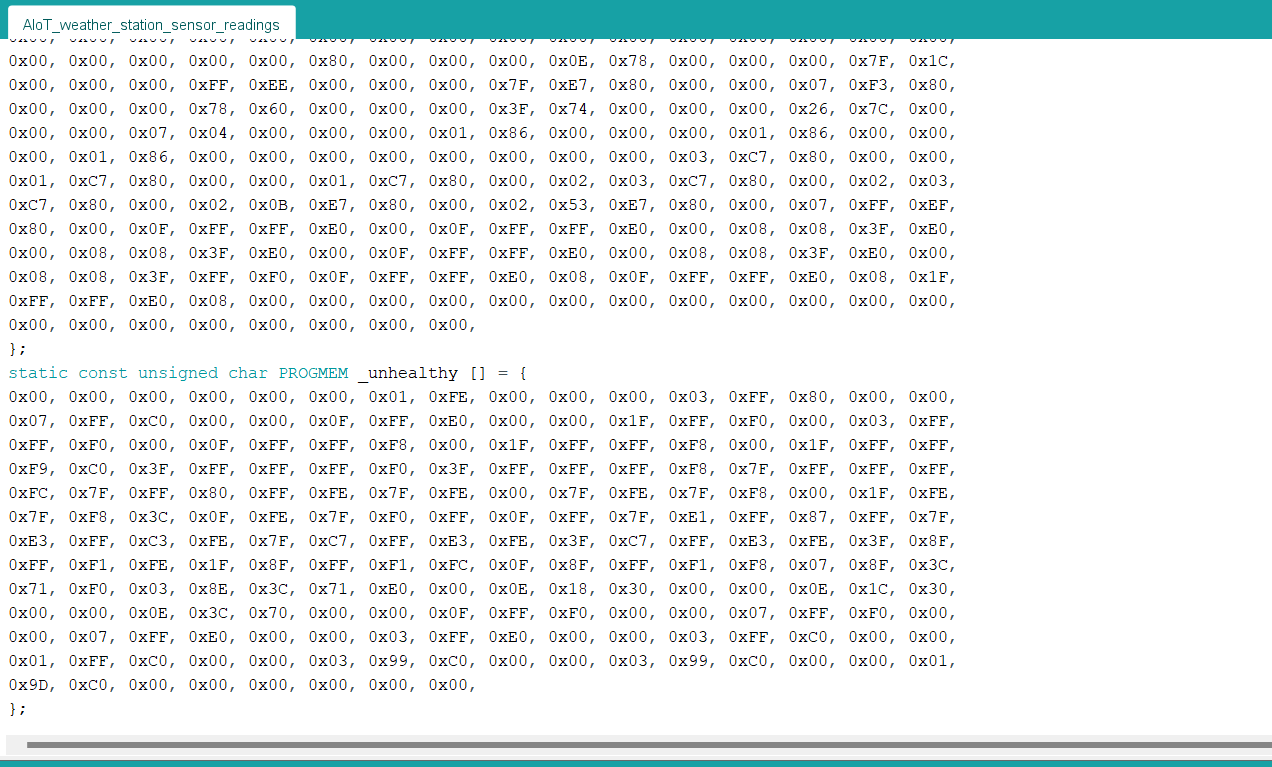
:hash: Finally, add the data array to the code and print it on the screen.
```
static const unsigned char PROGMEM _unhealthy [] = {
0x00, 0x00, 0x00, 0x00, 0x00, 0x00, 0x01, 0xFE, 0x00, 0x00, 0x00, 0x03, 0xFF, 0x80, 0x00, 0x00,
0x07, 0xFF, 0xC0, 0x00, 0x00, 0x0F, 0xFF, 0xE0, 0x00, 0x00, 0x1F, 0xFF, 0xF0, 0x00, 0x03, 0xFF,
0xFF, 0xF0, 0x00, 0x0F, 0xFF, 0xFF, 0xF8, 0x00, 0x1F, 0xFF, 0xFF, 0xF8, 0x00, 0x1F, 0xFF, 0xFF,
0xF9, 0xC0, 0x3F, 0xFF, 0xFF, 0xFF, 0xF0, 0x3F, 0xFF, 0xFF, 0xFF, 0xF8, 0x7F, 0xFF, 0xFF, 0xFF,
0xFC, 0x7F, 0xFF, 0x80, 0xFF, 0xFE, 0x7F, 0xFE, 0x00, 0x7F, 0xFE, 0x7F, 0xF8, 0x00, 0x1F, 0xFE,
0x7F, 0xF8, 0x3C, 0x0F, 0xFE, 0x7F, 0xF0, 0xFF, 0x0F, 0xFF, 0x7F, 0xE1, 0xFF, 0x87, 0xFF, 0x7F,
0xE3, 0xFF, 0xC3, 0xFE, 0x7F, 0xC7, 0xFF, 0xE3, 0xFE, 0x3F, 0xC7, 0xFF, 0xE3, 0xFE, 0x3F, 0x8F,
0xFF, 0xF1, 0xFE, 0x1F, 0x8F, 0xFF, 0xF1, 0xFC, 0x0F, 0x8F, 0xFF, 0xF1, 0xF8, 0x07, 0x8F, 0x3C,
0x71, 0xF0, 0x03, 0x8E, 0x3C, 0x71, 0xE0, 0x00, 0x0E, 0x18, 0x30, 0x00, 0x00, 0x0E, 0x1C, 0x30,
0x00, 0x00, 0x0E, 0x3C, 0x70, 0x00, 0x00, 0x0F, 0xFF, 0xF0, 0x00, 0x00, 0x07, 0xFF, 0xF0, 0x00,
0x00, 0x07, 0xFF, 0xE0, 0x00, 0x00, 0x03, 0xFF, 0xE0, 0x00, 0x00, 0x03, 0xFF, 0xC0, 0x00, 0x00,
0x01, 0xFF, 0xC0, 0x00, 0x00, 0x03, 0x99, 0xC0, 0x00, 0x00, 0x03, 0x99, 0xC0, 0x00, 0x00, 0x01,
0x9D, 0xC0, 0x00, 0x00, 0x00, 0x00, 0x00, 0x00,
};
...
display.clearDisplay();
display.drawBitmap((128 - 40) / 2, 0, _unhealthy, 40, 40, WHITE);
display.display();
```
:hash: Finally, download the required libraries to utilize the sensors and the SH1106 OLED screen with Arduino Mega:
DFRobot\_MultiGasSensor | [Download](https://github.com/DFRobot/DFRobot_MultiGasSensor)
DFRobot\_OzoneSensor | [Download](https://github.com/DFRobot/DFRobot_OzoneSensor/)
DHT-sensor-library | [Download](https://github.com/adafruit/DHT-sensor-library)
Adafruit\_SH1106 | [Download](https://github.com/wonho-maker/Adafruit_SH1106)
Adafruit-GFX-Library | [Download](https://github.com/adafruit/Adafruit-GFX-Library)
## Step 3.1: Displaying images on the SH1106 OLED screen
To display images (black and white) on the SH1106 OLED screen successfully, I needed to create monochromatic bitmaps from PNG or JPG files and convert those bitmaps to data arrays.
:hash: First of all, download the [LCD Assistant](http://en.radzio.dxp.pl/bitmap_converter/).
:hash: Then, upload a monochromatic bitmap and select *Vertical* or *Horizontal* depending on the screen type.
:hash: Convert the image (bitmap) and save the output (data array).
:hash: Finally, add the data array to the code and print it on the screen.
```
static const unsigned char PROGMEM _unhealthy [] = {
0x00, 0x00, 0x00, 0x00, 0x00, 0x00, 0x01, 0xFE, 0x00, 0x00, 0x00, 0x03, 0xFF, 0x80, 0x00, 0x00,
0x07, 0xFF, 0xC0, 0x00, 0x00, 0x0F, 0xFF, 0xE0, 0x00, 0x00, 0x1F, 0xFF, 0xF0, 0x00, 0x03, 0xFF,
0xFF, 0xF0, 0x00, 0x0F, 0xFF, 0xFF, 0xF8, 0x00, 0x1F, 0xFF, 0xFF, 0xF8, 0x00, 0x1F, 0xFF, 0xFF,
0xF9, 0xC0, 0x3F, 0xFF, 0xFF, 0xFF, 0xF0, 0x3F, 0xFF, 0xFF, 0xFF, 0xF8, 0x7F, 0xFF, 0xFF, 0xFF,
0xFC, 0x7F, 0xFF, 0x80, 0xFF, 0xFE, 0x7F, 0xFE, 0x00, 0x7F, 0xFE, 0x7F, 0xF8, 0x00, 0x1F, 0xFE,
0x7F, 0xF8, 0x3C, 0x0F, 0xFE, 0x7F, 0xF0, 0xFF, 0x0F, 0xFF, 0x7F, 0xE1, 0xFF, 0x87, 0xFF, 0x7F,
0xE3, 0xFF, 0xC3, 0xFE, 0x7F, 0xC7, 0xFF, 0xE3, 0xFE, 0x3F, 0xC7, 0xFF, 0xE3, 0xFE, 0x3F, 0x8F,
0xFF, 0xF1, 0xFE, 0x1F, 0x8F, 0xFF, 0xF1, 0xFC, 0x0F, 0x8F, 0xFF, 0xF1, 0xF8, 0x07, 0x8F, 0x3C,
0x71, 0xF0, 0x03, 0x8E, 0x3C, 0x71, 0xE0, 0x00, 0x0E, 0x18, 0x30, 0x00, 0x00, 0x0E, 0x1C, 0x30,
0x00, 0x00, 0x0E, 0x3C, 0x70, 0x00, 0x00, 0x0F, 0xFF, 0xF0, 0x00, 0x00, 0x07, 0xFF, 0xF0, 0x00,
0x00, 0x07, 0xFF, 0xE0, 0x00, 0x00, 0x03, 0xFF, 0xE0, 0x00, 0x00, 0x03, 0xFF, 0xC0, 0x00, 0x00,
0x01, 0xFF, 0xC0, 0x00, 0x00, 0x03, 0x99, 0xC0, 0x00, 0x00, 0x03, 0x99, 0xC0, 0x00, 0x00, 0x01,
0x9D, 0xC0, 0x00, 0x00, 0x00, 0x00, 0x00, 0x00,
};
...
display.clearDisplay();
display.drawBitmap((128 - 40) / 2, 0, _unhealthy, 40, 40, WHITE);
display.display();
```
 ## Step 4: Collecting air quality data and communicating with FireBeetle ESP32 via serial communication w/ Arduino Mega
After setting up FireBeetle ESP32 and installing the required libraries, I programmed Arduino Mega to collect air quality data and transmit the collected data to FireBeetle ESP32 via serial communication. As explained in the previous steps, I encountered Arduino library incompatibilities and memory allocation issues when I connected the sensors directly to FireBeetle ESP32.
* Nitrogen dioxide concentration (PPM)
* Ozone concentration (PPB)
* Temperature (°C)
* Humidity (%)
* Wind speed
Since I needed to assign air pollution levels (classes) empirically as labels for each data record while collecting air quality data to create a valid data set for my neural network model, I utilized three control buttons connected to Arduino Mega so as to choose among classes and transfer data records via serial communication. After selecting an air pollution level (class) by pressing a control button, Arduino Mega sends the selected class and the recently collected data to FireBeetle ESP32.
* Control Button (A) ➡ Clean
* Control Button (B) ➡ Risky
* Control Button (C) ➡ Unhealthy
You can download the *AIoT\_weather\_station\_sensor\_readings.ino* file to try and inspect the code for collecting air quality data and transferring the collected data via serial communication.
⭐ Include the required libraries.
```
#include <SPI.h>
#include <Wire.h>
#include <Adafruit_GFX.h>
#include <Adafruit_SH1106.h>
#include "DFRobot_OzoneSensor.h"
#include "DFRobot_MultiGasSensor.h"
#include "DHT.h"
```
⭐ Define the collect number (1-100) for the electrochemical ozone sensor.
⭐ If necessary, modify the I2C address of the ozone sensor by utilizing its configurable dial switch.
⭐ Define the ozone sensor object.
```
#define COLLECT_NUMBER 20
// To modify the ozone sensor's I2C address, configure the hardware IIC address by the dial switch - A0, A1 (ADDRESS_0 for [0 0]), (ADDRESS_1 for [1 0]), (ADDRESS_2 for [0 1]), (ADDRESS_3 for [1 1]).
/*
The default IIC device address is OZONE_ADDRESS_3:
OZONE_ADDRESS_0 0x70
OZONE_ADDRESS_1 0x71
OZONE_ADDRESS_2 0x72
OZONE_ADDRESS_3 0x73
*/
#define Ozone_IICAddress OZONE_ADDRESS_3
// Define the IIC Ozone Sensor.
DFRobot_OzoneSensor Ozone;
```
⭐ If necessary, modify the I2C address of the electrochemical NO2 sensor by utilizing its configurable dial switch.
⭐ Define the NO2 sensor object.
```
/*
The default IIC device address is 0x74:
0x74
0x75
0x76
0x77
*/
#define NO2_I2C_ADDRESS 0x74
// Define the IIC Nitrogen Dioxide (NO2) Sensor.
DFRobot_GAS_I2C gas(&Wire, NO2_I2C_ADDRESS);
```
⭐ Define the SH1106 OLED display (128x64) settings.
⭐ Define monochrome graphics.
```
#define OLED_MOSI 23 // MOSI (SDA)
#define OLED_CLK 22 // SCK
#define OLED_DC 25
#define OLED_CS 26
#define OLED_RESET 24
Adafruit_SH1106 display(OLED_MOSI, OLED_CLK, OLED_DC, OLED_RESET, OLED_CS);
```
⭐ Define the air pollution level (class) names and color codes.
```
String classes[] = {"Clean", "Risky", "Unhealthy"};
int color_codes[3][3] = {{0,255,0}, {255,255,0}, {255,0,0}};
```
⭐ Define the DHT22 temperature and humidity sensor settings and the DHT object.
```
#define DHTPIN 27
#define DHTTYPE DHT22
DHT dht(DHTPIN, DHTTYPE);
```
⭐ Define the anemometer kit's voltage signal pin (yellow).
```
#define anemometer_signal A0
```
⭐ Initialize the hardware serial port (Serial1) to communicate with FireBeetle ESP32.
```
Serial1.begin(115200);
```
⭐ Initialize the SH1106 OLED display.
```
display.begin(SH1106_SWITCHCAPVCC);
display.display();
delay(1000);
```
⭐ In the *err\_msg* function, show the error message on the SH1106 OLED screen.
```
void err_msg(){
// Show the error message on the SH1106 screen.
display.clearDisplay();
display.drawBitmap(48, 0, _error, 32, 32, WHITE);
display.setTextSize(1);
display.setTextColor(WHITE);
display.setCursor(0,40);
display.println("Check the serial monitor to see the error!");
display.display();
adjustColor(255,0,0);
delay(1000);
display.invertDisplay(true);
delay(1000);
display.invertDisplay(false);
delay(1000);
adjustColor(0,0,0);
}
```
⭐ Check the electrochemical ozone sensor connection status and set its data-obtaining mode (active or passive).
```
while(!Ozone.begin(Ozone_IICAddress)){
Serial.println("IIC Ozone Sensor is not found!\n");
err_msg();
delay(1000);
}
Serial.println("IIC Ozone Sensor is connected successfully!\n");
/*
Set IIC Ozone Sensor mode:
MEASURE_MODE_AUTOMATIC // active mode
MEASURE_MODE_PASSIVE // passive mode
*/
Ozone.setModes(MEASURE_MODE_PASSIVE);
delay(2000);
```
⭐ Check the electrochemical NO2 sensor connection status and set its data-obtaining mode (active or passive).
⭐ Activate the temperature compensation feature of the NO2 sensor.
```
while(!gas.begin()){
Serial.println("IIC NO2 Sensor is not found!\n");
err_msg();
delay(1000);
}
Serial.println("IIC NO2 Sensor is connected successfully!\n");
// Define the IIC NO2 Sensor's data-obtaining mode.
gas.changeAcquireMode(gas.PASSIVITY);
delay(1000);
// Turn on the temperature compensation for the IIC NO2 Sensor.
gas.setTempCompensation(gas.ON);
```
⭐ Initialize the DHT22 sensor.
⭐ If the sensors are working accurately, turn the RGB LED to blue.
```
dht.begin();
// If successful:
display.clearDisplay();
display.setTextSize(2);
display.setTextColor(BLACK, WHITE);
display.setCursor(0,0);
display.println("AIoT");
display.println("AirQuality");
display.println("Monitor");
display.display();
delay(1000);
adjustColor(0,0,255);
```
⭐ Wait until electrochemical gas sensors heat (warm-up) for 3 minutes.
```
if(heating){ timer = millis(); Serial.print("Heating: "); }
while(millis() - timer < 180000){ if(millis()-timer > 1000){ Serial.print("*"); data_timer = millis(); } }
heating = false;
```
⭐ In the *collect\_air\_quality\_data* function:
⭐ Collect the nitrogen dioxide (NO2) concentration.
⭐ Collect the ozone (O3) concentration.
⭐ Get the temperature and humidity measurements generated by the DHT22 sensor.
⭐ Calculate the wind speed (level) \[1 - 30] according to the output voltage generated by the anemometer kit.
⭐ Combine all collected data items to create a data record.
```
void collect_air_quality_data(){
// Collect the nitrogen dioxide (NO2) concentration.
String gastype = gas.queryGasType();
no2Concentration = gas.readGasConcentrationPPM();
Serial.print("Ambient " + gastype + " Concentration => "); Serial.print(no2Concentration); Serial.println(" PPM");
delay(1000);
// Collect the ozone (O3) concentration.
ozoneConcentration = Ozone.readOzoneData(COLLECT_NUMBER);
Serial.print("Ambient Ozone Concentration => "); Serial.print(ozoneConcentration); Serial.println(" PPB");
delay(1000);
// Collect the data generated by the DHT22 sensor.
humidity = dht.readHumidity();
temperature = dht.readTemperature(); // Celsius
// Compute the heat index in Celsius (isFahreheit = false).
hic = dht.computeHeatIndex(temperature, humidity, false);
Serial.print(F("\nHumidity: ")); Serial.print(humidity); Serial.println("%");
Serial.print(F("Temperature: ")); Serial.print(temperature); Serial.println(" °C");
Serial.print("Heat Index: "); Serial.print(hic); Serial.println(" °C");
delay(1000);
// Collect the data generated by the anemometer kit.
float outvoltage = analogRead(anemometer_signal) * (5.0 / 1023.0);
// Calculate the wind speed (level) [1 - 30] according to the output voltage.
wind_speed = 6 * outvoltage;
Serial.print("Wind Speed (Level) => "); Serial.println(wind_speed); Serial.print("\n");
// Combine all data items to create a data record.
data_packet = String(no2Concentration) + ","
+ String(ozoneConcentration) + ","
+ String(temperature) + ","
+ String(humidity) + ","
+ String(wind_speed);
}
```
⭐ In the *home\_screen* function, display the collected air quality data on the SH1106 OLED screen.
```
void home_screen(){
display.clearDisplay();
display.drawBitmap((128 - 40), 0, _home, 40, 40, WHITE);
display.setTextSize(1);
display.setTextColor(WHITE);
display.setCursor(0,5);
display.print("NO2: "); display.print(no2Concentration); display.println(" PPM");
display.print("O3: "); display.print(ozoneConcentration); display.println(" PPB\n");
display.print("Tem: "); display.print(temperature); display.println(" *C");
display.print("Hum: "); display.print(humidity); display.println("%");
display.print("Wind: "); display.println(wind_speed);
display.display();
delay(100);
}
```
⭐ In the *data\_screen* function, display the given class icon on the SH1106 OLED screen and turn the RGB LED to the given class' color code.
```
void data_screen(int i){
display.clearDisplay();
if(i==0) display.drawBitmap((128 - 40) / 2, 0, _clean, 40, 40, WHITE);
if(i==1) display.drawBitmap((128 - 40) / 2, 0, _risky, 40, 40, WHITE);
if(i==2) display.drawBitmap((128 - 40) / 2, 0, _unhealthy, 40, 40, WHITE);
// Print:
int str_x = classes[i].length() * 11;
display.setTextSize(2);
display.setTextColor(WHITE);
display.setCursor((128 - str_x) / 2, 48);
display.println(classes[i]);
display.display();
adjustColor(color_codes[i][0], color_codes[i][1], color_codes[i][2]);
delay(2000);
adjustColor(0,0,0);
}
```
⭐ If one of the control buttons (A, B, or C) is pressed, add the selected air pollution level to the recently generated data record and send it to FireBeetle ESP32 via serial communication. Then, notify the user according to the selected class.
```
if(!digitalRead(button_A)){ Serial1.print("Save&"+data_packet+"&Clean"); data_screen(0); }
if(!digitalRead(button_B)){ Serial1.print("Save&"+data_packet+"&Risky"); data_screen(1); }
if(!digitalRead(button_C)){ Serial1.print("Save&"+data_packet+"&Unhealthy"); data_screen(2); }
```
⭐ In the *run\_screen* function, inform the user when the collected data items are transferred to FireBeetle ESP32 via serial communication.
```
void run_screen(){
display.clearDisplay();
display.drawBitmap((128 - 40) / 2, 0, _run, 40, 40, WHITE);
// Print:
display.setTextSize(1);
display.setTextColor(WHITE);
display.setCursor(0, 48);
display.println("Data transferred to");
display.println("FireBeetle ESP32!");
display.display();
adjustColor(255,0,255);
delay(2000);
adjustColor(0,0,0);
}
```
⭐ Every minute, transmit the collected air quality data parameters to FireBeetle ESP32 via serial communication in order to run the neural network model with the latest collected data. Then, turn the RGB LED to magenta.
```
if(millis() - data_timer > 60000){ Serial1.print("Data,"+data_packet); run_screen(); data_timer = millis(); }
```
## Step 4: Collecting air quality data and communicating with FireBeetle ESP32 via serial communication w/ Arduino Mega
After setting up FireBeetle ESP32 and installing the required libraries, I programmed Arduino Mega to collect air quality data and transmit the collected data to FireBeetle ESP32 via serial communication. As explained in the previous steps, I encountered Arduino library incompatibilities and memory allocation issues when I connected the sensors directly to FireBeetle ESP32.
* Nitrogen dioxide concentration (PPM)
* Ozone concentration (PPB)
* Temperature (°C)
* Humidity (%)
* Wind speed
Since I needed to assign air pollution levels (classes) empirically as labels for each data record while collecting air quality data to create a valid data set for my neural network model, I utilized three control buttons connected to Arduino Mega so as to choose among classes and transfer data records via serial communication. After selecting an air pollution level (class) by pressing a control button, Arduino Mega sends the selected class and the recently collected data to FireBeetle ESP32.
* Control Button (A) ➡ Clean
* Control Button (B) ➡ Risky
* Control Button (C) ➡ Unhealthy
You can download the *AIoT\_weather\_station\_sensor\_readings.ino* file to try and inspect the code for collecting air quality data and transferring the collected data via serial communication.
⭐ Include the required libraries.
```
#include <SPI.h>
#include <Wire.h>
#include <Adafruit_GFX.h>
#include <Adafruit_SH1106.h>
#include "DFRobot_OzoneSensor.h"
#include "DFRobot_MultiGasSensor.h"
#include "DHT.h"
```
⭐ Define the collect number (1-100) for the electrochemical ozone sensor.
⭐ If necessary, modify the I2C address of the ozone sensor by utilizing its configurable dial switch.
⭐ Define the ozone sensor object.
```
#define COLLECT_NUMBER 20
// To modify the ozone sensor's I2C address, configure the hardware IIC address by the dial switch - A0, A1 (ADDRESS_0 for [0 0]), (ADDRESS_1 for [1 0]), (ADDRESS_2 for [0 1]), (ADDRESS_3 for [1 1]).
/*
The default IIC device address is OZONE_ADDRESS_3:
OZONE_ADDRESS_0 0x70
OZONE_ADDRESS_1 0x71
OZONE_ADDRESS_2 0x72
OZONE_ADDRESS_3 0x73
*/
#define Ozone_IICAddress OZONE_ADDRESS_3
// Define the IIC Ozone Sensor.
DFRobot_OzoneSensor Ozone;
```
⭐ If necessary, modify the I2C address of the electrochemical NO2 sensor by utilizing its configurable dial switch.
⭐ Define the NO2 sensor object.
```
/*
The default IIC device address is 0x74:
0x74
0x75
0x76
0x77
*/
#define NO2_I2C_ADDRESS 0x74
// Define the IIC Nitrogen Dioxide (NO2) Sensor.
DFRobot_GAS_I2C gas(&Wire, NO2_I2C_ADDRESS);
```
⭐ Define the SH1106 OLED display (128x64) settings.
⭐ Define monochrome graphics.
```
#define OLED_MOSI 23 // MOSI (SDA)
#define OLED_CLK 22 // SCK
#define OLED_DC 25
#define OLED_CS 26
#define OLED_RESET 24
Adafruit_SH1106 display(OLED_MOSI, OLED_CLK, OLED_DC, OLED_RESET, OLED_CS);
```
⭐ Define the air pollution level (class) names and color codes.
```
String classes[] = {"Clean", "Risky", "Unhealthy"};
int color_codes[3][3] = {{0,255,0}, {255,255,0}, {255,0,0}};
```
⭐ Define the DHT22 temperature and humidity sensor settings and the DHT object.
```
#define DHTPIN 27
#define DHTTYPE DHT22
DHT dht(DHTPIN, DHTTYPE);
```
⭐ Define the anemometer kit's voltage signal pin (yellow).
```
#define anemometer_signal A0
```
⭐ Initialize the hardware serial port (Serial1) to communicate with FireBeetle ESP32.
```
Serial1.begin(115200);
```
⭐ Initialize the SH1106 OLED display.
```
display.begin(SH1106_SWITCHCAPVCC);
display.display();
delay(1000);
```
⭐ In the *err\_msg* function, show the error message on the SH1106 OLED screen.
```
void err_msg(){
// Show the error message on the SH1106 screen.
display.clearDisplay();
display.drawBitmap(48, 0, _error, 32, 32, WHITE);
display.setTextSize(1);
display.setTextColor(WHITE);
display.setCursor(0,40);
display.println("Check the serial monitor to see the error!");
display.display();
adjustColor(255,0,0);
delay(1000);
display.invertDisplay(true);
delay(1000);
display.invertDisplay(false);
delay(1000);
adjustColor(0,0,0);
}
```
⭐ Check the electrochemical ozone sensor connection status and set its data-obtaining mode (active or passive).
```
while(!Ozone.begin(Ozone_IICAddress)){
Serial.println("IIC Ozone Sensor is not found!\n");
err_msg();
delay(1000);
}
Serial.println("IIC Ozone Sensor is connected successfully!\n");
/*
Set IIC Ozone Sensor mode:
MEASURE_MODE_AUTOMATIC // active mode
MEASURE_MODE_PASSIVE // passive mode
*/
Ozone.setModes(MEASURE_MODE_PASSIVE);
delay(2000);
```
⭐ Check the electrochemical NO2 sensor connection status and set its data-obtaining mode (active or passive).
⭐ Activate the temperature compensation feature of the NO2 sensor.
```
while(!gas.begin()){
Serial.println("IIC NO2 Sensor is not found!\n");
err_msg();
delay(1000);
}
Serial.println("IIC NO2 Sensor is connected successfully!\n");
// Define the IIC NO2 Sensor's data-obtaining mode.
gas.changeAcquireMode(gas.PASSIVITY);
delay(1000);
// Turn on the temperature compensation for the IIC NO2 Sensor.
gas.setTempCompensation(gas.ON);
```
⭐ Initialize the DHT22 sensor.
⭐ If the sensors are working accurately, turn the RGB LED to blue.
```
dht.begin();
// If successful:
display.clearDisplay();
display.setTextSize(2);
display.setTextColor(BLACK, WHITE);
display.setCursor(0,0);
display.println("AIoT");
display.println("AirQuality");
display.println("Monitor");
display.display();
delay(1000);
adjustColor(0,0,255);
```
⭐ Wait until electrochemical gas sensors heat (warm-up) for 3 minutes.
```
if(heating){ timer = millis(); Serial.print("Heating: "); }
while(millis() - timer < 180000){ if(millis()-timer > 1000){ Serial.print("*"); data_timer = millis(); } }
heating = false;
```
⭐ In the *collect\_air\_quality\_data* function:
⭐ Collect the nitrogen dioxide (NO2) concentration.
⭐ Collect the ozone (O3) concentration.
⭐ Get the temperature and humidity measurements generated by the DHT22 sensor.
⭐ Calculate the wind speed (level) \[1 - 30] according to the output voltage generated by the anemometer kit.
⭐ Combine all collected data items to create a data record.
```
void collect_air_quality_data(){
// Collect the nitrogen dioxide (NO2) concentration.
String gastype = gas.queryGasType();
no2Concentration = gas.readGasConcentrationPPM();
Serial.print("Ambient " + gastype + " Concentration => "); Serial.print(no2Concentration); Serial.println(" PPM");
delay(1000);
// Collect the ozone (O3) concentration.
ozoneConcentration = Ozone.readOzoneData(COLLECT_NUMBER);
Serial.print("Ambient Ozone Concentration => "); Serial.print(ozoneConcentration); Serial.println(" PPB");
delay(1000);
// Collect the data generated by the DHT22 sensor.
humidity = dht.readHumidity();
temperature = dht.readTemperature(); // Celsius
// Compute the heat index in Celsius (isFahreheit = false).
hic = dht.computeHeatIndex(temperature, humidity, false);
Serial.print(F("\nHumidity: ")); Serial.print(humidity); Serial.println("%");
Serial.print(F("Temperature: ")); Serial.print(temperature); Serial.println(" °C");
Serial.print("Heat Index: "); Serial.print(hic); Serial.println(" °C");
delay(1000);
// Collect the data generated by the anemometer kit.
float outvoltage = analogRead(anemometer_signal) * (5.0 / 1023.0);
// Calculate the wind speed (level) [1 - 30] according to the output voltage.
wind_speed = 6 * outvoltage;
Serial.print("Wind Speed (Level) => "); Serial.println(wind_speed); Serial.print("\n");
// Combine all data items to create a data record.
data_packet = String(no2Concentration) + ","
+ String(ozoneConcentration) + ","
+ String(temperature) + ","
+ String(humidity) + ","
+ String(wind_speed);
}
```
⭐ In the *home\_screen* function, display the collected air quality data on the SH1106 OLED screen.
```
void home_screen(){
display.clearDisplay();
display.drawBitmap((128 - 40), 0, _home, 40, 40, WHITE);
display.setTextSize(1);
display.setTextColor(WHITE);
display.setCursor(0,5);
display.print("NO2: "); display.print(no2Concentration); display.println(" PPM");
display.print("O3: "); display.print(ozoneConcentration); display.println(" PPB\n");
display.print("Tem: "); display.print(temperature); display.println(" *C");
display.print("Hum: "); display.print(humidity); display.println("%");
display.print("Wind: "); display.println(wind_speed);
display.display();
delay(100);
}
```
⭐ In the *data\_screen* function, display the given class icon on the SH1106 OLED screen and turn the RGB LED to the given class' color code.
```
void data_screen(int i){
display.clearDisplay();
if(i==0) display.drawBitmap((128 - 40) / 2, 0, _clean, 40, 40, WHITE);
if(i==1) display.drawBitmap((128 - 40) / 2, 0, _risky, 40, 40, WHITE);
if(i==2) display.drawBitmap((128 - 40) / 2, 0, _unhealthy, 40, 40, WHITE);
// Print:
int str_x = classes[i].length() * 11;
display.setTextSize(2);
display.setTextColor(WHITE);
display.setCursor((128 - str_x) / 2, 48);
display.println(classes[i]);
display.display();
adjustColor(color_codes[i][0], color_codes[i][1], color_codes[i][2]);
delay(2000);
adjustColor(0,0,0);
}
```
⭐ If one of the control buttons (A, B, or C) is pressed, add the selected air pollution level to the recently generated data record and send it to FireBeetle ESP32 via serial communication. Then, notify the user according to the selected class.
```
if(!digitalRead(button_A)){ Serial1.print("Save&"+data_packet+"&Clean"); data_screen(0); }
if(!digitalRead(button_B)){ Serial1.print("Save&"+data_packet+"&Risky"); data_screen(1); }
if(!digitalRead(button_C)){ Serial1.print("Save&"+data_packet+"&Unhealthy"); data_screen(2); }
```
⭐ In the *run\_screen* function, inform the user when the collected data items are transferred to FireBeetle ESP32 via serial communication.
```
void run_screen(){
display.clearDisplay();
display.drawBitmap((128 - 40) / 2, 0, _run, 40, 40, WHITE);
// Print:
display.setTextSize(1);
display.setTextColor(WHITE);
display.setCursor(0, 48);
display.println("Data transferred to");
display.println("FireBeetle ESP32!");
display.display();
adjustColor(255,0,255);
delay(2000);
adjustColor(0,0,0);
}
```
⭐ Every minute, transmit the collected air quality data parameters to FireBeetle ESP32 via serial communication in order to run the neural network model with the latest collected data. Then, turn the RGB LED to magenta.
```
if(millis() - data_timer > 60000){ Serial1.print("Data,"+data_packet); run_screen(); data_timer = millis(); }
```
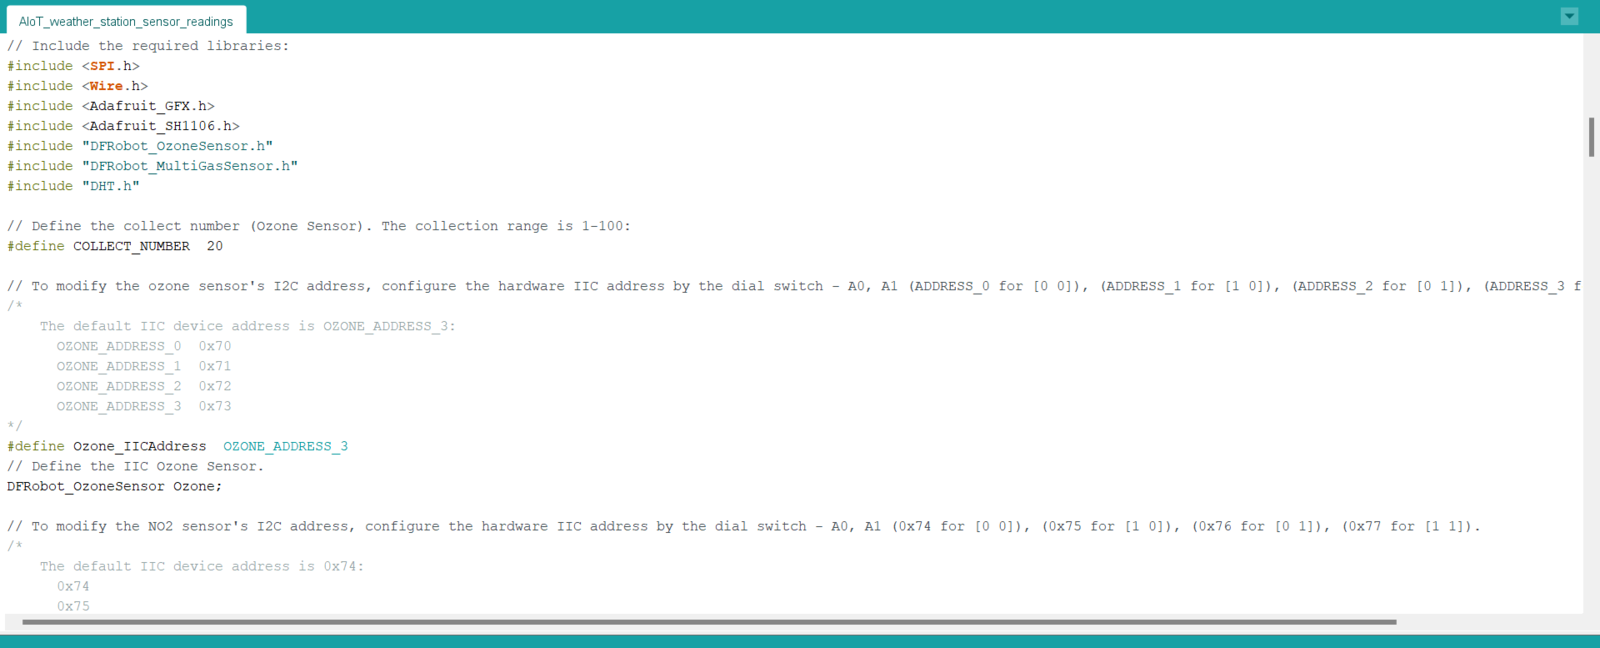
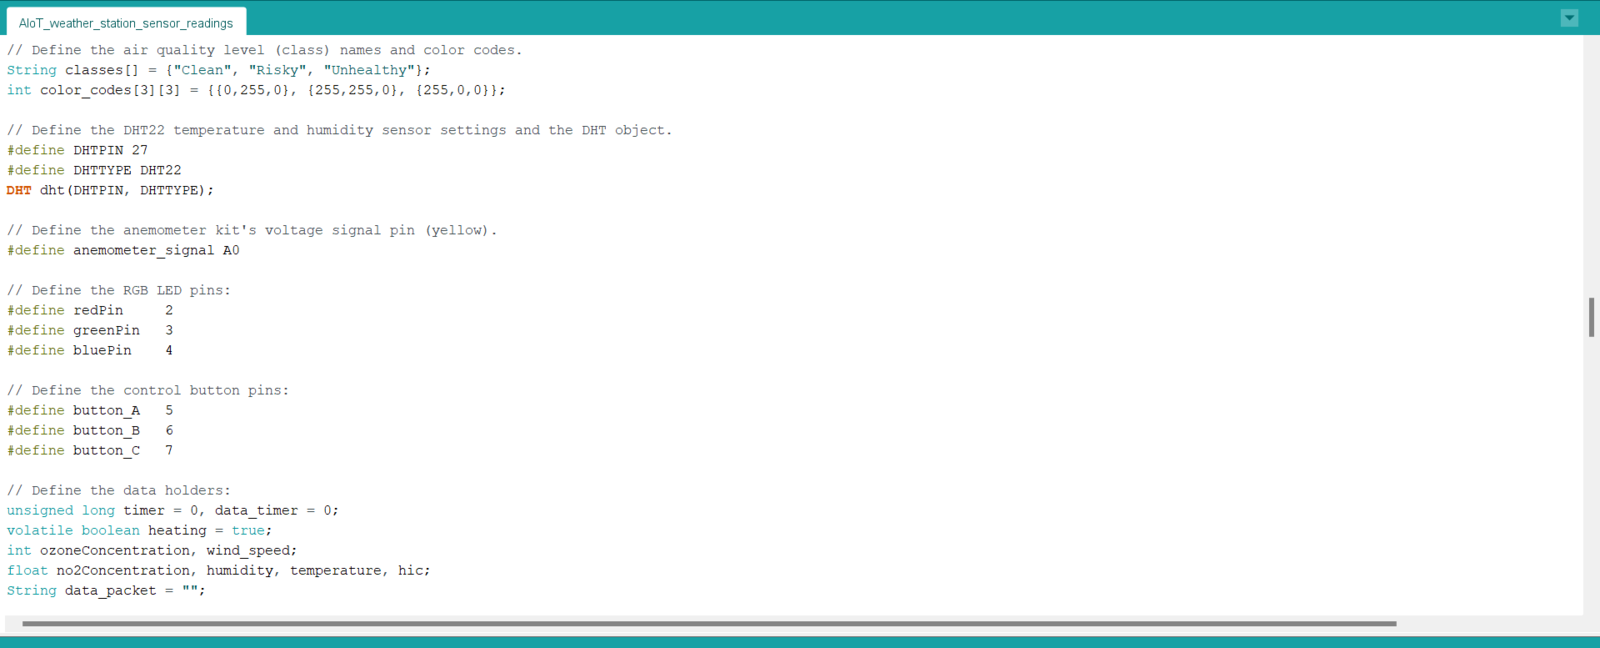
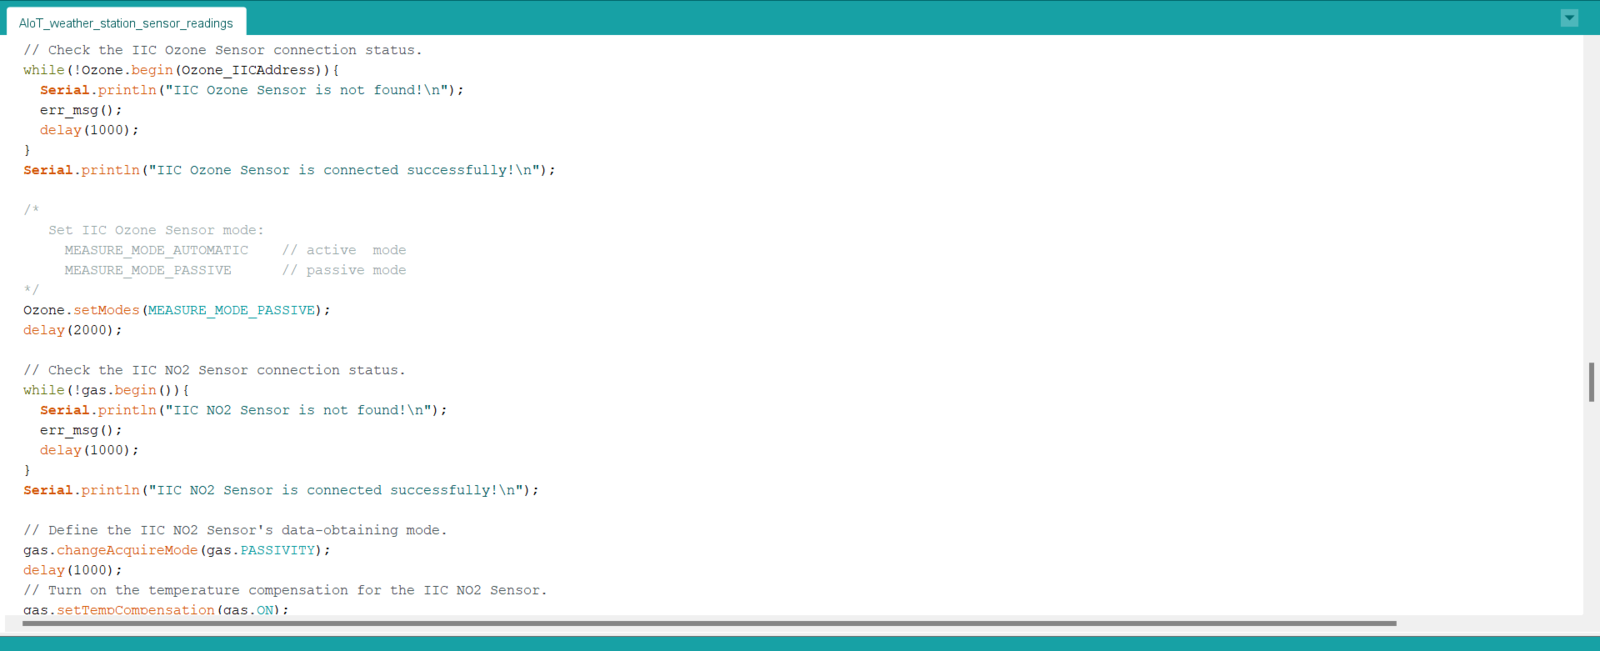
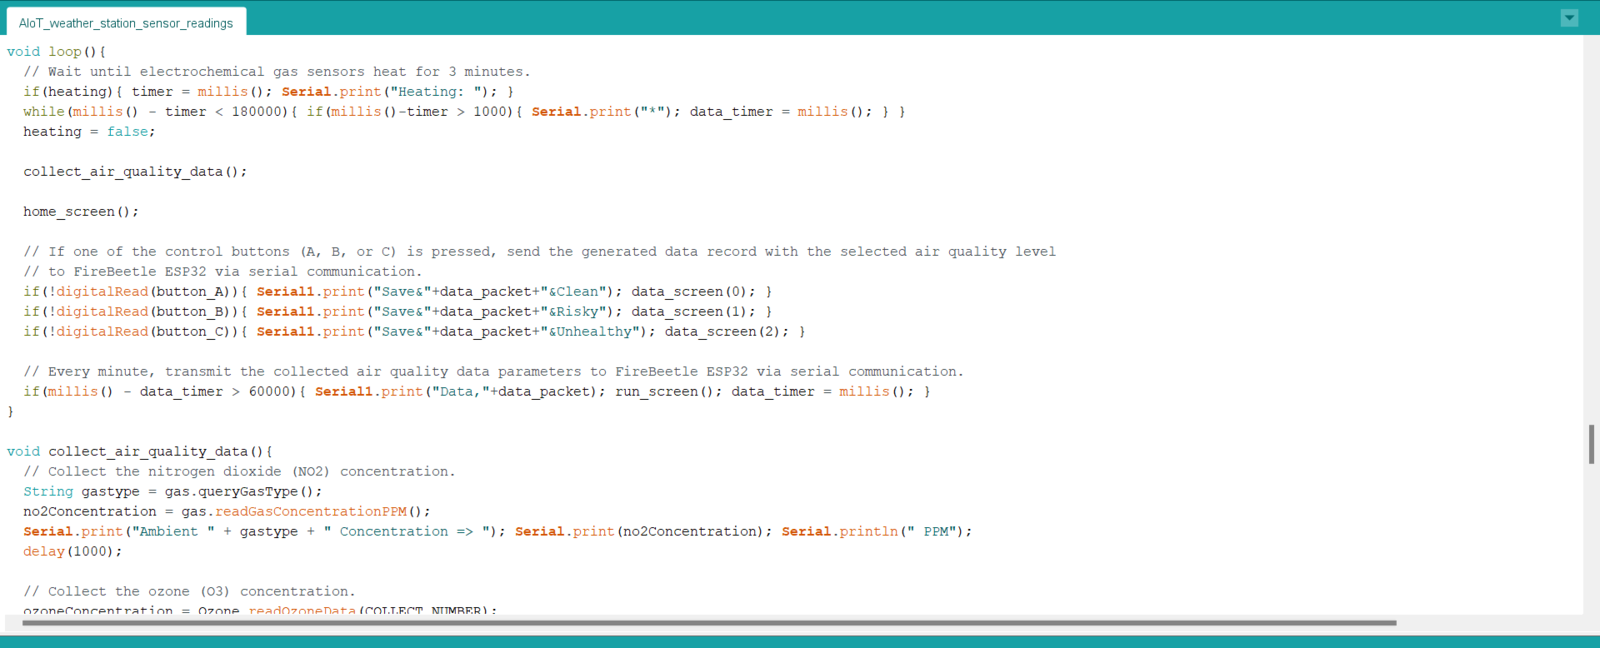
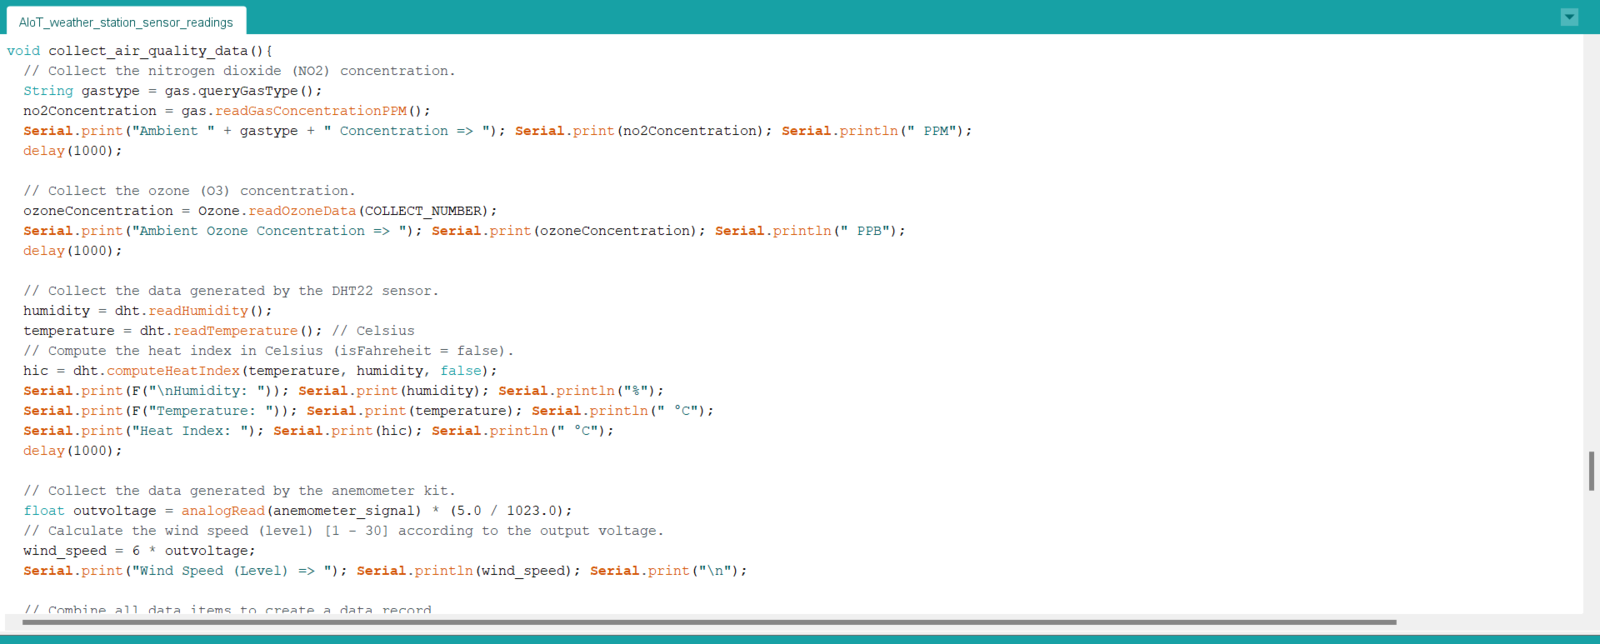
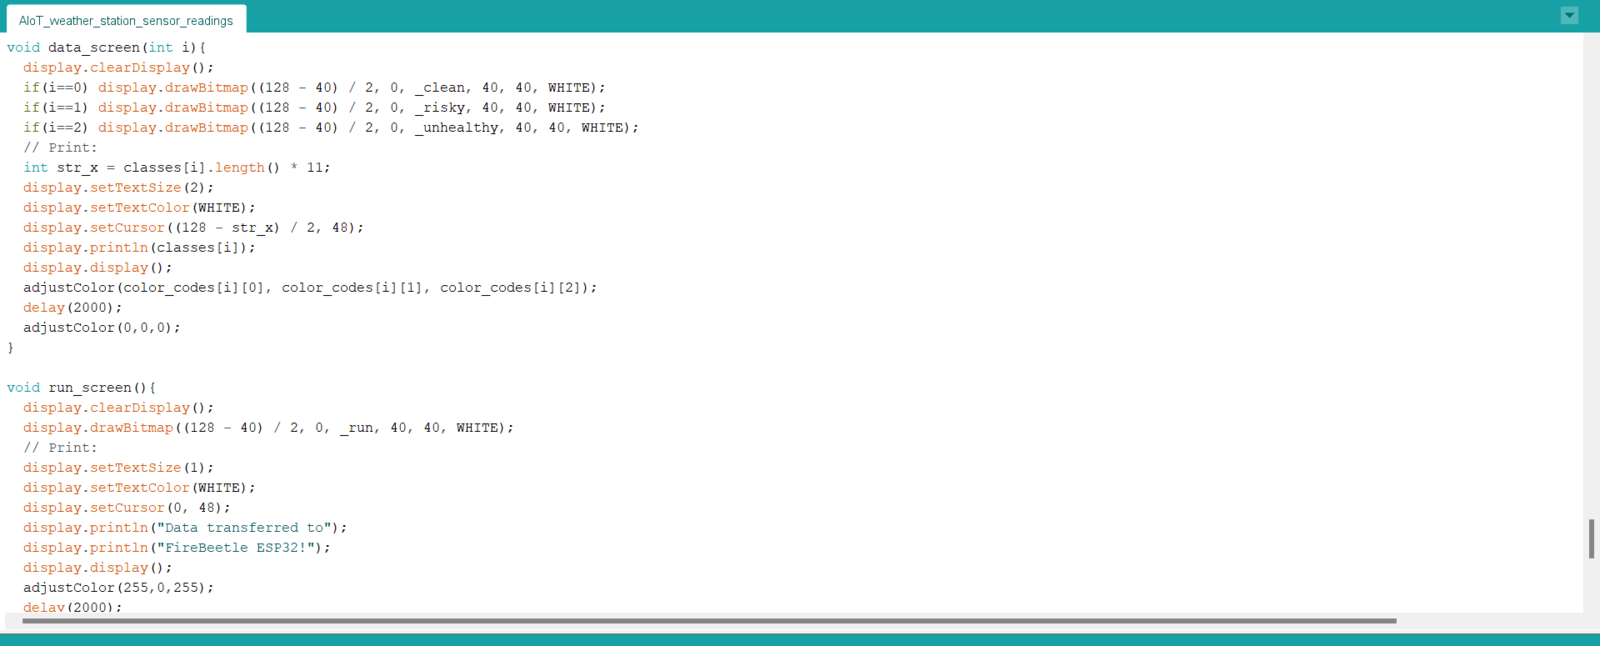 ## Step 4.1: Logging the transmitted air quality data in a CSV file on the SD card w/ FireBeetle ESP32
After uploading and running the code for collecting air quality data and transferring the collected data to FireBeetle ESP32 via serial communication:
🎈⚠️📲 If the electrochemical gas sensors work accurately, the air station turns the RGB LED to blue and waits until the electrochemical gas sensors heat (warm-up) for 3 minutes.
## Step 4.1: Logging the transmitted air quality data in a CSV file on the SD card w/ FireBeetle ESP32
After uploading and running the code for collecting air quality data and transferring the collected data to FireBeetle ESP32 via serial communication:
🎈⚠️📲 If the electrochemical gas sensors work accurately, the air station turns the RGB LED to blue and waits until the electrochemical gas sensors heat (warm-up) for 3 minutes.
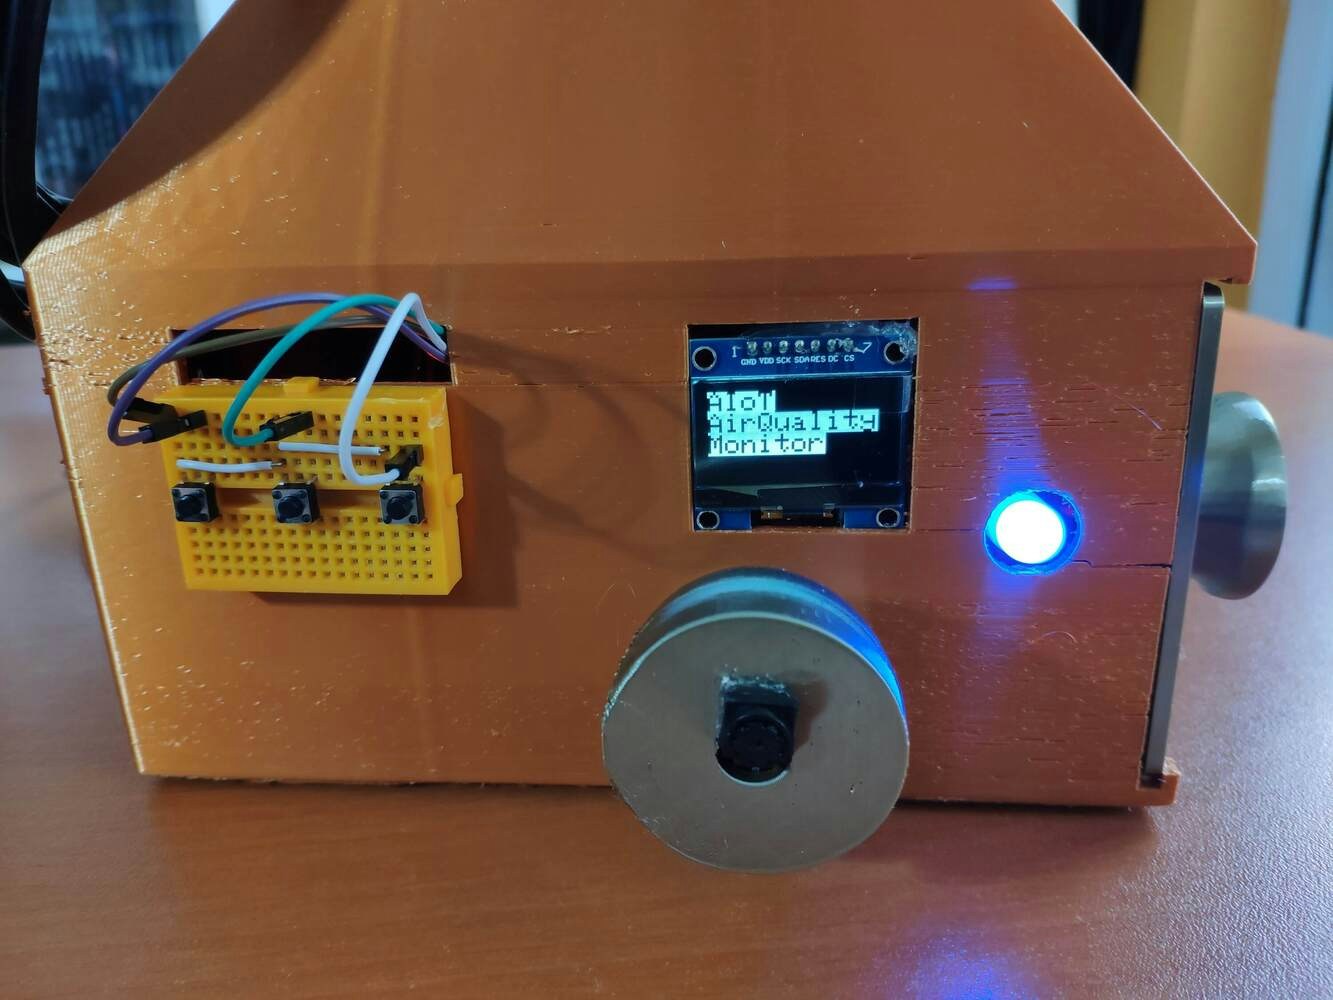 🎈⚠️📲 The air station generates a data record from the recently collected air quality data and shows the collected data parameters on the SH1106 OLED screen to inform the user.
* Nitrogen dioxide concentration (PPM)
* Ozone concentration (PPB)
* Temperature (°C)
* Humidity (%)
* Wind speed
🎈⚠️📲 If the control button (A) is pressed, Arduino Mega adds *Clean* as the selected air pollution level to the recently generated data record, transfers the modified data record to FireBeetle ESP32 via serial communication, and turns the RGB LED to green.
🎈⚠️📲 Then, it shows the unique monochrome icon of the selected air pollution level (class) on the SH1106 OLED screen.
🎈⚠️📲 If the control button (B) is pressed, Arduino Mega adds *Risky* as the selected air pollution level to the recently generated data record, transfers the modified data record to FireBeetle ESP32 via serial communication, and turns the RGB LED to yellow.
🎈⚠️📲 Then, it shows the unique monochrome icon of the selected air pollution level (class) on the SH1106 OLED screen.
🎈⚠️📲 If the control button (C) is pressed, Arduino Mega adds *Unhealthy* as the selected air pollution level to the recently generated data record, transfers the modified data record to FireBeetle ESP32 via serial communication, and turns the RGB LED to red.
🎈⚠️📲 Then, it shows the unique monochrome icon of the selected air pollution level (class) on the SH1106 OLED screen.
🎈⚠️📲 When FireBeetle ESP32 receives a data record, it creates a new CSV file under the *samples* folder on the SD card and combines the given air pollution level and the sample number as the file name. Then, FireBeetle ESP32 appends the received air quality data items with the given header to the created CSV file.
🎈⚠️📲 Also, FireBeetle ESP32 increments the sample number of the received air pollution level (class) by 1 to generate unique CSV files (samples).
You can get more detailed information on creating separate CSV files as samples in Step 6.
🎈⚠️📲 Every minute, Arduino Mega transmits the recently collected air quality data parameters to FireBeetle ESP32 via serial communication in order to obtain accurate prediction results after running an inference with the neural network model.
You can get more detailed information on running an inference with the neural network model in Step 7.
🎈⚠️📲 If Arduino Mega throws an error while operating, the air station shows the error message on the SH1106 OLED screen and prints the error details on the serial monitor.
🎈⚠️📲 The air station generates a data record from the recently collected air quality data and shows the collected data parameters on the SH1106 OLED screen to inform the user.
* Nitrogen dioxide concentration (PPM)
* Ozone concentration (PPB)
* Temperature (°C)
* Humidity (%)
* Wind speed
🎈⚠️📲 If the control button (A) is pressed, Arduino Mega adds *Clean* as the selected air pollution level to the recently generated data record, transfers the modified data record to FireBeetle ESP32 via serial communication, and turns the RGB LED to green.
🎈⚠️📲 Then, it shows the unique monochrome icon of the selected air pollution level (class) on the SH1106 OLED screen.
🎈⚠️📲 If the control button (B) is pressed, Arduino Mega adds *Risky* as the selected air pollution level to the recently generated data record, transfers the modified data record to FireBeetle ESP32 via serial communication, and turns the RGB LED to yellow.
🎈⚠️📲 Then, it shows the unique monochrome icon of the selected air pollution level (class) on the SH1106 OLED screen.
🎈⚠️📲 If the control button (C) is pressed, Arduino Mega adds *Unhealthy* as the selected air pollution level to the recently generated data record, transfers the modified data record to FireBeetle ESP32 via serial communication, and turns the RGB LED to red.
🎈⚠️📲 Then, it shows the unique monochrome icon of the selected air pollution level (class) on the SH1106 OLED screen.
🎈⚠️📲 When FireBeetle ESP32 receives a data record, it creates a new CSV file under the *samples* folder on the SD card and combines the given air pollution level and the sample number as the file name. Then, FireBeetle ESP32 appends the received air quality data items with the given header to the created CSV file.
🎈⚠️📲 Also, FireBeetle ESP32 increments the sample number of the received air pollution level (class) by 1 to generate unique CSV files (samples).
You can get more detailed information on creating separate CSV files as samples in Step 6.
🎈⚠️📲 Every minute, Arduino Mega transmits the recently collected air quality data parameters to FireBeetle ESP32 via serial communication in order to obtain accurate prediction results after running an inference with the neural network model.
You can get more detailed information on running an inference with the neural network model in Step 7.
🎈⚠️📲 If Arduino Mega throws an error while operating, the air station shows the error message on the SH1106 OLED screen and prints the error details on the serial monitor.
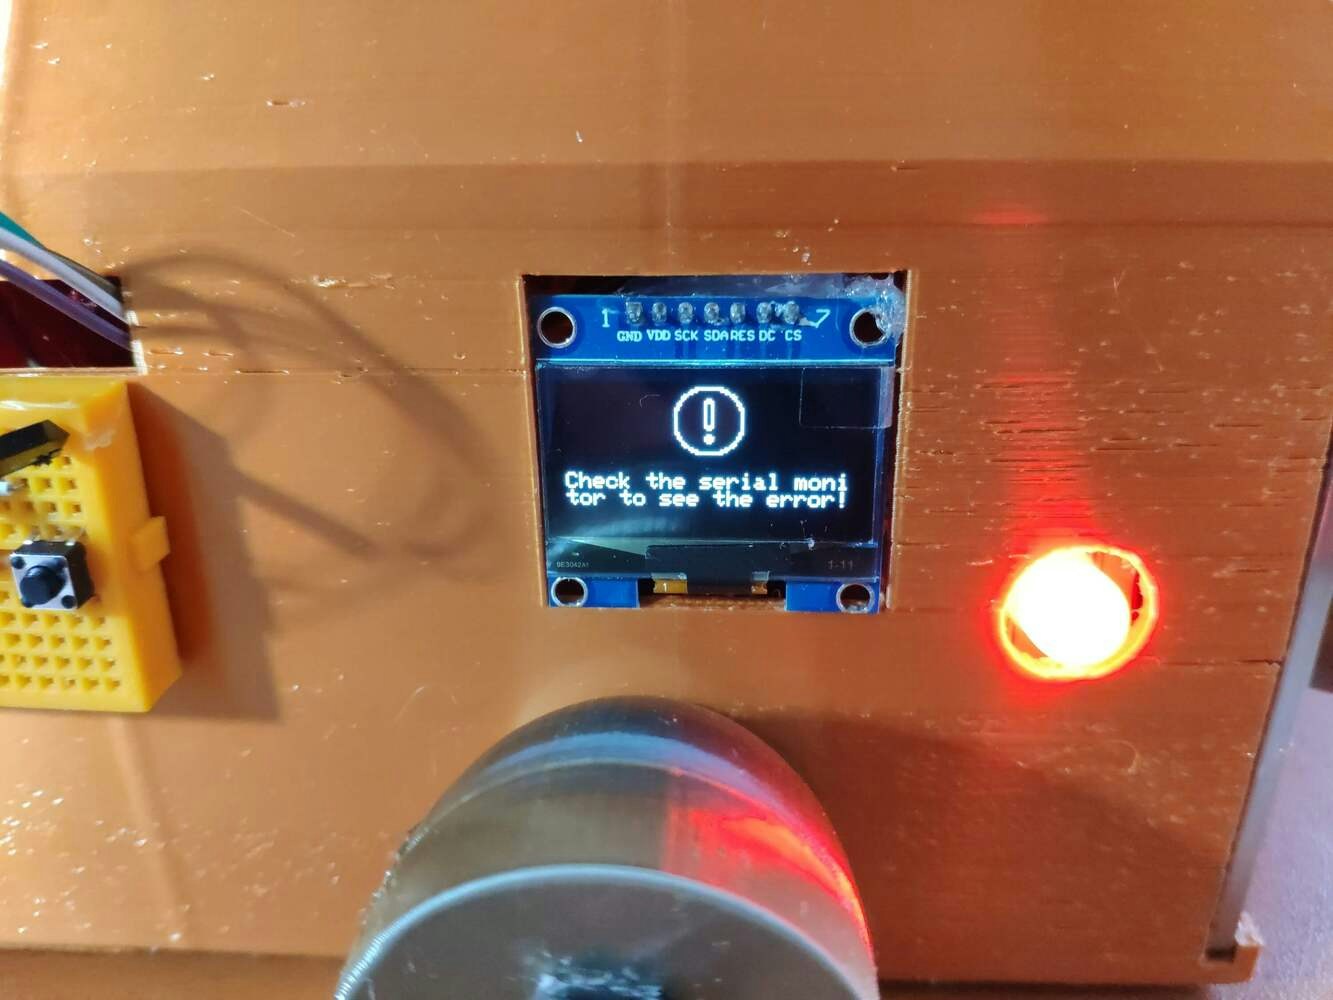
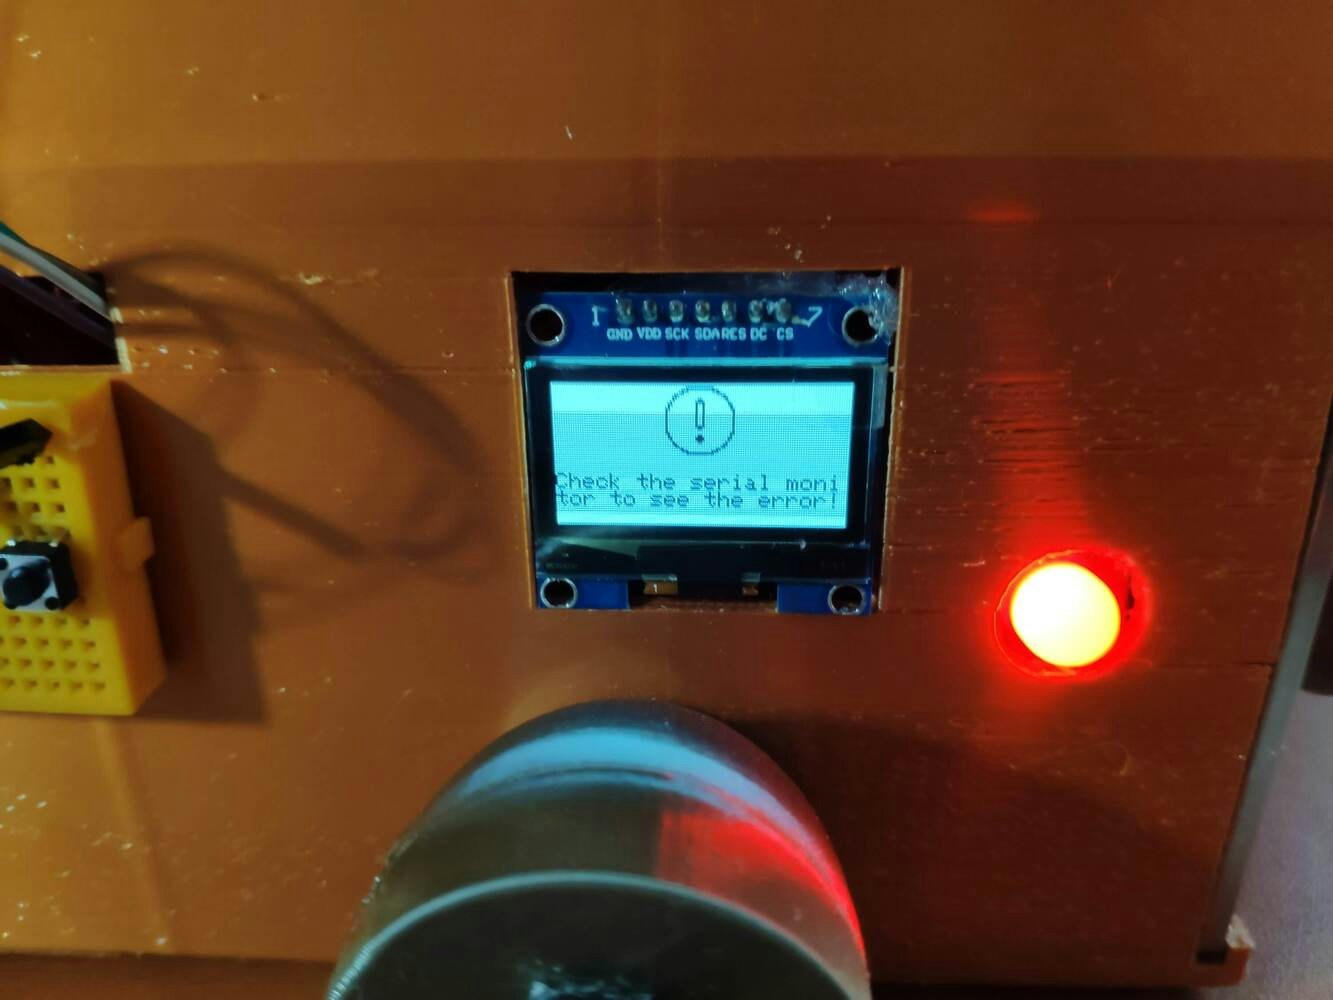
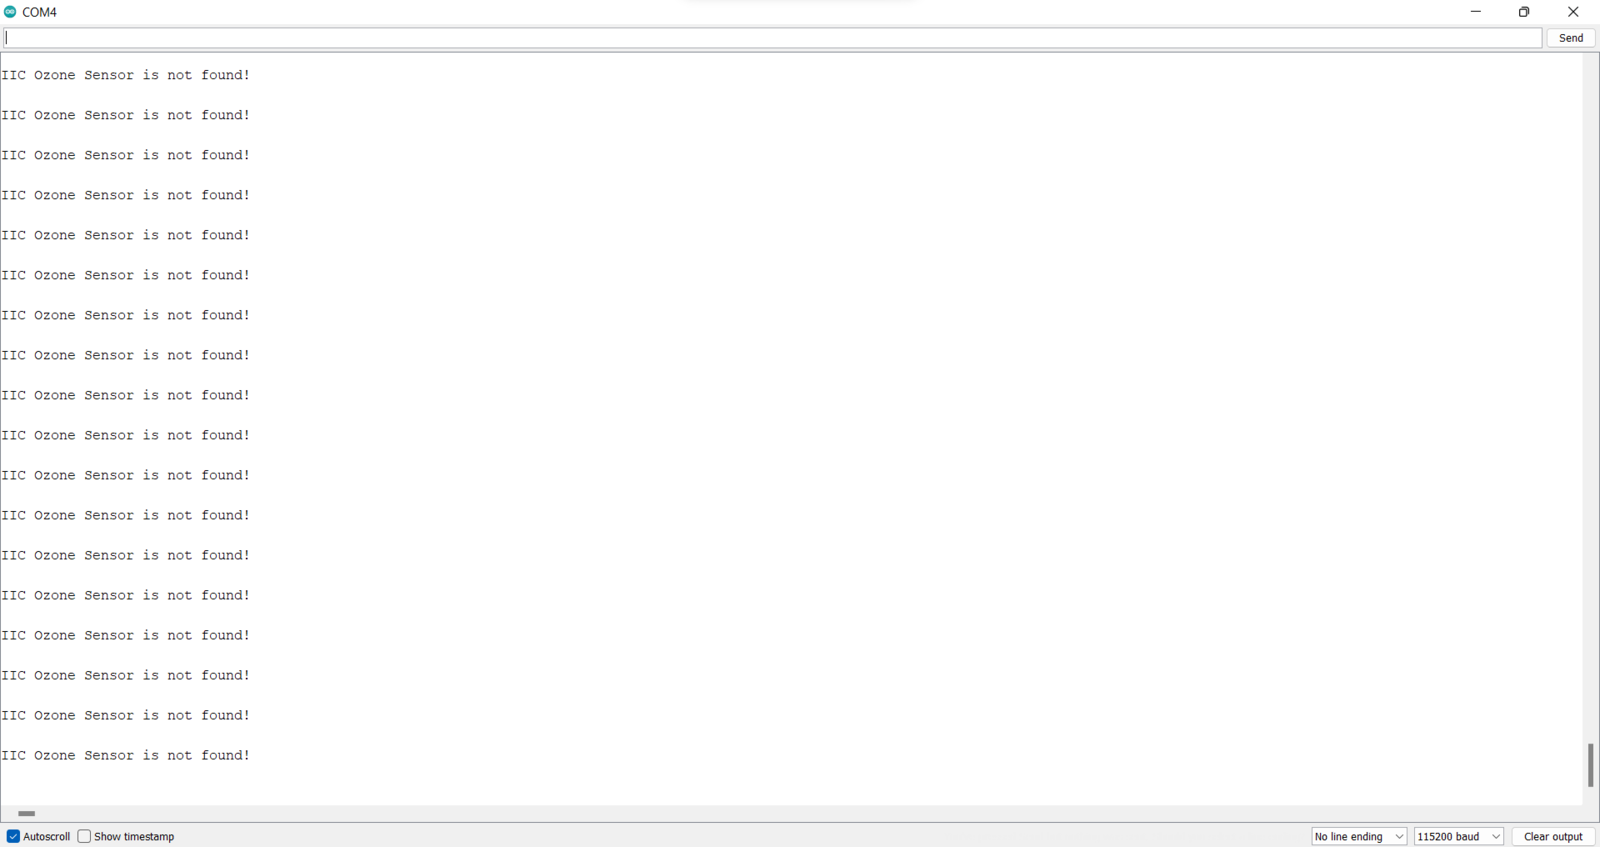 🎈⚠️📲 Also, the air station prints notifications and sensor measurements on the serial monitor for debugging.
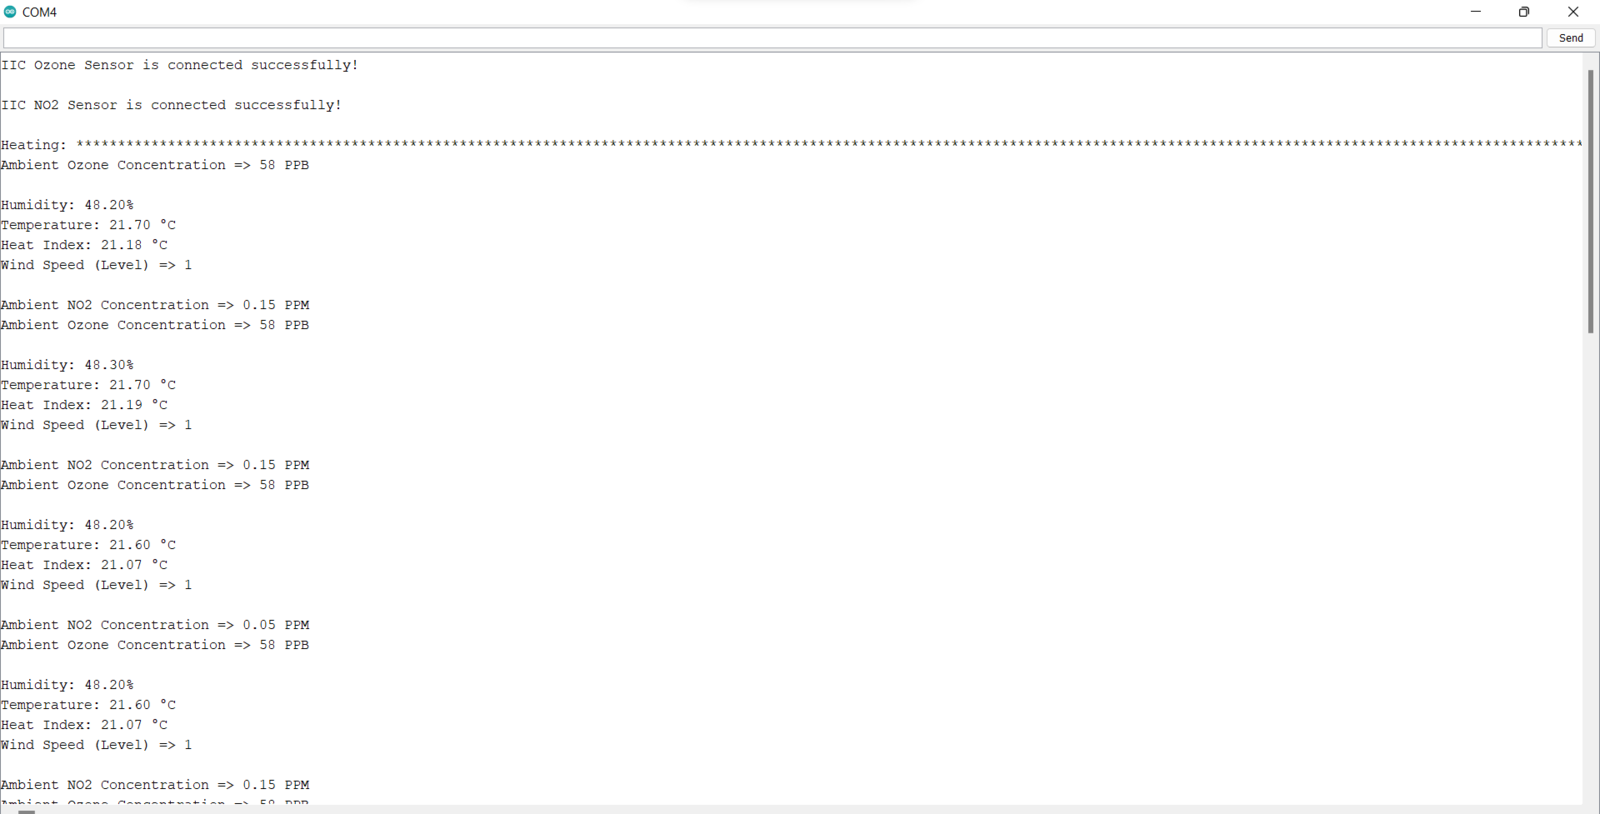 After collecting air quality data for nearly 2 months and creating separate CSV files for each data record on the SD card, I elicited my data set with eminent validity and veracity.
You can get more detailed information regarding assigning air pollution levels depending on the Air Quality Index (AQI) estimations provided by IQAir in Step 5.
## Step 5: Building a neural network model with Edge Impulse
In this project, I needed to utilize accurate air pollution levels for each data record composed of the air quality data I collected. Therefore, I needed to obtain local Air Quality Index (AQI) estimations for my region. Since [IQAir](https://www.iqair.com/) calculates the Air Quality Index (AQI) estimations based on satellite PM2.5 data for locations lacking ground-based air monitoring stations and provides hourly AQI estimations with air quality levels by location, I decided to employ IQAir to obtain local AQI estimations.
Before collecting and storing the air quality data, I checked IQAir for the AQI estimation of my region. Then, I derived an air pollution class (level) from the AQI estimation provided by IQAir in order to assign a label empirically to my samples (data records).
* Clean
* Risky
* Unhealthy
After collecting air quality data for nearly 2 months and creating separate CSV files for each data record on the SD card, I elicited my data set with eminent validity and veracity.
You can get more detailed information regarding assigning air pollution levels depending on the Air Quality Index (AQI) estimations provided by IQAir in Step 5.
## Step 5: Building a neural network model with Edge Impulse
In this project, I needed to utilize accurate air pollution levels for each data record composed of the air quality data I collected. Therefore, I needed to obtain local Air Quality Index (AQI) estimations for my region. Since [IQAir](https://www.iqair.com/) calculates the Air Quality Index (AQI) estimations based on satellite PM2.5 data for locations lacking ground-based air monitoring stations and provides hourly AQI estimations with air quality levels by location, I decided to employ IQAir to obtain local AQI estimations.
Before collecting and storing the air quality data, I checked IQAir for the AQI estimation of my region. Then, I derived an air pollution class (level) from the AQI estimation provided by IQAir in order to assign a label empirically to my samples (data records).
* Clean
* Risky
* Unhealthy
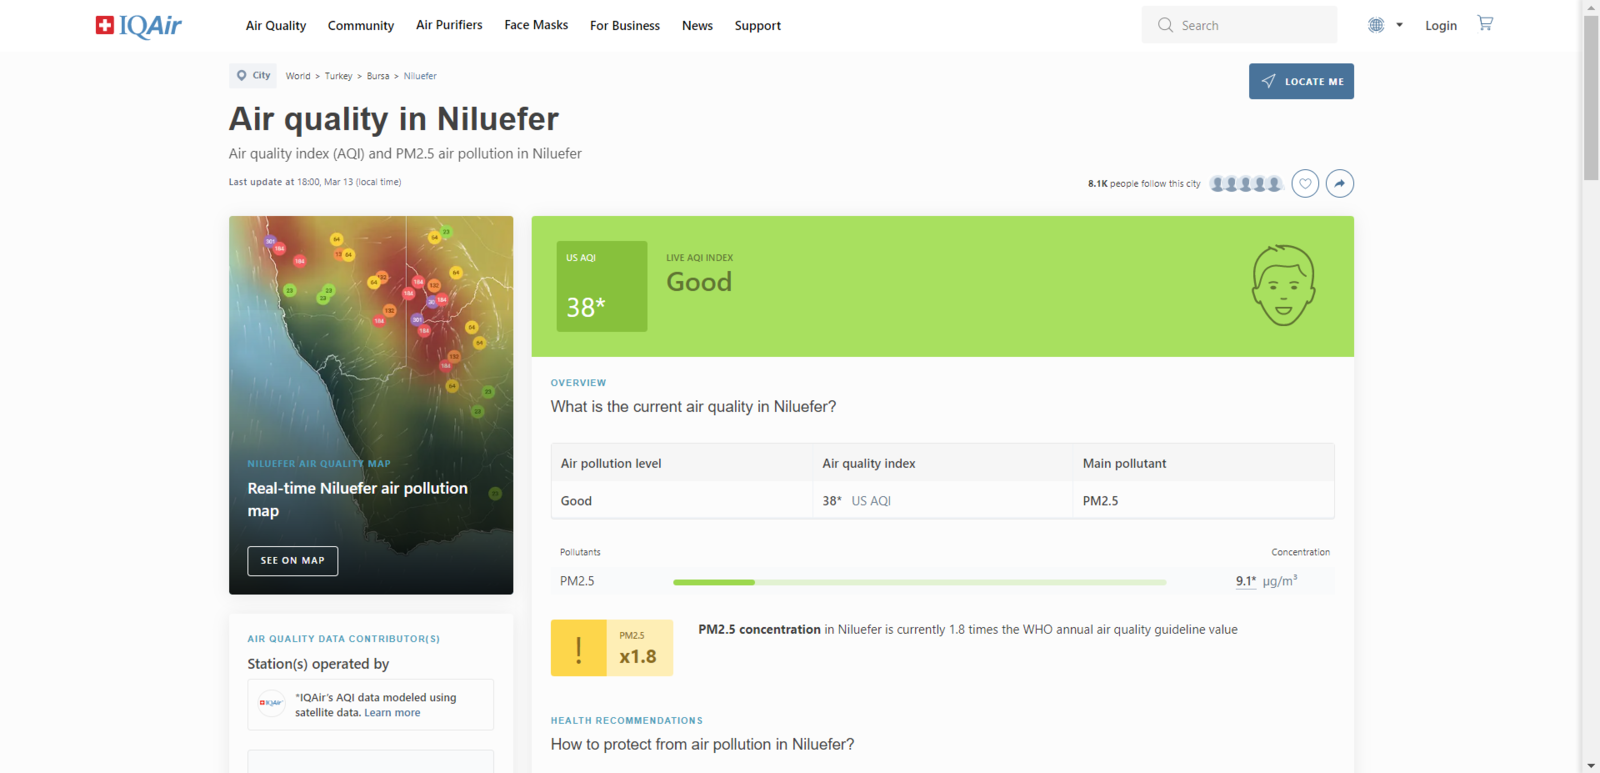
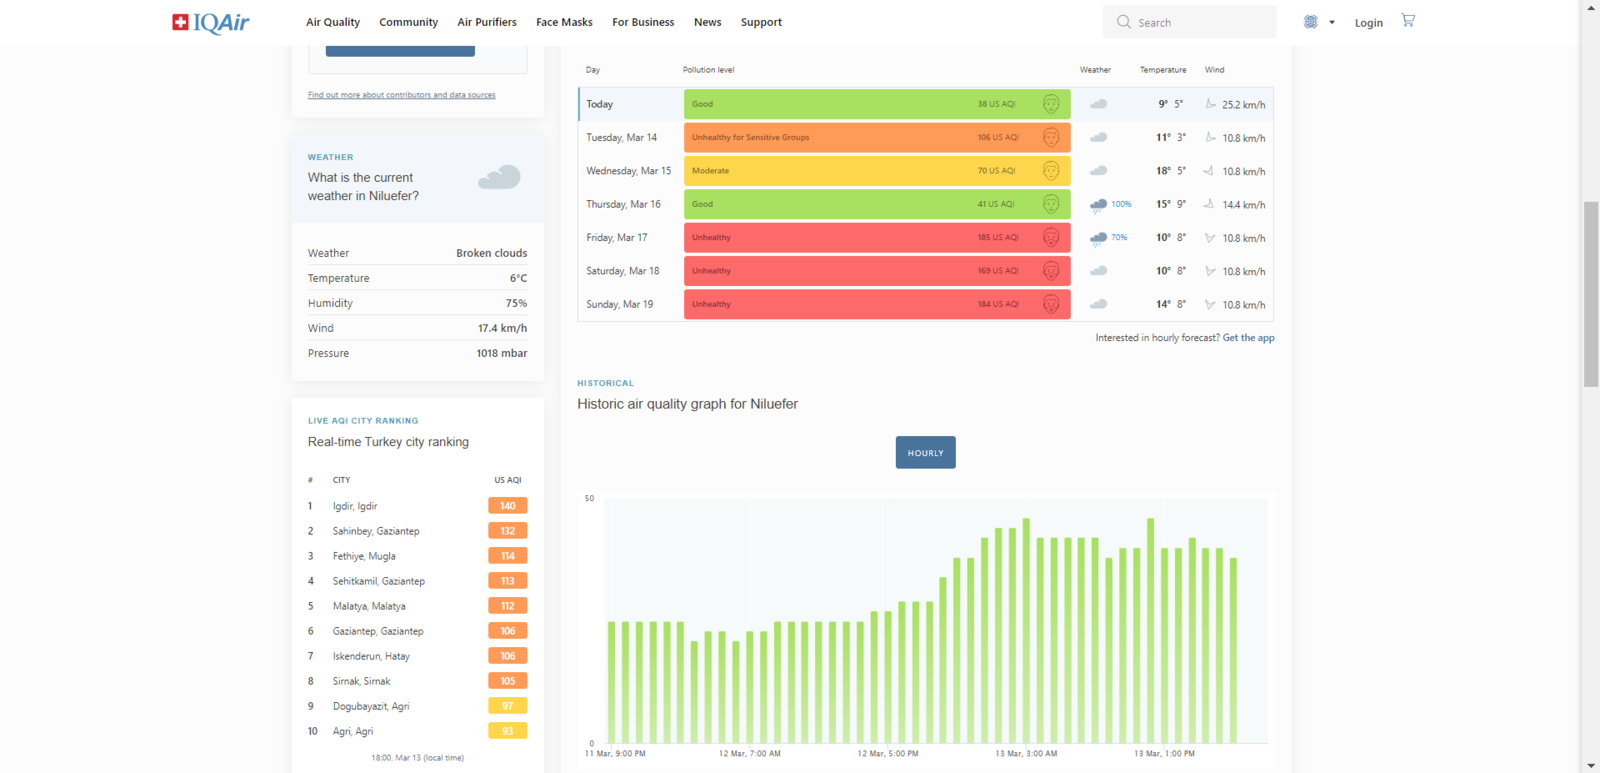 When I completed logging the collected data and assigning labels, I started to work on my artificial neural network model (ANN) to detect ambient air pollution levels so as to inform people with prescient warnings before air pollutants engender harmful effects on the respiratory system.
Since Edge Impulse supports almost every microcontroller and development board due to its model deployment options, I decided to utilize Edge Impulse to build my artificial neural network model. Also, Edge Impulse makes scaling embedded ML applications easier and faster for edge devices such as FireBeetle ESP32.
As of now, Edge Impulse supports CSV files to upload samples in different data structures thanks to its *CSV Wizard*. So, Edge Impulse lets the user upload all data records in a single file even if the data type is not time series. But, I usually needed to follow the steps below to format my data set saved in a single CSV file so as to train my model accurately:
* Data Scaling (Normalizing)
* Data Preprocessing
However, as explained in the previous steps, I employed FireBeetle ESP32 to save each data record to a separate CSV file on the SD card to create appropriately formatted samples (CSV files) for Edge Impulse. Therefore, I did not need to preprocess my data set before uploading samples.
Plausibly, Edge Impulse allows building predictive models optimized in size and accuracy automatically and deploying the trained model as an Arduino library. Therefore, after collecting my samples, I was able to build an accurate neural network model to predict air pollution levels and run it on FireBeetle ESP32 effortlessly.
You can inspect [my neural network model on Edge Impulse](https://studio.edgeimpulse.com/public/192207/latest) as a public project.
## Step 5.1: Preprocessing and scaling the data set to create formatted samples for Edge Impulse
As long as the CSV file includes a header defining data fields, Edge Impulse can distinguish data records as individual samples in different data structures thanks to its *CSV Wizard* while adding existing data to an Edge Impulse project. Therefore, there is no need for preprocessing single CSV file data sets even if the data type is not time series.
Since Edge Impulse can infer the uploaded sample's label from its file name, I employed FireBeetle ESP32 to create a new CSV file for each data record and name the generated files by combining the given air pollution level and the sample number incremented by 1 for each class (label) automatically.
* Clean.training.sample\_1.csv
* Clean.training.sample\_2.csv
* Risky.training.sample\_1.csv
* Risky.training.sample\_2.csv
* Unhealthy.training.sample\_1.csv
* Unhealthy.training.sample\_2.csv
After collecting air quality data and generating separate CSV files for nearly 2 months, I obtained my appropriately formatted samples on the SD card.
When I completed logging the collected data and assigning labels, I started to work on my artificial neural network model (ANN) to detect ambient air pollution levels so as to inform people with prescient warnings before air pollutants engender harmful effects on the respiratory system.
Since Edge Impulse supports almost every microcontroller and development board due to its model deployment options, I decided to utilize Edge Impulse to build my artificial neural network model. Also, Edge Impulse makes scaling embedded ML applications easier and faster for edge devices such as FireBeetle ESP32.
As of now, Edge Impulse supports CSV files to upload samples in different data structures thanks to its *CSV Wizard*. So, Edge Impulse lets the user upload all data records in a single file even if the data type is not time series. But, I usually needed to follow the steps below to format my data set saved in a single CSV file so as to train my model accurately:
* Data Scaling (Normalizing)
* Data Preprocessing
However, as explained in the previous steps, I employed FireBeetle ESP32 to save each data record to a separate CSV file on the SD card to create appropriately formatted samples (CSV files) for Edge Impulse. Therefore, I did not need to preprocess my data set before uploading samples.
Plausibly, Edge Impulse allows building predictive models optimized in size and accuracy automatically and deploying the trained model as an Arduino library. Therefore, after collecting my samples, I was able to build an accurate neural network model to predict air pollution levels and run it on FireBeetle ESP32 effortlessly.
You can inspect [my neural network model on Edge Impulse](https://studio.edgeimpulse.com/public/192207/latest) as a public project.
## Step 5.1: Preprocessing and scaling the data set to create formatted samples for Edge Impulse
As long as the CSV file includes a header defining data fields, Edge Impulse can distinguish data records as individual samples in different data structures thanks to its *CSV Wizard* while adding existing data to an Edge Impulse project. Therefore, there is no need for preprocessing single CSV file data sets even if the data type is not time series.
Since Edge Impulse can infer the uploaded sample's label from its file name, I employed FireBeetle ESP32 to create a new CSV file for each data record and name the generated files by combining the given air pollution level and the sample number incremented by 1 for each class (label) automatically.
* Clean.training.sample\_1.csv
* Clean.training.sample\_2.csv
* Risky.training.sample\_1.csv
* Risky.training.sample\_2.csv
* Unhealthy.training.sample\_1.csv
* Unhealthy.training.sample\_2.csv
After collecting air quality data and generating separate CSV files for nearly 2 months, I obtained my appropriately formatted samples on the SD card.
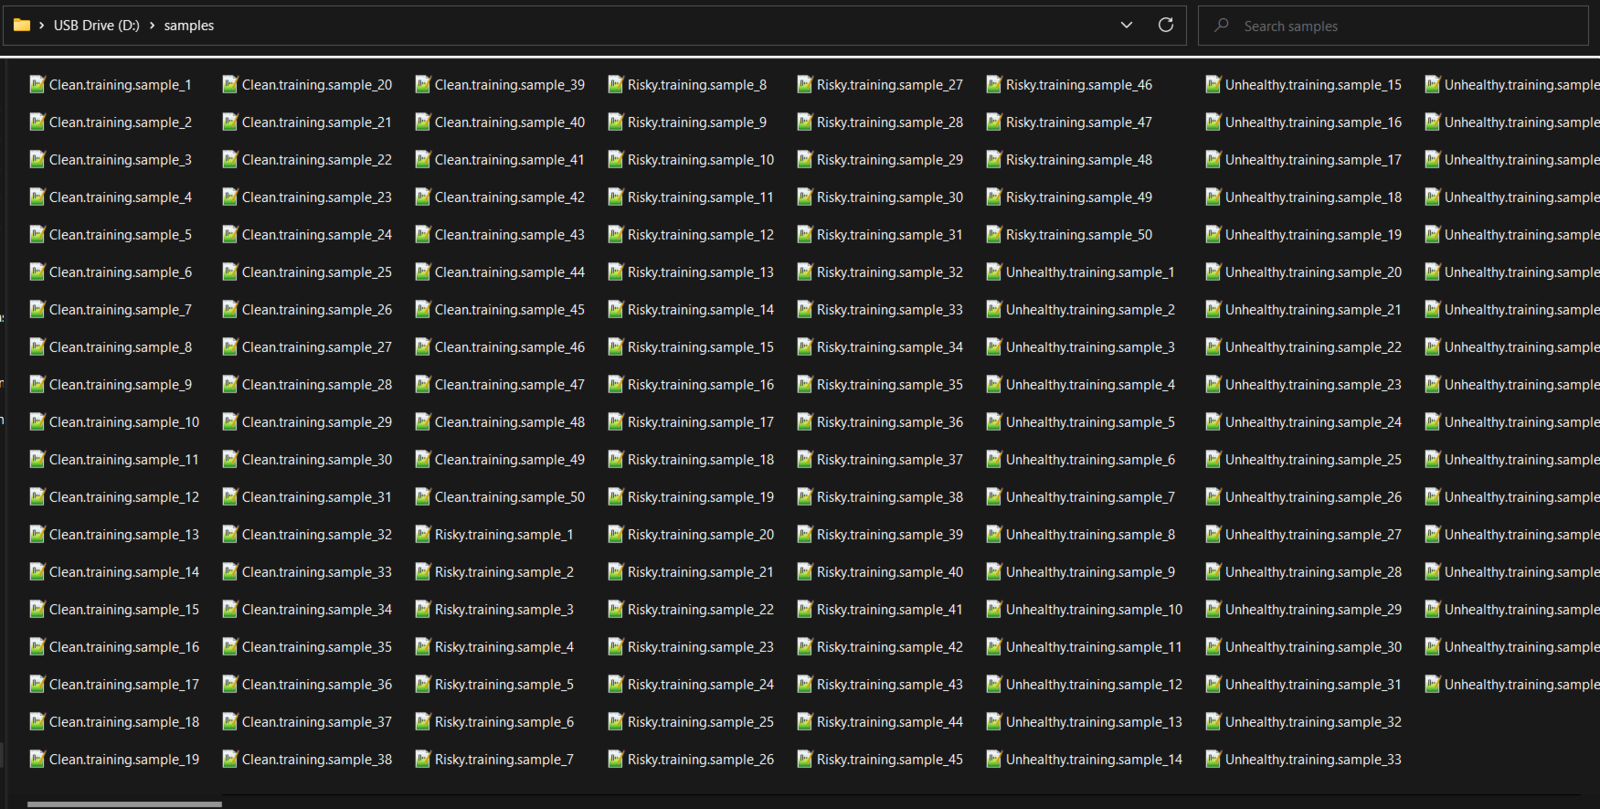 ## Step 5.2: Uploading formatted samples to Edge Impulse
After generating training and testing samples successfully, I uploaded them to my project on Edge Impulse.
:hash: First of all, sign up for [Edge Impulse](https://www.edgeimpulse.com/) and create a new project.
## Step 5.2: Uploading formatted samples to Edge Impulse
After generating training and testing samples successfully, I uploaded them to my project on Edge Impulse.
:hash: First of all, sign up for [Edge Impulse](https://www.edgeimpulse.com/) and create a new project.
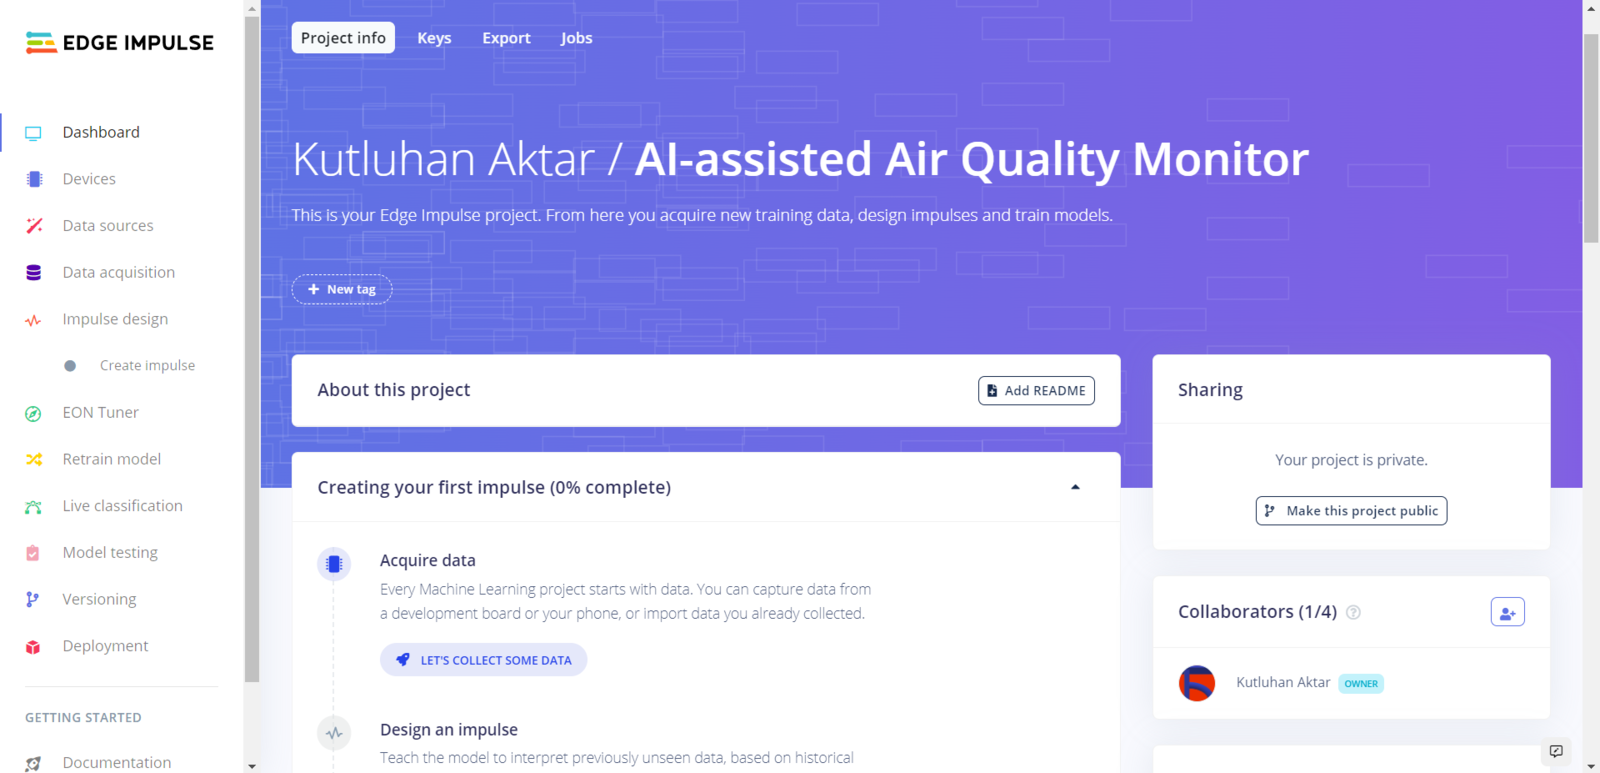 :hash: Navigate to the *Data acquisition* page and click the *Upload existing data* button.
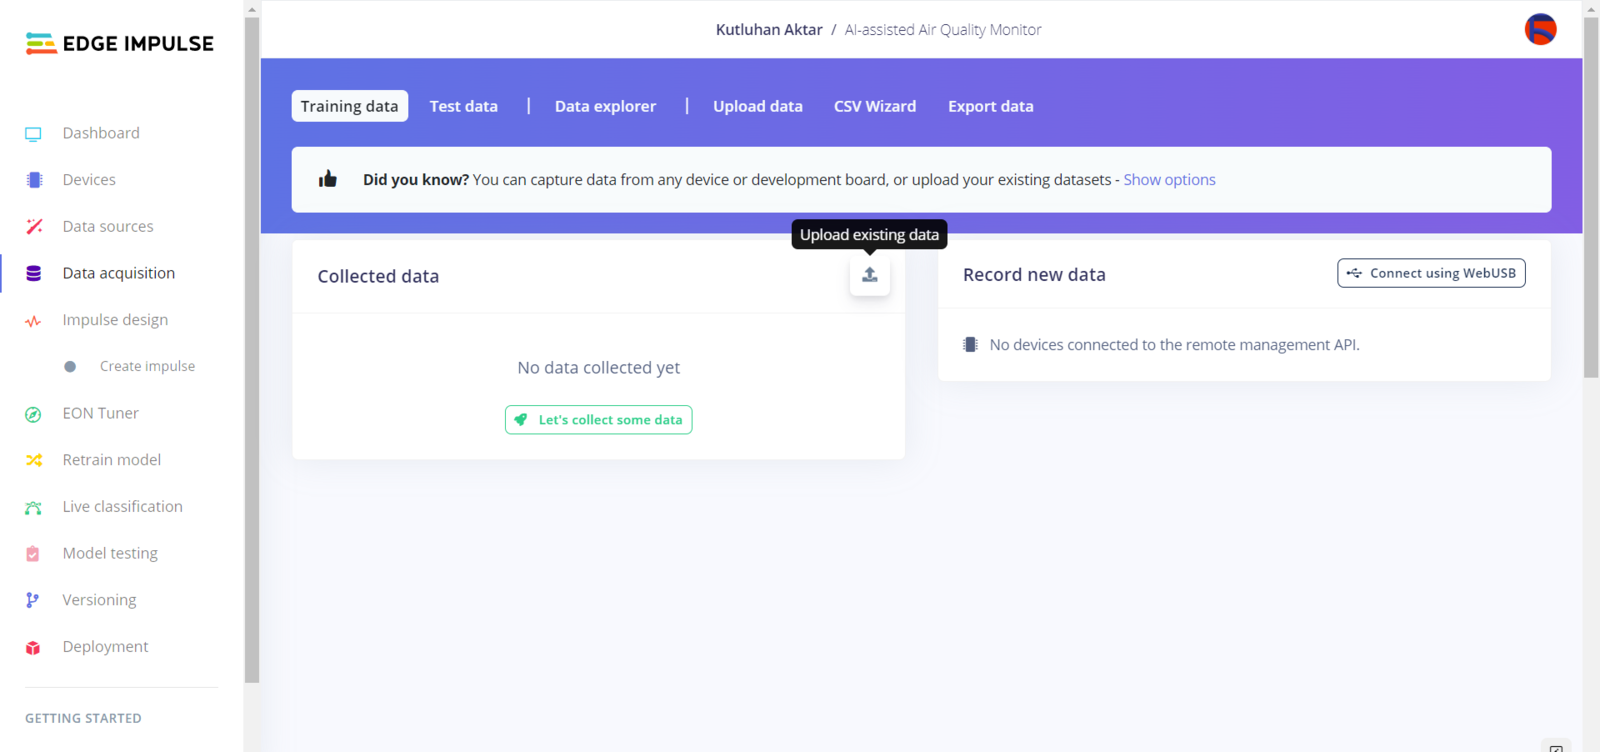
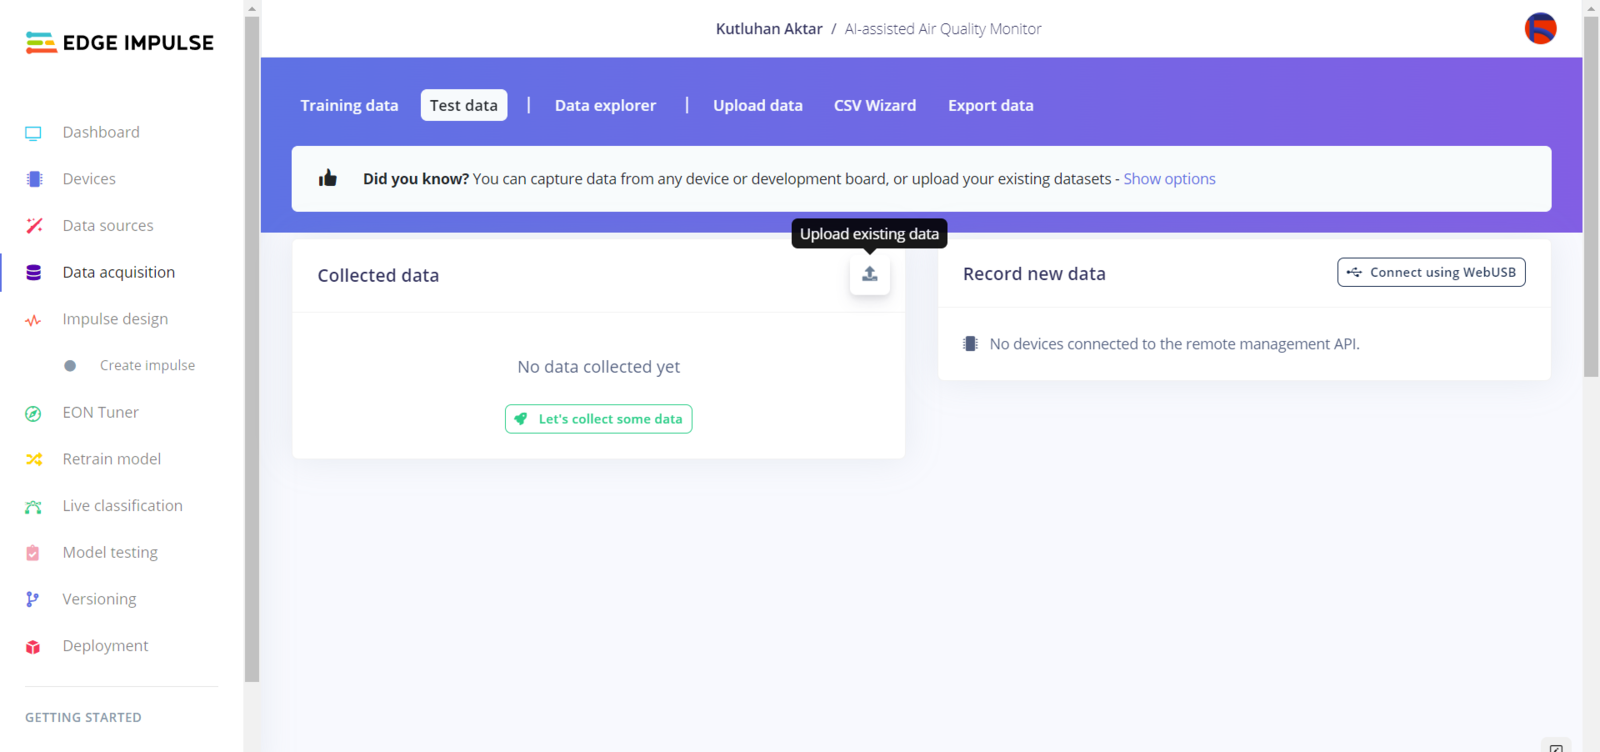 :hash: Before uploading samples, go to the *CSV Wizard* to set the rules to process all uploaded CSV files.
:hash: Upload a CSV file example to check data fields and items.
:hash: Select the data structure (time-series data or not).
:hash: Define a column to obtain labels for each data record if it is a single CSV file data set.
:hash: Then, define the columns containing data items and click the *Finish wizard* button.
:hash: Before uploading samples, go to the *CSV Wizard* to set the rules to process all uploaded CSV files.
:hash: Upload a CSV file example to check data fields and items.
:hash: Select the data structure (time-series data or not).
:hash: Define a column to obtain labels for each data record if it is a single CSV file data set.
:hash: Then, define the columns containing data items and click the *Finish wizard* button.
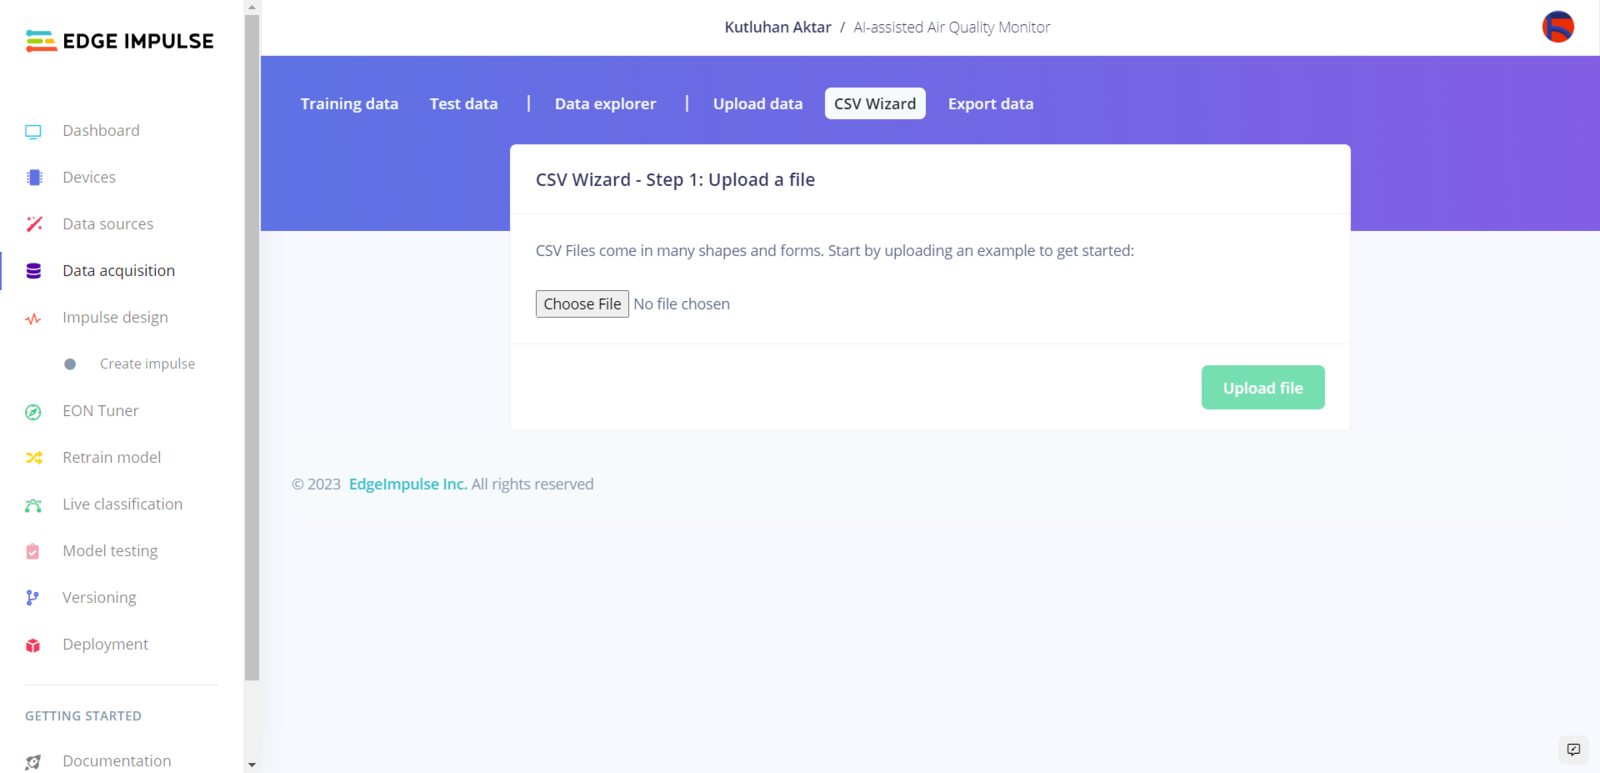
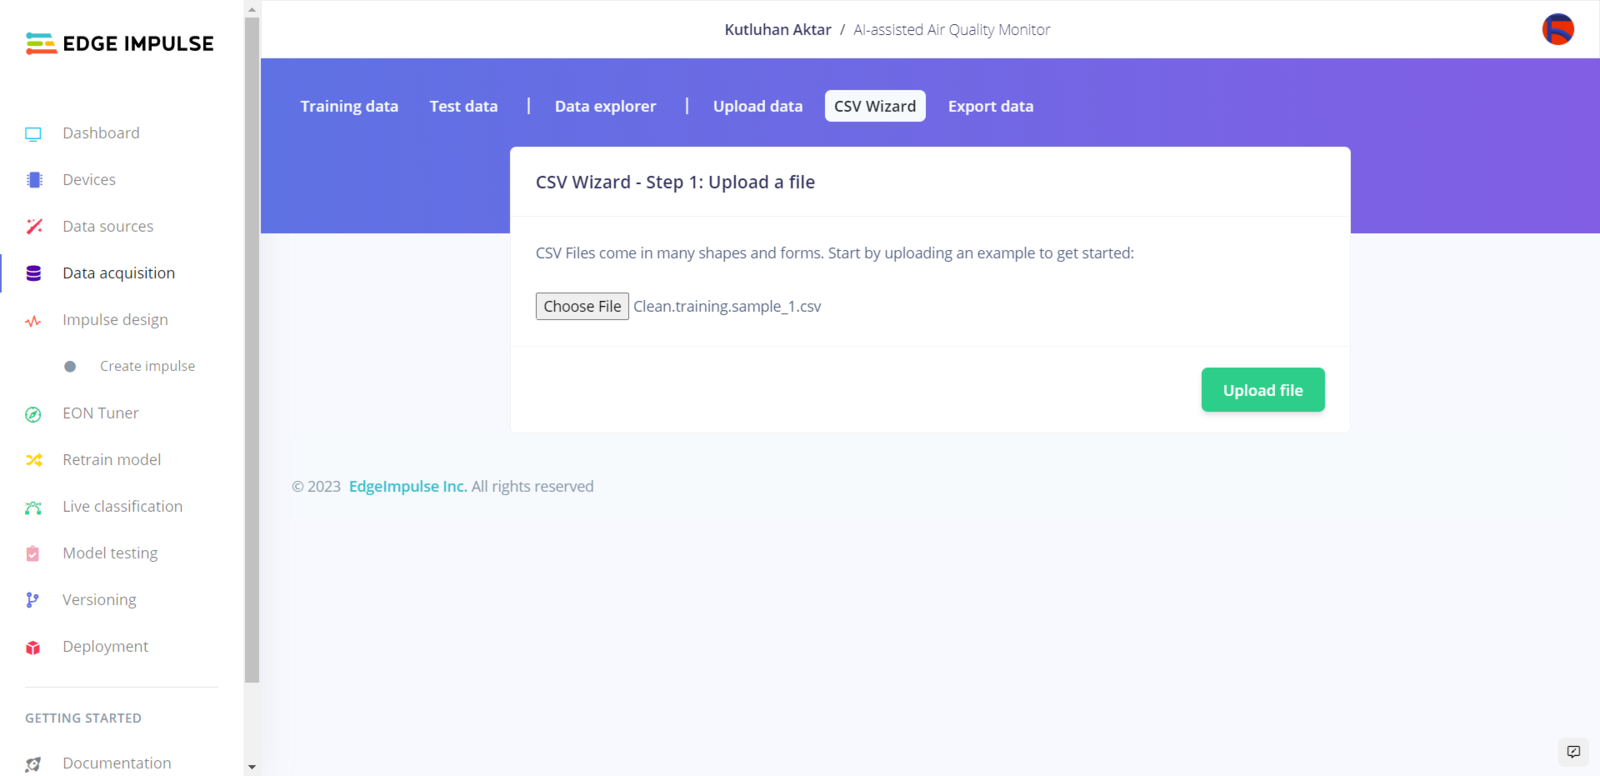
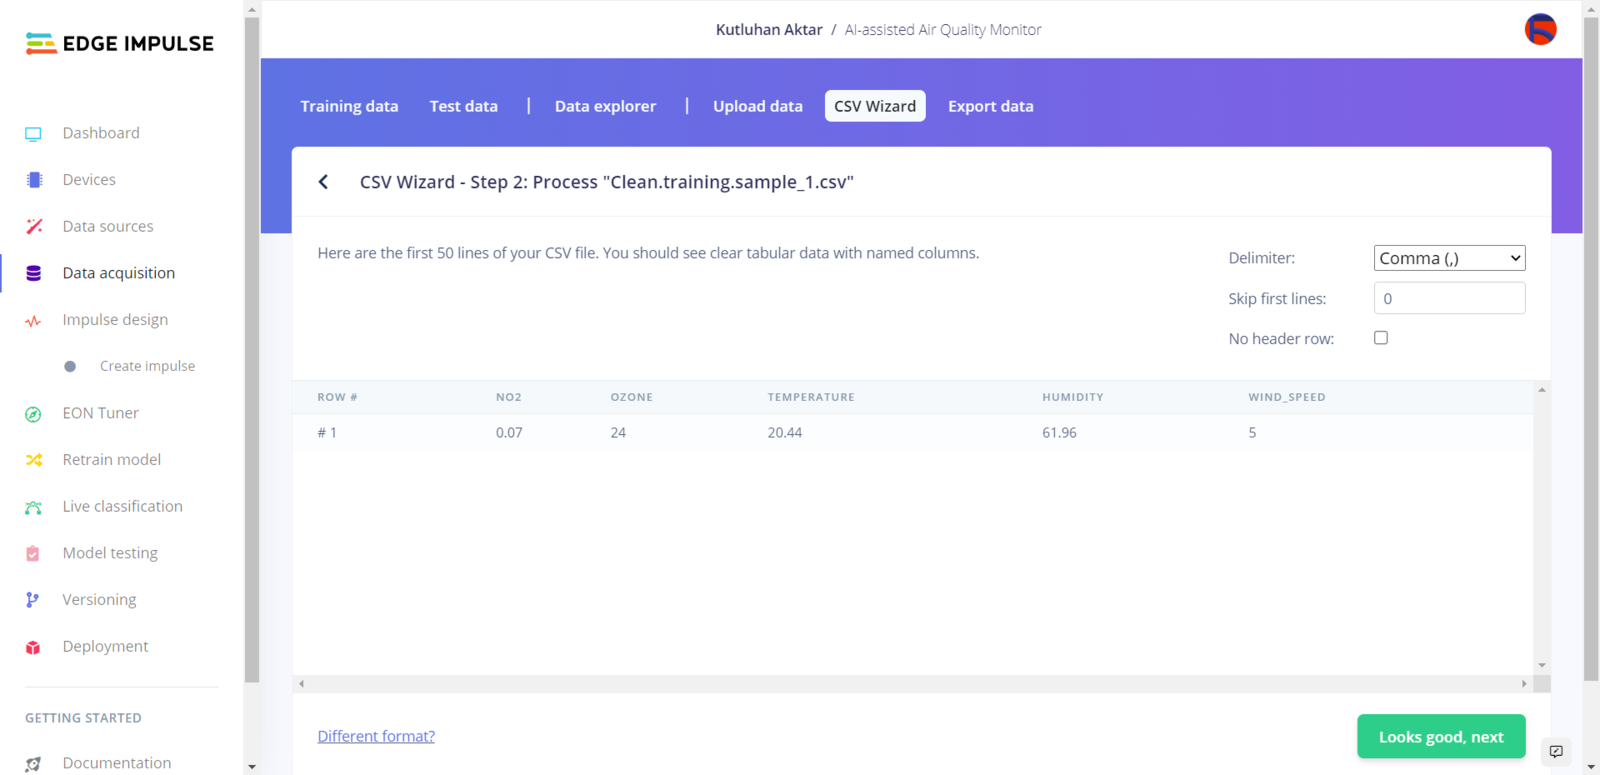
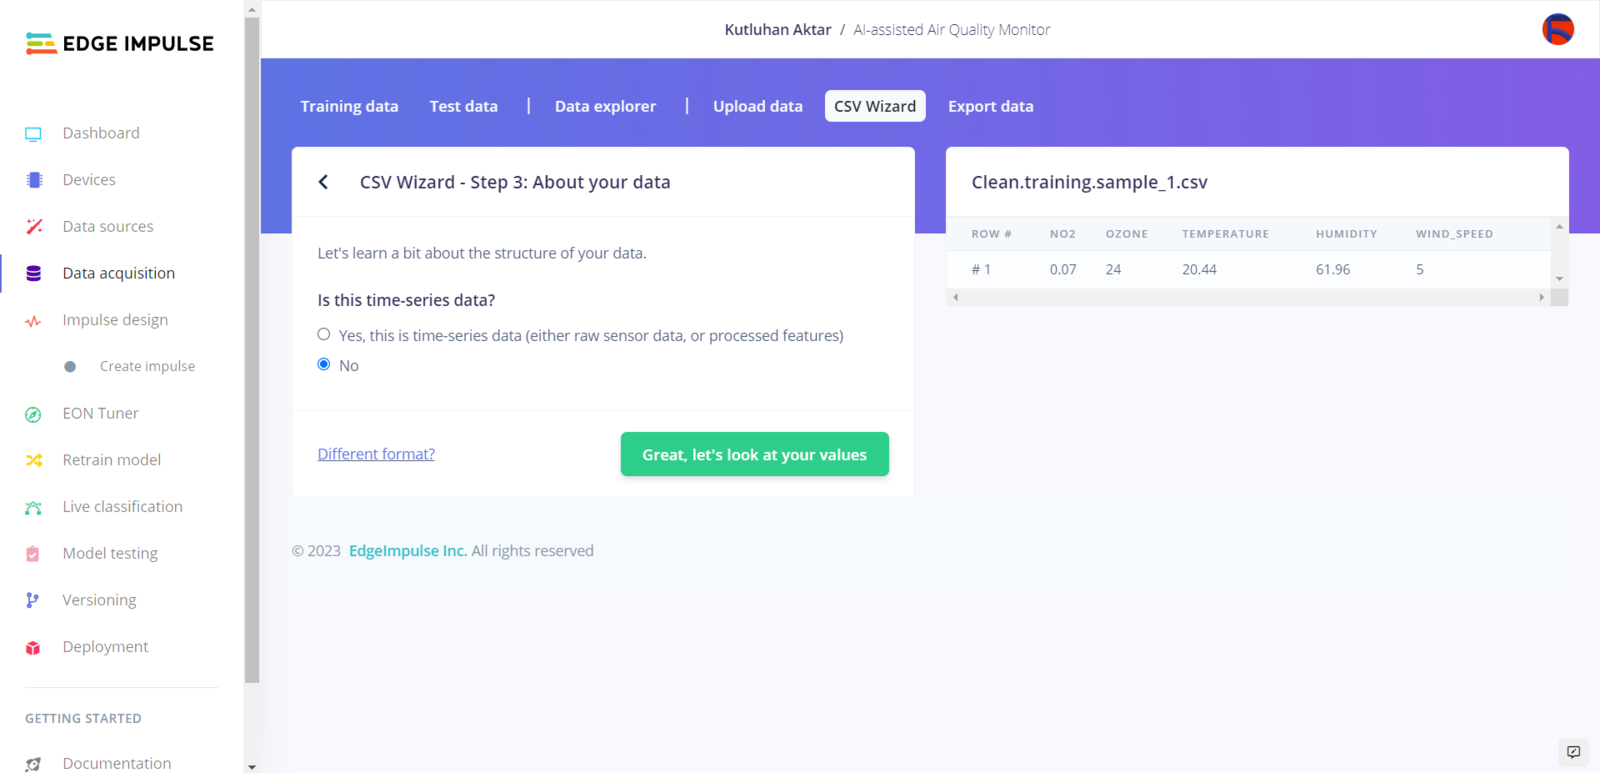
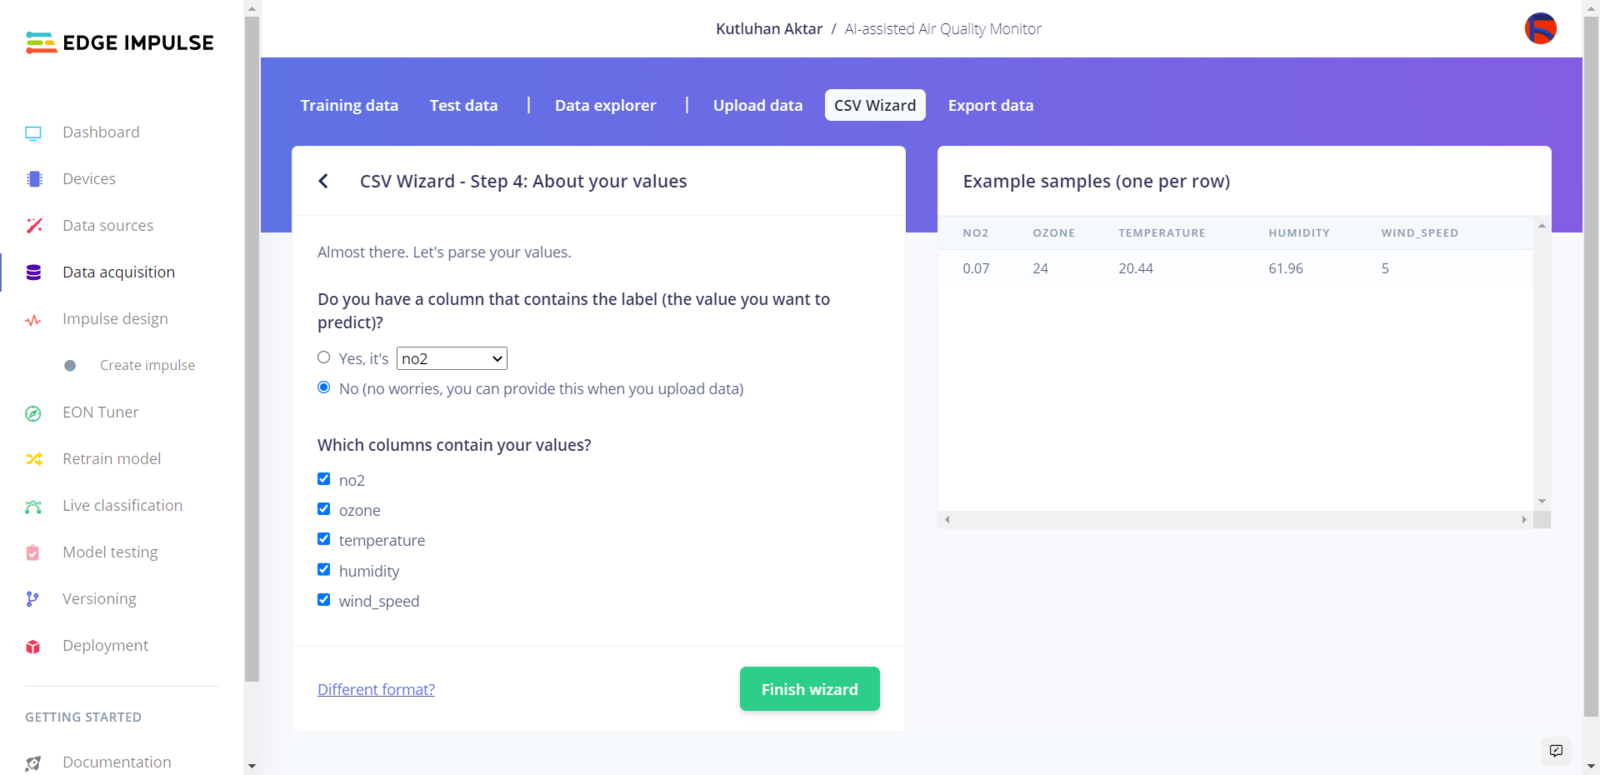
 :hash: After setting the rules, choose the data category (training or testing) and select *Infer from filename* under *Label* to deduce labels from CSV file names automatically.
:hash: Finally, select CSV files and click the *Begin upload* button.
:hash: After setting the rules, choose the data category (training or testing) and select *Infer from filename* under *Label* to deduce labels from CSV file names automatically.
:hash: Finally, select CSV files and click the *Begin upload* button.
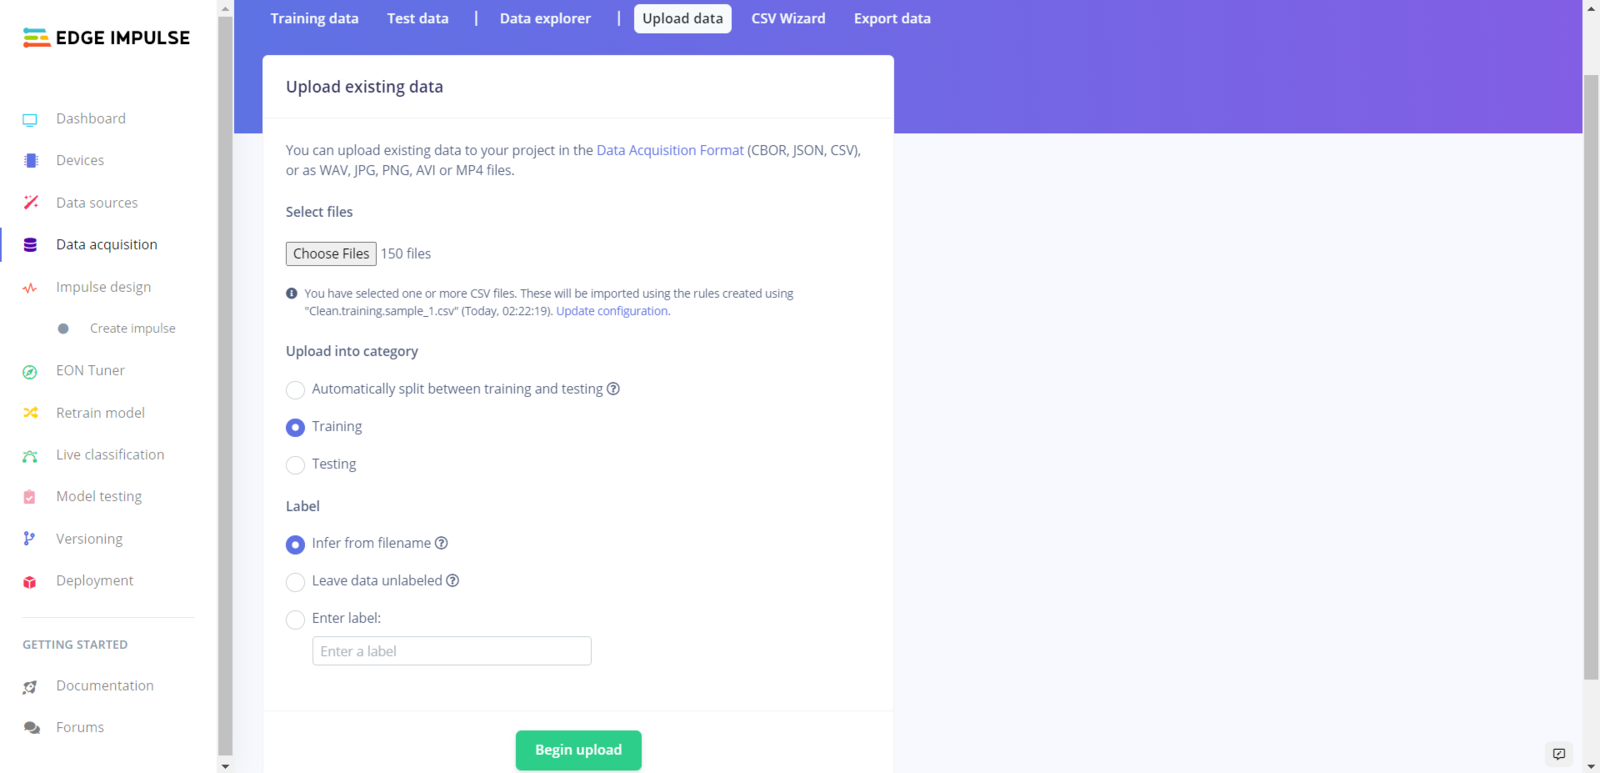
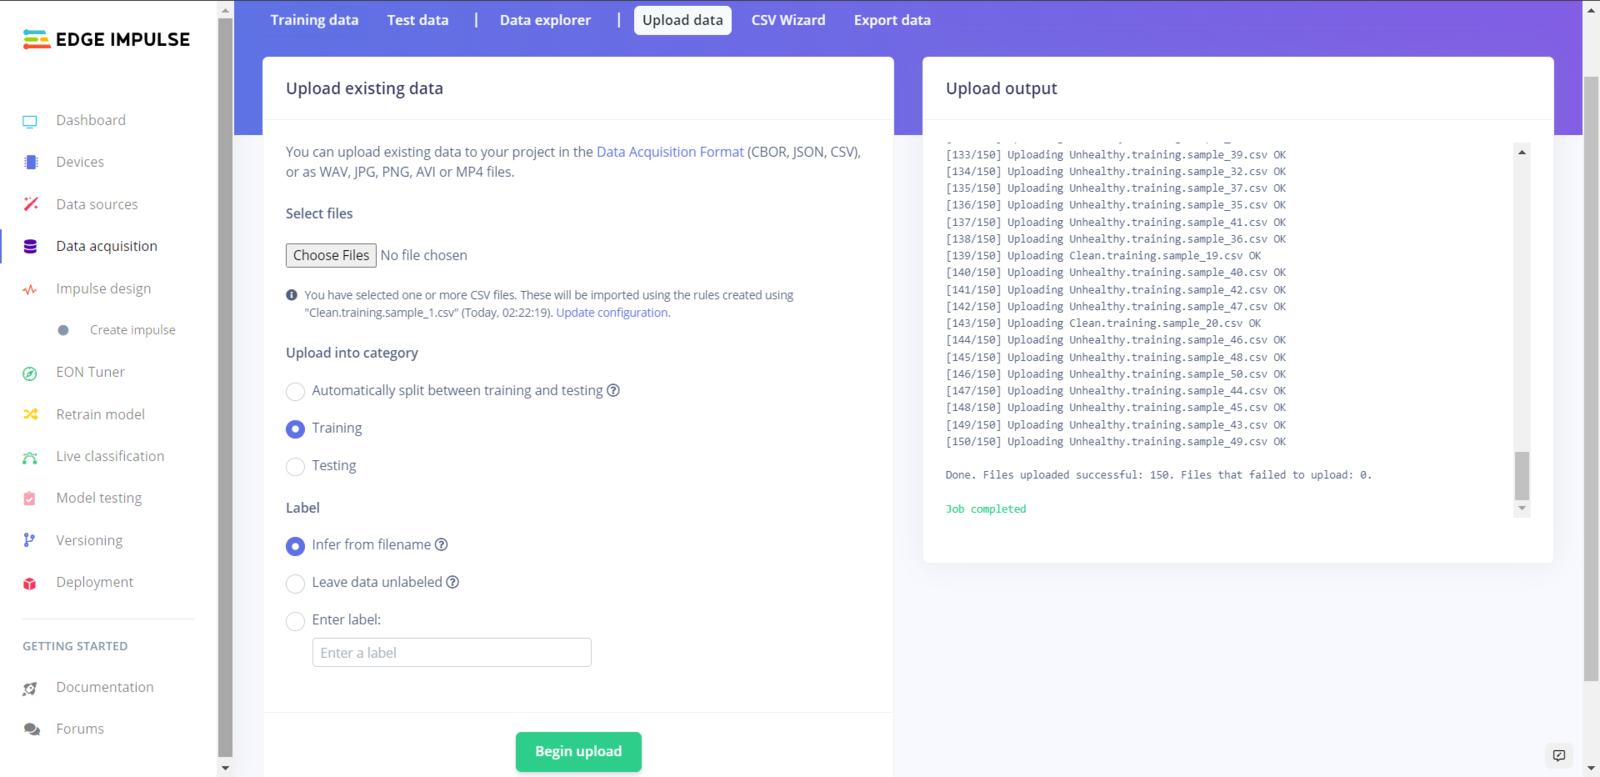
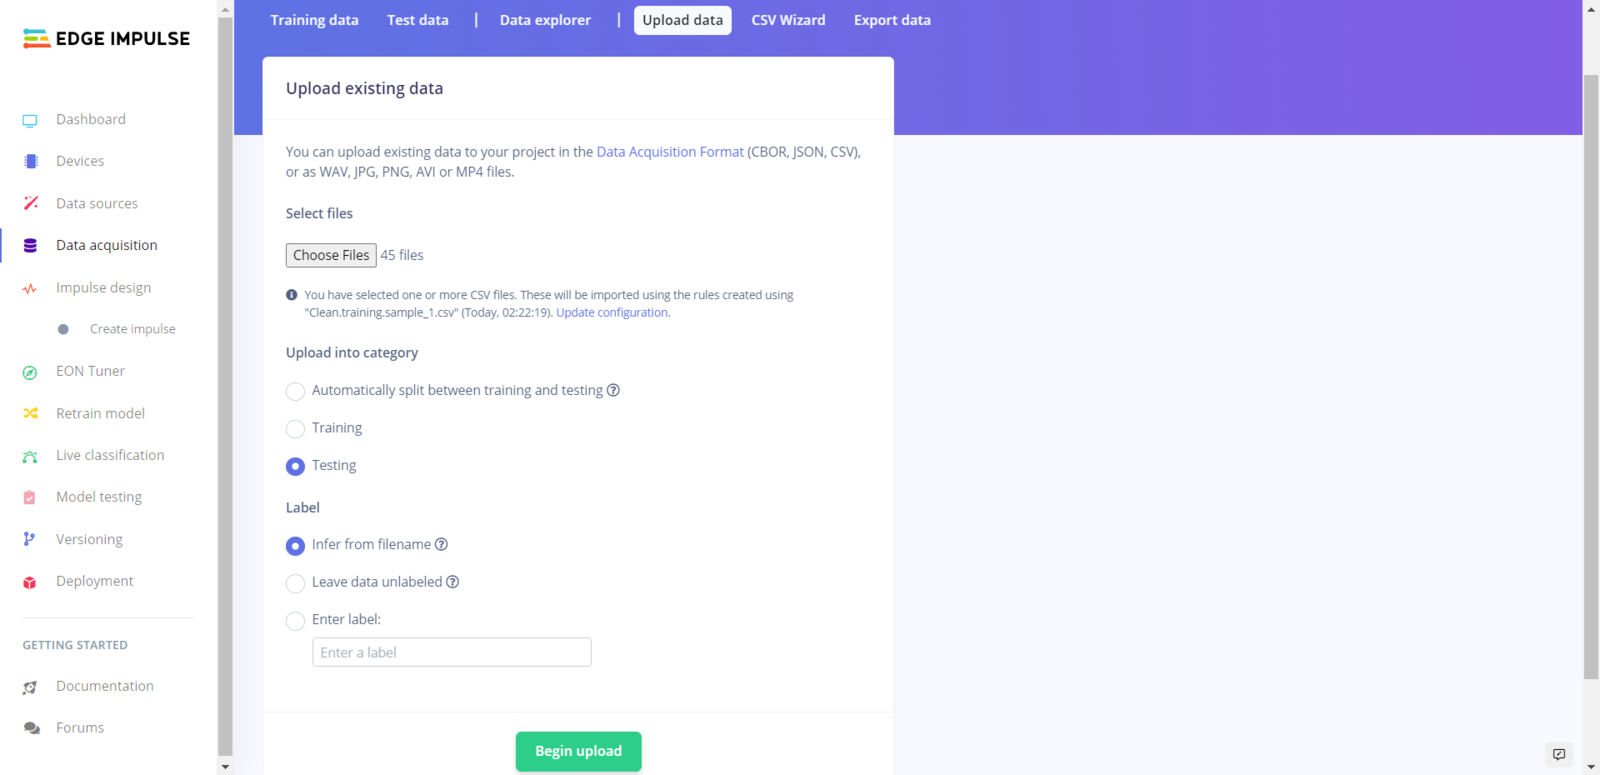
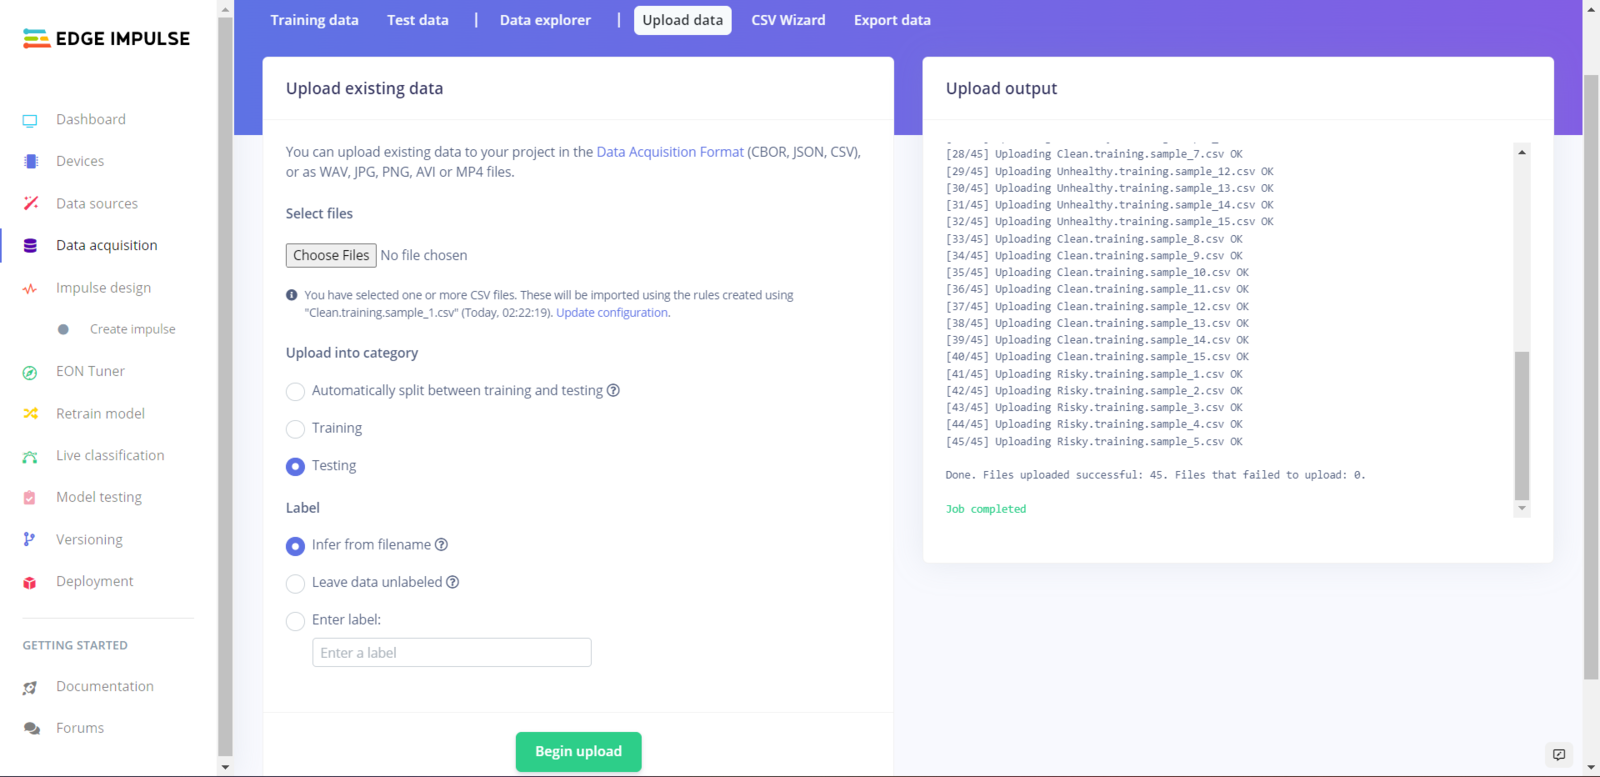
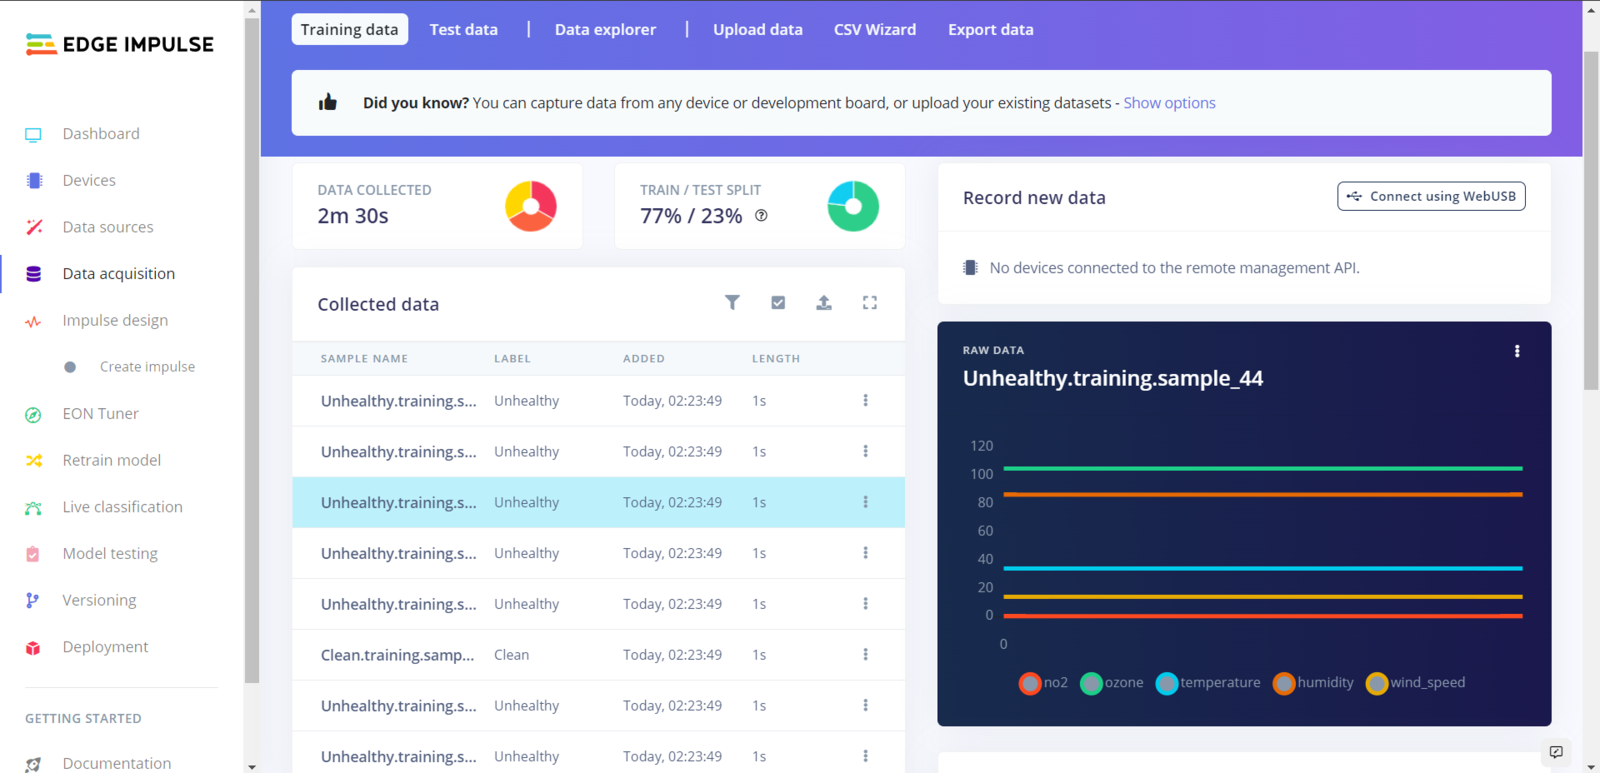
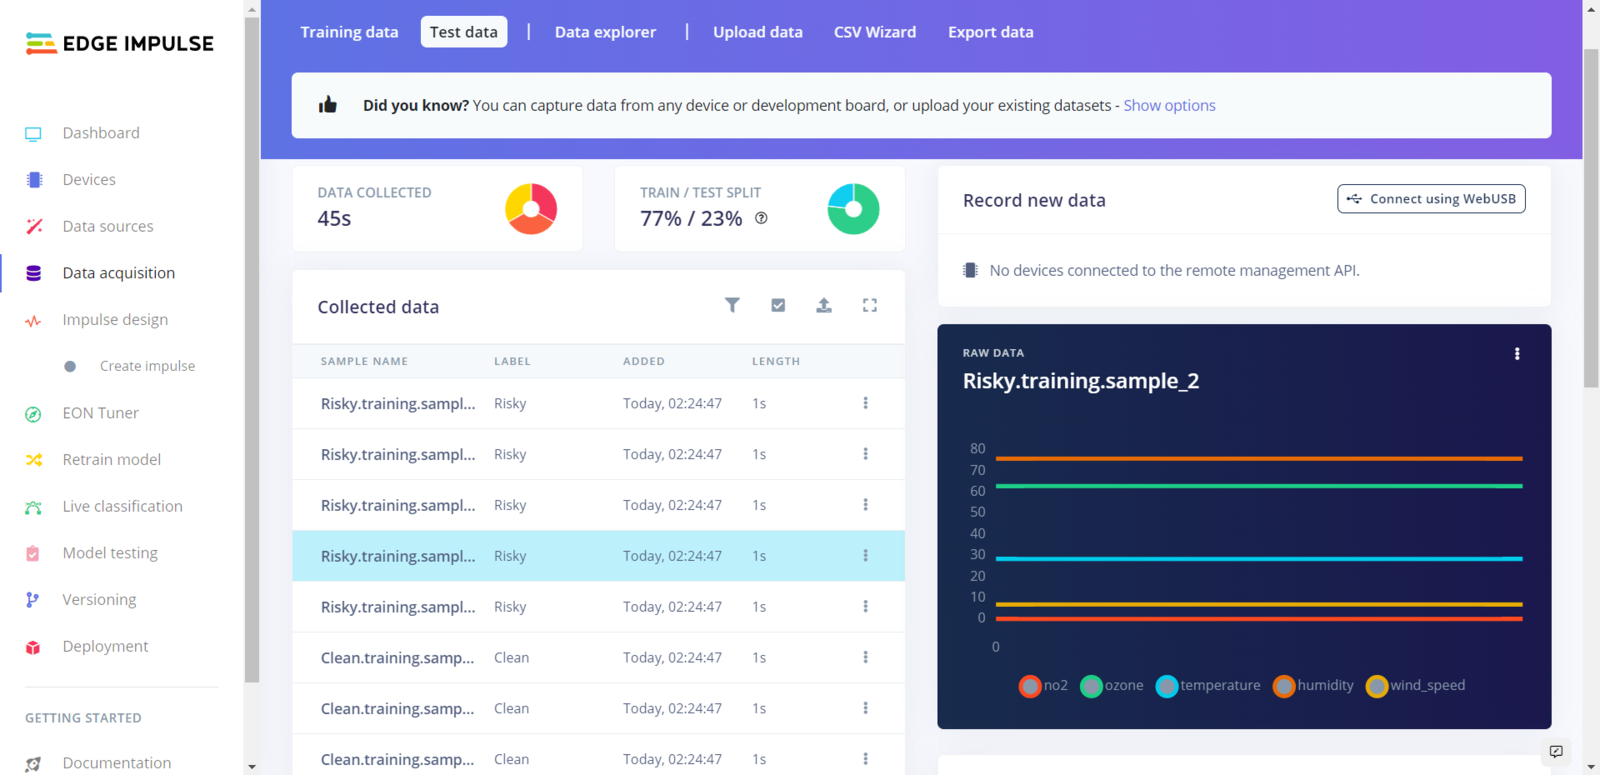 ## Step 5.3: Training the model on air pollution levels
After uploading my training and testing samples successfully, I designed an impulse and trained it on air pollution levels (classes).
An impulse is a custom neural network model in Edge Impulse. I created my impulse by employing the *Raw Data* processing block and the *Classification* learning block.
The *Raw Data* processing block generate windows from data samples without any specific signal processing.
The *Classification* learning block represents a Keras neural network model. Also, it lets the user change the model settings, architecture, and layers.
:hash: Go to the *Create impulse* page. Then, select the *Raw Data* processing block and the *Classification* learning block. Finally, click *Save Impulse*.
## Step 5.3: Training the model on air pollution levels
After uploading my training and testing samples successfully, I designed an impulse and trained it on air pollution levels (classes).
An impulse is a custom neural network model in Edge Impulse. I created my impulse by employing the *Raw Data* processing block and the *Classification* learning block.
The *Raw Data* processing block generate windows from data samples without any specific signal processing.
The *Classification* learning block represents a Keras neural network model. Also, it lets the user change the model settings, architecture, and layers.
:hash: Go to the *Create impulse* page. Then, select the *Raw Data* processing block and the *Classification* learning block. Finally, click *Save Impulse*.
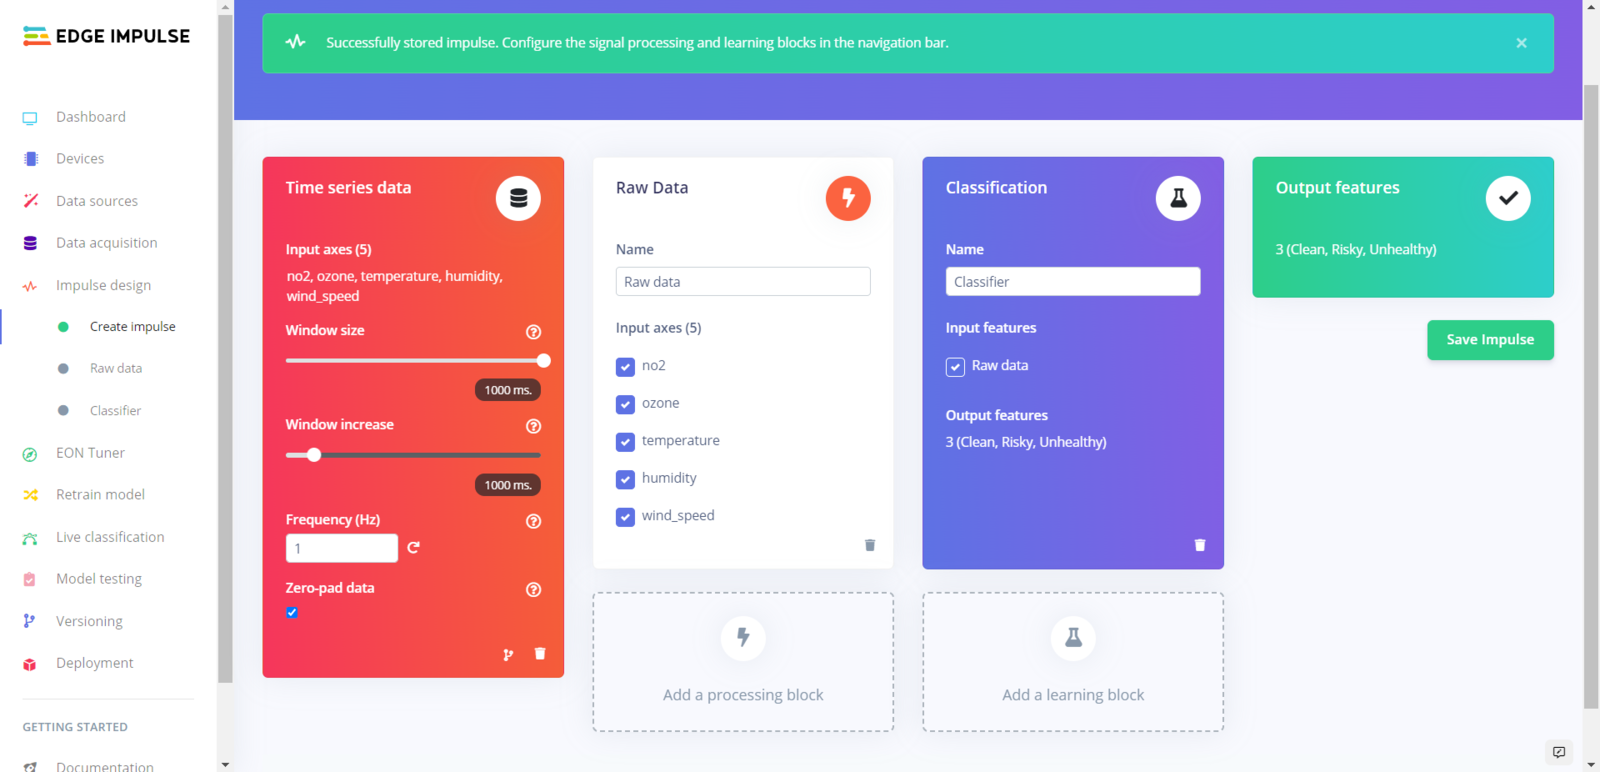 :hash: Before generating features for the neural network model, go to the *Raw data* page and click *Save parameters*.
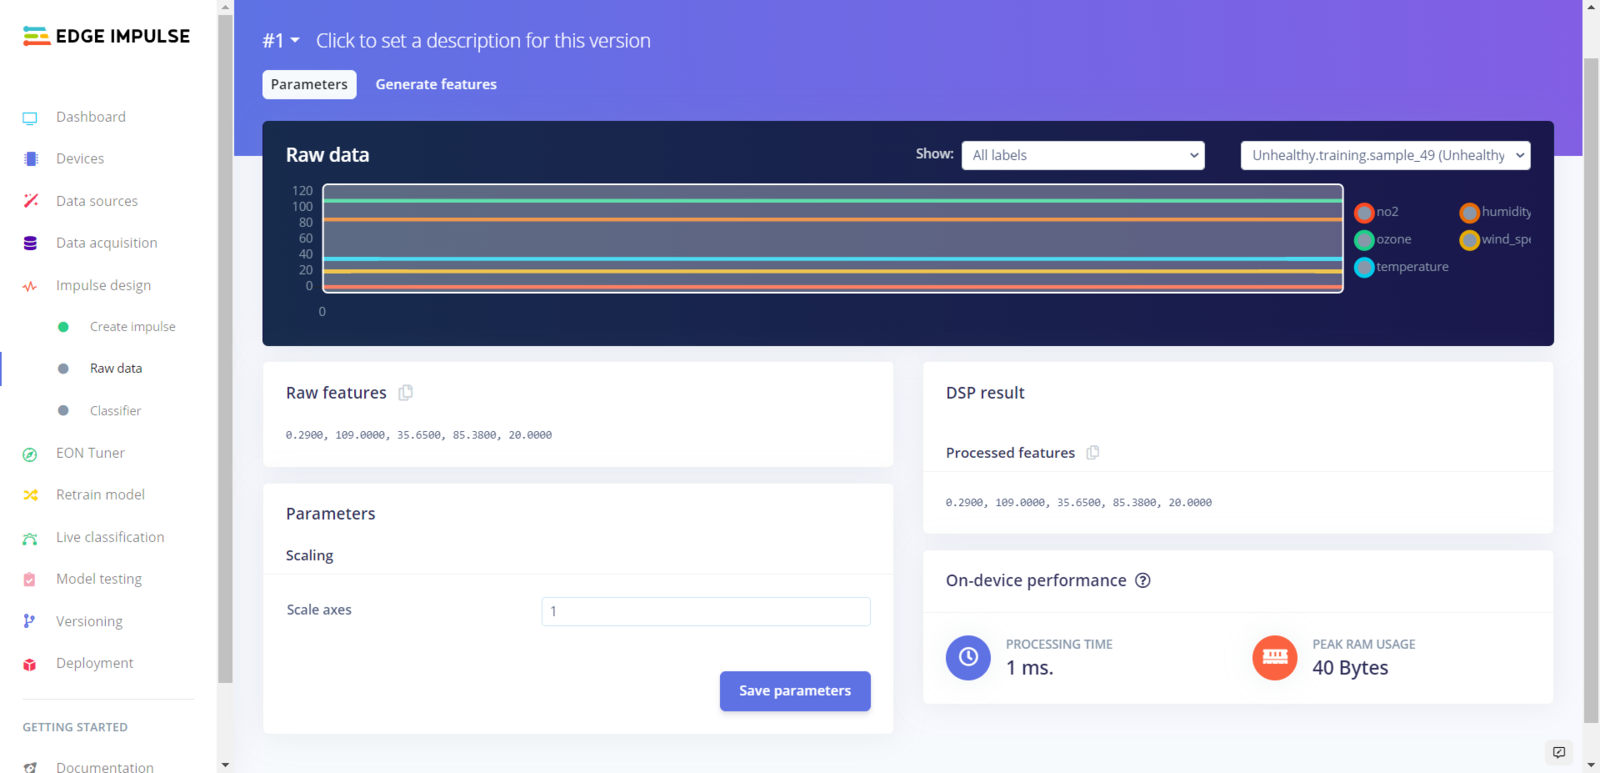 :hash: After saving parameters, click *Generate features* to apply the *Raw data* processing block to training samples.
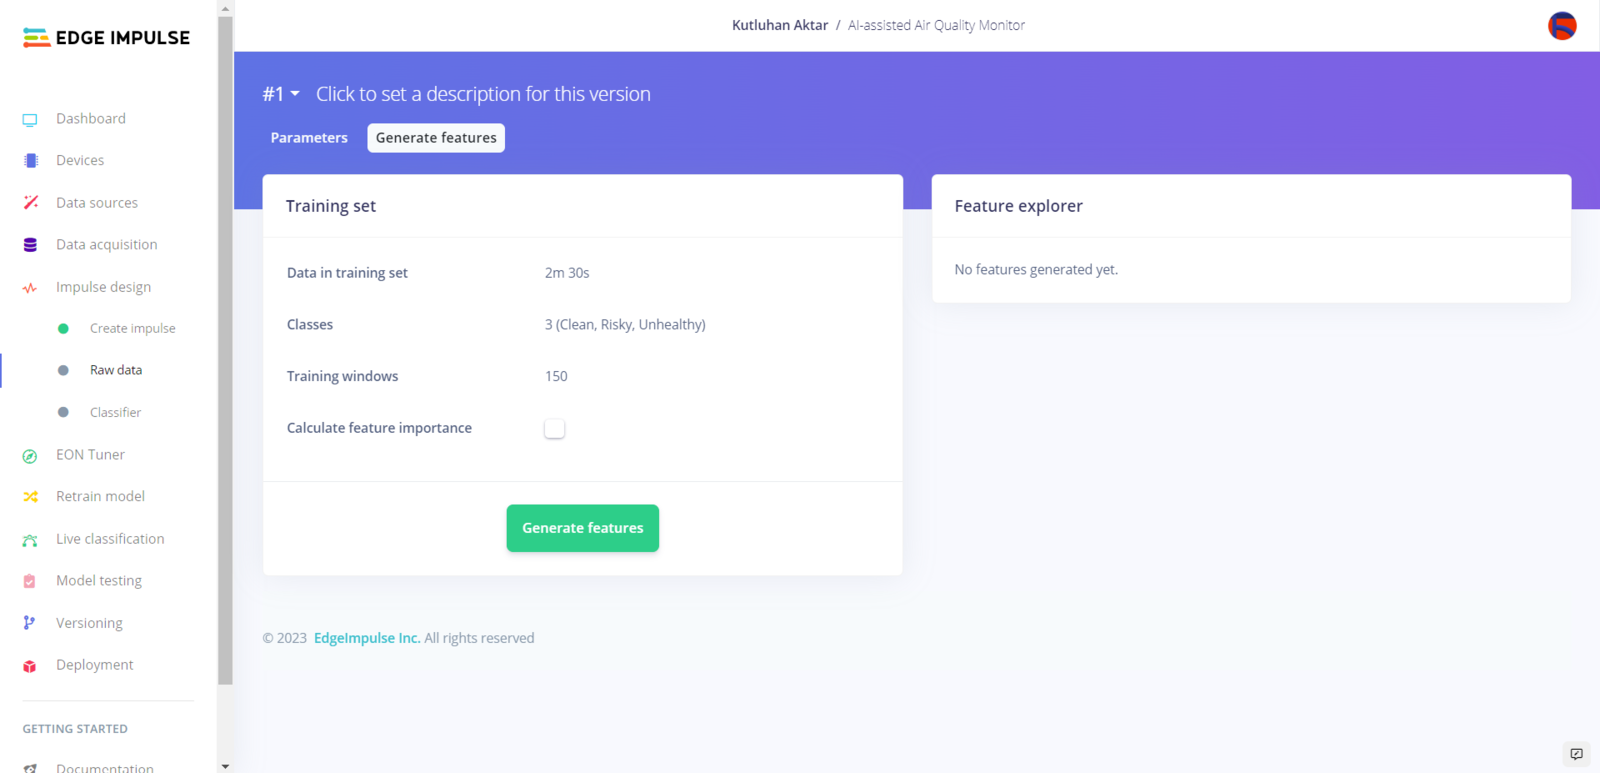
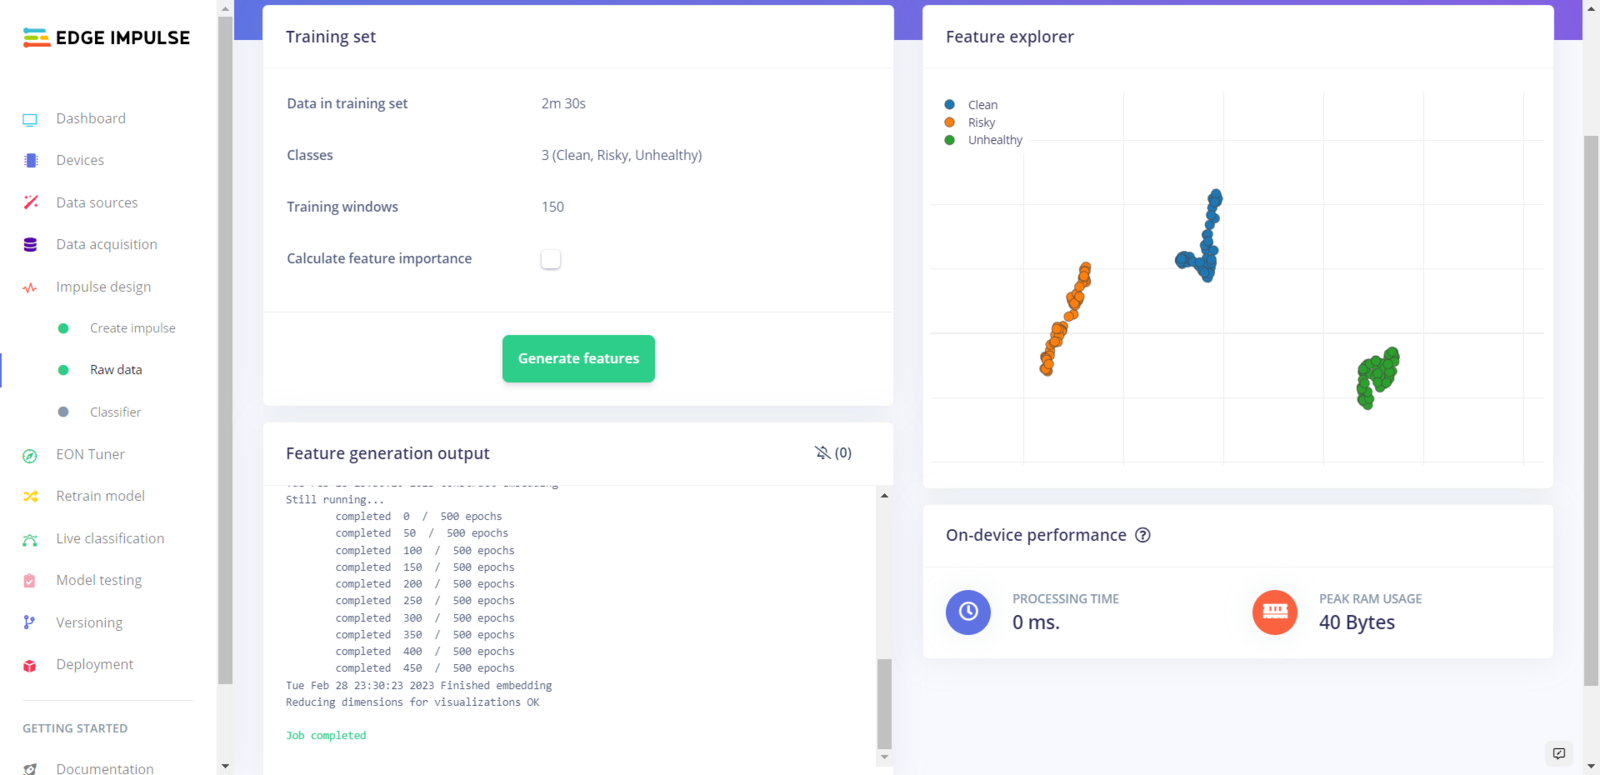 :hash: Finally, navigate to the *Classifier* page and click *Start training*.
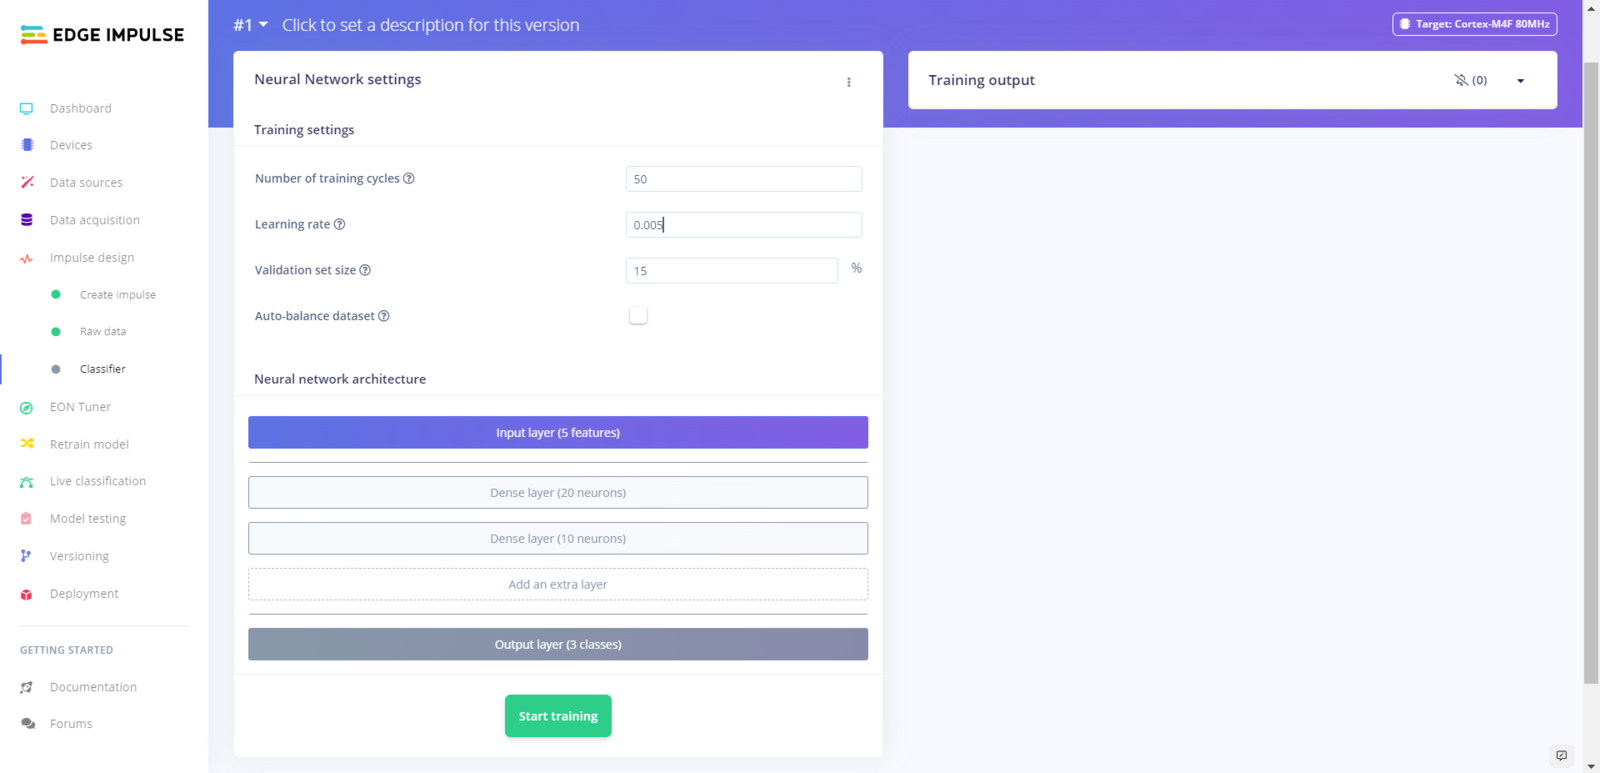
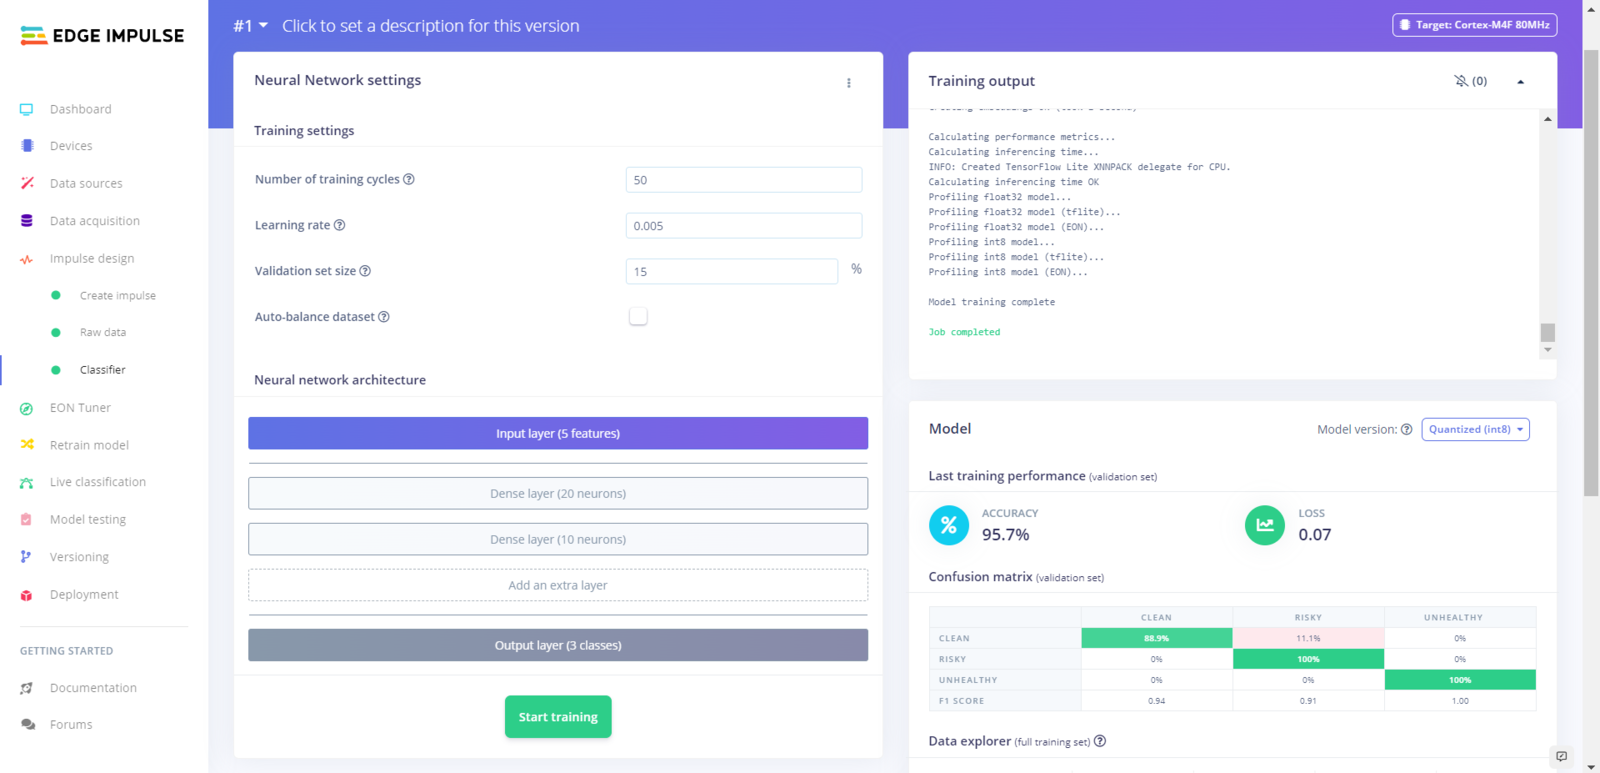 According to my experiments with my neural network model, I modified the neural network settings and layers to build a neural network model with high accuracy and validity:
📌 Neural network settings:
* Number of training cycles ➡ 50
* Learning rate ➡ 0.005
* Validation set size ➡ 15
📌 Extra layers:
* Dense layer (20 neurons)
* Dense layer (10 neurons)
After generating features and training my model with training samples, Edge Impulse evaluated the precision score (accuracy) as *95.7%*.
The precision score (accuracy) is approximately *96%* due to the modest volume and variety of training samples since I only collected ambient air quality data near my home. In technical terms, the model trains on limited validation samples to cover various regions. Therefore, I highly recommend retraining the model with local air quality data before running inferences in a different region.
According to my experiments with my neural network model, I modified the neural network settings and layers to build a neural network model with high accuracy and validity:
📌 Neural network settings:
* Number of training cycles ➡ 50
* Learning rate ➡ 0.005
* Validation set size ➡ 15
📌 Extra layers:
* Dense layer (20 neurons)
* Dense layer (10 neurons)
After generating features and training my model with training samples, Edge Impulse evaluated the precision score (accuracy) as *95.7%*.
The precision score (accuracy) is approximately *96%* due to the modest volume and variety of training samples since I only collected ambient air quality data near my home. In technical terms, the model trains on limited validation samples to cover various regions. Therefore, I highly recommend retraining the model with local air quality data before running inferences in a different region.
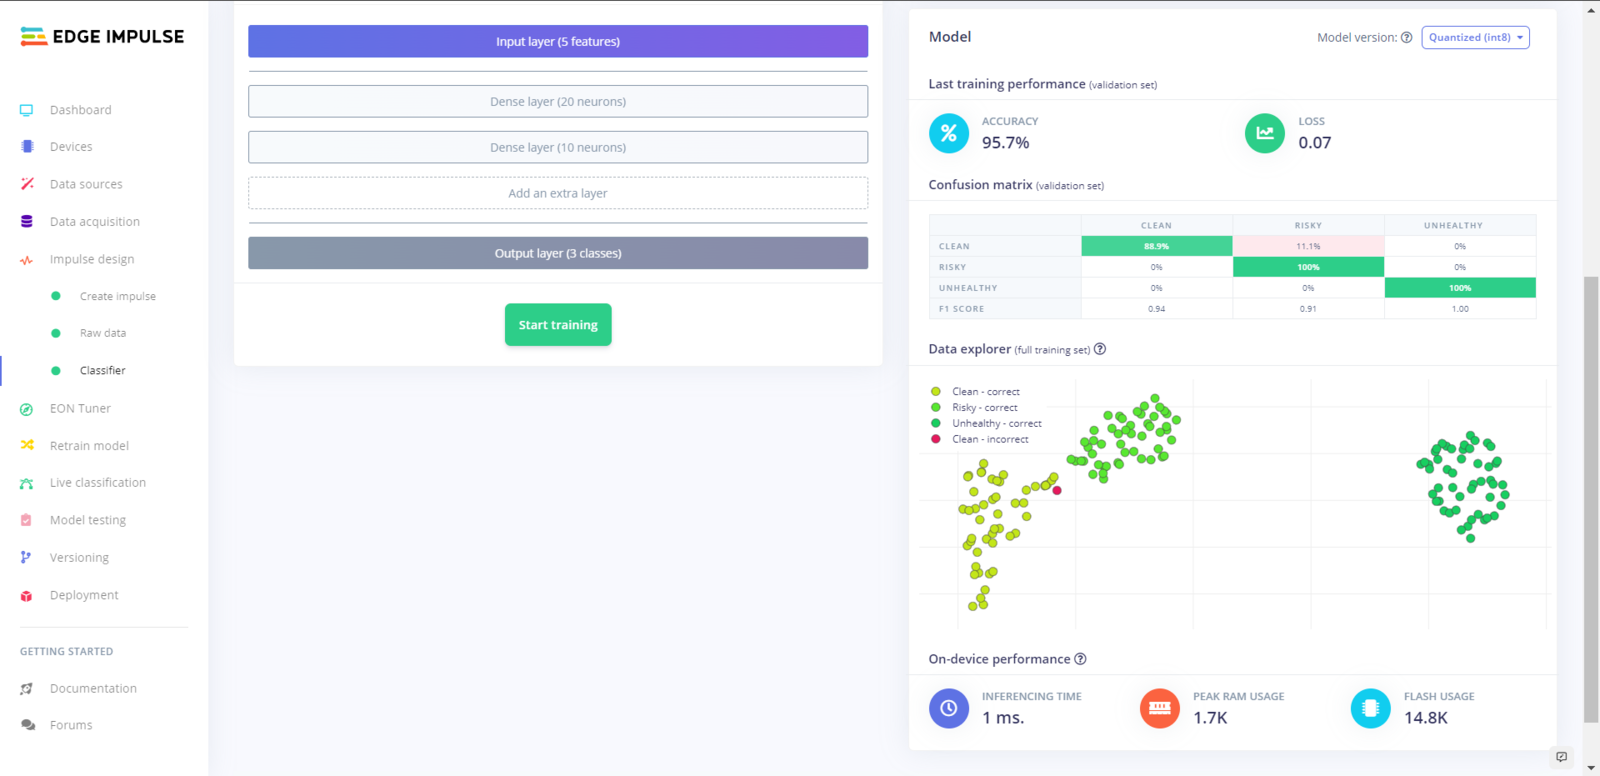 ## Step 5.4: Evaluating the model accuracy and deploying the model
After building and training my neural network model, I tested its accuracy and validity by utilizing testing samples.
The evaluated accuracy of the model is *97.78%*.
:hash: To validate the trained model, go to the *Model testing* page and click *Classify all*.
## Step 5.4: Evaluating the model accuracy and deploying the model
After building and training my neural network model, I tested its accuracy and validity by utilizing testing samples.
The evaluated accuracy of the model is *97.78%*.
:hash: To validate the trained model, go to the *Model testing* page and click *Classify all*.
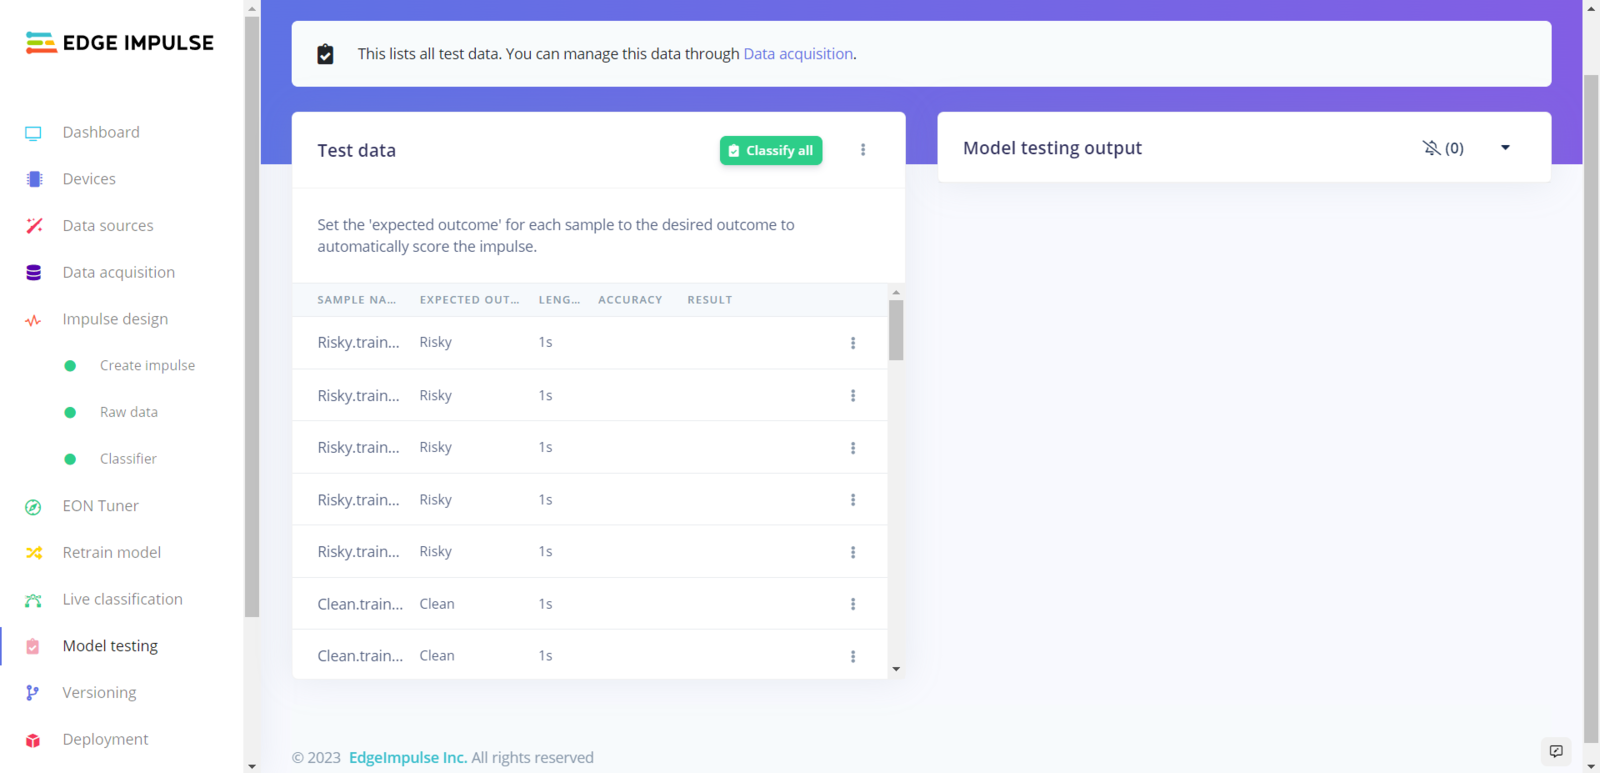
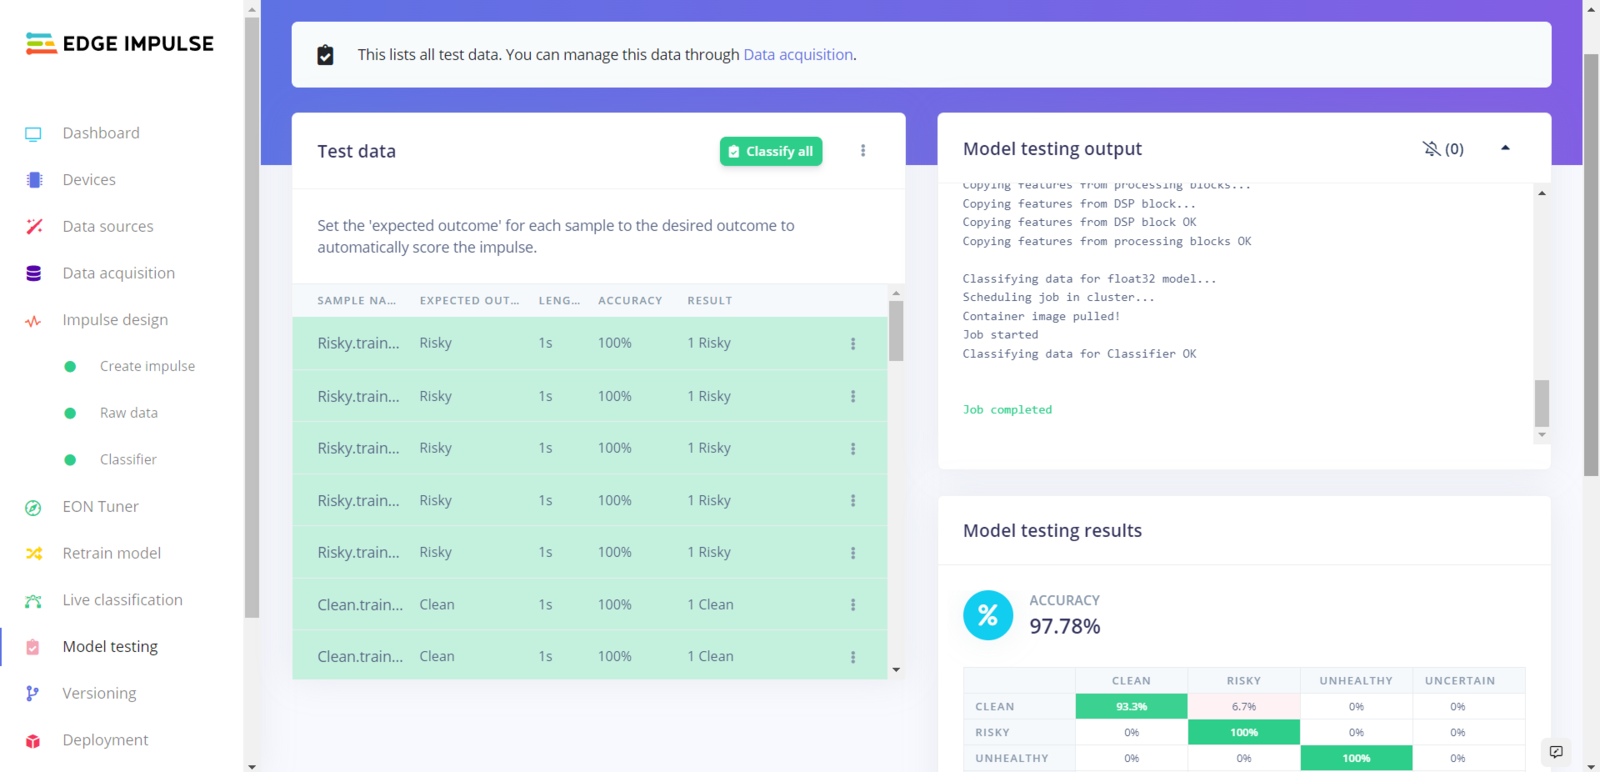
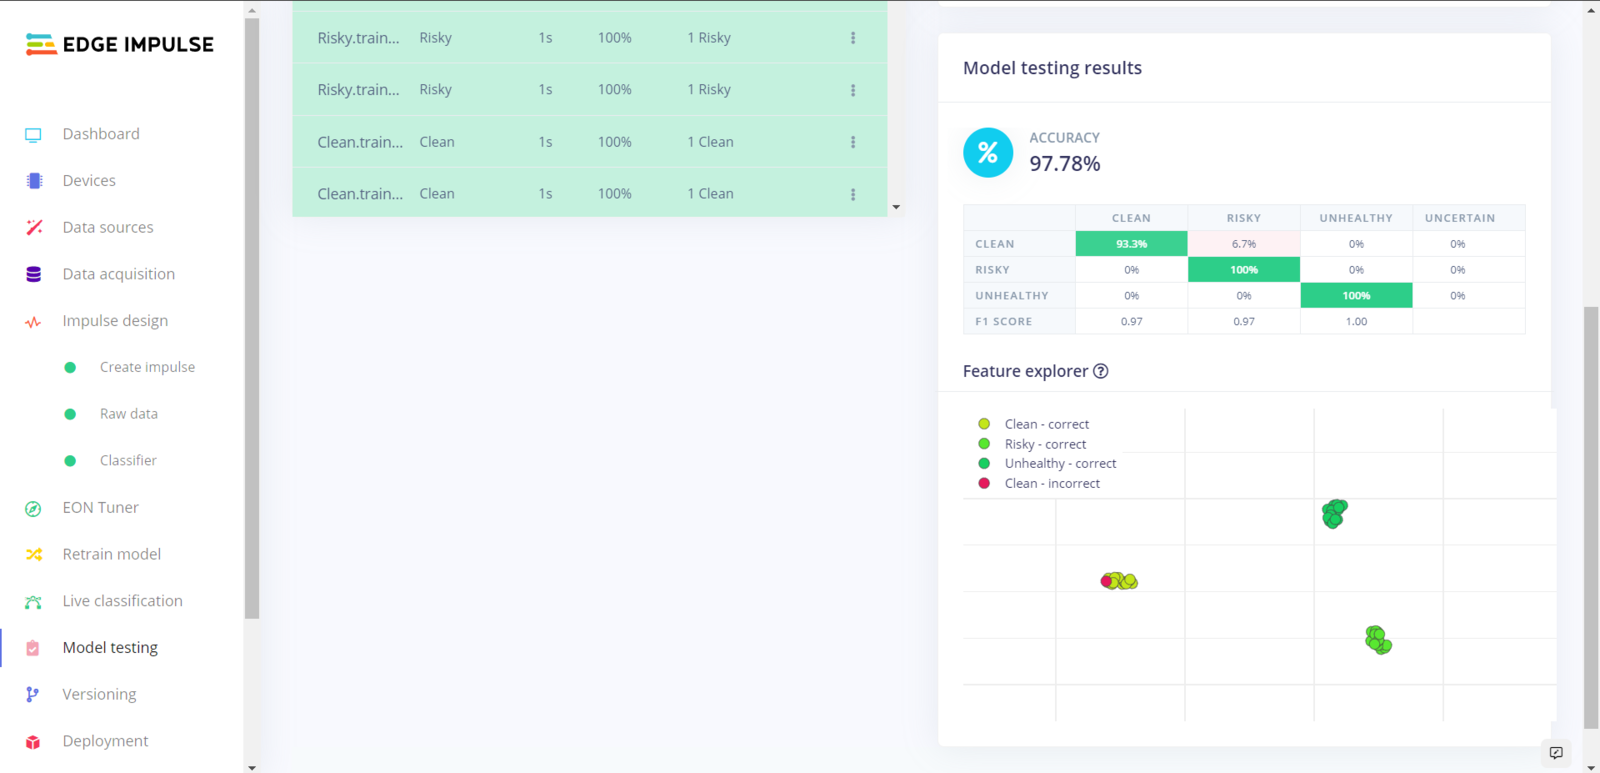 After validating my neural network model, I deployed it as a fully optimized and customizable Arduino library.
:hash: To deploy the validated model as an Arduino library, navigate to the *Deployment* page and select *Arduino library*.
:hash: Then, choose the *Quantized (int8)* optimization option to get the best performance possible while running the deployed model.
:hash: Finally, click *Build* to download the model as an Arduino library.
After validating my neural network model, I deployed it as a fully optimized and customizable Arduino library.
:hash: To deploy the validated model as an Arduino library, navigate to the *Deployment* page and select *Arduino library*.
:hash: Then, choose the *Quantized (int8)* optimization option to get the best performance possible while running the deployed model.
:hash: Finally, click *Build* to download the model as an Arduino library.
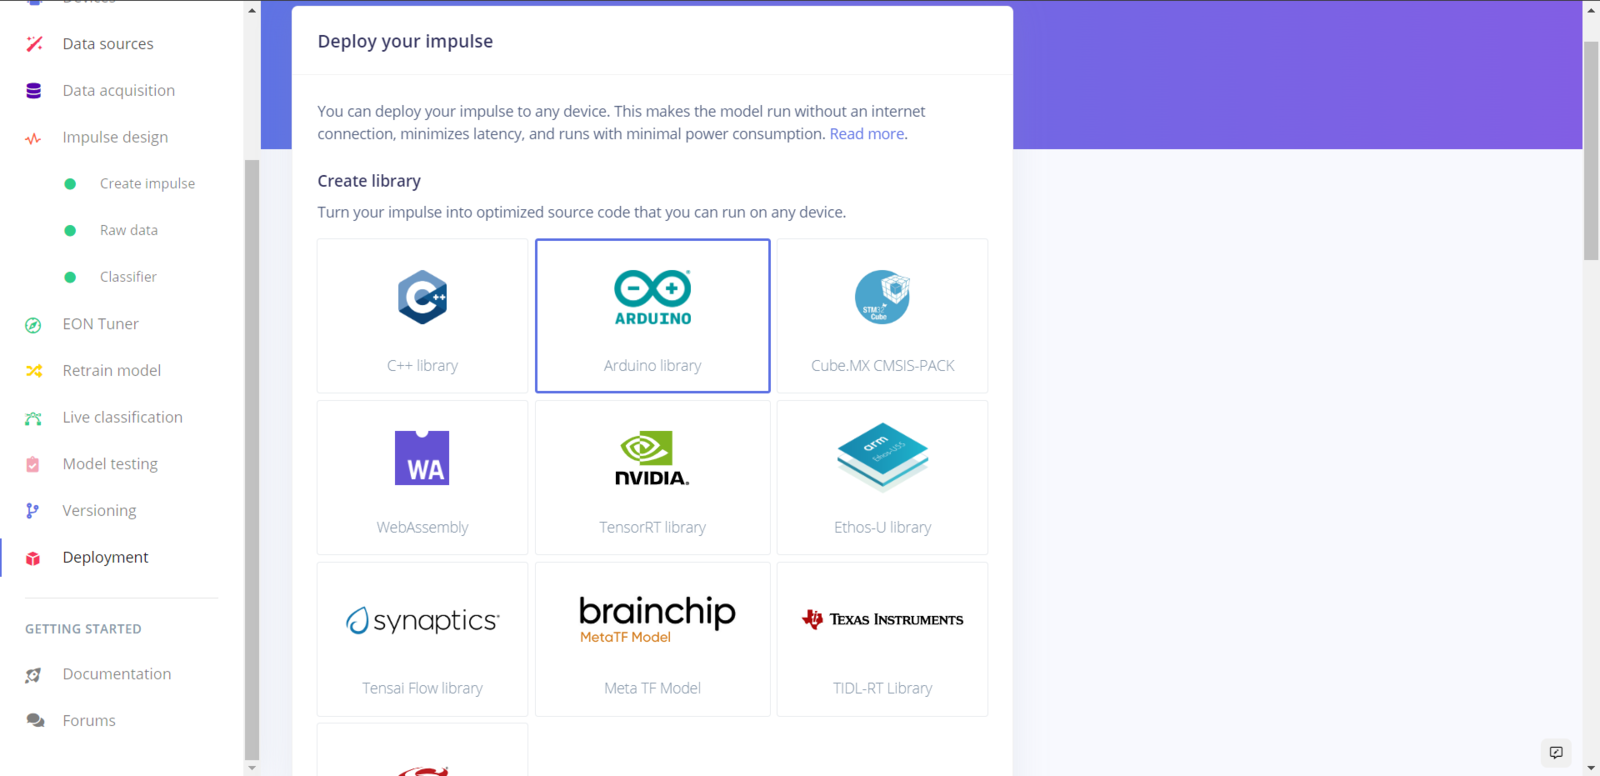
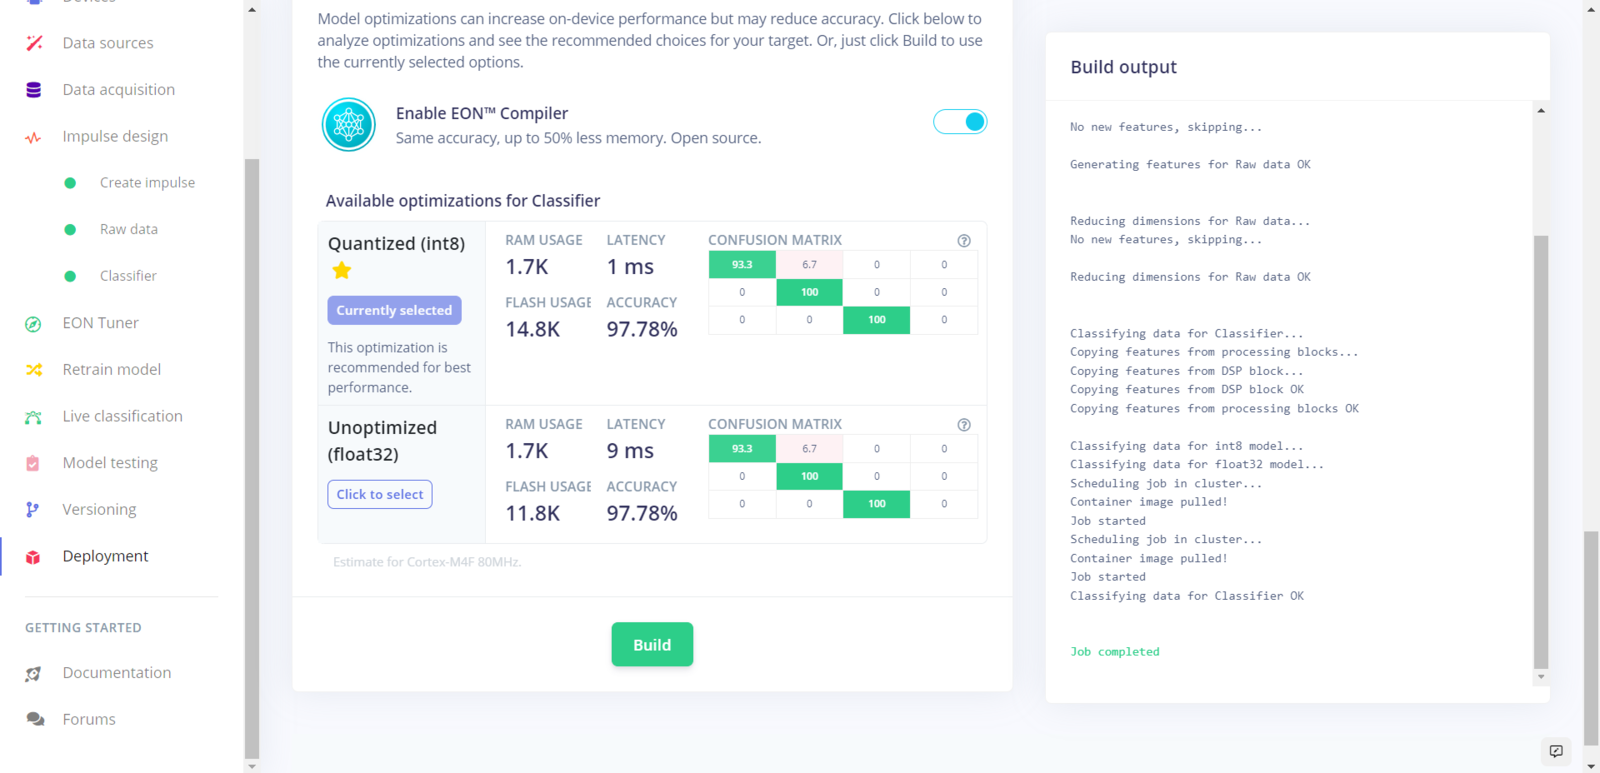
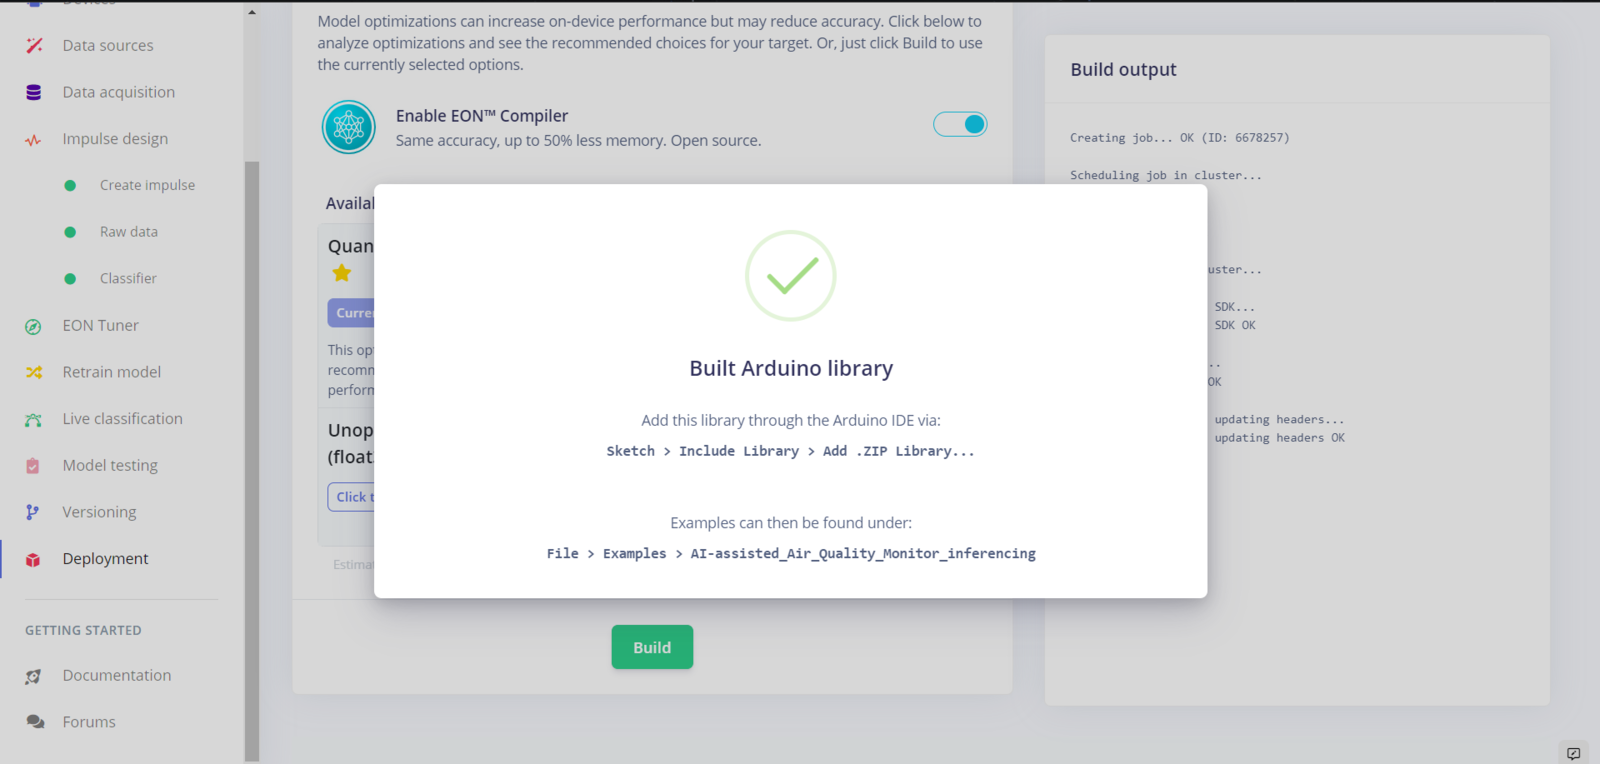 ## Step 6: Setting up the Edge Impulse model on FireBeetle ESP32
After building, training, and deploying my model as an Arduino library on Edge Impulse, I needed to upload the generated Arduino library on FireBeetle ESP32 to run the model directly so as to create an easy-to-use and capable air station operating with minimal latency, memory usage, and power consumption.
Since Edge Impulse optimizes and formats signal processing, configuration, and learning blocks into a single package while deploying models as Arduino libraries, I was able to import my model effortlessly to run inferences.
:hash: After downloading the model as an Arduino library in the ZIP file format, go to *Sketch ➡ Include Library ➡ Add .ZIP Library...*
:hash: Then, include the *AI-assisted\_Air\_Quality\_Monitor\_inferencing.h* file to import the Edge Impulse neural network model.
```
#include <AI-assisted_Air_Quality_Monitor_inferencing.h>
```
After importing my model successfully to the Arduino IDE, I programmed FireBeetle ESP32 to run inferences to detect air pollution levels and capture surveillance footage for further examination every 5 minutes. If manual testing is required, FireBeetle ESP32 can also run inference and capture surveillance footage when the built-in button on the FireBeetle media board is pressed.
* User Button (Built-in) ➡ Run Inference
Also, I employed FireBeetle ESP32 to transmit the collected air quality data, the model detection result, and the captured surveillance footage (raw image data) to the web application via an HTTP POST request after running inferences successfully.
You can download the *AIoT\_weather\_station\_run\_model.ino* file to try and inspect the code for running Edge Impulse neural network models and transferring data to a web application via FireBeetle ESP32.
⭐ Include the required libraries.
```
#include <Arduino.h>
#include <WiFi.h>
#include "soc/soc.h"
#include "soc/rtc_cntl_reg.h"
#include "esp_camera.h"
#include "FS.h"
#include "SD_MMC.h"
```
⭐ Define the required parameters to run an inference with the Edge Impulse model.
⭐ Define the features array (buffer) to classify one frame of data.
```
#define FREQUENCY_HZ EI_CLASSIFIER_FREQUENCY
#define INTERVAL_MS (1000 / (FREQUENCY_HZ + 1))
// Define the features array to classify one frame of data.
float features[EI_CLASSIFIER_DSP_INPUT_FRAME_SIZE];
size_t feature_ix = 0;
```
⭐ Define the threshold value (0.60) for the model outputs (predictions).
⭐ Define the air pollution level (class) names:
* Clean
* Risky
* Unhealthy
```
float threshold = 0.60;
// Define the air quality level (class) names:
String classes[] = {"Clean", "Risky", "Unhealthy"};
```
⭐ Define the Wi-Fi network and the web application settings hosted by LattePanda 3 Delta 864.
```
char ssid[] = "<_SSID_>"; // your network SSID (name)
char pass[] = "<_PASSWORD_>"; // your network password (use for WPA, or use as key for WEP)
int keyIndex = 0; // your network key Index number (needed only for WEP)
// Define the server on LattePanda 3 Delta 864.
char server[] = "192.168.1.22";
// Define the web application path.
String application = "/weather_station_data_center/update_data.php";
// Initialize the WiFiClient object.
WiFiClient client; /* WiFiSSLClient client; */
```
⭐ Define the FireBeetle media board pin out to modify the official *esp\_camera* library for the built-in OV7725 camera.
⭐ Define the camera (image) buffer array.
```
// FireBeetle Covers - Camera & Audio Media Board
// https://wiki.dfrobot.com/FireBeetle_Covers-Camera%26Audio_Media_Board_SKU_DFR0498
// Pinout:
#define PWDN_GPIO_NUM -1
#define RESET_GPIO_NUM 0
#define XCLK_GPIO_NUM 21
#define SIOD_GPIO_NUM 26
#define SIOC_GPIO_NUM 27
#define Y9_GPIO_NUM 35
#define Y8_GPIO_NUM 34
#define Y7_GPIO_NUM 39
#define Y6_GPIO_NUM 36
#define Y5_GPIO_NUM 19
#define Y4_GPIO_NUM 18
#define Y3_GPIO_NUM 5
#define Y2_GPIO_NUM 17
#define VSYNC_GPIO_NUM 25
#define HREF_GPIO_NUM 23
#define PCLK_GPIO_NUM 22
// Define the camera (image) buffer array.
camera_fb_t * fb = NULL;
```
⭐ Create a struct including all air quality data items as its elements.
```
struct data {
float temperature;
float humidity;
float no2;
int ozone;
int wind_speed;
};
```
⭐ Disable the brownout detector to avoid system reset errors.
```
WRITE_PERI_REG(RTC_CNTL_BROWN_OUT_REG, 0);
```
⭐ Initialize the hardware serial port (UART2) with redefined pins to communicate with Arduino Mega.
```
Serial2.begin(115200, SERIAL_8N1, RXD, TXD); // (BaudRate, SerialMode, RX_pin, TX_pin)
```
⭐ Initiate the built-in SD card module on the FireBeetle media board.
```
if(!SD_MMC.begin()){
Serial.println("SD Card not detected!\n");
return;
}
Serial.println("SD Card detected successfully!\n");
```
⭐ Define the pin configuration settings of the built-in OV7725 camera on the media board.
```
camera_config_t config;
config.ledc_channel = LEDC_CHANNEL_0;
config.ledc_timer = LEDC_TIMER_0;
config.pin_d0 = Y2_GPIO_NUM;
config.pin_d1 = Y3_GPIO_NUM;
config.pin_d2 = Y4_GPIO_NUM;
config.pin_d3 = Y5_GPIO_NUM;
config.pin_d4 = Y6_GPIO_NUM;
config.pin_d5 = Y7_GPIO_NUM;
config.pin_d6 = Y8_GPIO_NUM;
config.pin_d7 = Y9_GPIO_NUM;
config.pin_xclk = XCLK_GPIO_NUM;
config.pin_pclk = PCLK_GPIO_NUM;
config.pin_vsync = VSYNC_GPIO_NUM;
config.pin_href = HREF_GPIO_NUM;
config.pin_sscb_sda = SIOD_GPIO_NUM;
config.pin_sscb_scl = SIOC_GPIO_NUM;
config.pin_pwdn = PWDN_GPIO_NUM;
config.pin_reset = RESET_GPIO_NUM;
```
⭐ Define the pixel format and the frame size settings.
*FRAMESIZE\_QVGA* (320x240)
```
config.xclk_freq_hz = 20000000;
config.pixel_format = PIXFORMAT_GRAYSCALE;
config.frame_size = FRAMESIZE_QVGA; // FRAMESIZE_96X96, FRAMESIZE_240X240
config.jpeg_quality = 20; // 0-63 lower number means higher quality
config.fb_count = 1;
```
⭐ Since FireBeetle ESP32 does not have SPI memory (PSRAM), disable PSRAM allocation to avoid connection errors.
```
config.fb_location = CAMERA_FB_IN_DRAM;
```
⭐ Initiate the built-in OV7725 camera on the media board.
```
esp_err_t err = esp_camera_init(&config);
if (err != ESP_OK) {
Serial.printf("Camera init failed with error 0x%x", err);
delay(1000);
ESP.restart();
}
Serial.println("Camera initialized successfully!\n");
```
⭐ Initialize the Wi-Fi module.
⭐ Attempt to connect to the given Wi-Fi network.
```
WiFi.mode(WIFI_STA);
WiFi.begin(ssid, pass);
// Attempt to connect to the Wi-Fi network:
while(WiFi.status() != WL_CONNECTED){
// Wait for the connection:
delay(500);
Serial.print(".");
}
// If connected to the network successfully:
Serial.println("Connected to the Wi-Fi network successfully!");
```
⭐ Obtain the data packet and commands transferred by Arduino Mega via serial communication.
```
if(Serial2.available() > 0){
data_packet = Serial2.readString();
}
```
⭐ In the *save\_data\_to\_CSV* function:
⭐ Create a new CSV file on the SD card with the given file name.
⭐ Append the header and the given data items to the generated CSV file.
```
void save_data_to_CSV(const char * file_path, const char * _data, String f_name){
// Create a CSV file on the SD card with the given file name.
File file = SD_MMC.open(file_path, FILE_WRITE);
if(!file){ Serial.println("SD Card: Failed to open the given CSV file!\n"); return; }
// Append the header and the given data items to the generated CSV file.
if(file.print(_data)){ Serial.println("SD Card => Data appended successfully: " + f_name + "\n"); }
else{ Serial.println("SD Card: Data append failed!\n"); }
}
```
⭐ If Arduino Mega sends the *Save* command with the recently collected air quality data and the selected air pollution level:
⭐ Glean information as substrings from the transferred data packet by utilizing the ampersand (&) as the delimiter.
⭐ Increment the sample number of the given level (class) by 1 to create unique samples (CSV files).
⭐ Create a new CSV file under the *samples* folder on the SD card and combine the given air pollution level and the sample number as the file name. Then, append the received air quality data items with the given header to the generated CSV file.
```
if(data_packet != ""){
if(data_packet.startsWith("Save")){
// Glean information as substrings from the transferred data packet by Arduino Mega.
del_1 = data_packet.indexOf("&");
del_2 = data_packet.indexOf("&", del_1 + 1);
String data_record = data_packet.substring(del_1 + 1, del_2);
String level = data_packet.substring(del_2 + 1);
// Increment the sample number of the given level (class) by 1.
int i;
if(level == "Clean") { c_s+=1; i=c_s;}
if(level == "Risky") { r_s+=1; i=r_s;}
if(level == "Unhealthy") { u_s+=1; i=u_s;}
// Save the transferred data record as a sample (CSV file) depending on the given air quality level.
String file_name = "/samples/" + level + ".training.sample_" + String(i) + ".csv";
String line = _header + data_record;
save_data_to_CSV(file_name.c_str(), line.c_str(), file_name);
}
```
⭐ If Arduino Mega sends the *Data* command with the recently collected air quality data items:
⭐ Glean information as substrings from the transferred data packet by utilizing the comma (,) as the delimiter.
⭐ Convert the received data items from strings to their corresponding data types and copy them to the struct as its elements.
⭐ Finally, clear the transferred data packet.
```
if(data_packet.startsWith("Data")){
// Glean information as substrings from the transferred data packet by Arduino Mega.
del_1 = data_packet.indexOf(",");
del_2 = data_packet.indexOf(",", del_1 + 1);
del_3 = data_packet.indexOf(",", del_2 + 1);
del_4 = data_packet.indexOf(",", del_3 + 1);
del_5 = data_packet.indexOf(",", del_4 + 1);
// Convert and store the received data items.
air_quality.no2 = data_packet.substring(del_1 + 1, del_2).toFloat();
air_quality.ozone = data_packet.substring(del_2 + 1, del_3).toInt();
air_quality.temperature = data_packet.substring(del_3 + 1, del_4).toFloat();
air_quality.humidity = data_packet.substring(del_4 + 1, del_5).toFloat();
air_quality.wind_speed = data_packet.substring(del_5 + 1).toInt();
Serial.println("\nData parameters obtained and saved successfully!\n");
}
// Clear the incoming data packet.
delay(1000);
data_packet = "";
}
```
⭐ In the *run\_inference\_to\_make\_predictions* function:
⭐ Scale (normalize) the collected data depending on the given model and copy the scaled data items to the features array (buffer).
⭐ If required, multiply the scaled data items while copying them to the features array (buffer).
⭐ Display the progress of copying data to the features buffer on the serial monitor.
⭐ If the features buffer is full, create a signal object from the features buffer (frame).
⭐ Then, run the classifier.
⭐ Print the inference timings on the serial monitor.
⭐ Obtain the prediction (detection) result for each given label and print them on the serial monitor.
⭐ The detection result greater than the given threshold (0.60) represents the most accurate label (air pollution level) predicted by the model.
⭐ Print the detected anomalies on the serial monitor, if any.
⭐ Finally, clear the features buffer (frame).
```
void run_inference_to_make_predictions(int multiply){
// Scale (normalize) data items depending on the given model:
float scaled_no2 = air_quality.no2;
float scaled_ozone = float(air_quality.ozone);
float scaled_temperature = air_quality.temperature;
float scaled_humidity = air_quality.humidity;
float scaled_wind_speed = float(air_quality.wind_speed);
// Copy the scaled data items to the features buffer.
// If required, multiply the scaled data items while copying them to the features buffer.
for(int i=0; i<multiply; i++){
features[feature_ix++] = scaled_no2;
features[feature_ix++] = scaled_ozone;
features[feature_ix++] = scaled_temperature;
features[feature_ix++] = scaled_humidity;
features[feature_ix++] = scaled_wind_speed;
}
// Display the progress of copying data to the features buffer.
Serial.print("Features Buffer Progress: "); Serial.print(feature_ix); Serial.print(" / "); Serial.println(EI_CLASSIFIER_DSP_INPUT_FRAME_SIZE);
// Run inference:
if(feature_ix == EI_CLASSIFIER_DSP_INPUT_FRAME_SIZE){
ei_impulse_result_t result;
// Create a signal object from the features buffer (frame).
signal_t signal;
numpy::signal_from_buffer(features, EI_CLASSIFIER_DSP_INPUT_FRAME_SIZE, &signal);
// Run the classifier:
EI_IMPULSE_ERROR res = run_classifier(&signal, &result, false);
ei_printf("\nrun_classifier returned: %d\n", res);
if(res != 0) return;
// Print the inference timings on the serial monitor.
ei_printf("Predictions (DSP: %d ms., Classification: %d ms., Anomaly: %d ms.): \n",
result.timing.dsp, result.timing.classification, result.timing.anomaly);
// Obtain the prediction results for each label (class).
for(size_t ix = 0; ix < EI_CLASSIFIER_LABEL_COUNT; ix++){
// Print the prediction results on the serial monitor.
ei_printf("%s:\t%.5f\n", result.classification[ix].label, result.classification[ix].value);
// Get the predicted label (class).
if(result.classification[ix].value >= threshold) predicted_class = ix;
}
Serial.print("\nPredicted Class: "); Serial.println(predicted_class);
// Detect anomalies, if any:
#if EI_CLASSIFIER_HAS_ANOMALY == 1
ei_printf("Anomaly : \t%.3f\n", result.anomaly);
#endif
// Clear the features buffer (frame):
feature_ix = 0;
}
}
```
⭐ In the *take\_picture* function:
⭐ Release the image buffer to avoid FireBeetle ESP32 from throwing memory allocation errors while capturing pictures sequentially.
⭐ Capture a picture with the built-in OV7725 camera on the FireBeetle media board and save it to the image buffer.
```
void take_picture(bool _abort){
// Release the image buffer if the board throws memory allocation errors.
if(_abort) esp_camera_fb_return(fb);
// Capture a picture with the OV7725 camera.
fb = esp_camera_fb_get();
// If successful:
if(!fb) {
Serial.println("\nImage capture failed!");
delay(1000);
ESP.restart();
}
Serial.print("\nImage captured successfully: "); Serial.println(fb->len);
delay(500);
}
```
⭐ In the *make\_a\_post\_request* function:
⭐ Connect to the web application named *weather\_station\_data\_center*.
⭐ Create the *query* string and add the latest received air quality data items with the model detection result to the string as URL query (GET) parameters.
⭐ Define the boundary parameter named *EnvNotification* so as to send the captured raw image data as a TXT file to the web application.
⭐ Get the total content length.
⭐ Set the *Connection* HTTP header as *Keep-Alive*.
⭐ Make an HTTP POST request with the created query string to the web application in order to transfer the captured raw image data as a TXT file.
⭐ Release the image buffer.
```
void make_a_post_request(String request){
// Connect to the web application named weather_station_data_center. Change '80' with '443' if you are using SSL connection.
if (client.connect(server, 80)){
// If successful:
Serial.println("\nConnected to the web application successfully!\n");
// Create the query string:
String query = application + request;
// Make an HTTP POST request:
String head = "--EnvNotification\r\nContent-Disposition: form-data; name=\"captured_image\"; filename=\"new_image.txt\"\r\nContent-Type: text/plain\r\n\r\n";
String tail = "\r\n--EnvNotification--\r\n";
// Get the total message length.
uint32_t totalLen = head.length() + fb->len + tail.length();
// Start the request:
client.println("POST " + query + " HTTP/1.1");
client.println("Host: 192.168.1.22");
client.println("Content-Length: " + String(totalLen));
client.println("Connection: Keep-Alive");
client.println("Content-Type: multipart/form-data; boundary=EnvNotification");
client.println();
client.print(head);
client.write(fb->buf, fb->len);
client.print(tail);
// Release the image buffer.
esp_camera_fb_return(fb);
delay(2000);
// If successful:
Serial.println("HTTP POST => Data transfer completed!\n");
}else{
Serial.println("\nConnection failed to the web application!\n");
delay(2000);
}
}
```
⭐ Every 5 minutes or when the built-in button on the media board is pressed:
⭐ Start running an inference with the Edge Impulse model to make predictions on the air pollution levels (classes).
⭐ If the Edge Impulse model predicts an air quality level (class) successfully:
⭐ Create the *request* string consisting of the latest received air quality data items and the detected air pollution class.
⭐ Capture a picture with the built-in OV7725 camera on the media board.
⭐ Send the air quality data items, the model detection result, and the recently captured raw image as a TXT file to the web application via an HTTP POST request with URL query parameters.
⭐ Clear the predicted label (class).
⭐ Update the model timer.
```
if((millis() - model_timer > 300000) || !digitalRead(button)){
// Run inference:
run_inference_to_make_predictions(1);
// If the Edge Impulse model predicts an air quality level (class) successfully:
if(predicted_class != -1){
// Create the request string.
String request = "?no2=" + String(air_quality.no2)
+ "&o3=" + String(air_quality.ozone)
+ "&temperature=" + String(air_quality.temperature)
+ "&humidity=" + String(air_quality.humidity)
+ "&wind_speed=" + String(air_quality.wind_speed)
+ "&model_result=" + classes[predicted_class];
// Capture a picture with the OV7725 camera.
take_picture(true);
// Send the obtained data parameters, the recently captured image, and the model detection result to the web application via an HTTP POST request.
make_a_post_request(request);
// Clear the predicted label (class).
predicted_class = -1;
// Update the model timer.
model_timer = millis();
}
}
```
## Step 6: Setting up the Edge Impulse model on FireBeetle ESP32
After building, training, and deploying my model as an Arduino library on Edge Impulse, I needed to upload the generated Arduino library on FireBeetle ESP32 to run the model directly so as to create an easy-to-use and capable air station operating with minimal latency, memory usage, and power consumption.
Since Edge Impulse optimizes and formats signal processing, configuration, and learning blocks into a single package while deploying models as Arduino libraries, I was able to import my model effortlessly to run inferences.
:hash: After downloading the model as an Arduino library in the ZIP file format, go to *Sketch ➡ Include Library ➡ Add .ZIP Library...*
:hash: Then, include the *AI-assisted\_Air\_Quality\_Monitor\_inferencing.h* file to import the Edge Impulse neural network model.
```
#include <AI-assisted_Air_Quality_Monitor_inferencing.h>
```
After importing my model successfully to the Arduino IDE, I programmed FireBeetle ESP32 to run inferences to detect air pollution levels and capture surveillance footage for further examination every 5 minutes. If manual testing is required, FireBeetle ESP32 can also run inference and capture surveillance footage when the built-in button on the FireBeetle media board is pressed.
* User Button (Built-in) ➡ Run Inference
Also, I employed FireBeetle ESP32 to transmit the collected air quality data, the model detection result, and the captured surveillance footage (raw image data) to the web application via an HTTP POST request after running inferences successfully.
You can download the *AIoT\_weather\_station\_run\_model.ino* file to try and inspect the code for running Edge Impulse neural network models and transferring data to a web application via FireBeetle ESP32.
⭐ Include the required libraries.
```
#include <Arduino.h>
#include <WiFi.h>
#include "soc/soc.h"
#include "soc/rtc_cntl_reg.h"
#include "esp_camera.h"
#include "FS.h"
#include "SD_MMC.h"
```
⭐ Define the required parameters to run an inference with the Edge Impulse model.
⭐ Define the features array (buffer) to classify one frame of data.
```
#define FREQUENCY_HZ EI_CLASSIFIER_FREQUENCY
#define INTERVAL_MS (1000 / (FREQUENCY_HZ + 1))
// Define the features array to classify one frame of data.
float features[EI_CLASSIFIER_DSP_INPUT_FRAME_SIZE];
size_t feature_ix = 0;
```
⭐ Define the threshold value (0.60) for the model outputs (predictions).
⭐ Define the air pollution level (class) names:
* Clean
* Risky
* Unhealthy
```
float threshold = 0.60;
// Define the air quality level (class) names:
String classes[] = {"Clean", "Risky", "Unhealthy"};
```
⭐ Define the Wi-Fi network and the web application settings hosted by LattePanda 3 Delta 864.
```
char ssid[] = "<_SSID_>"; // your network SSID (name)
char pass[] = "<_PASSWORD_>"; // your network password (use for WPA, or use as key for WEP)
int keyIndex = 0; // your network key Index number (needed only for WEP)
// Define the server on LattePanda 3 Delta 864.
char server[] = "192.168.1.22";
// Define the web application path.
String application = "/weather_station_data_center/update_data.php";
// Initialize the WiFiClient object.
WiFiClient client; /* WiFiSSLClient client; */
```
⭐ Define the FireBeetle media board pin out to modify the official *esp\_camera* library for the built-in OV7725 camera.
⭐ Define the camera (image) buffer array.
```
// FireBeetle Covers - Camera & Audio Media Board
// https://wiki.dfrobot.com/FireBeetle_Covers-Camera%26Audio_Media_Board_SKU_DFR0498
// Pinout:
#define PWDN_GPIO_NUM -1
#define RESET_GPIO_NUM 0
#define XCLK_GPIO_NUM 21
#define SIOD_GPIO_NUM 26
#define SIOC_GPIO_NUM 27
#define Y9_GPIO_NUM 35
#define Y8_GPIO_NUM 34
#define Y7_GPIO_NUM 39
#define Y6_GPIO_NUM 36
#define Y5_GPIO_NUM 19
#define Y4_GPIO_NUM 18
#define Y3_GPIO_NUM 5
#define Y2_GPIO_NUM 17
#define VSYNC_GPIO_NUM 25
#define HREF_GPIO_NUM 23
#define PCLK_GPIO_NUM 22
// Define the camera (image) buffer array.
camera_fb_t * fb = NULL;
```
⭐ Create a struct including all air quality data items as its elements.
```
struct data {
float temperature;
float humidity;
float no2;
int ozone;
int wind_speed;
};
```
⭐ Disable the brownout detector to avoid system reset errors.
```
WRITE_PERI_REG(RTC_CNTL_BROWN_OUT_REG, 0);
```
⭐ Initialize the hardware serial port (UART2) with redefined pins to communicate with Arduino Mega.
```
Serial2.begin(115200, SERIAL_8N1, RXD, TXD); // (BaudRate, SerialMode, RX_pin, TX_pin)
```
⭐ Initiate the built-in SD card module on the FireBeetle media board.
```
if(!SD_MMC.begin()){
Serial.println("SD Card not detected!\n");
return;
}
Serial.println("SD Card detected successfully!\n");
```
⭐ Define the pin configuration settings of the built-in OV7725 camera on the media board.
```
camera_config_t config;
config.ledc_channel = LEDC_CHANNEL_0;
config.ledc_timer = LEDC_TIMER_0;
config.pin_d0 = Y2_GPIO_NUM;
config.pin_d1 = Y3_GPIO_NUM;
config.pin_d2 = Y4_GPIO_NUM;
config.pin_d3 = Y5_GPIO_NUM;
config.pin_d4 = Y6_GPIO_NUM;
config.pin_d5 = Y7_GPIO_NUM;
config.pin_d6 = Y8_GPIO_NUM;
config.pin_d7 = Y9_GPIO_NUM;
config.pin_xclk = XCLK_GPIO_NUM;
config.pin_pclk = PCLK_GPIO_NUM;
config.pin_vsync = VSYNC_GPIO_NUM;
config.pin_href = HREF_GPIO_NUM;
config.pin_sscb_sda = SIOD_GPIO_NUM;
config.pin_sscb_scl = SIOC_GPIO_NUM;
config.pin_pwdn = PWDN_GPIO_NUM;
config.pin_reset = RESET_GPIO_NUM;
```
⭐ Define the pixel format and the frame size settings.
*FRAMESIZE\_QVGA* (320x240)
```
config.xclk_freq_hz = 20000000;
config.pixel_format = PIXFORMAT_GRAYSCALE;
config.frame_size = FRAMESIZE_QVGA; // FRAMESIZE_96X96, FRAMESIZE_240X240
config.jpeg_quality = 20; // 0-63 lower number means higher quality
config.fb_count = 1;
```
⭐ Since FireBeetle ESP32 does not have SPI memory (PSRAM), disable PSRAM allocation to avoid connection errors.
```
config.fb_location = CAMERA_FB_IN_DRAM;
```
⭐ Initiate the built-in OV7725 camera on the media board.
```
esp_err_t err = esp_camera_init(&config);
if (err != ESP_OK) {
Serial.printf("Camera init failed with error 0x%x", err);
delay(1000);
ESP.restart();
}
Serial.println("Camera initialized successfully!\n");
```
⭐ Initialize the Wi-Fi module.
⭐ Attempt to connect to the given Wi-Fi network.
```
WiFi.mode(WIFI_STA);
WiFi.begin(ssid, pass);
// Attempt to connect to the Wi-Fi network:
while(WiFi.status() != WL_CONNECTED){
// Wait for the connection:
delay(500);
Serial.print(".");
}
// If connected to the network successfully:
Serial.println("Connected to the Wi-Fi network successfully!");
```
⭐ Obtain the data packet and commands transferred by Arduino Mega via serial communication.
```
if(Serial2.available() > 0){
data_packet = Serial2.readString();
}
```
⭐ In the *save\_data\_to\_CSV* function:
⭐ Create a new CSV file on the SD card with the given file name.
⭐ Append the header and the given data items to the generated CSV file.
```
void save_data_to_CSV(const char * file_path, const char * _data, String f_name){
// Create a CSV file on the SD card with the given file name.
File file = SD_MMC.open(file_path, FILE_WRITE);
if(!file){ Serial.println("SD Card: Failed to open the given CSV file!\n"); return; }
// Append the header and the given data items to the generated CSV file.
if(file.print(_data)){ Serial.println("SD Card => Data appended successfully: " + f_name + "\n"); }
else{ Serial.println("SD Card: Data append failed!\n"); }
}
```
⭐ If Arduino Mega sends the *Save* command with the recently collected air quality data and the selected air pollution level:
⭐ Glean information as substrings from the transferred data packet by utilizing the ampersand (&) as the delimiter.
⭐ Increment the sample number of the given level (class) by 1 to create unique samples (CSV files).
⭐ Create a new CSV file under the *samples* folder on the SD card and combine the given air pollution level and the sample number as the file name. Then, append the received air quality data items with the given header to the generated CSV file.
```
if(data_packet != ""){
if(data_packet.startsWith("Save")){
// Glean information as substrings from the transferred data packet by Arduino Mega.
del_1 = data_packet.indexOf("&");
del_2 = data_packet.indexOf("&", del_1 + 1);
String data_record = data_packet.substring(del_1 + 1, del_2);
String level = data_packet.substring(del_2 + 1);
// Increment the sample number of the given level (class) by 1.
int i;
if(level == "Clean") { c_s+=1; i=c_s;}
if(level == "Risky") { r_s+=1; i=r_s;}
if(level == "Unhealthy") { u_s+=1; i=u_s;}
// Save the transferred data record as a sample (CSV file) depending on the given air quality level.
String file_name = "/samples/" + level + ".training.sample_" + String(i) + ".csv";
String line = _header + data_record;
save_data_to_CSV(file_name.c_str(), line.c_str(), file_name);
}
```
⭐ If Arduino Mega sends the *Data* command with the recently collected air quality data items:
⭐ Glean information as substrings from the transferred data packet by utilizing the comma (,) as the delimiter.
⭐ Convert the received data items from strings to their corresponding data types and copy them to the struct as its elements.
⭐ Finally, clear the transferred data packet.
```
if(data_packet.startsWith("Data")){
// Glean information as substrings from the transferred data packet by Arduino Mega.
del_1 = data_packet.indexOf(",");
del_2 = data_packet.indexOf(",", del_1 + 1);
del_3 = data_packet.indexOf(",", del_2 + 1);
del_4 = data_packet.indexOf(",", del_3 + 1);
del_5 = data_packet.indexOf(",", del_4 + 1);
// Convert and store the received data items.
air_quality.no2 = data_packet.substring(del_1 + 1, del_2).toFloat();
air_quality.ozone = data_packet.substring(del_2 + 1, del_3).toInt();
air_quality.temperature = data_packet.substring(del_3 + 1, del_4).toFloat();
air_quality.humidity = data_packet.substring(del_4 + 1, del_5).toFloat();
air_quality.wind_speed = data_packet.substring(del_5 + 1).toInt();
Serial.println("\nData parameters obtained and saved successfully!\n");
}
// Clear the incoming data packet.
delay(1000);
data_packet = "";
}
```
⭐ In the *run\_inference\_to\_make\_predictions* function:
⭐ Scale (normalize) the collected data depending on the given model and copy the scaled data items to the features array (buffer).
⭐ If required, multiply the scaled data items while copying them to the features array (buffer).
⭐ Display the progress of copying data to the features buffer on the serial monitor.
⭐ If the features buffer is full, create a signal object from the features buffer (frame).
⭐ Then, run the classifier.
⭐ Print the inference timings on the serial monitor.
⭐ Obtain the prediction (detection) result for each given label and print them on the serial monitor.
⭐ The detection result greater than the given threshold (0.60) represents the most accurate label (air pollution level) predicted by the model.
⭐ Print the detected anomalies on the serial monitor, if any.
⭐ Finally, clear the features buffer (frame).
```
void run_inference_to_make_predictions(int multiply){
// Scale (normalize) data items depending on the given model:
float scaled_no2 = air_quality.no2;
float scaled_ozone = float(air_quality.ozone);
float scaled_temperature = air_quality.temperature;
float scaled_humidity = air_quality.humidity;
float scaled_wind_speed = float(air_quality.wind_speed);
// Copy the scaled data items to the features buffer.
// If required, multiply the scaled data items while copying them to the features buffer.
for(int i=0; i<multiply; i++){
features[feature_ix++] = scaled_no2;
features[feature_ix++] = scaled_ozone;
features[feature_ix++] = scaled_temperature;
features[feature_ix++] = scaled_humidity;
features[feature_ix++] = scaled_wind_speed;
}
// Display the progress of copying data to the features buffer.
Serial.print("Features Buffer Progress: "); Serial.print(feature_ix); Serial.print(" / "); Serial.println(EI_CLASSIFIER_DSP_INPUT_FRAME_SIZE);
// Run inference:
if(feature_ix == EI_CLASSIFIER_DSP_INPUT_FRAME_SIZE){
ei_impulse_result_t result;
// Create a signal object from the features buffer (frame).
signal_t signal;
numpy::signal_from_buffer(features, EI_CLASSIFIER_DSP_INPUT_FRAME_SIZE, &signal);
// Run the classifier:
EI_IMPULSE_ERROR res = run_classifier(&signal, &result, false);
ei_printf("\nrun_classifier returned: %d\n", res);
if(res != 0) return;
// Print the inference timings on the serial monitor.
ei_printf("Predictions (DSP: %d ms., Classification: %d ms., Anomaly: %d ms.): \n",
result.timing.dsp, result.timing.classification, result.timing.anomaly);
// Obtain the prediction results for each label (class).
for(size_t ix = 0; ix < EI_CLASSIFIER_LABEL_COUNT; ix++){
// Print the prediction results on the serial monitor.
ei_printf("%s:\t%.5f\n", result.classification[ix].label, result.classification[ix].value);
// Get the predicted label (class).
if(result.classification[ix].value >= threshold) predicted_class = ix;
}
Serial.print("\nPredicted Class: "); Serial.println(predicted_class);
// Detect anomalies, if any:
#if EI_CLASSIFIER_HAS_ANOMALY == 1
ei_printf("Anomaly : \t%.3f\n", result.anomaly);
#endif
// Clear the features buffer (frame):
feature_ix = 0;
}
}
```
⭐ In the *take\_picture* function:
⭐ Release the image buffer to avoid FireBeetle ESP32 from throwing memory allocation errors while capturing pictures sequentially.
⭐ Capture a picture with the built-in OV7725 camera on the FireBeetle media board and save it to the image buffer.
```
void take_picture(bool _abort){
// Release the image buffer if the board throws memory allocation errors.
if(_abort) esp_camera_fb_return(fb);
// Capture a picture with the OV7725 camera.
fb = esp_camera_fb_get();
// If successful:
if(!fb) {
Serial.println("\nImage capture failed!");
delay(1000);
ESP.restart();
}
Serial.print("\nImage captured successfully: "); Serial.println(fb->len);
delay(500);
}
```
⭐ In the *make\_a\_post\_request* function:
⭐ Connect to the web application named *weather\_station\_data\_center*.
⭐ Create the *query* string and add the latest received air quality data items with the model detection result to the string as URL query (GET) parameters.
⭐ Define the boundary parameter named *EnvNotification* so as to send the captured raw image data as a TXT file to the web application.
⭐ Get the total content length.
⭐ Set the *Connection* HTTP header as *Keep-Alive*.
⭐ Make an HTTP POST request with the created query string to the web application in order to transfer the captured raw image data as a TXT file.
⭐ Release the image buffer.
```
void make_a_post_request(String request){
// Connect to the web application named weather_station_data_center. Change '80' with '443' if you are using SSL connection.
if (client.connect(server, 80)){
// If successful:
Serial.println("\nConnected to the web application successfully!\n");
// Create the query string:
String query = application + request;
// Make an HTTP POST request:
String head = "--EnvNotification\r\nContent-Disposition: form-data; name=\"captured_image\"; filename=\"new_image.txt\"\r\nContent-Type: text/plain\r\n\r\n";
String tail = "\r\n--EnvNotification--\r\n";
// Get the total message length.
uint32_t totalLen = head.length() + fb->len + tail.length();
// Start the request:
client.println("POST " + query + " HTTP/1.1");
client.println("Host: 192.168.1.22");
client.println("Content-Length: " + String(totalLen));
client.println("Connection: Keep-Alive");
client.println("Content-Type: multipart/form-data; boundary=EnvNotification");
client.println();
client.print(head);
client.write(fb->buf, fb->len);
client.print(tail);
// Release the image buffer.
esp_camera_fb_return(fb);
delay(2000);
// If successful:
Serial.println("HTTP POST => Data transfer completed!\n");
}else{
Serial.println("\nConnection failed to the web application!\n");
delay(2000);
}
}
```
⭐ Every 5 minutes or when the built-in button on the media board is pressed:
⭐ Start running an inference with the Edge Impulse model to make predictions on the air pollution levels (classes).
⭐ If the Edge Impulse model predicts an air quality level (class) successfully:
⭐ Create the *request* string consisting of the latest received air quality data items and the detected air pollution class.
⭐ Capture a picture with the built-in OV7725 camera on the media board.
⭐ Send the air quality data items, the model detection result, and the recently captured raw image as a TXT file to the web application via an HTTP POST request with URL query parameters.
⭐ Clear the predicted label (class).
⭐ Update the model timer.
```
if((millis() - model_timer > 300000) || !digitalRead(button)){
// Run inference:
run_inference_to_make_predictions(1);
// If the Edge Impulse model predicts an air quality level (class) successfully:
if(predicted_class != -1){
// Create the request string.
String request = "?no2=" + String(air_quality.no2)
+ "&o3=" + String(air_quality.ozone)
+ "&temperature=" + String(air_quality.temperature)
+ "&humidity=" + String(air_quality.humidity)
+ "&wind_speed=" + String(air_quality.wind_speed)
+ "&model_result=" + classes[predicted_class];
// Capture a picture with the OV7725 camera.
take_picture(true);
// Send the obtained data parameters, the recently captured image, and the model detection result to the web application via an HTTP POST request.
make_a_post_request(request);
// Clear the predicted label (class).
predicted_class = -1;
// Update the model timer.
model_timer = millis();
}
}
```
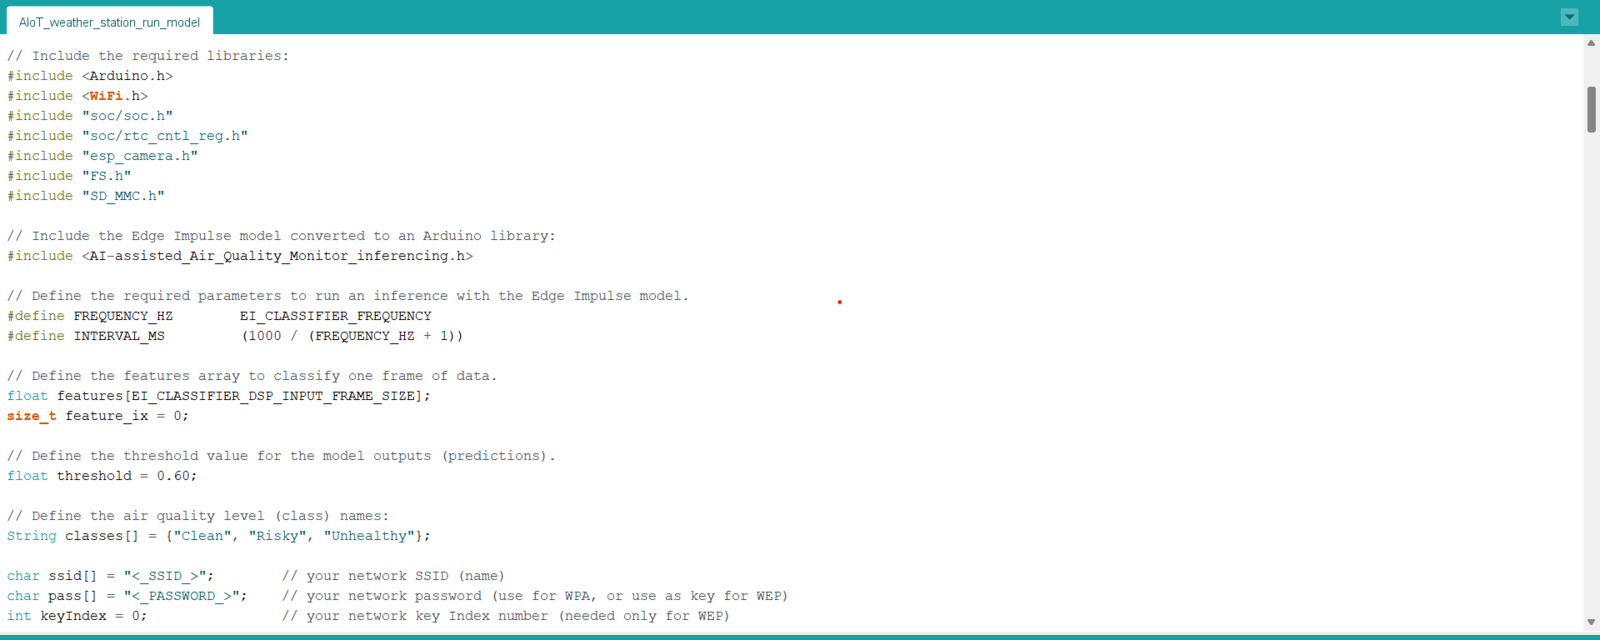
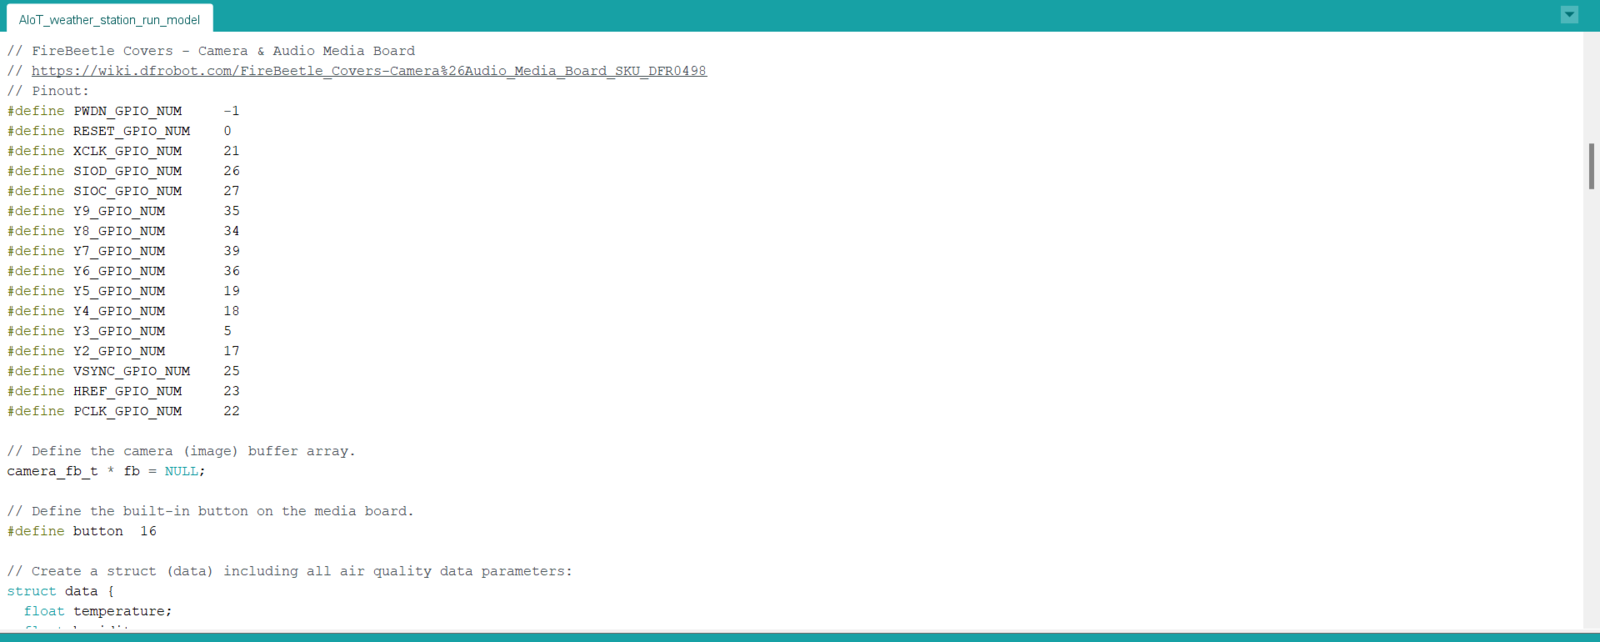
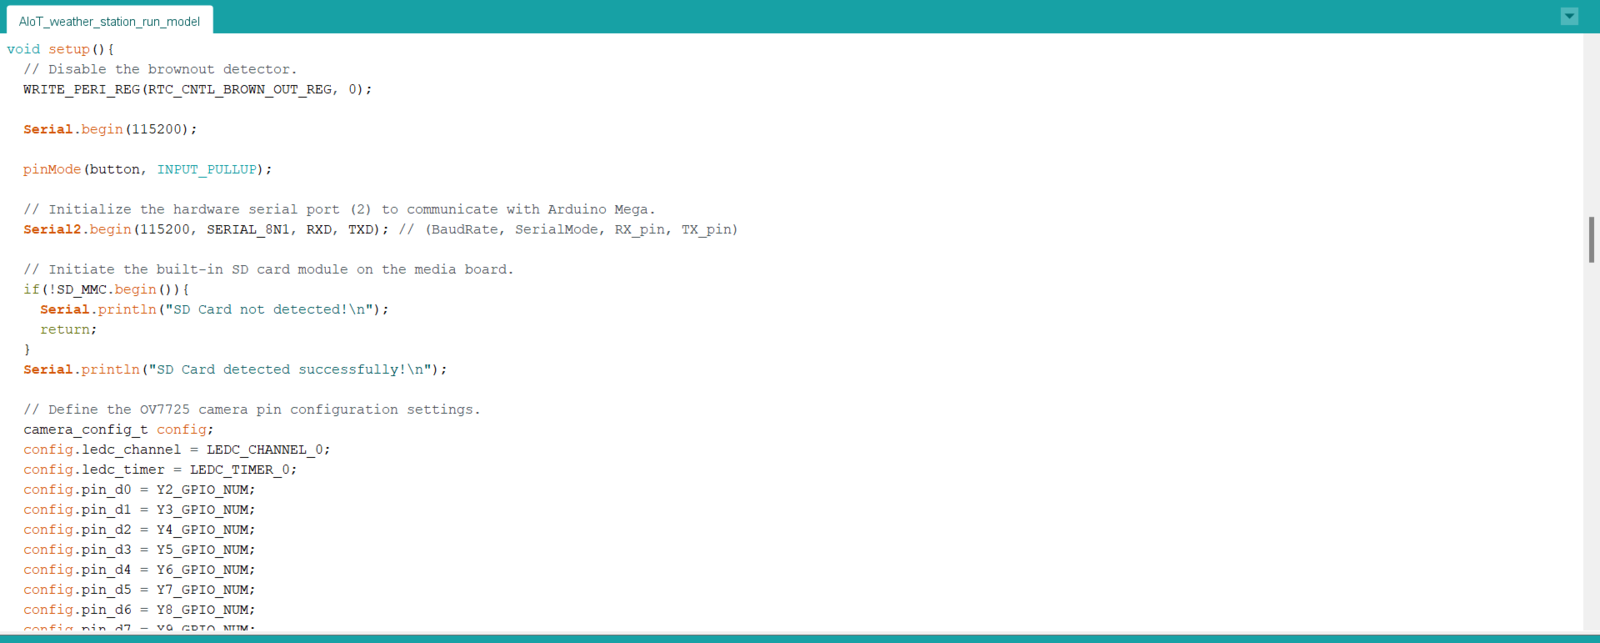
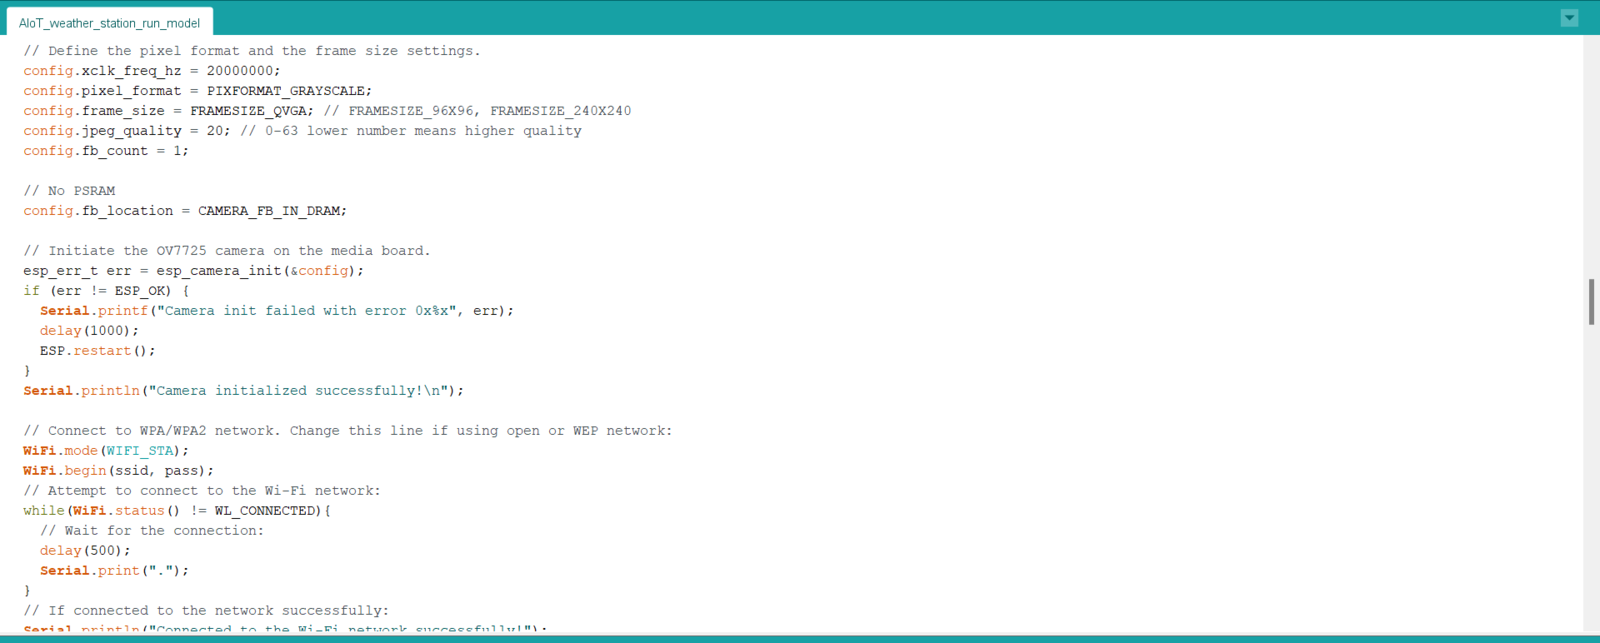
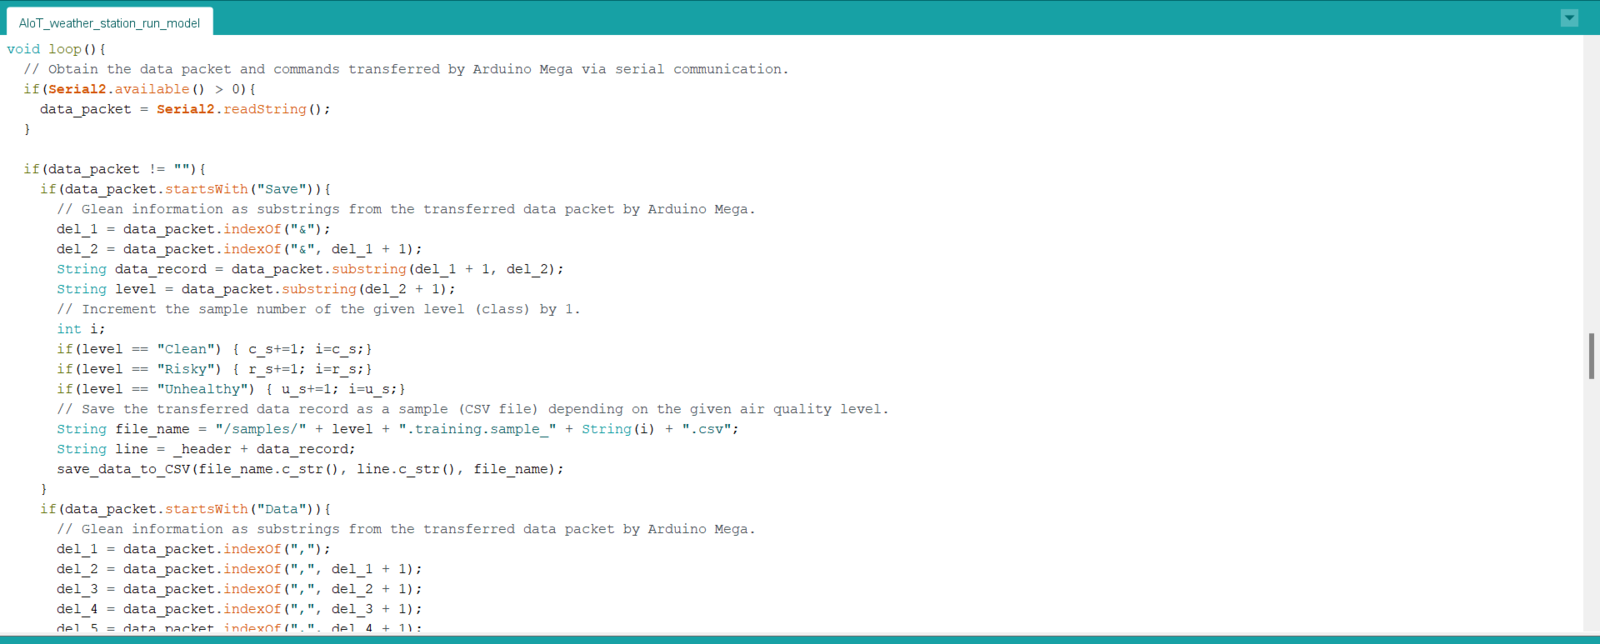
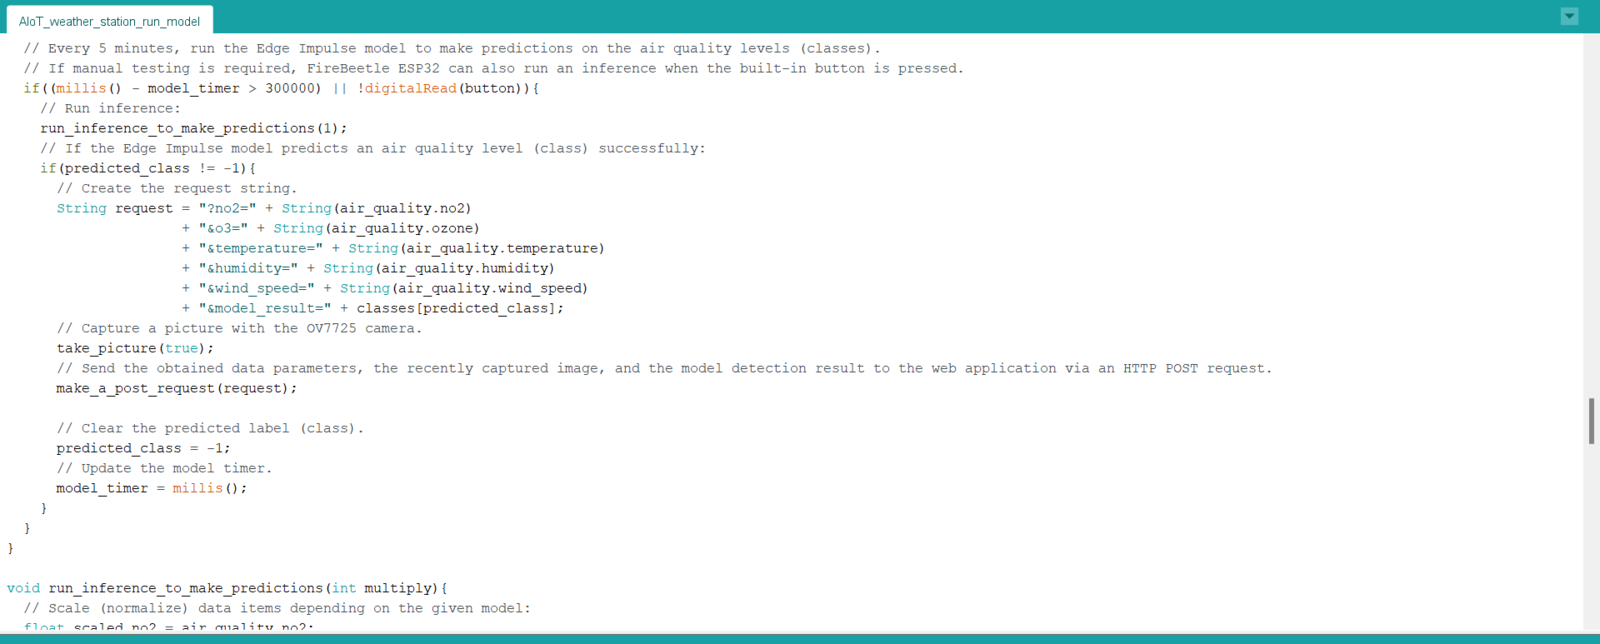
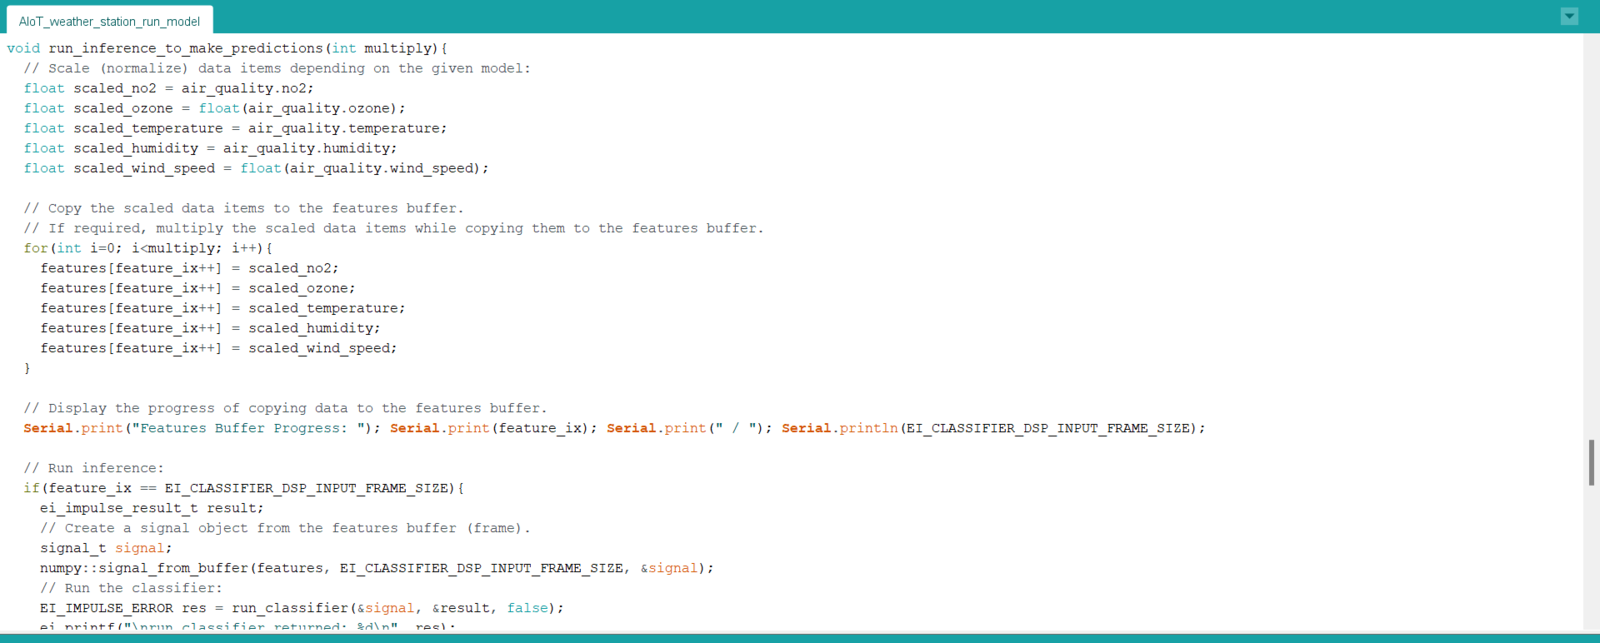
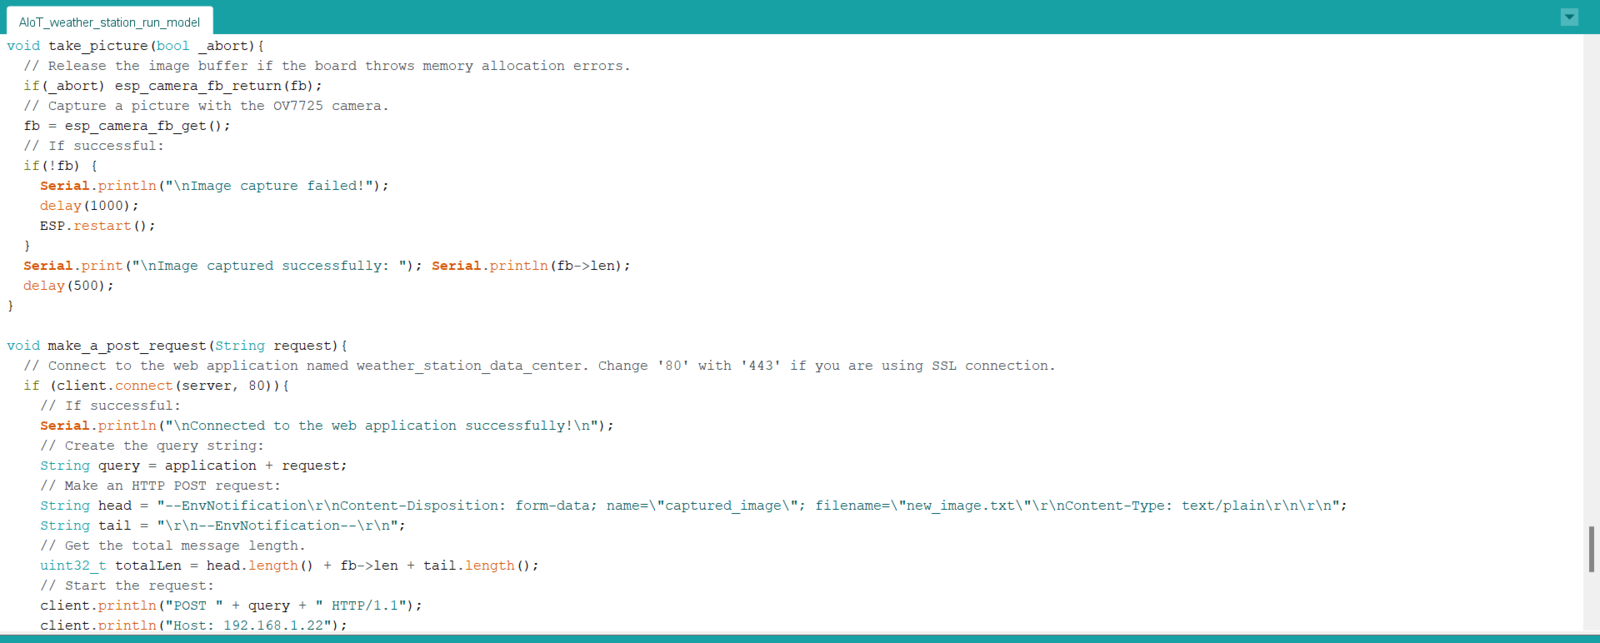
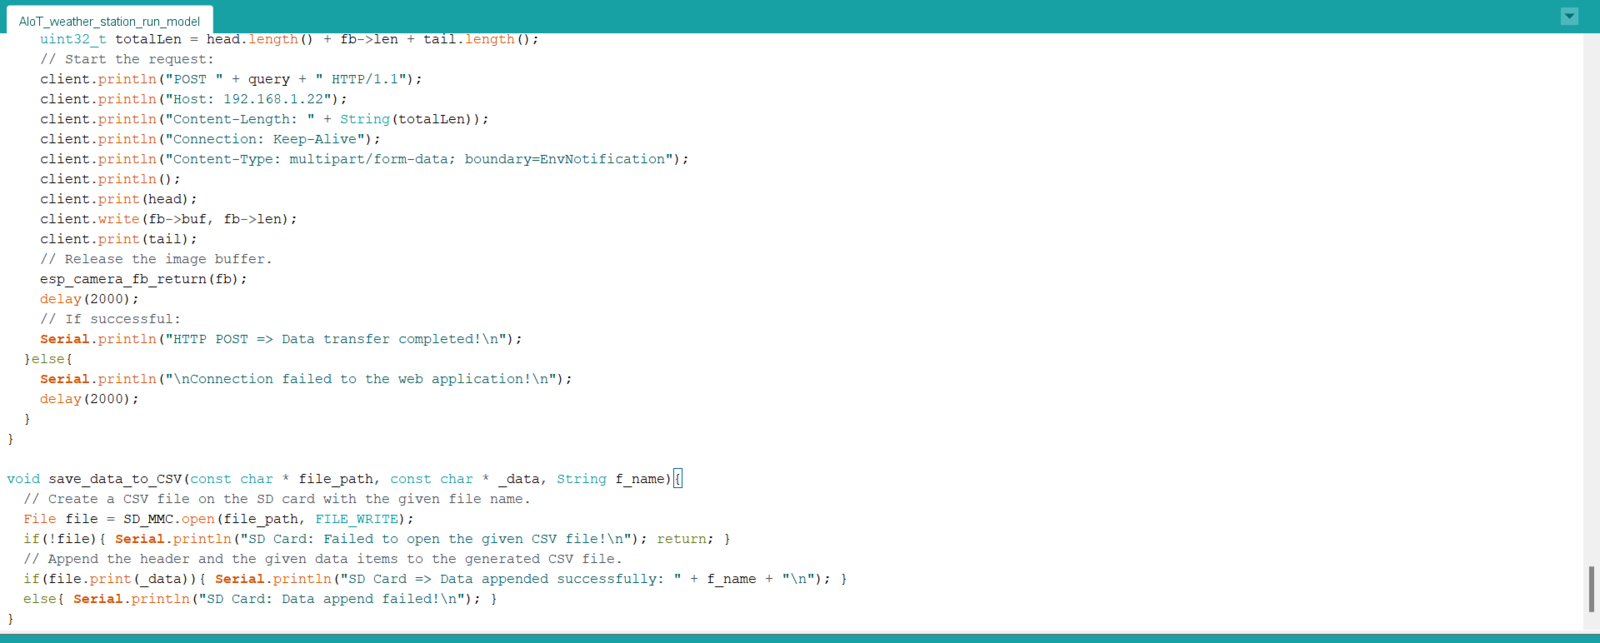 ## Step 7: Running the model on FireBeetle ESP32 to forecast air pollution levels and transferring the model results w/ surveillance footage via POST requests
My Edge Impulse neural network model predicts possibilities of labels (air pollution classes) for the given features buffer as an array of 3 numbers. They represent the model's *"confidence"* that the given features buffer corresponds to each of the three different air pollution levels (classes) \[0 - 2], as shown in Step 5:
* 0 — Clean
* 1 — Risky
* 2 — Unhealthy
After executing the *AIoT\_weather\_station\_run\_model.ino* file on FireBeetle ESP32:
🎈⚠️📲 When FireBeetle ESP32 receives the latest collected air quality data parameters from Arduino Mega via serial communication, it stores them to run an inference with accurate data items.
🎈⚠️📲 After Arduino Mega sends the air quality data parameters via serial communication successfully, the air station turns the RGB LED to magenta.
## Step 7: Running the model on FireBeetle ESP32 to forecast air pollution levels and transferring the model results w/ surveillance footage via POST requests
My Edge Impulse neural network model predicts possibilities of labels (air pollution classes) for the given features buffer as an array of 3 numbers. They represent the model's *"confidence"* that the given features buffer corresponds to each of the three different air pollution levels (classes) \[0 - 2], as shown in Step 5:
* 0 — Clean
* 1 — Risky
* 2 — Unhealthy
After executing the *AIoT\_weather\_station\_run\_model.ino* file on FireBeetle ESP32:
🎈⚠️📲 When FireBeetle ESP32 receives the latest collected air quality data parameters from Arduino Mega via serial communication, it stores them to run an inference with accurate data items.
🎈⚠️📲 After Arduino Mega sends the air quality data parameters via serial communication successfully, the air station turns the RGB LED to magenta.
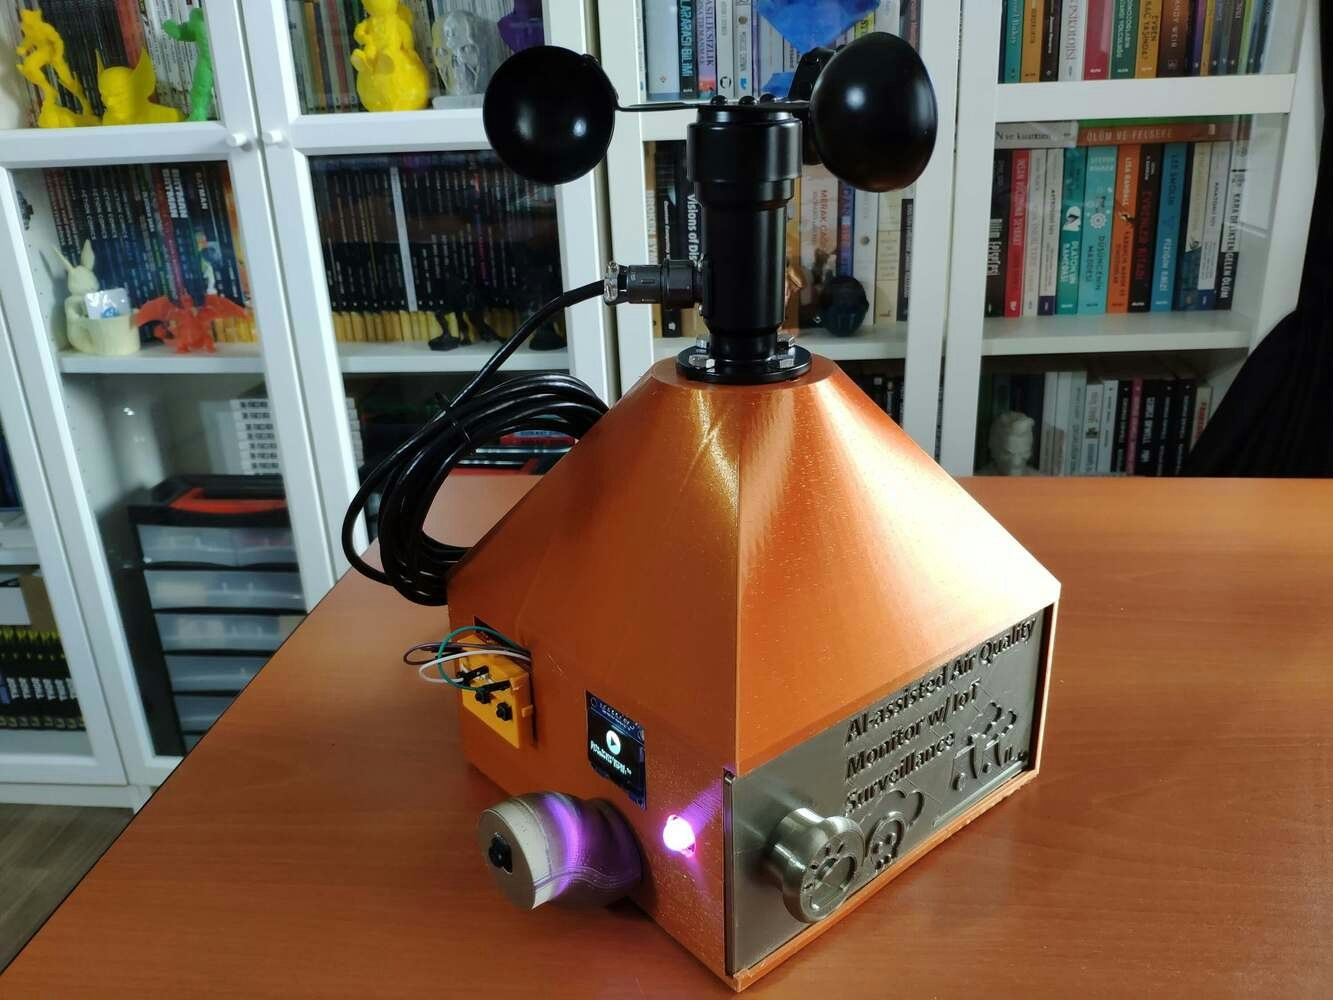
🎈⚠️📲 Every 5 minutes, the air station runs an inference with the Edge Impulse neural network model by applying the stored air quality data parameters to predict the air pollution level and captures surveillance footage with the OV7725 camera.
🎈⚠️📲 Then, it transfers the stored air quality data parameters, the model detection result, and the captured surveillance footage (raw image data) as a TXT file to the web application via an HTTP POST request with URL query parameters.
🎈⚠️📲 If manual testing is required, the air station can also perform the mentioned sequence when the built-in button on the FireBeetle media board is pressed.
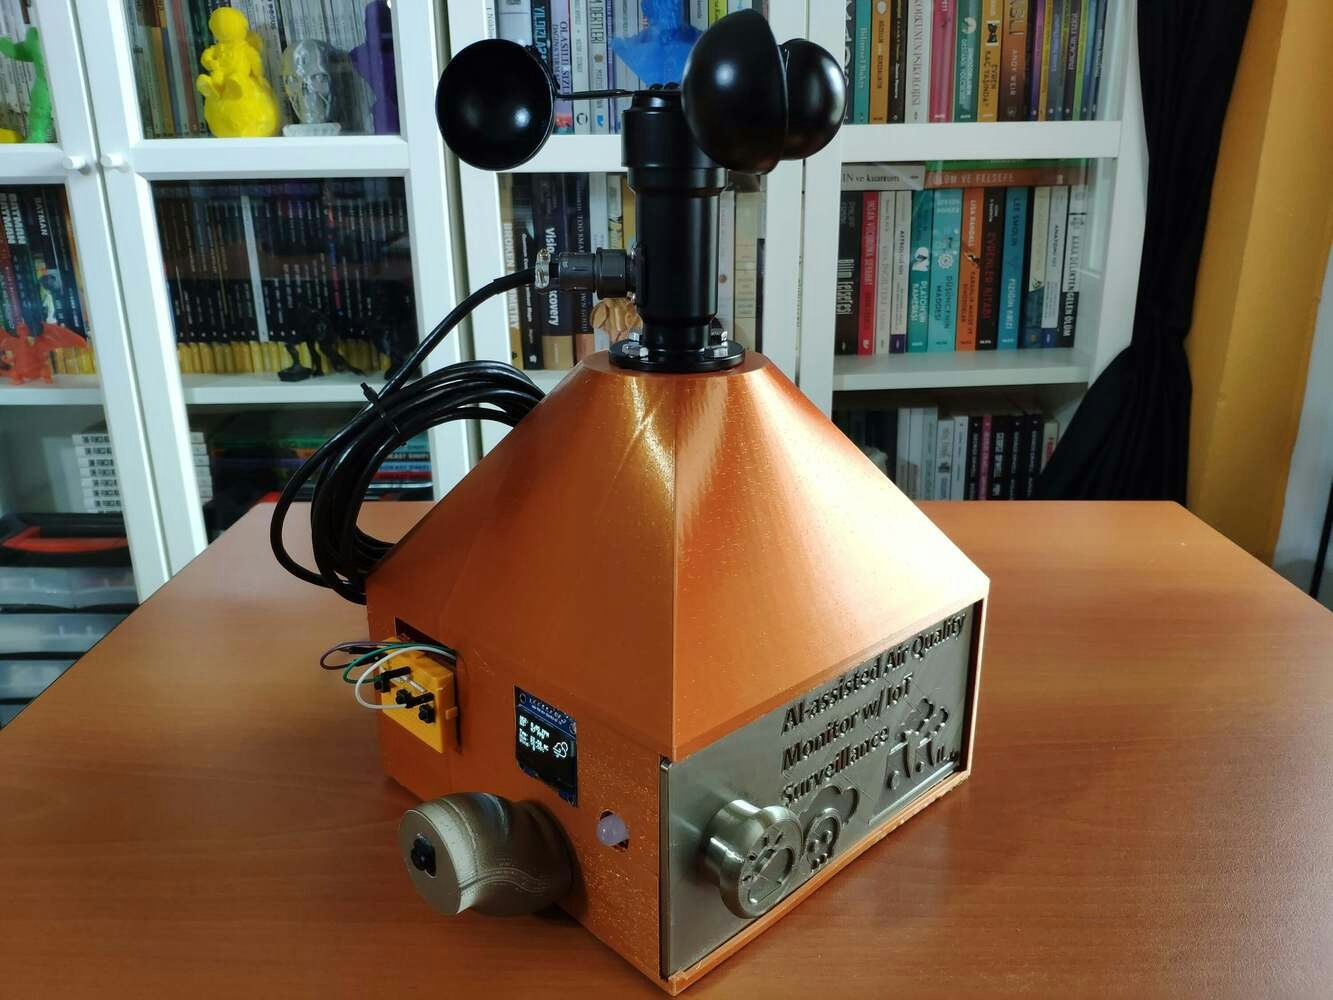 🎈⚠️📲 Also, the air station prints notifications and model detection results on the serial monitor for debugging.
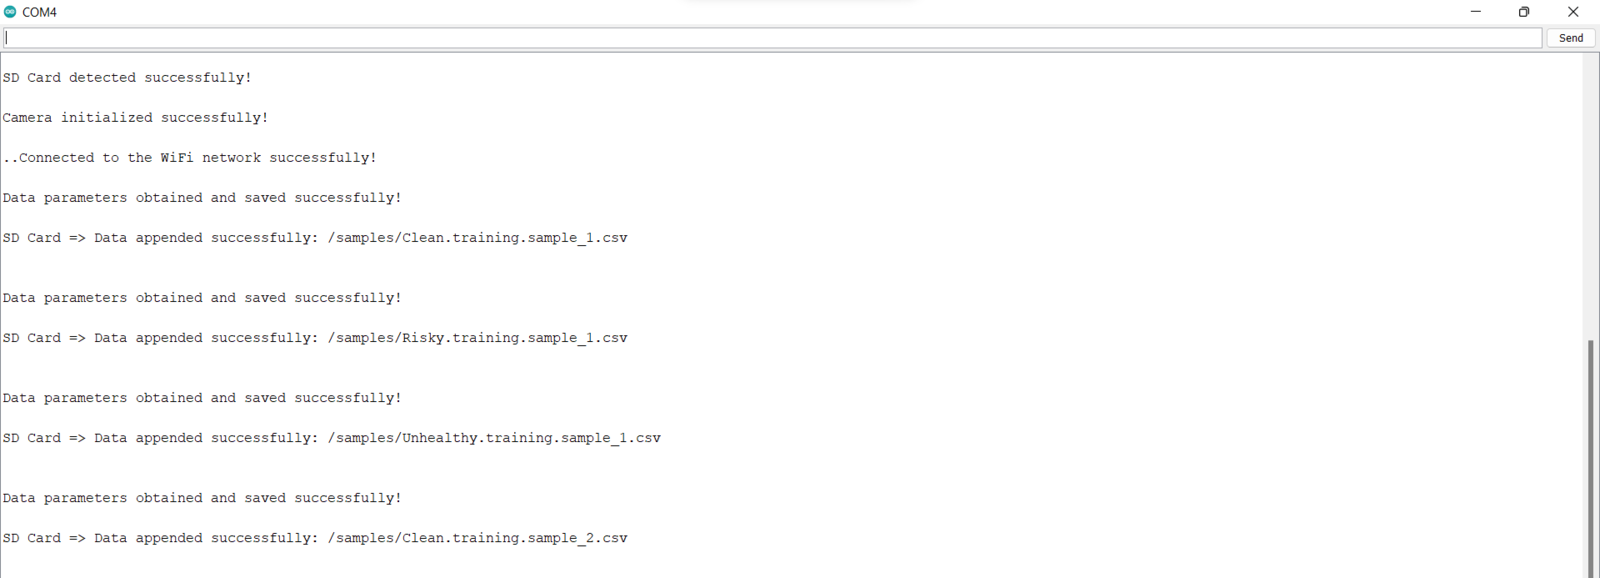
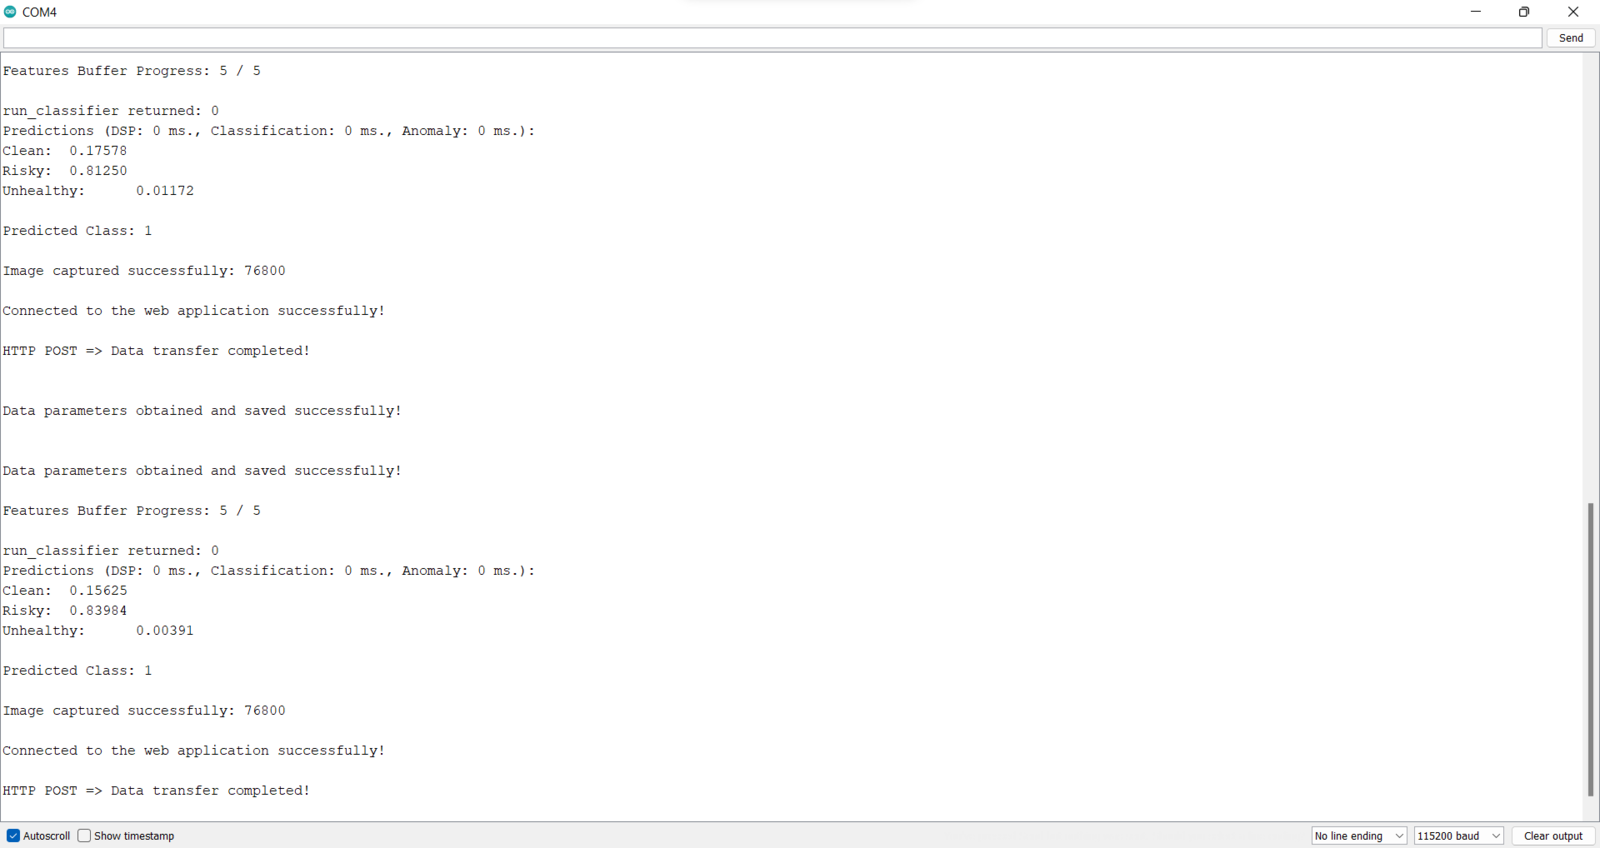 As far as my experiments go, the air station detects air pollution levels precisely, captures real-time surveillance footage, and communicates with the web application faultlessly :)
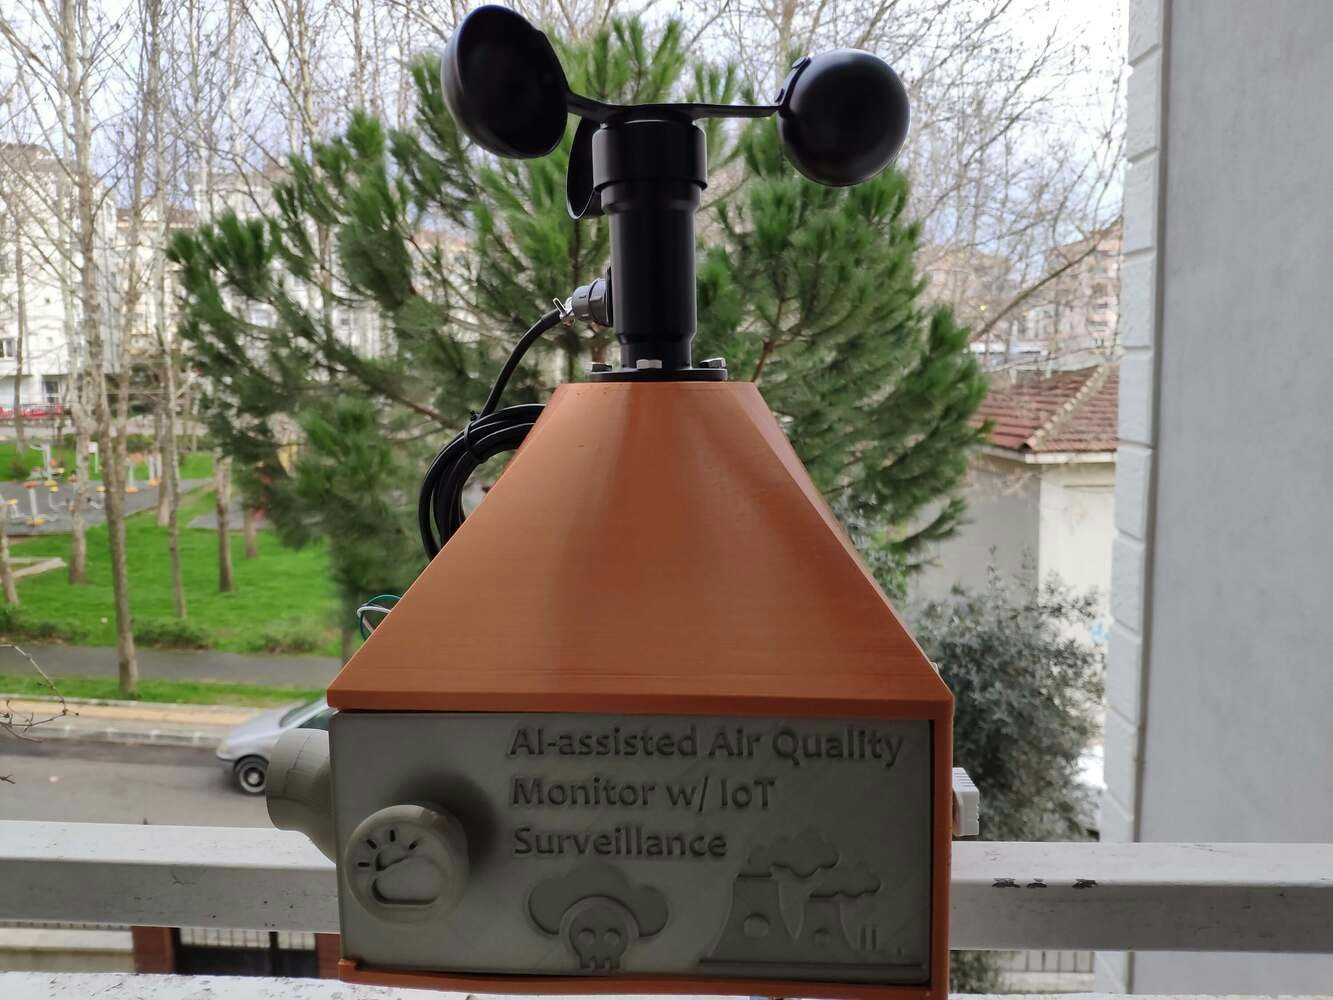
## Videos and Conclusion
[Data collection | AI-assisted Air Quality Monitor w/ IoT Surveillance](https://youtu.be/J7n-amPOMTM)
[Experimenting with the model | AI-assisted Air Quality Monitor w/ IoT Surveillance](https://youtu.be/SjNFPdxsJog)
## Further Discussions
By applying neural network models trained on air quality data in detecting air pollution levels, we can achieve to:
🎈⚠️📲 prevent human-made air pollutants from harming the respiratory system,
🎈⚠️📲 reduce the risk of increased asthma attacks and cardiovascular harm,
🎈⚠️📲 protect people with lung diseases from severe symptoms of air pollution,
🎈⚠️📲 provide prescient warnings regarding a surge in photochemical oxidant reactions and transmission rates.
## References
\[^1] Jarvis DJ, Adamkiewicz G, Heroux ME, et al, *Nitrogen dioxide*, WHO Guidelines for Indoor Air Quality: Selected Pollutants, Geneva: World Health Organization, 2010. 5, *[https://www.ncbi.nlm.nih.gov/books/NBK138707/](https://www.ncbi.nlm.nih.gov/books/NBK138707/)*
\[^2] *Nitrogen Dioxide*, The American Lung Association, *[https://www.lung.org/clean-air/outdoors/what-makes-air-unhealthy/nitrogen-dioxide](https://www.lung.org/clean-air/outdoors/what-makes-air-unhealthy/nitrogen-dioxide)*
\[^3] *Ground-level Ozone Basics*, United States Environmental Protection Agency (EPA), *[https://www.epa.gov/ground-level-ozone-pollution/ground-level-ozone-basics](https://www.epa.gov/ground-level-ozone-pollution/ground-level-ozone-basics)*
\[^4] *Health Effects of Ozone Pollution*, United States Environmental Protection Agency (EPA), *[https://www.epa.gov/ground-level-ozone-pollution/health-effects-ozone-pollution](https://www.epa.gov/ground-level-ozone-pollution/health-effects-ozone-pollution)*